Does Extract of Pleurotus sajor-caju affect Liver Enzymes ...
Research Article
Metabolic reprogramming of fibro/adipogenicprogenitors facilitates muscle regenerationAlessio Reggio1,* , Marco Rosina1,* , Natalie Krahmer4, Alessandro Palma1 , Lucia Lisa Petrilli1 , Giuliano Maiolatesi1,Giorgia Massacci1 , Illari Salvatori2 , Cristiana Valle2,3 , Stefano Testa1, Cesare Gargioli1 , Claudia Fuoco1 ,Luisa Castagnoli1, Gianni Cesareni1,2 , Francesca Sacco1
In Duchenne muscular dystrophy (DMD), the absence of the dys-trophin protein causes a variety of poorly understood secondaryeffects. Notably, muscle fibers of dystrophic individuals are char-acterized by mitochondrial dysfunctions, as revealed by a reducedATP production rate and by defective oxidative phosphorylation.Here, we show that in a mouse model of DMD (mdx), fibro/adipogenic progenitors (FAPs) are characterized by a dysfunc-tional mitochondrial metabolism which correlates with increasedadipogenic potential. Using high-sensitivity mass spectrometry–based proteomics, we report that a short-term high-fat diet (HFD)reprograms dystrophic FAP metabolism in vivo. By combining ourproteomic dataset with a literature-derived signaling network, werevealed that HFD modulates the β-catenin–follistatin axis. Thesechanges are accompanied by significant amelioration of the his-tological phenotype in dystrophic mice. Transplantation of purifiedFAPs from HFD-fed mice into the muscles of dystrophic recipientsdemonstrates that modulation of FAP metabolism can be func-tional to ameliorate the dystrophic phenotype. Our study sup-ports metabolic reprogramming of muscle interstitial progenitorcells as a novel approach to alleviate some of the adverse out-comes of DMD.
DOI 10.26508/lsa.202000660 | Received 27 January 2020 | Accepted 28January 2020 | Published online 04 February 2020
Introduction
The interaction between the dystrophin protein and the dystrophin-associated protein complex (DAPC), which spans the sarcolemmalmembrane, is essential for the integrity of the muscle fibers (Petrofet al, 1993). Dystrophin deficiency and the ensuing decrease ofthe DAPC components in Duchenne muscular dystrophy (DMD) pa-tients (Emery, 1998) dramatically increases myofiber fragility uponmuscle contraction and affects calcium and sodium homeostasis(Ohlendieck & Campbell, 1991; Petrof et al, 1993). Over time, chronic
muscle damage culminates in the failure of the regenerationprocess leading to patient paralysis and, finally, death (Emery,1998).
In addition, dystrophin deficiency also causes a variety of poorlyunderstood secondary effects, mostly related to mitochondrialdysfunctions in myofibers. Muscles of DMD patients and animalmodels have a reduced oxygen consumption, spare capacity, andmitochondrial complex I activity (Percival et al, 2012; Schuh et al,2012; Rybalka et al, 2014). Consistently, mitochondrial enzymes ofthe tricarboxylic acid cycle (TCA) (Lindsay et al, 2018) and of theelectron transport chain (Rybalka et al, 2014) are also significantlydecreased. These functional defects correlate with mitochondrialstructural abnormalities. Dense and dilated mitochondria withaltered cristae as well as swollen mitochondria have been de-scribed in muscle fibers of DMD patients (Rybalka et al, 2014).
Altogether, these and additional evidences implicate a meta-bolic impairment in the dystrophic disease development andprogression (Rodrıguez-Cruz et al, 2015). Whether a causal linkbetween the metabolic alterations and the pathological phenotypeexists remains to be established.
To counteract these metabolic alterations, different nutritionalapproaches have been proposed, with the aim of restoring mito-chondrial functionality and muscle regeneration. A reduced caloricintake or a periodic fasting-mimicking diet were shown to stimulateregeneration of different organs, including skeletal muscle, inhumans and mice (Civitarese et al, 2007; Cerletti et al, 2012;Brandhorst et al, 2015). A short-term caloric restriction enhancesmuscle satellite cells (MuSCs) functionality, promoting muscleregeneration upon acute muscle injury in mice (Cerletti et al, 2012).At the molecular level, the AMPK-SIRT1-PGC-1α axis plays a crucialrole in mediating the diet-dependent increase of muscle regen-eration. Consistently, pharmacological activation of AMPK by sir-tuin1, resveratrol, metformin, or AICAR was shown to mitigate thedystrophic phenotype in themdxmouse model of DMD (Pauly et al,2012; Ljubicic & Jasmin, 2015; Hafner et al, 2016; Juban et al, 2018). A
1Department of Biology, University of Rome Tor Vergata, Rome, Italy 2Fondazione Santa Lucia Istituto di Ricovero e Cura a Carattere Scientifico (IRCCS), Rome, Italy3Institute of Translational Pharmacology, Consiglio Nazionale delle Ricerche (CNR), Rome, Italy 4Department Proteomics and Signal Transduction, Max-Planck Institute ofBiochemistry, Martinsried, Germany
Correspondence: [email protected]; [email protected]; [email protected]*Alessio Reggio and Marco Rosina contributed equally to this work
© 2020 Rosina et al. https://doi.org/10.26508/lsa.202000660 vol 3 | no 3 | e202000646 1 of 24
on 19 May, 2020life-science-alliance.org Downloaded from http://doi.org/10.26508/lsa.202000660Published Online: 4 February, 2020 | Supp Info:
fat-enriched diet regimen was also considered as a life-stylestrategy to revert the metabolic impairment of DMD. Dystrophicmice fed for 16-wk with a high-fat diet (HFD) achieved an increasedrunning ability accompanied by a reduction of myofiber necrosiswithout significant weight gain (Radley-Crabb et al, 2011). In ad-dition, a variety of nutritional approaches based on amino acidsupplementation have also been shown to have beneficial effectson muscle regeneration in dystrophic mouse models (Passaquinet al, 2002; Voisin et al, 2005; Barker et al, 2017; Banfi et al, 2018).Such positive effects suggest an impact of muscle metabolism andmuscle homeostasis and physiology.
The skeletal muscle is a heterogeneous tissue and its regen-eration after acute or chronic damage is governed by a complexinterplay between muscle-resident and circulating cell pop-ulations that in concert contribute to damage resolution (Arnoldet al, 2007; Christov et al, 2007; Dellavalle et al, 2011; Murphy et al,2011).
MuSCs are the main stem progenitor cells directly responsiblefor the formation of new myofibers (Seale et al, 2004; Lepper et al,2011; Sambasivan et al, 2011). However, fibro/adipogenic progeni-tors (FAPs), a muscle-resident interstitial stem cell population ofmesenchymal origin (Vallecillo Garcia et al, 2017), are also involvedin muscle regeneration (Murphy et al, 2011). FAPs play a double-edged role. In healthy conditions, they promote muscle regener-ation by establishing crucial trophic interactions with MuSCs (Joeet al, 2010; Uezumi et al, 2010; Murphy et al, 2011), whereas in the latestages of the dystrophic pathology, they differentiate into fibro-blasts and adipocytes. As a result, fibrotic scars and fat infiltratescompromise muscle structure and function (Uezumi et al, 2011). Weconsidered whether any of these progenitor cell types, similarly tomyofibers, have an altered metabolism that affects their function indystrophic patients.
We have recently applied high-resolution mass spectrometry(MS)–based proteomics to characterize the changes in the FAPproteome upon acute (cardiotoxin) or chronic injury (Marinkovicet al, 2019). This unbiased strategy revealed that FAPs from mdxmice are also characterized by a significant reduction ofmitochondrialmetabolic enzymes, accompanied by an increased expression ofglycolytic proteins (Marinkovic et al, 2019). Here, we demonstrate thatthe impaired mitochondrial metabolism of dystrophic FAPs correlateswith their ability to proliferate and differentiate into adipocytes.Remarkably, in vitro metabolic reprogramming of dystrophic FAPsmodulates their adipogenic potential.
As lipid-rich diets have a positive effect on the DMD phenotype,we investigated the effects of in vivo metabolic reprogramming ondystrophic FAP and MuSC biology. By applying an unbiased MS-based proteomic approach, here we show that HFD not only re-stores mitochondrial functionality in FAPs from dystrophic mice butalso rewires key signaling networks and protein complexes. Ourstudy reveals an unexpected connection between FAP metabolicreprogramming and their ability to promote the myogenic potentialof MuSCs. The integration of our proteome-wide analysis with aliterature-derived signaling network identifies β-catenin as acrucial regulator of the expression of the promyogenic factor fol-listatin. In summary, our study reveals that in vivo metabolicreprogramming of mdx FAPs correlates with a significant amelio-ration of the dystrophic phenotype, endorsing nutritional intervention
as a promising supportive approach in the treatment of musculardystrophies.
Results
FAPs and MuSCs from dystrophic muscles have mitochondrialdysfunction and mainly rely on glycolysis to generate ATP
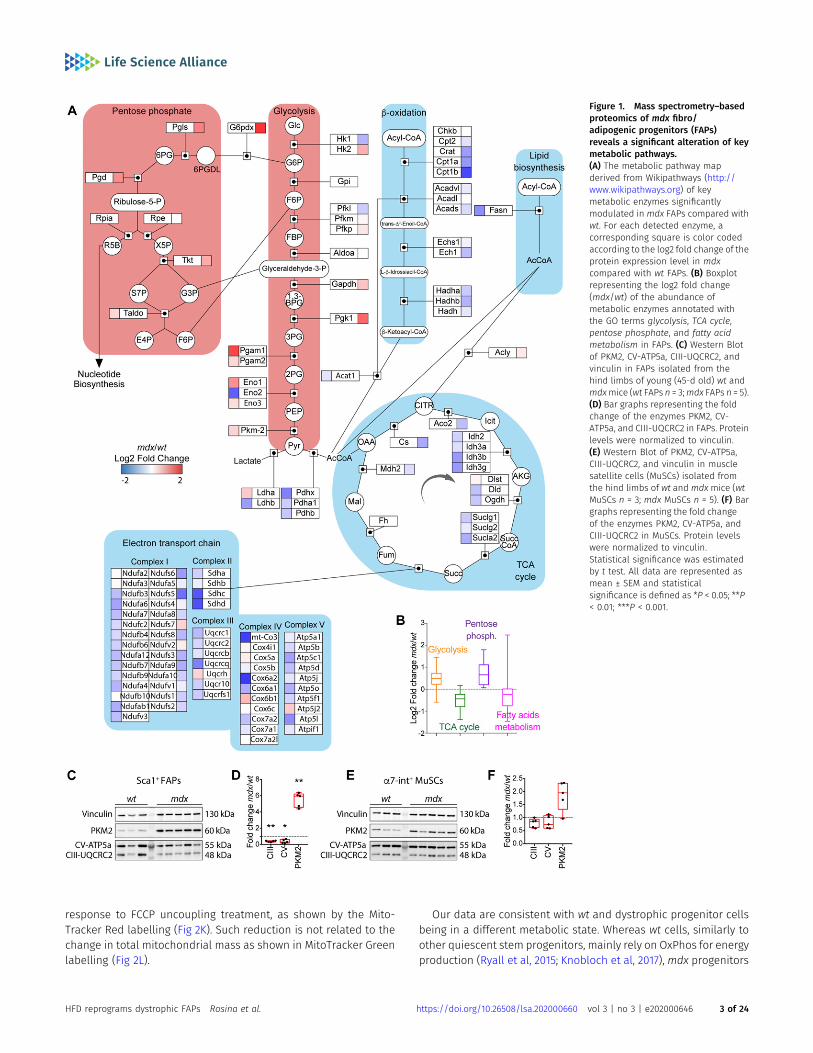
Recently, we have applied MS-based proteomic approach to elu-cidate the mechanisms underlying the different sensitivity ofdystrophic FAPs to the Neurogenic locus notch homolog protein(NOTCH)-dependent adipogenesis (Marinkovic et al, 2019). Here, wedissected the proteomic dataset focusing on the expression levelsof key metabolic enzymes. We found that most of the key enzymesinvolved in fatty acid metabolism, TCA cycle, and oxidative phos-phorylation (OxPhos) are significantly down-regulated in dystro-phic as compared with wild-type (wt) FAPs (Fig 1A and B). Conversely,many of the enzymes of the glycolytic and the pentose phosphatepathways are up-regulated (Fig 1A and B), suggesting an increasedanabolic metabolism in mdx FAPs. To confirm and extend theseobservations, we collected highly pure preparations of Ly6A+ (Sca1+)FAPs and ITGA7+ MuSCs from wild-type (wt) and dystrophic (mdx)mice, via magnetic bead cell sorting (Marinkovic et al, 2019; Reggioet al, 2019b). Sca1+ FAPs and ITGA7+ MuSCs express their distinctivemarkers PDGFRα and Pax7, respectively (Fig S1A–C).
To validate the conclusions drawn from the unbiased massspectrometry dataset, we monitored the level of crucial meta-bolic enzymes. The key glycolytic and pro-anabolic enzymepyruvate kinase M2 (PKM2) (Mazurek, 2011) is significantly in-creased in dystrophic FAPs (approximately fivefold) (Fig 1C andD) and to a lesser extent in dystrophic MuSCs (Fig 1E and F). Inparallel, we also observed a significant reduction of mito-chondrial complex V and III subunits in FAPs (Fig 1C and D) butnot in MuSCs (Fig 1E and F).
To confirm that mdx progenitor cells have an altered energymetabolism, we purified FAPs and MuSCs andmeasured the oxygenconsumption rate (OCR) under mitochondrial stress test conditions(Figs 2A–J and S2A–J). In comparison with wt, the OCR of dystrophiccells in basal conditions was reduced inmdx FAPs (Fig 2B). A similar,albeit smaller, decrease was observed also inmdx MuSCs (Fig S2B).This is in accordance with the proteomic analysis, where FAPsshowed a decreased concentration of enzymes in the oxidativephosphorylation pathway (Fig 1A and B). Upon sequential injectionof inhibitors of mitochondrial functions, dystrophic FAPs display areduced mitochondrial ATP production and spare respiratory ca-pacity, indicating that the mitochondrial efficiency and respon-siveness to different energy demands are impaired in these cells(Fig 2C and D). By using the OCR/extracellular acidification rate ratioas a proxy of metabolic imbalance (Pala et al, 2018), we alsoconclude that mdx FAPs have a more robust glycolytic flux than wtmatched cells (Fig 2E). Although less evident in comparison withmdx FAPs, also dystrophic MuSCs have a reduced mitochondrialperformance (Fig S2C and D) and mainly exploit glycolysis forenergy production (Fig S2E). Moreover, dystrophic FAPs show alower mitochondrial trans-membrane potential and a weaker
HFD reprograms dystrophic FAPs Rosina et al. https://doi.org/10.26508/lsa.202000660 vol 3 | no 3 | e202000646 2 of 24
response to FCCP uncoupling treatment, as shown by the Mito-Tracker Red labelling (Fig 2K). Such reduction is not related to thechange in total mitochondrial mass as shown in MitoTracker Greenlabelling (Fig 2L).
Our data are consistent with wt and dystrophic progenitor cellsbeing in a different metabolic state. Whereas wt cells, similarly toother quiescent stem progenitors, mainly rely on OxPhos for energyproduction (Ryall et al, 2015; Knobloch et al, 2017), mdx progenitors
Figure 1. Mass spectrometry–basedproteomics of mdx fibro/adipogenic progenitors (FAPs)reveals a significant alteration of keymetabolic pathways.(A) The metabolic pathway mapderived from Wikipathways (http://www.wikipathways.org) of keymetabolic enzymes significantlymodulated in mdx FAPs compared withwt. For each detected enzyme, acorresponding square is color codedaccording to the log2 fold change of theprotein expression level in mdxcompared with wt FAPs. (B) Boxplotrepresenting the log2 fold change(mdx/wt) of the abundance ofmetabolic enzymes annotated withthe GO terms glycolysis, TCA cycle,pentose phosphate, and fatty acidmetabolism in FAPs. (C) Western Blotof PKM2, CV-ATP5a, CIII-UQCRC2, andvinculin in FAPs isolated from thehind limbs of young (45-d old) wt andmdxmice (wt FAPs n = 3;mdx FAPs n = 5).(D) Bar graphs representing the foldchange of the enzymes PKM2, CV-ATP5a, and CIII-UQCRC2 in FAPs. Proteinlevels were normalized to vinculin.(E) Western Blot of PKM2, CV-ATP5a,CIII-UQCRC2, and vinculin in musclesatellite cells (MuSCs) isolated fromthe hind limbs of wt and mdx mice (wtMuSCs n = 3; mdx MuSCs n = 5). (F) Bargraphs representing the fold changeof the enzymes PKM2, CV-ATP5a, andCIII-UQCRC2 in MuSCs. Protein levelswere normalized to vinculin.Statistical significance was estimatedby t test. All data are represented asmean ± SEM and statisticalsignificance is defined as *P < 0.05; **P< 0.01; ***P < 0.001.
HFD reprograms dystrophic FAPs Rosina et al. https://doi.org/10.26508/lsa.202000660 vol 3 | no 3 | e202000646 3 of 24
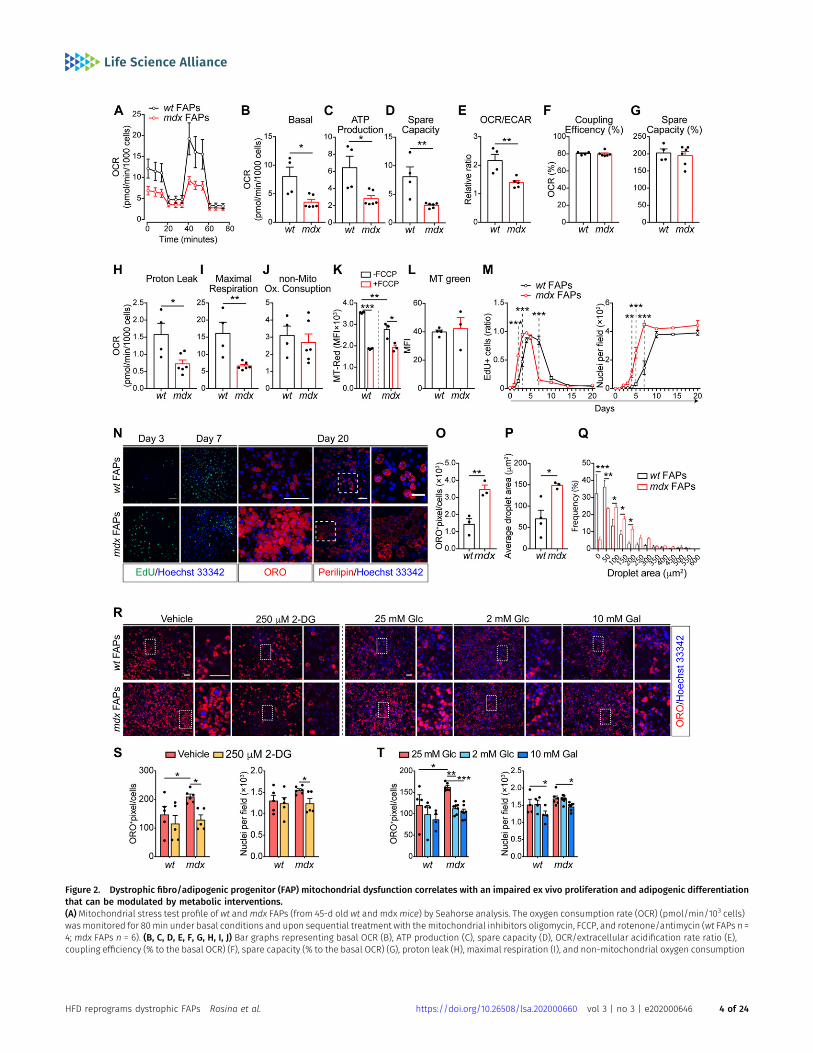
Figure 2. Dystrophic fibro/adipogenic progenitor (FAP) mitochondrial dysfunction correlates with an impaired ex vivo proliferation and adipogenic differentiationthat can be modulated by metabolic interventions.(A)Mitochondrial stress test profile of wt andmdx FAPs (from 45-d old wt and mdxmice) by Seahorse analysis. The oxygen consumption rate (OCR) (pmol/min/103 cells)wasmonitored for 80min under basal conditions and upon sequential treatment with themitochondrial inhibitors oligomycin, FCCP, and rotenone/antimycin (wt FAPs n =4; mdx FAPs n = 6). (B, C, D, E, F, G, H, I, J) Bar graphs representing basal OCR (B), ATP production (C), spare capacity (D), OCR/extracellular acidification rate ratio (E),coupling efficiency (% to the basal OCR) (F), spare capacity (% to the basal OCR) (G), proton leak (H), maximal respiration (I), and non-mitochondrial oxygen consumption
HFD reprograms dystrophic FAPs Rosina et al. https://doi.org/10.26508/lsa.202000660 vol 3 | no 3 | e202000646 4 of 24
are less efficient in mitochondrial respiration and favor a glycolyticmetabolism.
In vitro metabolic reprogramming of dystrophic FAPs and MuSCsimpact on their differentiation potential
Given the crucial role of the metabolism in controlling the stem cellfate (Knobloch et al, 2017; Pala et al, 2018), we wondered if thealtered metabolic state of dystrophic muscle stem cells couldimpact their ability to proliferate and/or differentiate. In vitro–culturedmdx FAPs show an enhancedmitotic rate comparedwithwt,as revealed by the 5-ethynyl-29-deoxyuridine (EdU) incorporationand by the growth profile (Fig 2M and N), and reduced doubling time(Fig S3A). In addition, mdx FAPs have a higher adipogenic differ-entiation potential, as revealed by the increased number of matureadipocytes (Fig 2N and O) with larger lipid droplets, 20 d after plating(Fig 2N, P, and Q).
To enquire whether the enhanced glycolytic flux in mdx FAPs isresponsible for the increase in adipogenic propensity, we moni-tored wt and mdx FAP adipogenesis in conditions that restrainglycolysis. Specifically, we treated FAPs with 250 μM 2-deoxyglucose(2-DG), 2 mM glucose, or 10 mM galactose to inhibit glycolysis andshunt substrates toward OxPhos (Fig 2R). In these experimentalconditions, themitochondria functionality is improved, as shown bythe enhanced ATP production (Fig S3B). Remarkably, 2-DG treat-ment, as well as glucose deprivation, significantly reduce theadipogenic differentiation (Fig 2R–T) and proliferation of mdx FAPs(Fig S3C and D), without affecting their survival (Fig S3E).
We next asked whether the in vitro metabolic reprogramming ofwt and dystrophic MuSCs could also impact on their myogenicpotential. Whereas culturing MuSCs in the presence of 2-DG doesnot affect myogenic differentiation (Fig S2K and L), glucose dep-rivation and galactose treatment significantly increase their abilityto form elongated myosin heavy chain (MyHC)-positive myotubes(Fig S2K and M). Although the treatment did not impact on cellviability (Fig S2N–P), MuSC proliferation increases upon glucosereduction and galactose treatment (Fig S2Q–S) as reported byothers showing that OxPhos directly influences the differentiationand proliferative capacities of MuSCs (Cerletti et al, 2012).
Overall, our data point to glycolysis as a process which plays apivotal role in the regulation of dystrophic FAP proliferation and
adipogenic differentiation. By contrast, MuSC myogenic differen-tiation is supported by OxPhos.
A short-term HFD remodels FAP metabolism in mdx mice
In vitro, metabolic reprogramming of FAPs and MuSCs from mdxmice affects their differentiation potential. Given the crucial role ofthese progenitor cells in mediating muscle regeneration (Murphyet al, 2011), we next asked whether dietary regimens designed toactivate fatty acid oxidation (FAO) and mitochondrial respirationwould stimulate and restore OxPhos activity along with the pro-regenerative potential of mdx FAPs and MuSCs. To this aim, we fedweaned (21-d old) mdx and wt mice for 28 d with a standard HFDcontaining 58% kcal in fat. The control group was fed with an iso-caloric control/low-fat diet (LFD, 11% kcal in fat) (see the Materialsand Methods section for details).
During the diet regimen, weight, food and water intake wererecorded every 2 d (Fig S4A). Short-term treatment with the HFD wasnot sufficient to cause any significant changes in the body, organs,and muscle weight in either group (Fig S4B and C). Nevertheless,after 4 wk, cholesterol and triglycerides were significantly increasedin both mdx and wt mice on the HFD (Fig S4D).
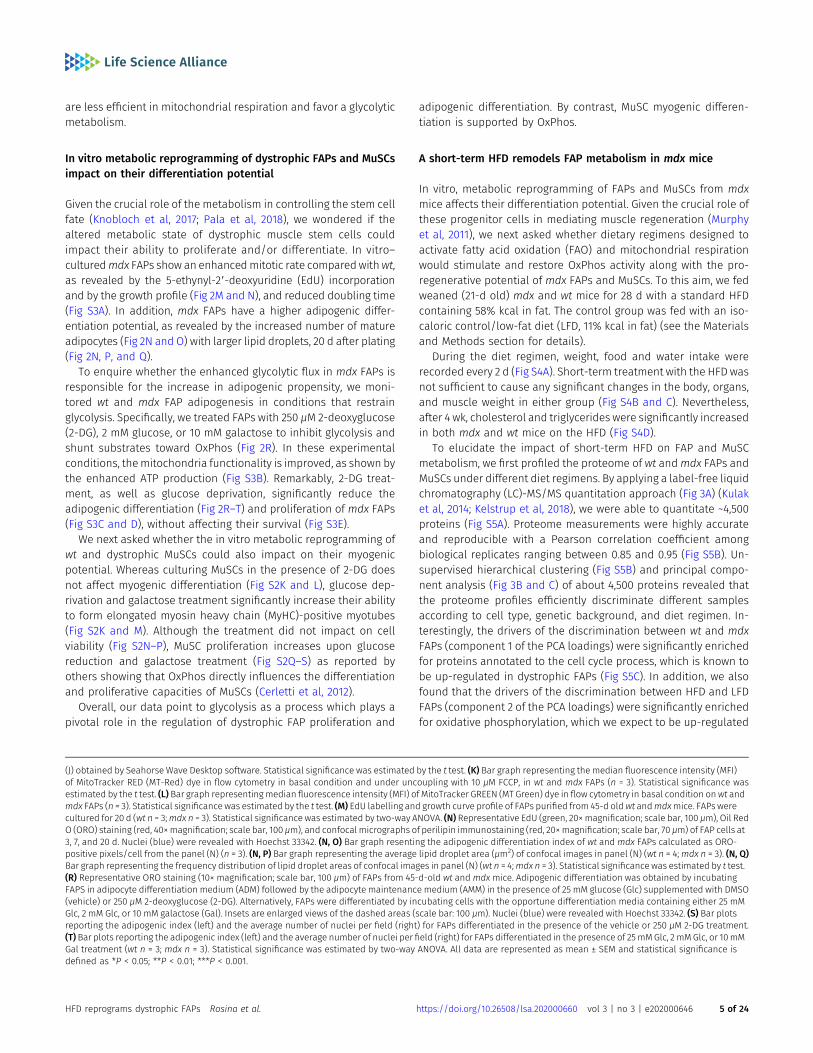
To elucidate the impact of short-term HFD on FAP and MuSCmetabolism, we first profiled the proteome of wt andmdx FAPs andMuSCs under different diet regimens. By applying a label-free liquidchromatography (LC)-MS/MS quantitation approach (Fig 3A) (Kulaket al, 2014; Kelstrup et al, 2018), we were able to quantitate ~4,500proteins (Fig S5A). Proteome measurements were highly accurateand reproducible with a Pearson correlation coefficient amongbiological replicates ranging between 0.85 and 0.95 (Fig S5B). Un-supervised hierarchical clustering (Fig S5B) and principal compo-nent analysis (Fig 3B and C) of about 4,500 proteins revealed thatthe proteome profiles efficiently discriminate different samplesaccording to cell type, genetic background, and diet regimen. In-terestingly, the drivers of the discrimination between wt and mdxFAPs (component 1 of the PCA loadings) were significantly enrichedfor proteins annotated to the cell cycle process, which is known tobe up-regulated in dystrophic FAPs (Fig S5C). In addition, we alsofound that the drivers of the discrimination between HFD and LFDFAPs (component 2 of the PCA loadings) were significantly enrichedfor oxidative phosphorylation, which we expect to be up-regulated
(J) obtained by Seahorse Wave Desktop software. Statistical significance was estimated by the t test. (K) Bar graph representing the median fluorescence intensity (MFI)of MitoTracker RED (MT-Red) dye in flow cytometry in basal condition and under uncoupling with 10 μM FCCP, in wt and mdx FAPs (n = 3). Statistical significance wasestimated by the t test. (L) Bar graph representingmedian fluorescence intensity (MFI) of MitoTracker GREEN (MT Green) dye in flow cytometry in basal condition onwt andmdx FAPs (n = 3). Statistical significance was estimated by the t test. (M) EdU labelling and growth curve profile of FAPs purified from 45-d oldwt andmdxmice. FAPs werecultured for 20 d (wt n = 3;mdx n = 3). Statistical significance was estimated by two-way ANOVA. (N) Representative EdU (green, 20× magnification; scale bar, 100 μm), Oil RedO (ORO) staining (red, 40×magnification; scale bar, 100 μm), and confocal micrographs of perilipin immunostaining (red, 20×magnification; scale bar, 70 μm) of FAP cells at3, 7, and 20 d. Nuclei (blue) were revealed with Hoechst 33342. (N, O) Bar graph resenting the adipogenic differentiation index of wt and mdx FAPs calculated as ORO-positive pixels/cell from the panel (N) (n = 3). (N, P) Bar graph representing the average lipid droplet area (μm2) of confocal images in panel (N) (wt n = 4;mdx n = 3). (N, Q)Bar graph representing the frequency distribution of lipid droplet areas of confocal images in panel (N) (wt n = 4;mdx n = 3). Statistical significance was estimated by t test.(R) Representative ORO staining (10× magnification; scale bar, 100 μm) of FAPs from 45-d-old wt andmdx mice. Adipogenic differentiation was obtained by incubatingFAPS in adipocyte differentiation medium (ADM) followed by the adipocyte maintenance medium (AMM) in the presence of 25 mM glucose (Glc) supplemented with DMSO(vehicle) or 250 μM 2-deoxyglucose (2-DG). Alternatively, FAPs were differentiated by incubating cells with the opportune differentiation media containing either 25 mMGlc, 2 mM Glc, or 10 mM galactose (Gal). Insets are enlarged views of the dashed areas (scale bar: 100 μm). Nuclei (blue) were revealed with Hoechst 33342. (S) Bar plotsreporting the adipogenic index (left) and the average number of nuclei per field (right) for FAPs differentiated in the presence of the vehicle or 250 μM 2-DG treatment.(T) Bar plots reporting the adipogenic index (left) and the average number of nuclei per field (right) for FAPs differentiated in the presence of 25mMGlc, 2 mMGlc, or 10mMGal treatment (wt n = 3; mdx n = 3). Statistical significance was estimated by two-way ANOVA. All data are represented as mean ± SEM and statistical significance isdefined as *P < 0.05; **P < 0.01; ***P < 0.001.
HFD reprograms dystrophic FAPs Rosina et al. https://doi.org/10.26508/lsa.202000660 vol 3 | no 3 | e202000646 5 of 24
in response to the HFD treatment (Fig S5C). About 9% of the pro-teome of both dystrophic FAPs and MuSCs was found to be sig-nificantly modulated by the diet (Fig S5D and E). The HFDsignificantly increased the level of proteins involved in fatty acidmetabolism and OxPhos in FAPs as well as, albeit to a lesser extent,in MuSCs of dystrophic mice (Fig S5F).
We next focused on those proteins that were significantlymodulated in themdxmodel when compared with wt. Interestingly,
in both FAPs (Fig 3D) and MuSCs (Fig S5G), we observed an inversecorrelation (PC = −0.6 in FAPs, PC = −0.7 in MuSCs) between thedystrophy-dependent proteome changes (mdx versus wt) and thediet-dependent proteome modulation (mdx HFD versus mdx LFD).This observation suggests that the HFD restores in mdx progenitorcells a proteome profile that is similar to the wt counterpart. Wenext used the two-dimensional annotation enrichment analyses toinvestigate, which biological processes were mainly restored by
Figure 3. Short-term high-fat diet (HFD) rewires themetabolic signature of dystrophic fibro/adipogenicprogenitors (FAPs).(A) Experimental workflow to analyze the proteome ofFAPs and Muscle Satellite Cells purified from 49-d-old wt and mdx mice fed with low-fat diet (LFD) andHFD (wt LFD n = 3; wt HFD n = 2; mdx LFD n = 2; mdx HFDn = 3). (B) Principal component analysis of theproteomic profiles of FAPs and muscle satellite cellsfrom mice under LFD or HFD. (C) The principalcomponent analysis inset shows the sampleseparation of wt/mdx FAPs from mice fed with LFD andHFD. (D) Scatterplot of the log2 fold change of proteinexpression level of 480 proteins significantlymodulated in mdx/wt FAPs (y-axis) and HFD/LFD mdxFAPs (x-axis). (E) Two-dimensional annotationenrichment analysis of the significantly modulatedproteins in mdx/wt FAPs (y-axis) and HFD/LFD mdxFAPs (x-axis). Groups of related GO terms are labelledwith the same color, as described in the inset. (F)Quantitation of the ATP in FAPs purified from 49-d-oldmdxmice fed with LFD and HFD (n = 3). (G)Mitochondrialstress test profile of LFD and HFD mdx FAPs. Oxygenconsumption rate (pmol/min/103 cells) wasmonitoredin real time (for 80min) under basal condition and uponsequential treatment with mitochondrial inhibitors(mdx LFD n = 4; mdx HFD n = 4). (H, I) Bar graphsrepresenting basal oxygen consumption rate (H) andATP production (I). (J, K) Western blot (J) and relativedensitometric analysis (K) of PKM2 and vinculin in FAPsfrommdxmice fed with LFD and HFD (mdx LFD n = 4;mdxHFD n = 4). Statistical significance was estimated by ttest. All data are represented as mean ± SEM andstatistical significance is defined as *P < 0.05; **P < 0.01;***P < 0.001.
HFD reprograms dystrophic FAPs Rosina et al. https://doi.org/10.26508/lsa.202000660 vol 3 | no 3 | e202000646 6 of 24

HFD in mdx FAPs and MuSCs. Proteins involved in protein-elongation and translation, here annotated as “ribosomal,” wereup-regulated in mdx cells and reduced in concentration upon HFD(Figs 3E and S5H). In agreement with our previous observations, HFDrestores the expression levels of mitochondrial proteins in bothdystrophic FAPs and MuSCs, whereas FAO and OxPhos were sig-nificantly enriched only in mdx FAPs (Figs 3E and S5H). In agree-ment, most of the enzymes involved in the TCA cycle, OxPhos, andFAOwere significantly up-regulated (log2 of themedian fold change= 0.8) by the HFD treatment only in dystrophic FAPs and not inMuSCs (Fig S5I and J). In line with these findings, we also observedthat HFD treatment significantly up-regulated PDK4, by 16-fold, indystrophic FAPs and not in MuSCs (Fig S5K). PDK4 is a key metabolicenzyme enhancing FAO utilization through its inhibitory activity onpyruvate dehydrogenase (Palamiuc et al, 2015).
Prompted by the observed modulation of key metabolic en-zymes, we asked whether the changes in the proteome profile,induced by the short-term HFD, cause a reprogramming of themetabolism in dystrophic FAPs and overcome their mitochondrialdefect. To address this point, we measured the ATP levels andcharacterized the mitochondrial bioenergetics in cultured FAPspurified from muscles of dystrophic mice fed with HFD and LFD.Remarkably, HFD treatment increased the ATP production andimproved the mitochondrial functionality of FAPs (Fig 3F–I). Con-sistently, the levels of PKM2 were blunted (Fig 3J and K), indicatingthat HFD favors the oxidative processes at the expense of glycolysis.
Short-term HFD restores key regulatory signaling networks inmdx FAPs
We next asked whether, in addition to metabolism, the HFD wouldalso affect key signaling pathways inmdxmice. To this end, we firstselected the proteins whose abundance was affected in mdx andrestored to values closer towt by the diet. 220 and 283 proteins havesuch characteristics in MuSCs and FAPs, respectively (Fig S6A). Next,we mapped this subset of proteins onto a literature-derived net-work (Sacco et al, 2016) of signaling and physical interactionsextracted from the SIGNOR (Perfetto et al, 2015) and the Menthadatabases (Calderone et al, 2013). This strategy revealed key sig-naling networks and protein complexes whose concentrations wereaffected by the HFD only in dystrophic FAPs and not wt FAPs and inMuSCs (Figs S6B, S7A and B, and S8A and B). This network analysisshowed that HFD treatment in dystrophic cells restores to wt levelthe abundance of the sarcolemmal protein, dysferlin, which playsan important role in the control of Ca2+-dependent sarcolemmalstability and resealing (Han et al, 2011). Our network analysis enabledus to uncover that the HFD treatment decreases the concentrationlevels of key proteins positively controlling FAP proliferation, which ispathologically enhanced in dystrophic muscle (Fig 4A) (Lemos et al,2015; Marinkovic et al, 2019). Consistently, we observed a significantreduction in the number of PDGFRα-positive FAPs by labelling tibialisanterior (TA) muscle sections from dystrophic mice fed with HFD(Fig 4B). As inferred from the network modelling approach, HFDsignificantly suppresses the fraction of FAPs expressing the pro-liferation marker Ki67 (Fig 4B–D).
Interestingly, we also observed that the HFD treatment causes anup-regulation of β-catenin (Figs 4A, E, and F, and S7B), a crucial hub
controlling a variety of biological processes, including the ex-pression level of follistatin (Jones et al, 2015) known to mediatesome of the promyogenic effects of FAPs (Mozzetta et al, 2013).Consistently, two negative regulators of β-catenin, MEST/PEG1 (Liet al, 2014) and casein kinase 1α (Amit et al, 2002), are expressed athigher levels in mdx FAPs, whereas their modulation is reverted inFAPs from mice fed with HFD (Fig 4A, E, and F).
Next, we investigated whether the increased HFD-dependentβ-catenin expression was also associated to an up-regulation offollistatin, which is significantly decreased in dystrophic FAPs incomparison with wt (Fig 4G). In agreement with our hypothesis, theHFD restored the mRNA of follistatin to wild-type levels (Fig 4G). Inaddition, we demonstrated that in vitro treatment of dystrophicFAPs with a mixture of fatty acids (50 μM of BSA-coupled palmitate,50 μM of BSA-coupled oleate, and 100 μM carnitine) (Fig 4H) in-crease Ctnnb1 and Fst gene expression (Fig 4I).
To demonstrate the positive relation between β-catenin andfollistatin in FAPs, we stabilized β-catenin through the high-selective GSK3 inhibitor, LY2090314 (Fig 4J) (Rizzieri et al, 2016;Kunnimalaiyaan et al, 2018). GSK3 blockade stabilizes enhancesCtnnb1 expression at 48 and 72 h while inducing a peak of Fst after48 h of treatments (Fig 4K).
These observations encouraged us to investigate whether theHFD could increase the ability of FAPs to promote myogenic dif-ferentiation of MuSCs from dystrophic mice. Conditioned media(CM) of FAPs from mice fed with HFD are enriched in follistatincompared with LFD (Fig 4L). Independently from the diet treatment,CM from FAPs are able to promote the differentiation of MuSCs.However, media conditioned with FAPs from mice fed with the HFDbetter promote myogenesis of mdx MuSCs, when compared withmedia conditioned with LFD FAPs (Fig 4M–O).
Altogether, our data support a model whereby the in vivometabolic reprogramming suppresses the FAP aberrant prolifera-tion in dystrophic mice, while enhancing their ability to promotemyogenesis of MuSCs.
A short-term HFD ameliorates the dystrophic phenotype
Finally, we asked whether the metabolic reprogramming of muscleprogenitor cells mediated by the HFD would also have an impact onthe histological phenotype of dystrophic muscles. First, we moni-tored the serum level of creatine phosphokinase, a sensitivemarkerof muscle damage. Short-term HFD reduced serum creatinephosphokinase, suggesting that HFD protects mdx muscles fromdystrophic damage (Fig 5A). Consistently, the incidence of cen-tronuclear myofibers is reduced in dystrophic TAs and diaphragmsupon HFD treatment (Fig 5B–E). Given the key role of FAPs inmediating fibrosis (Uezumi et al, 2011; Hogarth et al, 2019) indegenerating muscles, we next asked whether HFD could alsoameliorate fibrosis in TAs and diaphragms. HFD decreases theabundance of fibrotic scars both in the TA and diaphragm muscles(Fig 5F–I). Intramuscular FAP-derived adipocytes are also commonduring the late stages of muscular dystrophy but absent in youngmouse muscles (Uezumi et al, 2011; Hogarth et al, 2019). However,rare adipogenic depots are found in diaphragm muscles, inde-pendently from mouse genotypes and diet regimen (Fig S9A and B).
HFD reprograms dystrophic FAPs Rosina et al. https://doi.org/10.26508/lsa.202000660 vol 3 | no 3 | e202000646 7 of 24

Figure 4. Short-term high-fat diet (HFD) limits fibro/adipogenic progenitor (FAP) persistence in dystrophic muscles and restores β-catenin expression enhancingtheir promyogenic abilities.(A) Schematic representation of the main molecular events reverted by HFD treatment inmdx FAPs. (B) Representative confocal images of PDGFRα-positive FAPs (green)from 49-d-old wt and mdx mice fed with low-fat diet (LFD) and HFD (60× magnification; scale bar, 20 μm). Fibers (red) were stained using antibodies directed against theMyHC isoforms. Representative micrograph (20× magnification; scale bar, 100 μm) showing proliferating FAPs by coupling PDGFRα staining (green) with anti-Ki67antibodies (red). Nuclei (blue) were revealed with Hoechst 33342. (C) Bar plot reporting the number of PDGFRα-positive FAPs per cm2 of muscle section (wt LFD n = 4; wt
HFD reprograms dystrophic FAPs Rosina et al. https://doi.org/10.26508/lsa.202000660 vol 3 | no 3 | e202000646 8 of 24
To further elucidate the role of HFD on muscle regeneration indystrophic mice, we examined the cross-sectional area (CSA) of TAs(Fig 5J). This analysis highlighted a rescue in the mdx TA myofibercalibers whose average area approaches wt level (Fig 5K) with asignificant reduction of the number of small fibers and a corre-sponding increase of fibers of larger calibers (Fig S9C). Althoughevident in TAs, such hypertrophic improvement was not appre-ciable in diaphragm muscles (Fig S9D–F).
The increased CSA of mdx TA muscles upon HFD did not resultfrom an increased commitment and/or differentiation of MuSCsbecause, when cultured ex vivo, MyoD expression levels, EdU in-corporation, and the fusion index do not differ, comparing MuSCsfrom LFD- or HFD-fed mice both at early and late culture time (FigS9G and H). At the molecular level, we found that the increased CSAparallels an activation of the mTOR pathway, as revealed the en-hanced phosphorylation of mTOR and its indirect downstreamtarget RPS6, in whole muscle lysates (Fig 5L–N). This observation isconsistent with the HFD-dependent increase of the expression levelof the hypertrophic cytokine IGF1 in dystrophic FAPs (Fig 5O).Overall, we found that short-term HFD is able to ameliorate thedystrophic phenotype while triggering a hypertrophic response viathe mTOR pathway.
FAPs mediate the beneficial effects of HFD
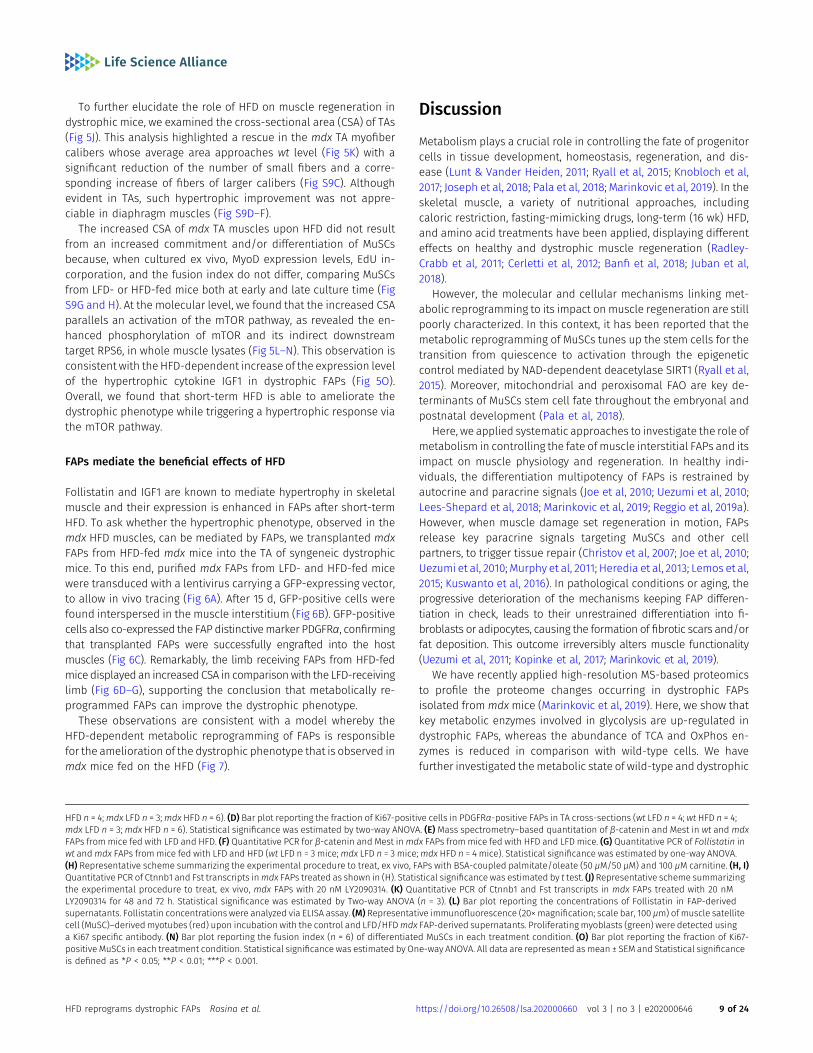
Follistatin and IGF1 are known to mediate hypertrophy in skeletalmuscle and their expression is enhanced in FAPs after short-termHFD. To ask whether the hypertrophic phenotype, observed in themdx HFD muscles, can be mediated by FAPs, we transplanted mdxFAPs from HFD-fed mdx mice into the TA of syngeneic dystrophicmice. To this end, purified mdx FAPs from LFD- and HFD-fed micewere transduced with a lentivirus carrying a GFP-expressing vector,to allow in vivo tracing (Fig 6A). After 15 d, GFP-positive cells werefound interspersed in the muscle interstitium (Fig 6B). GFP-positivecells also co-expressed the FAP distinctivemarker PDGFRα, confirmingthat transplanted FAPs were successfully engrafted into the hostmuscles (Fig 6C). Remarkably, the limb receiving FAPs from HFD-fedmice displayed an increased CSA in comparisonwith the LFD-receivinglimb (Fig 6D–G), supporting the conclusion that metabolically re-programmed FAPs can improve the dystrophic phenotype.
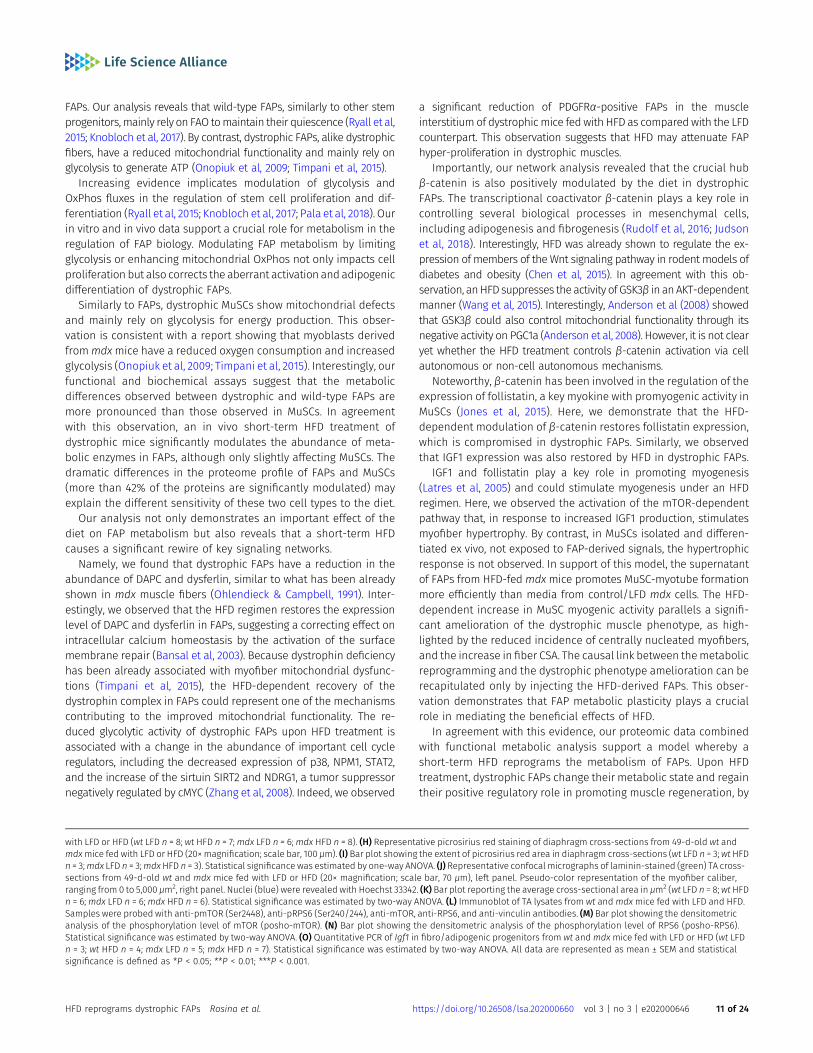
These observations are consistent with a model whereby theHFD-dependent metabolic reprogramming of FAPs is responsiblefor the amelioration of the dystrophic phenotype that is observed inmdx mice fed on the HFD (Fig 7).
Discussion
Metabolism plays a crucial role in controlling the fate of progenitorcells in tissue development, homeostasis, regeneration, and dis-ease (Lunt & Vander Heiden, 2011; Ryall et al, 2015; Knobloch et al,2017; Joseph et al, 2018; Pala et al, 2018; Marinkovic et al, 2019). In theskeletal muscle, a variety of nutritional approaches, includingcaloric restriction, fasting-mimicking drugs, long-term (16 wk) HFD,and amino acid treatments have been applied, displaying differenteffects on healthy and dystrophic muscle regeneration (Radley-Crabb et al, 2011; Cerletti et al, 2012; Banfi et al, 2018; Juban et al,2018).
However, the molecular and cellular mechanisms linking met-abolic reprogramming to its impact onmuscle regeneration are stillpoorly characterized. In this context, it has been reported that themetabolic reprogramming of MuSCs tunes up the stem cells for thetransition from quiescence to activation through the epigeneticcontrol mediated by NAD-dependent deacetylase SIRT1 (Ryall et al,2015). Moreover, mitochondrial and peroxisomal FAO are key de-terminants of MuSCs stem cell fate throughout the embryonal andpostnatal development (Pala et al, 2018).
Here, we applied systematic approaches to investigate the role ofmetabolism in controlling the fate of muscle interstitial FAPs and itsimpact on muscle physiology and regeneration. In healthy indi-viduals, the differentiation multipotency of FAPs is restrained byautocrine and paracrine signals (Joe et al, 2010; Uezumi et al, 2010;Lees-Shepard et al, 2018; Marinkovic et al, 2019; Reggio et al, 2019a).However, when muscle damage set regeneration in motion, FAPsrelease key paracrine signals targeting MuSCs and other cellpartners, to trigger tissue repair (Christov et al, 2007; Joe et al, 2010;Uezumi et al, 2010; Murphy et al, 2011; Heredia et al, 2013; Lemos et al,2015; Kuswanto et al, 2016). In pathological conditions or aging, theprogressive deterioration of the mechanisms keeping FAP differen-tiation in check, leads to their unrestrained differentiation into fi-broblasts or adipocytes, causing the formation of fibrotic scars and/orfat deposition. This outcome irreversibly alters muscle functionality(Uezumi et al, 2011; Kopinke et al, 2017; Marinkovic et al, 2019).
We have recently applied high-resolution MS-based proteomicsto profile the proteome changes occurring in dystrophic FAPsisolated frommdxmice (Marinkovic et al, 2019). Here, we show thatkey metabolic enzymes involved in glycolysis are up-regulated indystrophic FAPs, whereas the abundance of TCA and OxPhos en-zymes is reduced in comparison with wild-type cells. We havefurther investigated themetabolic state of wild-type and dystrophic
HFD n = 4;mdx LFD n = 3;mdx HFD n = 6). (D) Bar plot reporting the fraction of Ki67-positive cells in PDGFRα-positive FAPs in TA cross-sections (wt LFD n = 4; wt HFD n = 4;mdx LFD n = 3; mdx HFD n = 6). Statistical significance was estimated by two-way ANOVA. (E) Mass spectrometry–based quantitation of β-catenin and Mest in wt and mdxFAPs frommice fed with LFD and HFD. (F) Quantitative PCR for β-catenin and Mest inmdx FAPs frommice fed with HFD and LFD mice. (G) Quantitative PCR of Follistatin inwt andmdx FAPs frommice fed with LFD and HFD (wt LFD n = 3 mice;mdx LFD n = 3 mice;mdx HFD n = 4 mice). Statistical significance was estimated by one-way ANOVA.(H) Representative scheme summarizing the experimental procedure to treat, ex vivo, FAPs with BSA-coupled palmitate/oleate (50 μM/50 μM) and 100 μM carnitine. (H, I)Quantitative PCR of Ctnnb1 and Fst transcripts inmdx FAPs treated as shown in (H). Statistical significance was estimated by t test. (J) Representative scheme summarizingthe experimental procedure to treat, ex vivo, mdx FAPs with 20 nM LY2090314. (K) Quantitative PCR of Ctnnb1 and Fst transcripts in mdx FAPs treated with 20 nMLY2090314 for 48 and 72 h. Statistical significance was estimated by Two-way ANOVA (n = 3). (L) Bar plot reporting the concentrations of Follistatin in FAP-derivedsupernatants. Follistatin concentrations were analyzed via ELISA assay. (M) Representative immunofluorescence (20×magnification; scale bar, 100 μm) of muscle satellitecell (MuSC)–derivedmyotubes (red) upon incubation with the control and LFD/HFDmdx FAP-derived supernatants. Proliferatingmyoblasts (green) were detected usinga Ki67 specific antibody. (N) Bar plot reporting the fusion index (n = 6) of differentiated MuSCs in each treatment condition. (O) Bar plot reporting the fraction of Ki67-positive MuSCs in each treatment condition. Statistical significance was estimated by One-way ANOVA. All data are represented asmean ± SEM and Statistical significanceis defined as *P < 0.05; **P < 0.01; ***P < 0.001.
HFD reprograms dystrophic FAPs Rosina et al. https://doi.org/10.26508/lsa.202000660 vol 3 | no 3 | e202000646 9 of 24

Figure 5. Short-term high-fat diet (HFD) ameliorates the mdx phenotype.(A) Serum creatine phosphokinase (units per liter, U/l) from 49-d-old wt andmdxmice fed with low-fat diet (LFD) or HFD (wt LFD n = 6; wt HFD n = 7;mdx LFD n = 6;mdxHFD n = 10). (B) Representative hematoxylin and eosin staining of TA cross-sections from 49-d-old wt andmdxmice fed with LFD or HFD (20× magnification; scale bar, 100µm). (C) Percentage of centrally nucleated myofibers in TAs (wt LFD n = 8; wt HFD n = 6;mdx LFD n = 6;mdx HFD n = 8). (D) Representative hematoxylin and eosin staining ofdiaphragm cross-sections from 49-d-old wt andmdxmice fed with LFD or HFD (20× magnification; scale bar, 100 μm). (E) Percentage of centrally nucleated myofibers indiaphragms (wt LFD n = 3; wt HFD n = 3;mdx LFD n = 3;mdx HFD n = 3). Statistical significance was estimated by Two-way ANOVA. (F) Representative picrosirius red stainingof TA cross-sections (20× magnification; scale bar, 100 ım). (G) Bar plot showing the extent of picrosirius red area in TA cross-sections from 49-d-old wt andmdxmice fed
HFD reprograms dystrophic FAPs Rosina et al. https://doi.org/10.26508/lsa.202000660 vol 3 | no 3 | e202000646 10 of 24
FAPs. Our analysis reveals that wild-type FAPs, similarly to other stemprogenitors,mainly rely on FAO tomaintain their quiescence (Ryall et al,2015; Knobloch et al, 2017). By contrast, dystrophic FAPs, alike dystrophicfibers, have a reduced mitochondrial functionality and mainly rely onglycolysis to generate ATP (Onopiuk et al, 2009; Timpani et al, 2015).
Increasing evidence implicates modulation of glycolysis andOxPhos fluxes in the regulation of stem cell proliferation and dif-ferentiation (Ryall et al, 2015; Knobloch et al, 2017; Pala et al, 2018). Ourin vitro and in vivo data support a crucial role for metabolism in theregulation of FAP biology. Modulating FAP metabolism by limitingglycolysis or enhancing mitochondrial OxPhos not only impacts cellproliferation but also corrects the aberrant activation and adipogenicdifferentiation of dystrophic FAPs.
Similarly to FAPs, dystrophic MuSCs show mitochondrial defectsand mainly rely on glycolysis for energy production. This obser-vation is consistent with a report showing that myoblasts derivedfrommdxmice have a reduced oxygen consumption and increasedglycolysis (Onopiuk et al, 2009; Timpani et al, 2015). Interestingly, ourfunctional and biochemical assays suggest that the metabolicdifferences observed between dystrophic and wild-type FAPs aremore pronounced than those observed in MuSCs. In agreementwith this observation, an in vivo short-term HFD treatment ofdystrophic mice significantly modulates the abundance of meta-bolic enzymes in FAPs, although only slightly affecting MuSCs. Thedramatic differences in the proteome profile of FAPs and MuSCs(more than 42% of the proteins are significantly modulated) mayexplain the different sensitivity of these two cell types to the diet.
Our analysis not only demonstrates an important effect of thediet on FAP metabolism but also reveals that a short-term HFDcauses a significant rewire of key signaling networks.
Namely, we found that dystrophic FAPs have a reduction in theabundance of DAPC and dysferlin, similar to what has been alreadyshown in mdx muscle fibers (Ohlendieck & Campbell, 1991). Inter-estingly, we observed that the HFD regimen restores the expressionlevel of DAPC and dysferlin in FAPs, suggesting a correcting effect onintracellular calcium homeostasis by the activation of the surfacemembrane repair (Bansal et al, 2003). Because dystrophin deficiencyhas been already associated with myofiber mitochondrial dysfunc-tions (Timpani et al, 2015), the HFD-dependent recovery of thedystrophin complex in FAPs could represent one of the mechanismscontributing to the improved mitochondrial functionality. The re-duced glycolytic activity of dystrophic FAPs upon HFD treatment isassociated with a change in the abundance of important cell cycleregulators, including the decreased expression of p38, NPM1, STAT2,and the increase of the sirtuin SIRT2 and NDRG1, a tumor suppressornegatively regulated by cMYC (Zhang et al, 2008). Indeed, we observed
a significant reduction of PDGFRα-positive FAPs in the muscleinterstitium of dystrophicmice fed with HFD as compared with the LFDcounterpart. This observation suggests that HFD may attenuate FAPhyper-proliferation in dystrophic muscles.
Importantly, our network analysis revealed that the crucial hubβ-catenin is also positively modulated by the diet in dystrophicFAPs. The transcriptional coactivator β-catenin plays a key role incontrolling several biological processes in mesenchymal cells,including adipogenesis and fibrogenesis (Rudolf et al, 2016; Judsonet al, 2018). Interestingly, HFD was already shown to regulate the ex-pression of members of the Wnt signaling pathway in rodent models ofdiabetes and obesity (Chen et al, 2015). In agreement with this ob-servation, anHFD suppresses the activity of GSK3β in anAKT-dependentmanner (Wang et al, 2015). Interestingly, Anderson et al (2008) showedthat GSK3β could also control mitochondrial functionality through itsnegative activity on PGC1a (Anderson et al, 2008). However, it is not clearyet whether the HFD treatment controls β-catenin activation via cellautonomous or non-cell autonomous mechanisms.
Noteworthy, β-catenin has been involved in the regulation of theexpression of follistatin, a key myokine with promyogenic activity inMuSCs (Jones et al, 2015). Here, we demonstrate that the HFD-dependent modulation of β-catenin restores follistatin expression,which is compromised in dystrophic FAPs. Similarly, we observedthat IGF1 expression was also restored by HFD in dystrophic FAPs.
IGF1 and follistatin play a key role in promoting myogenesis(Latres et al, 2005) and could stimulate myogenesis under an HFDregimen. Here, we observed the activation of the mTOR-dependentpathway that, in response to increased IGF1 production, stimulatesmyofiber hypertrophy. By contrast, in MuSCs isolated and differen-tiated ex vivo, not exposed to FAP-derived signals, the hypertrophicresponse is not observed. In support of this model, the supernatantof FAPs from HFD-fedmdxmice promotes MuSC-myotube formationmore efficiently than media from control/LFD mdx cells. The HFD-dependent increase in MuSC myogenic activity parallels a signifi-cant amelioration of the dystrophic muscle phenotype, as high-lighted by the reduced incidence of centrally nucleated myofibers,and the increase in fiber CSA. The causal link between themetabolicreprogramming and the dystrophic phenotype amelioration can berecapitulated only by injecting the HFD-derived FAPs. This obser-vation demonstrates that FAP metabolic plasticity plays a crucialrole in mediating the beneficial effects of HFD.
In agreement with this evidence, our proteomic data combinedwith functional metabolic analysis support a model whereby ashort-term HFD reprograms the metabolism of FAPs. Upon HFDtreatment, dystrophic FAPs change their metabolic state and regaintheir positive regulatory role in promoting muscle regeneration, by
with LFD or HFD (wt LFD n = 8; wt HFD n = 7;mdx LFD n = 6;mdx HFD n = 8). (H) Representative picrosirius red staining of diaphragm cross-sections from 49-d-old wt andmdxmice fed with LFD or HFD (20×magnification; scale bar, 100 μm). (I) Bar plot showing the extent of picrosirius red area in diaphragm cross-sections (wt LFD n = 3;wtHFDn = 3;mdx LFD n = 3;mdxHFD n = 3). Statistical significance was estimated by one-way ANOVA. (J) Representative confocal micrographs of laminin-stained (green) TA cross-sections from 49-d-old wt and mdx mice fed with LFD or HFD (20× magnification; scale bar, 70 μm), left panel. Pseudo-color representation of the myofiber caliber,ranging from 0 to 5,000 μm2, right panel. Nuclei (blue) were revealed with Hoechst 33342. (K) Bar plot reporting the average cross-sectional area in μm2 (wt LFD n = 8;wtHFDn = 6;mdx LFD n = 6;mdx HFD n = 6). Statistical significance was estimated by two-way ANOVA. (L) Immunoblot of TA lysates from wt andmdxmice fed with LFD and HFD.Samples were probed with anti-pmTOR (Ser2448), anti-pRPS6 (Ser240/244), anti-mTOR, anti-RPS6, and anti-vinculin antibodies. (M) Bar plot showing the densitometricanalysis of the phosphorylation level of mTOR (posho-mTOR). (N) Bar plot showing the densitometric analysis of the phosphorylation level of RPS6 (posho-RPS6).Statistical significance was estimated by two-way ANOVA. (O) Quantitative PCR of Igf1 in fibro/adipogenic progenitors from wt andmdxmice fed with LFD or HFD (wt LFDn = 3; wt HFD n = 4; mdx LFD n = 5; mdx HFD n = 7). Statistical significance was estimated by two-way ANOVA. All data are represented as mean ± SEM and statisticalsignificance is defined as *P < 0.05; **P < 0.01; ***P < 0.001.
HFD reprograms dystrophic FAPs Rosina et al. https://doi.org/10.26508/lsa.202000660 vol 3 | no 3 | e202000646 11 of 24
enhancing the MuSCsmyogenic activity. Remarkably, HFD-reprogrammedFAPs are able to promote the diet-dependent amelioration of thedystrophic phenotype. In addition, ex vivo experiments suggest thatmetabolic reprogramming may potentially decrease FAP patho-logical contribution to fibrotic scar and fat infiltrate formation inthe late stages of the dystrophic disease.
Recently, ApoE deficiency was shown to have catastrophic effectsin dystrophic mice under HFD (Milad et al, 2017), suggesting that thelocal and systemic effects of dietary interventions should becarefully evaluated in preclinical animal studies. Further explo-ration of the proteomic resource reported here may aid in thediscovery of additional mechanisms connecting metabolism to FAPbiology and muscular dystrophy.
The results presented here offer a proof of principle that met-abolic reprogramming of muscle progenitor cells by a HFD regimencan have a positive effect on muscle regeneration in a dystrophymouse model. Whether these findings can be extended to dys-trophy patients and whether it can be considered a viable supportstrategy remain to be established.
Materials and Methods
The full list of key materials, reagents, animal strains, and softwareused in this work is reported in Table 1.
Mouse models
C57BL/6J (RRID:IMSR_JAX:000664) and C57BL10ScSn-Dmdmdx/J mice(RRID:IMSR_JAX:001801) (referred to as wt and mdx, respectively)were purchased from the Jackson Laboratories. In our study, sexeswere equally balanced between genotypes. Young (45- and 49-d-old) wt and mdx mice were used in this work. Mice were bred andmaintained according to the standard facility procedures. All ex-perimental studies were conducted according to the rules of goodanimal experimentation I.A.C.U.C. n 432 of March 12, 2006, and underethical approval released on December 11, 2012, from the ItalianMinistry of Health, protocol #20/01-D.
Murine primary cells
FAPs and MuSCs were isolated from the hind limbs of male andfemale wt and mdx mice. Freshly sorted FAPs were resuspendedin FAPs-GM consisting of DMEM GlutaMAX (25 mM Glc) supple-mented with 20% FBS, 10 mM Hepes, 1 mM sodium pyruvate, and100 U/ml penicillin/streptomycin (P/S). Freshly purified MuSCsgrowth medium (MuSCs-GM) consisting of DMEM GlutaMAX(25 mM Glc) supplemented with 20% FBS, 10% donor horse se-rum, 2% chicken embryo extract, 10 mM Hepes, 1 mM sodiumpyruvate, and 100 U/ml P/S. The cells were cultivated at 37°C in5% CO2.
Figure 6. Fibro/adipogenic progenitors (FAPs) mediate the beneficial effects of high-fat diet (HFD).(A) Workflow describing the FAP transduction and the transplantation strategies. FAPs were transplanted in 2-mo-old mdx recipient mice. FAPs (1.0 × 10⁵ cells) wereresuspended in 100 μl of 1× PBS and injected in the TA of mdx recipient mice. (B) After 15 d from transplantation, GFP-positive cells (red) were found in the muscleinterstitium (10× and 40× magnification; scale bar, 100 μm) (n = 3). Fibers (grey) were probed using phalloidin-488. (C) Representative immunofluorescence, showing thatGFP-positive cells co-express the FAP distinctive marker PDGFRα (n = 3). Nuclei (blue) were revealed with Hoechst 33342. (D) Dystrophic (mdx) TA muscles receiving FAPsfrom LFD- and HFD-treatedmdxmice were stained with anti-laminin antibodies to reveal the fiber outlines. (E) Bar plot reporting the average percentage of the frequencydistribution of themyofiber areas (μm2) in each experimental condition (n = 3). (E, F) Curves, inferred on the basis of the cross-sectional area distribution in (E), showing theshift toward higher fiber calibers upon transplantation ofmdx FAPs frommice fed with HFD (red line). (G) Bar plot reporting the average cross-sectional area in μm2 (n =3). Statistical significance was estimated by t test. All data are represented as mean ± SEM and statistical significance is defined as *P < 0.05; **P < 0.01; ***P < 0.001.
HFD reprograms dystrophic FAPs Rosina et al. https://doi.org/10.26508/lsa.202000660 vol 3 | no 3 | e202000646 12 of 24
Diet treatment
At the weaning day, wt andmdx littermate were individually housedand randomly assigned to the LFD or HFD group with free access tofood and water. In both groups, sexes were equally balanced betweengenotypes. Mice were fed with LFD (containing 11 kcal% fat, ResearchDiet) and HFD (containing 58 kcal% fat, Research Diet D12331) for 4 wk(28 d). Body weight, food, and water intake were monitored every 2 d.Although LFD and HFD differed in their fat content, both diets areisocaloric. Brain, spleen, liver, adipose tissue depots, and hearth wereweighted and explanted from each mouse, snap-frozen in liquidnitrogen, and stored at −80°C for further investigations.
Isolation of MuSCs and FAPs from skeletal muscles
Hind limbs were surgically removed and then minced in HBSS(GIBCO) supplemented with 100 U/ml P/S (Roche) and 0.2% BSA
(AppliChem). For each mouse, the homogeneous muscle tissuepreparation was enzymatically digested in 2 μg/μl collagenase A,2.4 U/ml dispase II, and 10 μg/ml DNase I (Roche) in Dulbecco’sphosphate-buffered saline (BioWest) w/calcium and magnesium.The enzymatic digestion was performed for 1 h at 37°C with gentleshaking. The digested tissues underwent consecutive filtrationthrough 100, 70, and 40 μm cell strainers (Corning). Before eachfiltration step, the cells were centrifuged at 700g for 10 min at 4°Cand then resuspended in fresh HBSS. Red blood cells were lysedin RBC lysis buffer (Santa Cruz). Freshly isolated muscle mono-nuclear cells were resuspended in Magnetic beads buffer (0.5%BSA and 2 mM EDTA in 1× PBS) and filtered through a 30-μm Pre-Separation Filter (Miltenyi) to remove large particles from thesingle cell suspension. The whole cell suspension underwentsubsequential incubations with the microbead-conjugated anti-bodies used for the magnetic sorting. CD45+ immune cells andCD31+ endothelial cells were collected through the consecutiveincubation with the anti-CD45 and anti-CD31 antibodies (Miltenyi).Lineage negative (Lin-) cells were incubated with anti-α7–integrinantibodies (Miltenyi) and MuSCs selected as Lin-/α7-int+ cells.Last, Lin-/α7-int+ cells were incubated with anti-Sca-1 antibodies(Miltenyi) and FAPs selected as Lin-/α7-int+/Sca-1+. The sortingprocedures and the labelling procedures with the microbead-conjugated antibodies were performed according to the manu-facturer’s instructions.
Lentiviral transduction and FAP transplantation
FAPs were isolated from 49-d-oldmdxmice fed with LFD or HFD (n =3) and transduced through spinoculation (Judson et al, 2018) withone MOI of pLenti CMV GFP Hygro (Addgene). Briefly, 1.0 × 10⁵ cellswere plated in serum-free medium (DMEM GlutaMax) in six-wellplate and one MOI of virus was administered dropwise. The platewas centrifuged using a swinger rotor adapter for 5 min at 3,200g at25°C, then for 1 h at 2,500g at 25°C. Virus-containing medium wasdiscarded and the cells were washed twice with serum-free me-dium and scraped using a soft-gummy blade cell scraper. The cellswere separated through centrifugation and resuspended in 100 μl1× PBS w/Ca2+ and Mg2+. The cells were inoculated in TA muscles ofanesthetized mice. TA muscles were collected after 15 d.
FAP culture and differentiation
Freshly sorted FAPs were resuspended in FAPs-GM consisting ofhigh-glucose (25 mM) DMEM GlutaMAX supplemented with 20% FBS,10 mM Hepes, 1 mM sodium pyruvate, and 100 U/ml P/S and platedin 96-well plates at a cell density of 3.0 × 10⁴ cells/cm2. After 3/4 d,the FAP-GMwas fully refreshed and cells cultured for two additionaldays before the induction of the adipogenic differentiation. Theadipogenic differentiation was induced incubating FAPs with theadipocyte differentiation medium (ADM: FAPs-GM supplementedwith 1 μg/ml insulin, 0.5 mM 3-isobutyl-1-methylxanthine, and 1 μMdexamethasone) for 3 d followed by two additional days in adi-pocyte maintenance medium (AMM: FAP-GM supplemented with1 μg/ml insulin). Unstimulated cells were maintained in fresh FAP-GM. For allowing spontaneous FAP growth and adipogenesis, thecells were plated in 96-well plates at a density of 7.5 × 10³ cells/cm2
Figure 7. Working model proposal of the beneficial effects of high-diet in thedystrophic milieu.A short-term high-fat diet (HFD) regimen provides a beneficial metabolicreprogramming of skeletal muscle interstitial fibro/adipogenic progenitors,dramatically affected in Duchenne muscular dystrophy. HFD restores theproper metabolic signature of dystrophic fibro/adipogenic progenitors, fuelingmitochondrial pathways of fatty acid oxidation and tricarboxylic acid cycle andmodulating the glycolytic flux. From the molecular point of view, β-catenin is acrucial hub that modulates muscle stem cells behavior. β-catenin inhibitorscasein kinase (CK1) and MEST are repressed by HFD. The inhibition of glycogensynthase kinase 3 beta (GSK-3β) activates the β-catenin signaling in turnmodulating follistatin (Fst) expression Fst, in concert with IGF1, is released tosustain the differentiation of muscle satellite cells and myotube hypertrophy. Thebeneficial effects of HFD lead to the amelioration of the dystrophic phenotype.
HFD reprograms dystrophic FAPs Rosina et al. https://doi.org/10.26508/lsa.202000660 vol 3 | no 3 | e202000646 13 of 24
Table 1. List of key materials, reagents, animal strains, and software.
Reagent or resource Source Identifier
Antibodies
Mouse mAb anti-vinculin (SPM227) Abcam Cat. no. ab18058; RRID:AB_444215
Total OXPHOS Rodent WB antibody cocktail Abcam Cat. no. ab110413; RRID:AB_2629281
Goat polyAb anti-mouse IgG (H+L)-HRP Bio-Rad Cat. no. 1721011; RRID:AB_11125936
Goat polyAb anti-rabbit IgG (H+L)-HRP Bio-Rad Cat. no. 1706515; RRID:AB_11125142
Rabbit mAb Ki67 (D3B5) Cell Signaling Technology (CST) Cat. no. 9129; RRID:AB_2687446
Rabbit mAb anti-non-phospho active β-catenin (Ser33/37/Thr41) (D13A1) CST Cat. no. 8814; RRID:AB_11127203
Rabbit mAb anti-PKM2 (D78A4) XP CST Cat. no. 4053; RRID:AB_1904096
Rabbit mAb anti-PPARγ (81B8) CST Cat. no. 2243; RRID:AB_823598
Rabbit polyAb anti-perilipin1 (D418) CST Cat. no. 3470; RRID:AB_2167268
MYH1E antibody (MF 20) Developmental Studies Hybridoma Bank Cat. no. MF 20; RRID:AB_2147781
PAX7 antibody Developmental Studies Hybridoma Bank Cat. no. PAX7; RRID:AB_2299243
F(ab9)2-goat anti-mouse IgG (H+L) cross-adsorbedsecondary antibody, Alexa Fluor 555 Invitrogen Cat. no. A-21425; RRID:AB_2535846
Goat anti-mouse IgG (H+L) cross-adsorbed secondaryantibody, Alexa Fluor 488 Invitrogen Cat. no. A-11001; RRID:AB_2534069
Alexa Fluor 488 phalloidin Invitrogen Cat. no. A12379
a7-Integrin MicroBeads, mouse Miltenyi Biotec Cat. no. 130-104-261
CD31 MicroBeads, mouse Miltenyi Biotec Cat. no. 130-097-418
CD45 MicroBeads, mouse Miltenyi Biotec Cat. no. 130-052-301
Sca1 MicroBeads, mouse Miltenyi Biotec Cat. no. 130-106-641
Goat polyAb anti-PDGFRa R&D Systems Cat. no. AF1062; RRID:AB_2236897
Rabbit polyAb MyoD (M-318) Santa Cruz Biotechnology Cat. no. sc-760; RRID:AB_2148870
Rabbit polyAb GFP antibody (FL) Santa Cruz Biotechnology Cat. no. sc-8334; RRID:AB_641123
Rabbit polyAb anti-Lamin Sigma-Aldrich Cat. no. L9393; RRID:AB_477163
Donkey anti-goat IgG(H+L), multi-species SP ads-AlexaFluor 488 SouthernBiotech Cat. no. 6425-30
Goat anti-mouse IgG(H+L), human ads-Alexa Fluor 555 SouthernBiotech Cat. no. 1031-32
Goat anti-rabbit IgG(H+L), mouse/human ads-AlexaFluor 488 SouthernBiotech Cat. no. 4050-30
Goat F(ab9)2 anti-mouse Ig, human ads-Alexa Fluor 647 SouthernBiotech Cat. no. 1012-31
CD140a (PDGFRA) monoclonal antibody (APA5), APC Thermo Fisher Scientific Cat. no. 17-1401-81; RRID:AB_529482
ITGA7 monoclonal antibody (334908), APC Thermo Fisher Scientific Cat. no. MA5-23555; RRID:AB_2607368
Pax7 antibody (SPM613) (FITC) Novus Biologicals Cat. no. NBP2-47923F
Chemicals, peptides and recombinant proteins
pLenti CMV GFP Hygro (656-4) Addgene Cat. no. 17446-LVC
Seahorse XF Base Medium Agilent Technologies Cat. no. 102353-100
Seahorse XF96 Flux Pack Agilent Technologies Cat. no. 102416-100
Bovin Serum Albumin (BSA) Fraction V AppliChem Cat. no. A1391
EDTA Applichem Cat. no. A5097
Killik, embedding medium for criostate blue Bio-Optica Cat. no. 059801
Clarity Western ECL Blotting Substrates Bio-Rad Cat. no. 10070-5061
Criterion TGX Gradient gel 4–15% Bio-Rad Cat. no. 5671085
(Continued on following page)
HFD reprograms dystrophic FAPs Rosina et al. https://doi.org/10.26508/lsa.202000660 vol 3 | no 3 | e202000646 14 of 24
Table 1. Continued
Criterion TGX Gradient gel 4–20% Bio-Rad Cat. no. 5671095
Mini-PROTEAN TGX gel 4–15% Bio-Rad Cat. no. 4561086
Mini-PROTEAN TGX gel 4–20% Bio-Rad Cat. no. 4561096
Trans-Blot Turbo Midi Nitrocellulose Membrane Bio-Rad Cat. no. 1704157
Trans-Blot Turbo Mini Nitrocellulose Membrane Bio-Rad Cat. no. 1704156
DPBS 1× w/Ca2+, Mg2+ BioWest Cat. no. L0625-500
DPBS 1× w/o Ca2+, Mg2+ BioWest Cat. no. L0615-500
Cell-Tak Cell and Tissue adhesive Corning Cat. no. 354240
Falcon 100-μm cell strainer Corning Cat. no. 352360
Falcon 40-μm cell strainer Corning Cat. no. 352340
Falcon 70-μm cell strainer Corning Cat. no. 352350
Matrigel basement membrane mix Corning Cat. no. 356234
Eukitt mounting medium Electron Microscopy Sciences Cat. no. 15320
Donor horse serum Euroclone Cat. no. ECS0090D
Fetal bovin serum (FBS) Euroclone Cat. no. ECS0180L
Goat serum Euroclone Cat. no. ECS0200D
Non-fat dried milk Euroclone Cat. no. EMR180500
Trypsin–EDTA 0.05% w/phenol red Euroclone Cat. no. ECM0920D
Dulbecco’s Modified Eagle’s Medium (DMEM) GlutaMAX GIBCO Cat. no. 61965-026
Dulbecco’s Modified Eagle’s Medium (DMEM) noglucose, no glutamine, phenol red GIBCO Cat. no. A1443001
GlutaMAX Supplement GIBCO Cat. no. 35050038
HBSS w/o Ca2+, Mg2+ GIBCO Cat. no. 14170112
Penicillin–streptomycin (P/S) 10,000 U/ml GIBCO Cat. no. 15140122
RPMI 1640 GIBCO Cat. no. 21875-091
Cell culture microplate, black Greiner Bio One Cat. no. 655090
Hoecsth 33342 Invitrogen Cat. no. H3570
MitoTracker Green FM Invitrogen Cat. no. M7514
MitoTracker Red CMXRos Invitrogen Cat. no. M7512
Novex NuPAGE Sample Reducing Agent (10×) Invitrogen Cat. no. NP0009
NuPAGE LDS Sample Buffer (4×) Invitrogen Cat. no. NP0007
TRIzol Invitrogen Cat. no. 15596026
Sodium fluoride (NaF) Millipore Cat. no. 67414
MS columns Miltenyi Biotec Cat. no. 130-042-201
Pre-separation filters (30 μm) Miltenyi Biotec Cat. no. 130-041-407
Histo-Clear Solution National diagnostics Cat. no. HS-200
Ortovanadate New England Biolabs Cat. no. P0758S
11 kcal% fat w/sucrose Surwit Diet (LFD) Research diet
58 kcal% fat w/sucrose Surwit Diet (HFD) Research diet
Cyto-Grow Resnova Cat. no. TGM-9001-A
Collagenase A Roche Cat. no. 11088793001
Dispase II Roche Cat. no. 04942078001
DNase I Roche Cat. no. 11284932001
Paraformaldehyde solution (PFA) 4% in PBS Santa Cruz Cat. no. sc-281692
(Continued on following page)
HFD reprograms dystrophic FAPs Rosina et al. https://doi.org/10.26508/lsa.202000660 vol 3 | no 3 | e202000646 15 of 24
Table 1. Continued
RBC Lysis buffer 10× Santa Cruz Biotechnology Cat. no. sc-296258
LY2090314 Selleckchem Cat. no. S7063
Chicken embryo extract Seralab Cat. no. CE-650-J
2-deoxyglucose (2-DG) Sigma-Aldrich Cat. no. D6134
3-Isobutyl-1-methylxanthine (IBMX) Sigma-Aldrich Cat. no. I5879
Antimycin Sigma-Aldrich Cat. no. A8674
D-Galactose Sigma-Aldrich Cat. no. G0750
D-Glucose Sigma-Aldrich Cat. no. G8270
Dexamethasone Sigma-Aldrich Cat. no. D4902
Dimethyl sulfoxide (DMSO) Hybri-Max Sigma-Aldrich Cat. no. D2650
EGTA Sigma-Aldrich Cat. no. E3889
Eosin Sigma-Aldrich Cat. no. E4009
FCCP Sigma-Aldrich Cat. no. C2920
Glutamine 200 mM Sigma-Aldrich Cat. no. G7513
Hematoxylin Sigma-Aldrich Cat. no. H3136
Hepes 1 M Sigma-Aldrich Cat. no. H0887
Inhibitor phosphatase mixture II Sigma-Aldrich Cat. no. P5726
Inhibitor phosphatase mixture III Sigma-Aldrich Cat. no. P0044
Insulin solution human Sigma-Aldrich Cat. no. I9278
Magnesium chloride Sigma-Aldrich Cat. no. M8266
Oil Red O Sigma-Aldrich Cat. no. O0625
Oleic acid Sigma-Aldrich Cat. no. O1008
Oligomycin Sigma-Aldrich Cat. no. O4876
Palmitic acid Sigma-Aldrich Cat. no. P0500
Phenylmethanesulfonyl fluoride (PMSF) Sigma-Aldrich Cat. no. P7626
Protease inhibitor mixture Sigma-Aldrich Cat. no. P8340
Rotenone Sigma-Aldrich Cat. no. R8875
Sodium chloride Sigma-Aldrich Cat. no. S5150
Sodium dodecyl sulfate Sigma-Aldrich Cat. no. L3771
Sodium pyruvate 100 mM Sigma-Aldrich Cat. no. S8636
TERGITOL Solution NP-40 Sigma-Aldrich Cat. no. NP40S
Triton X-100 Sigma-Aldrich Cat. no. T9284
Trizma base Sigma-Aldrich Cat. no. T1503
Tween 20 Sigma-Aldrich Cat. no. P1379
Critical commercial assays
Click-iT EdU Alexa Fluor 488 Imaging Kit Invitrogen Cat. no. C10337
CellTiter-Glo luminescent cell viability assay Promega Cat. no. G7571
Custom mouse follistatin ELISA RayBiotech Cat. no. ELM-FST-1
In situ cell death detection lit, TMR red Sigma-Aldrich Cat. no. 12156792910
Deposited data
Proteome of wt and mdx FAPs from mice fed with LFDand HFD This paper N/A
Proteome of wt andmdx MuSCs from mice fed with LFDand HFD This paper N/A
(Continued on following page)
HFD reprograms dystrophic FAPs Rosina et al. https://doi.org/10.26508/lsa.202000660 vol 3 | no 3 | e202000646 16 of 24
in FAPs-GM. The medium was refreshed every 2 d for 20 d. Metabolicperturbations were performed during the differentiation period bysupplementing ADM and AMM with 250 μM of 2-DG or by replacingGlu with Gal. Palmitate and oleate were dissolved in ethanol at 200mM. Each fatty acid was diluted separately at 3 mM in a solution of10% BSA in PBS 1× w/Ca2+, Mg2+, and incubated overnight at 37°C ingentle shaking. Solution were filtered through a syringe filter of 0.22μm. Separate stock solution were aliquoted and stored at −20°C.Freshly thawed aliquots were used for treatments. Pharmacologicalblockade of GSK3β was performed at the onset of the adipogenicdifferentiation, by supplementing ADM with 20 nM LY2090314. Furtherexperiments involving the use of LY2090314 were performed using invitro subcultured FAPs. In this case, FAPs were grown in Cyto-Grow(Resnova) by plating 2.5 × 10³ cells/cm2. The cells were not passagedmore than once and routinely checked for their multipotency. Near-to-confluent cells were dethatched and cultured as described abovein FAP-GM.
MuSC culture and differentiation
To reduce fibroblasts contamination, freshly sorted wt and mdxMuSCs were pre-plated for 2 h in pre-warmedMuSC Growth Medium(MuSCs-GM) consisting of high-glucose (25 mM) DMEM GlutaMAXsupplemented with 20% FBS, 10% donor horse serum, 2% chickenembryo extract, 10 mM Hepes, 1 mM sodium pyruvate, and 100 U/mlP/S. Pre-plated MuSCs were seeded in MuSC-GM at a cell density of1.5 × 104 cells/cm2 in Matrigel-coated 96-well plates. After 3 d, MuSC-GM was fully refreshed and cells cultured for three additional daysallowing spontaneous myotube formation. Metabolic perturbations
were carried out in the last 3 d of MuSC differentiation by incubatingcells with the MuSC-GM supplemented with 250 μM of 2-DG or byreplacing Glu with Gal.
Follistatin (FST) ELISA assay
The Follistatin concentration in FAP-derived culture supernatantswas assessed using CustomMouse Follistatin ELISA Kit (RayBiotech)according to the manufacturer’s instructions. FST standard curvewas prepared through serial dilution. FAP CM were diluted 1:4 withAssay Diluent. 100 μl of standard/samples were loaded in duplicate.Colorimetric assay was performed at 450 nm.
FAP-derived CM
Freshly sorted FAPs from mice fed with LFD and HFD were plated inFAPs-GM at a density of 3.0 × 10⁴ cells/cm2. After 4 d of culture, CMwere recovered, centrifuged at 3,000g to remove cells, and stored at−80°C before use. The control CM was prepared by incubatingempty wells with the samemedium. CM treatments were performedon 2-d cultured mdx MuSCs. Briefly, MuSC-GM was removed andreplaced by FAP-derived CMs. Cells were fixed 3 d later.
Proteome sample preparation
Cells were lysed in sodium deoxycholate (SDC) lysis buffer containing4% (wt/vol) SDC, 100 mM Tris–HCl (pH 8.5). Proteome preparation wasdone using the in StageTip (iST) method (Kulak et al, 2014). Samples
Table 1. Continued
Proteome of wt and mdx FAPs Marinkovic et al (2019) N/A
Experimental models: organisms/strains
Mouse C57BL/6J Jaxmice Cat. no. JAX:000664; RRID:IMSR_JAX:000664
Mouse C57BL10ScSn-Dmdmdx/J Jaxmice Cat. no. JAX:001801; RRID:IMSR_JAX:001801
Software and algorithms
Illustrator CC 2017 Adobe; http://www.adobe.com/products/illustrator.html RRID:SCR_010279
CytExpert software Beckman Coulter RRID:SCR_017217
Photoshop CC 2017 Adobe; https://www.adobe.com/products/photoshop.html RRID:SCR_014199
GraphPad Prism GraphPad Software; http://www.graphpad.com/ RRID:SCR_002798
Cytoscape 3.7.1 http://cytoscape.org; Shannon et al (2003) RRID:SCR_003032
Fiji http://fiji.sc; Schindelin et al (2012) RRID:SCR_002285
MaxQuant 1.5.3.6 http://www.biochem.mpg.de/5111795/maxquant; Coxand Mann (2008) RRID:SCR_014485
Perseus 1.6.2.3 http://www.perseus-framework.org; Tyanova et al(2016) RRID:SCR_015753
Seahorse Wave Desktop softwareAgilent; http://www.agilent.com/en-us/products/cell-analysis-(seahorse)/software-download-for-wave-desktop
RRID:SCR_014526
HFD reprograms dystrophic FAPs Rosina et al. https://doi.org/10.26508/lsa.202000660 vol 3 | no 3 | e202000646 17 of 24
were separated by HPLC in a single run (without pre-fractionations)and analyzed by MS.
LC-MS/MS measurements
The peptides were separated on a reverse-phase column (50 cm,packed in-house with 1.9-μm C18-Reprosil-AQ Pur reversed-phasebeads) (Dr Maisch GmbH) over 120 min (single-run proteomeanalysis). Eluting peptides were electrosprayed and analyzed bytandem MS on a Q Exactive HF (Thermo Fischer Scientific) usinghigher-energy collisional dissociation (HCD)-based fragmentation,which was set to alternate between a full scan followed by up to fivefragmentation scans.
Proteome data processing
Raw MS data were analyzed in the MaxQuant environment (Cox &Mann, 2008), version 1.5.1.6, using the Andromeda engine for da-tabase search. MS/MS spectra were matched against the MusMusculus UniProt FASTA database (September 2014), with an falsediscovery rate (FDR) of <1% at the level of proteins, peptides, andmodifications. Enzyme specificity was set to trypsin, allowing cleavageof N-terminal to proline and between aspartic acid and proline. Thesearch included cysteine carbamidomethylation as a fixed modifi-cation, and N-terminal protein acetylation and oxidation of methio-nine. Label-free proteome analysis was performed in MaxQuant.Where possible, the identity of peptides present but not sequenced ina given run was obtained by transferring identifications across LC-MSruns (“match between runs”). Up to three missed cleavages wereallowed for protease digestion and peptides had to be fully tryptic.
Proteome bioinformatics data analysis
Bioinformatics analysis was performed in the Perseus softwareenvironment (Tyanova et al, 2016). Statistical analysis of proteomewas performed on logarithmized intensities for those values thatwere found to be quantified in any experimental condition. Toidentify significantly modulated proteins, missing values (proteinsnot identified or not quantified) were imputed by using a normaldistribution. Then, we performed a t test with a P-value cutoff of0.05 and S0 = 0.1. Categorical annotation was added in Perseus inthe form of gene ontology (GO) biological process (GOBP), mo-lecular function (GOMF), and cellular component (GOCC), and KEGGpathways and Keywords (extracted from Uniprot). We performed a2D annotation enrichment analyses to identify statistically significantGO-terms, KEGG pathways, and Keywords enriched in mdx HFD FAPs(Cox&Mann, 2008). Multiple hypothesis testing is controlledby using aBenjamini-Hochberg FDR threshold of 0.07. Then for each term, thecorresponding P-value and score are assigned. Whereas a score near1 indicates a positive enrichment, a score near −1 means a negativeenrichment of the category. The complete proteome measurementsfor FAPs and MuSCs are collected in Tables S1 and S2, respectively.
Network analysis
This strategy has been previously developed and applied by ourgroup (Sacco et al, 2012, 2016). Kinase–substrate relationships and
physical interactions were extracted from SIGNOR and MINT, re-spectively (Zanzoni et al, 2002; Perfetto et al, 2015), and were mappedonto the complete human proteome in Cytoscape (Shannon et al,2003). Then the network was first filtered to maintain only relation-ships between proteins that were significantly modulated inmdx LFDFAPs compared withwt LFD FAPs and inmdx HFD FAPs compared withmdx LFD FAPs.
Flow cytometry
Immunophenotyping of Sca1+ FAPs a was performed by staining 4.0 ×10⁵ cells with anti-CD140a (APC) (PDGFRα) antibody for 30 min at 4°C.Immunophenotyping of ITGA7+ MuSCs was performed by staining 4.0 ×10⁵ cells with anti-ITGA7 (APC) antibody for 30 min at 4°C. Subse-quently, MuSCswere permeabilizedwith 0.3% Triton-X 100 in 1× PBS for15min at 4°C. Permeabilized cells were incubatedwith anti-Pax7 (FITC)for 30 min at 4°C. The cells were washed twice and analyzed usingCytoFlex Cytometer (Beckman Coulter). Data were analyzed using theCytexpert Software (Beckman Coulter).
Freshly purified wt and mdx FAPs were resuspended in FAPs-GMand incubated in the absence/presence of 10 μM carbonyl cyanide-p-trifluoromethoxyphenylhydrazone (FCCP) for 30 min at 37°C. Aftermitochondrial uncoupling, FAPs were incubated with 200 nM ofMitoTracker Red CMXRos or MitoTracker Green FM for 20 min. FAPswere washed twice with 1× PBS and fixed in 0.5% PFA before flowcytometry analysis. For each sample, 10,0003 events were recordedusing BD FACSCALIBUR (BD Biosciences).
ATP measurement
Freshly isolated FAPs were seeded at a cell density of 6 × 10⁴ cells/cm2 in 96-well plates. After 20 h, ATP content was evaluated withCellTiter-Glo Luminescent Viability Assay (Promega) according tothe manufacturer’s instructions. Briefly, CellTiter-Glo reagent wasadded at a ratio of 1:1 to cell culture medium and mixed for 2 minon an orbital shaker. Samples were transferred to a black-walled96-well plate and luminescence was recorded through Victor Mul-tilabel plate reader (PerkinElmer). Background consisted of FAP-GMincubated in the absence of FAPs and processed as described above.Data are presented as mean relative luminescence units.
Bioenergetics analysis of FAPs and MuSCs
Freshly isolated wt and mdx FAPs/MuSCs were plated on SeahorseXFe96 Microplates (Agilent Technologies) at the density of 1.4 × 10⁵
cells/cm2 and cellular bioenergetics assessed 4 d later. Alternatively,subcultured FAPs were plated at the density of 7.0 × 10⁴. After 24 h,the cells were incubated in Cyto-Grow:RPMI in 1:1 ratio for 20 h tostimulate mitochondrial functionality before assessing the cellularbioenergetics. Cartridges were hydrated overnight with Seahorse XFCalibrant and incubated at 37°C in the absence of CO2. Calibrantwas changed and refreshed 1 h before the assay. Mitochondrialstress test was performed according to Agilent’s recommendations.Briefly, the cells were washed four times with Seahorse XF BaseMedium supplemented with 10 mM glucose, 1 mM sodium pyruvate,and 2 mM glutamine (pH 7.4 ± 0.01). The cells were incubated at 37°C
HFD reprograms dystrophic FAPs Rosina et al. https://doi.org/10.26508/lsa.202000660 vol 3 | no 3 | e202000646 18 of 24

in the absence of CO2 for 1 h. Mitochondrial inhibitors were sequentiallyinjected at the following final concentrations: 1 μM oligomycin, 1.5 μMFCCP, and 1 μM/1 μM Rotenone/Antimycin (Sigma-Aldrich).
Immunoblot analysis
FAPs were washed in PBS 1× and stored at −80°C or directly lysed inice-cold radio-immunoprecipitation assay lysis buffer (150 mM NaCl,50 mM Tris–HCl, pH 7.5, 1% Nonidet P-40, 1 mM EGTA, 5 mM MgCl2, and0.1% SDS) supplemented with 1 mM PMSF, 1 mM ortovanadate, 1 mMNaF, protease inhibitor mixture 1×, inhibitor phosphatasemixture II 1×,and inhibitor phosphatase mixture III 1×. Protein lysates were sepa-rated at 15,500g for 30 min. The total protein concentration wasdetermined using the Bradford reagent. Protein extracts weredenatured andheated at 95°C for 10min inNuPAGE LDSSample Bufferthat contained DTT as a reducing agent (NuPAGE Sample ReducingAgent). According to the needs, proteins were resolved using either4–15% or 4–20% Bio-Rad Mini-PROTEAN TGX/CRITERION polyacryl-amide gels. Proteins were transferred to Trans-Blot Turbo Mini or MidiNitrocellulose Membranes using a Trans-Blot Turbo Transfer System(Bio-Rad), and the nonspecific bindingmembranes were saturated for1 h at RT in blocking solution (5% skimmedmilk powder, 0.1% Tween 20in 1× TBS). Saturated membranes were incubated overnight with thespecific primary antibodies diluted in blocking solution. Host-specificHRP-conjugated secondary antibodies were diluted in blocking so-lution and used for the detection of the primary antibodies. Chemi-luminescent detection was performed using Clarity Western ECLBlotting Substrates (Bio-Rad) and the Las-3000 Imaging System(Fujifilm). Band densities were quantified using Fiji and normalized tothe loading control. All antibodies were diluted according to themanufacturer’s instructions.
Real-time PCR
Total RNA was extracted using TRIzol from TAs, diaphragms, andFAPs. Muscles were minced in short pieces and homogenized with aDounce tissue grinder directly in TRIzol. Before resuspension, totalRNA was precipitated overnight in the presence of 10 μg of glycogen.RNA concentration was assessed using NanoDrop Lite Spectro-photometer. Total RNA (ranging between 300 and 1,000 ng) wasreverse-transcribed into cDNA with PrimeScript RT Reagent Kit.qPCR reactions were carried out with SYBR Premix Ex Taq (TliRNaseH Plus) and performed in technical duplicates for each bio-logical repeat. Each reaction mixture (final volume of 20 μl) contained50 ng of cDNA. Relative expression was estimated by 2−ΔCt as described(Livak & Schmittgen, 2001). To compare multiple runs, mRNA levelswere determined by the 2−ΔΔCtmethod (Livak & Schmittgen, 2001). Actband Tuba1a were used as reference genes. The full primer list isreported in Table 2.
Histological analysis
TA and diaphragm muscles were embedded in optimal cuttingtemperature medium and snap-frozen in liquid nitrogen. Embed-ded muscles were stored at −80°C before cryosectioning.
Prior optimal cutting temperature embedding, for GFP immu-nolabelling in transplanted TAs, muscles were fixed in 4% PFA for
4 h at RT and incubated for 4 h in sucrose gradient solutions (10%,20% and 30%). Muscles were transverse cryosectioned at 10 μmusing a Leica cryostat. Muscle sections were sequentially collectedin different glass slides, thus adjacent sections were separated atleast 100 μm from each other. Cryosections were performed for theentire length of the muscles.
For the hematoxylin and eosin stain (H&E), sections were fixed in4% PFA for 10 min at RT. Fixed sections were washed twice in 1× PBSand incubated in hematoxylin solution for 20 min. Sections wererinsed for 10 min in tap water and washed in ultrapure water.Samples were incubated with the eosin solution for 1 h. Finally,stained sections were ethanol-dehydrated, clarified with the Histo-Clear solution and mounted with the Eukitt mounting medium.
Immunofluorescence
Cells and sections were fixed in 2% PFA for 15 min at RT. For im-munocytochemistry fixed cells were washed twice in 1× PBS andincubated in permeabilization solution (0.5% Triton X-100 in 1× PBS)for 5 min. Unspecific binding were saturated by incubating samplesin blocking solution (10% FBS and 0.1% Triton X-100 in 1× PBS) for 1 h.The cells were incubated overnight at 4°C in gentle shaking in thepresence of the primary antibodies. The cells were washed fourtimes with 0.1% Triton X-100 in 1× PBS and incubated, for 30 min atRT, with host-specific secondary antibodies. Primary and secondaryantibodies were diluted according to the manufacturer’s recom-mendations in blocking solution. Finally, the cells were washed fourtimes with 0.1% Triton X-100 in 1× PBS and counterstained for 5 minat RT with the Hoechst solution (1 mg/ml Hoechst 33342 and 0.1%Triton X-100 in 1× PBS). Cells were washed twice with 1× PBS andstored at 4°C.
For muscle section immunofluorescence, different protocolswere adapted according to the antigen of interest. For lamininstaining, fixed sections were washed twice in 1× PBS and per-meabilized (0.3% Triton X-100 in 1× PBS) for 30 min at RT. Per-meabilized slices were incubated in blocking solution (10% goatserum, 1% glycine, and 0.1% Triton X-100 in 1× PBS) for 1 h at RT.Blocked specimen were incubated overnight at 4°C in the presenceof anti-laminin (Sigma-Aldrich) diluted 1:200 in blocking solution.
For the in situ detection of PDGFRα, fixed and permeabilizedsections were blocked for 30 min in protein block serum-free re-agent (DAKO) and then incubated overnight with anti-PDGFRα di-luted 1:80 in a carrier solution (4% BSA in 1× PBS). After incubationwith the primary antibodies, the sections were washed four timeswith 0.1% Triton X-100 in 1× PBS and incubated for 30 min at RT withhost-specific secondary antibodies. Nuclei were revealed by in-cubating samples for 10 min with Hoechst solution. The sectionswere washed twice in 1× PBS and mounted with Aqua Poly/Mountmounting medium.
TUNEL assay
In situ detection of apoptotic nuclei was performed through the InSitu Cell Death Detection Kit, TMR red (Sigma-Aldrich). Cells werefixed with 2% PFA for 20 min at RT and permeabilized with 0.5%Triton X-100 in 1× PBS for 5 min at RT. Positive controls were treatedwith DNAse I (3 U/ml in 50 mM Tris–HCl, pH 7.5, and 1 mg/ml BSA) for
HFD reprograms dystrophic FAPs Rosina et al. https://doi.org/10.26508/lsa.202000660 vol 3 | no 3 | e202000646 19 of 24
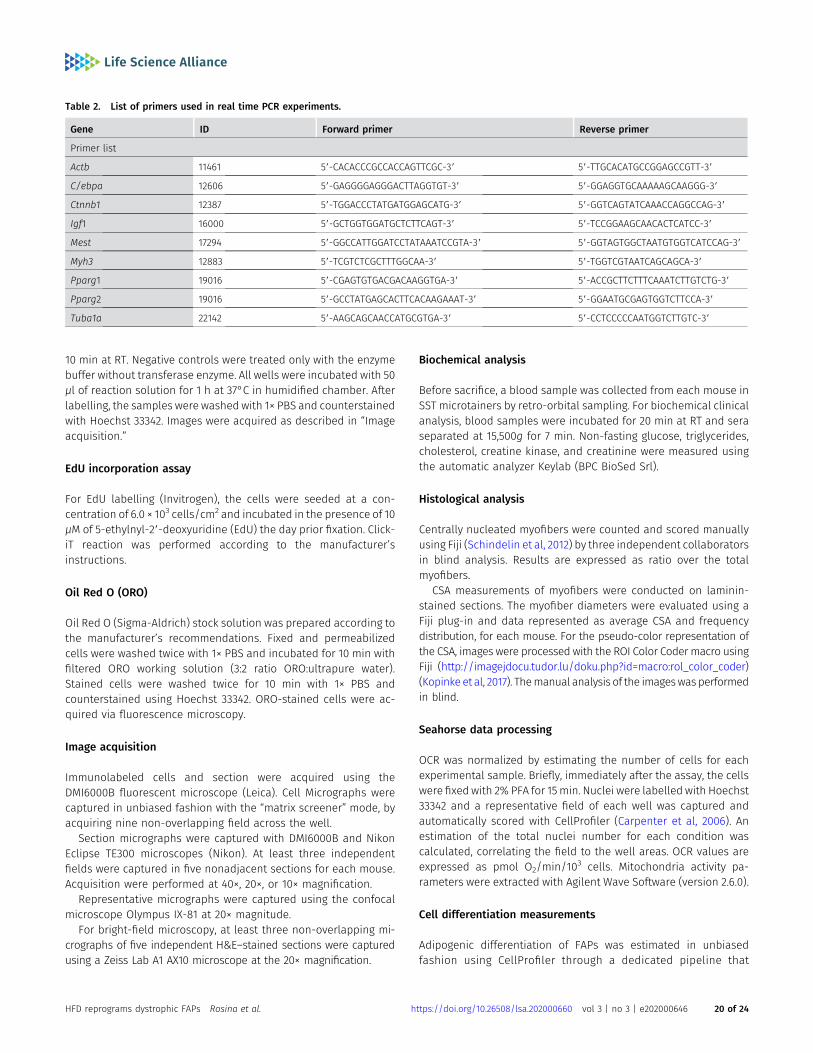
10 min at RT. Negative controls were treated only with the enzymebuffer without transferase enzyme. All wells were incubated with 50μl of reaction solution for 1 h at 37°C in humidified chamber. Afterlabelling, the samples were washed with 1× PBS and counterstainedwith Hoechst 33342. Images were acquired as described in “Imageacquisition.”
EdU incorporation assay
For EdU labelling (Invitrogen), the cells were seeded at a con-centration of 6.0 × 10³ cells/cm2 and incubated in the presence of 10μM of 5-ethylnyl-29-deoxyuridine (EdU) the day prior fixation. Click-iT reaction was performed according to the manufacturer’sinstructions.
Oil Red O (ORO)
Oil Red O (Sigma-Aldrich) stock solution was prepared according tothe manufacturer’s recommendations. Fixed and permeabilizedcells were washed twice with 1× PBS and incubated for 10 min withfiltered ORO working solution (3:2 ratio ORO:ultrapure water).Stained cells were washed twice for 10 min with 1× PBS andcounterstained using Hoechst 33342. ORO-stained cells were ac-quired via fluorescence microscopy.
Image acquisition
Immunolabeled cells and section were acquired using theDMI6000B fluorescent microscope (Leica). Cell Micrographs werecaptured in unbiased fashion with the “matrix screener” mode, byacquiring nine non-overlapping field across the well.
Section micrographs were captured with DMI6000B and NikonEclipse TE300 microscopes (Nikon). At least three independentfields were captured in five nonadjacent sections for each mouse.Acquisition were performed at 40×, 20×, or 10× magnification.
Representative micrographs were captured using the confocalmicroscope Olympus IX-81 at 20× magnitude.
For bright-field microscopy, at least three non-overlapping mi-crographs of five independent H&E–stained sections were capturedusing a Zeiss Lab A1 AX10 microscope at the 20× magnification.
Biochemical analysis
Before sacrifice, a blood sample was collected from each mouse inSST microtainers by retro-orbital sampling. For biochemical clinicalanalysis, blood samples were incubated for 20 min at RT and seraseparated at 15,500g for 7 min. Non-fasting glucose, triglycerides,cholesterol, creatine kinase, and creatinine were measured usingthe automatic analyzer Keylab (BPC BioSed Srl).
Histological analysis
Centrally nucleated myofibers were counted and scored manuallyusing Fiji (Schindelin et al, 2012) by three independent collaboratorsin blind analysis. Results are expressed as ratio over the totalmyofibers.
CSA measurements of myofibers were conducted on laminin-stained sections. The myofiber diameters were evaluated using aFiji plug-in and data represented as average CSA and frequencydistribution, for each mouse. For the pseudo-color representation ofthe CSA, images were processed with the ROI Color Coder macro usingFiji (http://imagejdocu.tudor.lu/doku.php?id=macro:rol_color_coder)(Kopinke et al, 2017). Themanual analysis of the imageswas performedin blind.
Seahorse data processing
OCR was normalized by estimating the number of cells for eachexperimental sample. Briefly, immediately after the assay, the cellswere fixed with 2% PFA for 15min. Nuclei were labelled with Hoechst33342 and a representative field of each well was captured andautomatically scored with CellProfiler (Carpenter et al, 2006). Anestimation of the total nuclei number for each condition wascalculated, correlating the field to the well areas. OCR values areexpressed as pmol O2/min/103 cells. Mitochondria activity pa-rameters were extracted with Agilent Wave Software (version 2.6.0).
Cell differentiation measurements
Adipogenic differentiation of FAPs was estimated in unbiasedfashion using CellProfiler through a dedicated pipeline that
Table 2. List of primers used in real time PCR experiments.
Gene ID Forward primer Reverse primer
Primer list
Actb 11461 59-CACACCCGCCACCAGTTCGC-39 59-TTGCACATGCCGGAGCCGTT-39
C/ebpa 12606 59-GAGGGGAGGGACTTAGGTGT-39 59-GGAGGTGCAAAAAGCAAGGG-39
Ctnnb1 12387 59-TGGACCCTATGATGGAGCATG-39 59-GGTCAGTATCAAACCAGGCCAG-39
Igf1 16000 59-GCTGGTGGATGCTCTTCAGT-39 59-TCCGGAAGCAACACTCATCC-39
Mest 17294 59-GGCCATTGGATCCTATAAATCCGTA-39 59-GGTAGTGGCTAATGTGGTCATCCAG-39
Myh3 12883 59-TCGTCTCGCTTTGGCAA-39 59-TGGTCGTAATCAGCAGCA-39
Pparg1 19016 59-CGAGTGTGACGACAAGGTGA-39 59-ACCGCTTCTTTCAAATCTTGTCTG-39
Pparg2 19016 59-GCCTATGAGCACTTCACAAGAAAT-39 59-GGAATGCGAGTGGTCTTCCA-39
Tuba1a 22142 59-AAGCAGCAACCATGCGTGA-39 59-CCTCCCCCAATGGTCTTGTC-39
HFD reprograms dystrophic FAPs Rosina et al. https://doi.org/10.26508/lsa.202000660 vol 3 | no 3 | e202000646 20 of 24
recognize, for each captured field, the ORO-positive area (expressedin pixels). The modules of the pipeline were routinely adjusted inagreement with the image magnifications. The average ORO-positivearea was normalized over the average number of cells per field.Alternatively, the percentage of adipogenic differentiation wasevaluated by counting the number of adipocytes over the total cellsin each field. Positive objects were manually scored using Fiji by twoindependent collaborators.
Adipocyte dimension was evaluated by measuring the area ofeach lipid droplet associated with each adipocyte. Briefly, threerandomly and non-overlapping field of perilipin-stained adi-pocytes were acquired at 40× magnification. The area of eachlipid droplet was delimited using the “Frehand selection” tool ofFiji. At least 15 adipocytes for each field were included in theanalysis.
Myogenic differentiation of MuSCs was scored manually usingFiji, by calculating the fusion index. Fusion index was defined as theratio between the number of nuclei included into MyHC-expressingcells (containing at least three nuclei) over the number of nuclei foreach field.
The percentage of EdU-positive cells was estimated in unbiasedfashion through a dedicated pipeline using CellProfiler.
Before automated analysis, a supervised control of each Cell-Profiler module was performed to ensure the proper recognition ofthe markers of interest. The manual analysis of the images wasperformed in blind.
Statistical analysis
Data are represented as mean ± SEM of at least three independentexperimental samples unless otherwise mentioned. In addition,cell studies were further performed at least in technical duplicates.Statistical significance between two groups was estimated usingthe unpaired t test assuming a two-tailed distribution. Multiplecomparisons between three or more groups were performed usingone-way or two-way ANOVA. Statistical significance is defined as *P< 0.05; **P < 0.01; ***P < 0.001. All statistical analyses were performedusing Prism 7 (GraphPad).
Contact for reagent and resource sharing
Further information for reagents may be directed to, and will befulfilled by the lead contact, Francesca Sacco ([email protected]).
Data and software availability
The datasets generated and/or analyzed in the current study areavailable from the corresponding authors on reasonable request.
Supplementary Information
Supplementary Information is available at https://doi.org/10.26508/lsa.202000660.
Acknowledgements
This work was supported by a grant of the European Research Council (grantnumber 322749 [G Cesareni]) and by Rita Levi Montalcini grant, Ministerodell'Istruzione, Universita e Ricerca (MIUR) (F Sacco). This work was partlysupported by a grant from the Italian association for cancer research (AIRC)to G Cesareni (Investigator Grant - IG 2013). A Reggio was supported byFondazione Umberto Veronesi. The authors warmly thank Prof Maria RosaCiriolo, from the Department of Biology of the University of Rome Tor Vergatafor her kind contribution during the critical evaluation of the manuscript.
Author Contributions
A Reggio: conceptualization, data curation, formal analysis, in-vestigation, visualization, methodology, and writing—original draft,review, and editing.M Rosina: conceptualization, data curation, formal analysis, in-vestigation, visualization, methodology, and writing—original draft,review, and editing.N Krahmer: investigation and methodology.A Palma: investigation and methodology.LL Petrilli: investigation.G Maiolatesi: investigation.G Massacci: investigation.I Salvatori: investigation and methodology.C Valle: resources, investigation, methodology, and writing—reviewand editing.S Testa: resources, investigation, methodology, and writing—reviewand editing.C Gargioli: investigation, visualization, and methodology.C Fuoco: investigation, visualization, and methodology.L Castagnoli: conceptualization, resources, supervision, investiga-tion, visualization, methodology, and writing—review and editing.G Cesareni: conceptualization, resources, supervision, funding ac-quisition, visualization, methodology, project administration, andwriting—review and editing.F Sacco: conceptualization, resources, data curation, formal anal-ysis, supervision, funding acquisition, visualization, methodology,project administration, and writing—original draft, review, andediting.
Conflict of Interest Statement
The authors declare that they have no conflict of interest.
References
Amit S, Hatzubai A, Birman Y, Andersen JS, Ben-Shushan E, Mann M, Ben-Neriah Y, Alkalay I (2002) Axin-mediated CKI phosphorylation of beta-catenin at Ser 45: A molecular switch for the Wnt pathway. Genes Dev16: 1066–1076. doi:10.1101/gad.230302
Anderson RM, Barger JL, Edwards MG, Braun KH, O’Connor CE, Prolla TA,Weindruch R (2008) Dynamic regulation of PGC-1alpha localizationand turnover implicates mitochondrial adaptation in calorierestriction and the stress response. Aging Cell 7: 101–111. doi:10.1111/j.1474-9726.2007.00357.x
HFD reprograms dystrophic FAPs Rosina et al. https://doi.org/10.26508/lsa.202000660 vol 3 | no 3 | e202000646 21 of 24

Arnold L, Henry A, Poron F, Baba-Amer Y, van Rooijen N, Plonquet A, GherardiRK, Chazaud B (2007) Inflammatory monocytes recruited after skeletalmuscle injury switch into antiinflammatory macrophages to supportmyogenesis. J Exp Med 204: 1057–1069. doi:10.1084/jem.20070075
Banfi S, D’Antona G, Ruocco C, Meregalli M, Belicchi M, Bella P, Erratico S,Donato E, Rossi F, Bifari F, et al (2018) Supplementation with aselective amino acid formula ameliorates muscular dystrophy in mdxmice. Sci Rep 8: 14659. doi:10.1038/s41598-018-32613-w
Bansal D, Miyake K, Vogel SS, Groh S, Chen CC, Williamson R, McNeil PL,Campbell KP (2003) Defective membrane repair in dysferlin-deficientmuscular dystrophy. Nature 423: 168–172. doi:10.1038/nature01573
Barker RG, Horvath D, van der Poel C, Murphy RM (2017) Benefits of prenataltaurine supplementation in preventing the onset of acute damage inthe mdx mouse. PLoS Curr 9. doi:10.1371/currents.md.9a3e357a0154d01050b591601cbd4fdb
Brandhorst S, Choi IY, Wei M, Cheng CW, Sedrakyan S, Navarrete G, Dubeau L,Yap LP, Park R, Vinciguerra M, et al (2015) A periodic diet that mimicsfasting promotes multi-system regeneration, enhanced cognitiveperformance, and healthspan. Cell Metab 22: 86–99. doi:10.1016/j.cmet.2015.05.012
Calderone A, Castagnoli L, Cesareni G (2013) Mentha: A resource for browsingintegrated protein-interaction networks. Nat Methods 10: 690–691.doi:10.1038/nmeth.2561
Carpenter AE, Jones TR, Lamprecht MR, Clarke C, Kang IH, Friman O, GuertinDA, Chang JH, Lindquist RA, Moffat J, et al (2006) CellProfiler: Imageanalysis software for identifying and quantifying cell phenotypes.Genome Biol 7: R100. doi:10.1186/gb-2006-7-10-r100
Cerletti M, Jang YC, Finley LWS, Haigis MC, Wagers AJ (2012) Short-term calorierestriction enhances skeletal muscle stem cell function. Cell Stem Cell10: 515–519. doi:10.1016/j.stem.2012.04.002
Chen ZL, ShaoWJ, Xu F, Liu L, Lin BS, Wei XH, Song ZL, Lu HG, Fantus IG, Weng JP,et al (2015) Acute Wnt pathway activation positively regulates leptingene expression in mature adipocytes. Cell Signal 27: 587–597.doi:10.1016/j.cellsig.2014.12.012
Christov C, Chretien F, Abou-Khalil R, Bassez G, Vallet G, Authier FJ, BassagliaY, Shinin V, Tajbakhsh S, Chazaud B, et al (2007) Muscle satellite cellsand endothelial cells: Close neighbors and privileged partners. MolBiol Cell 18: 1397–1409. doi:10.1091/mbc.E06-08-0693
Civitarese AE, Carling S, Heilbronn LK, Hulver MH, Ukropcova B, Deutsch WA,Smith SR, Ravussin E, CALERIE Pennington Team (2007) Calorierestriction increases muscle mitochondrial biogenesis in healthyhumans. PLoS Med 4: e76. doi:10.1371/journal.pmed.0040076
Cox J, Mann M (2008) MaxQuant enables high peptide identification rates,individualized p.p.b.-range mass accuracies and proteome-wideprotein quantification. Nat Biotechnol 26: 1367–1372. doi:10.1038/nbt.1511
Dellavalle A, Maroli G, Covarello D, Azzoni E, Innocenzi A, Perani L, Antonini S,Sambasivan R, Brunelli S, Tajbakhsh S, et al (2011) Pericytes resident inpostnatal skeletal muscle differentiate into muscle fibres andgenerate satellite cells. Nat Commun 2: 499. doi:10.1038/ncomms1508
Emery AE (1998) The muscular dystrophies. BMJ 317: 991–995. doi:10.1007/978-1-4939-6430-7_4310.1136/bmj.317.7164.991
Hafner P, Bonati U, Erne B, Schmid M, Rubino D, Pohlman U, Peters T, Rutz E,Frank S, Neuhaus C, et al (2016) Improved muscle function inDuchenne muscular dystrophy through L-arginine and metformin: Aninvestigator-initiated, open-label, single-center, proof-of-concept-study. PLoS One 11: e0147634. doi:10.1371/journal.pone.0147634
Han R, Rader EP, Levy JR, Bansal D, Campbell KP (2011) Dystrophin deficiencyexacerbates skeletal muscle pathology in dysferlin-null mice. SkeletMuscle 1: 35. doi:10.1186/2044-5040-1-35
Heredia JE, Mukundan L, Chen FM, Mueller AA, Deo RC, Locksley RM, Rando TA,Chawla A (2013) Type 2 innate signals stimulate fibro/adipogenic
progenitors to facilitate muscle regeneration. Cell 153: 376–388.doi:10.1016/j.cell.2013.02.053
Hogarth MW, Defour A, Lazarski C, Gallardo E, Manera JD, Partridge TA,Nagaraju K, Jaiswal JK (2019) Fibroadipogenic progenitors areresponsible for muscle loss in limb girdle muscular dystrophy 2B. NatCommun 10: 2430. doi:10.1038/s41467-019-10438-z
Joe AWB, Yi L, Natarajan A, Le Grand F, So L, Wang J, Rudnicki MA, Rossi FMV(2010) Muscle injury activates resident fibro/adipogenic progenitorsthat facilitate myogenesis. Nat Cell Biol 12: 153–163. doi:10.1038/ncb2015
Jones AE, Price FD, Le Grand F, Soleimani VD, Dick SA, Megeney LA, RudnickiMA (2015) Wnt/β-catenin controls follistatin signalling to regulatesatellite cell myogenic potential. Skelet Muscle 5: 14. doi:10.1186/s13395-015-0038-6
Joseph J, Cho D, Doles J (2018) Metabolomic analyses reveal extensiveprogenitor cell deficiencies in a mouse model of Duchenne musculardystrophy. Metabolites 8: 61. doi:10.3390/metabo8040061
Juban G, Saclier M, Yacoub-Youssef H, Kernou A, Arnold L, Boisson C, Ben-Larbi S, Magnan M, Cuvellier S, Theret M, et al (2018) AMPK activationregulates LTBP4-dependent TGF-β1 secretion by pro-inflammatorymacrophages and controls fibrosis in Duchenne muscular dystrophy.Cell Rep 25: 2163–2176.e6. doi:10.1016/j.celrep.2018.10.077
Judson RN, Quarta M, Oudhoff MJ, Soliman H, Yi L, Chang CK, Loi G, VanderWerff R, Cait A, Hamer M, et al (2018) Inhibition of methyltransferaseSetd7 allows the in vitro expansion of myogenic stem cells withimproved therapeutic potential. Cell Stem Cell 22: 177–190.e7.doi:10.1016/j.stem.2017.12.010
Kelstrup CD, Bekker-Jensen DB, Arrey TN, Hogrebe A, Harder A, Olsen JV (2018)Performance evaluation of the Q exactive HF-X for shotgunproteomics. J Proteome Res 17: 727–738. doi:10.1021/acs.jproteome.7b00602
Knobloch M, Pilz GA, Ghesquière B, Kovacs WJ, Wegleiter T, Moore DL, HruzovaM, Zamboni N, Carmeliet P, Jessberger S (2017) A fatty acid oxidation-dependent metabolic shift regulates adult neural stem cell activity.Cell Rep 20: 2144–2155. doi:10.1016/j.celrep.2017.08.029
Kopinke D, Roberson EC, Reiter JF (2017) Ciliary hedgehog signaling restrictsinjury-induced adipogenesis. Cell 170: 340–351.e12. doi:10.1016/j.cell.2017.06.035
Kulak NA, Pichler G, Paron I, Nagaraj N, Mann M (2014) Minimal, encapsulatedproteomic-sample processing applied to copy-number estimation ineukaryotic cells. Nat Methods 11: 319–324. doi:10.1038/nmeth.2834
Kunnimalaiyaan S, Schwartz VK, Jackson IA, Clark Gamblin T, KunnimalaiyaanM (2018) Antiproliferative and apoptotic effect of LY2090314, a GSK-3inhibitor, in neuroblastoma in vitro. BMC Cancer 18: 560. doi:10.1186/s12885-018-4474-7
Kuswanto W, Burzyn D, Panduro M, Wang KK, Jang YC, Wagers AJ, Benoist C,Mathis D (2016) Poor repair of skeletal muscle in aging mice reflects adefect in local, interleukin-33-dependent accumulation of regulatoryT cells. Immunity 44: 355–367. doi:10.1016/j.immuni.2016.01.009
Latres E, Amini AR, Amini AA, Griffiths J, Martin FJ, Wei Y, Lin HC, YancopoulosGD, Glass DJ (2005) Insulin-like growth factor-1 (IGF-1) inverselyregulates atrophy-induced genes via the phosphatidylinositol 3-kinase/Akt/mammalian target of rapamycin (PI3K/Akt/mTOR)pathway. J Biol Chem 280: 2737–2744. doi:10.1074/jbc.M407517200
Lees-Shepard JB, Yamamoto M, Biswas AA, Stoessel SJ, Nicholas SE, CogswellCA, Devarakonda PM, Schneider MJ, Cummins SM, Legendre NP, et al(2018) Activin-dependent signaling in fibro/adipogenic progenitorscauses fibrodysplasia ossificans progressiva. Nat Commun 9: 471.doi:10.1038/s41467-018-02872-2
Lemos DR, Babaeijandaghi F, Low M, Chang CK, Lee ST, Fiore D, Zhang RH,Natarajan A, Nedospasov SA, Rossi FMV (2015) Nilotinib reducesmuscle fibrosis in chronic muscle injury by promoting TNF-mediated
HFD reprograms dystrophic FAPs Rosina et al. https://doi.org/10.26508/lsa.202000660 vol 3 | no 3 | e202000646 22 of 24

apoptosis of fibro/adipogenic progenitors. Nat Med 21: 786–794.doi:10.1038/nm.3869
Lepper C, Partridge TA, Fan C-M (2011) An absolute requirement for Pax7-positive satellite cells in acute injury-induced skeletal muscleregeneration. Development 138: 3639–3646. doi:10.1242/dev.067595
Li W, Zhu C, Li Y, Wu Q, Gao R (2014) Mest attenuates CCl4-induced liverfibrosis in rats by inhibiting the Wnt/β-catenin signaling pathway. GutLiver 8: 282–291. doi:10.5009/gnl.2014.8.3.282
Lindsay A, Chamberlain CM, Witthuhn BA, Lowe DA, Ervasti JM (2018)Dystrophinopathy-associated dysfunction of Krebs cycle metabolism.Hum Mol Genet 71: 304–310. doi:10.1093/hmg/ddy404
Livak KJ, Schmittgen TD (2001) Analysis of relative gene expression data usingreal-time quantitative PCR and the 2(-Delta Delta C(T)) Method.Methods 25: 402–408. doi:10.1006/meth.2001.1262
Ljubicic V, Jasmin BJ (2015) Metformin increases peroxisome proliferator-activated receptor γ Co-activator-1α and utrophin a expression indystrophic skeletal muscle. Muscle Nerve 52: 139–142. doi:10.1002/mus.24692
Lunt SY, Vander Heiden MG (2011) Aerobic glycolysis: Meeting the metabolicrequirements of cell proliferation. Annu Rev Cell Dev Biol 27: 441–464.doi:10.1146/annurev-cellbio-092910-154237
Marinkovic M, Fuoco C, Sacco F, Cerquone Perpetuini A, Giuliani G, Micarelli E,Pavlidou T, Petrilli LL, Reggio A, Riccio F, et al (2019) Fibro-adipogenicprogenitors of dystrophic mice are insensitive to NOTCH regulation ofadipogenesis. Life Sci Alliance 2: e201900437. doi:10.26508/lsa.201900437
Mazurek S (2011) Pyruvate kinase type M2: A key regulator of the metabolicbudget system in tumor cells. Int J Biochem Cell Biol 43: 969–980.doi:10.1016/j.biocel.2010.02.005
Milad N, White Z, Tehrani AY, Sellers S, Rossi FMV, Bernatchez P (2017)Increased plasma lipid levels exacerbate muscle pathology in themdx mouse model of Duchenne muscular dystrophy. Skelet Muscle 7:19. doi:10.1186/s13395-017-0135-9
Mozzetta C, Consalvi S, Saccone V, Tierney M, Diamantini A, Mitchell KJ,Marazzi G, Borsellino G, Battistini L, Sassoon D, et al (2013)Fibroadipogenic progenitors mediate the ability of HDAC inhibitors topromote regeneration in dystrophic muscles of young, but not oldMdx mice. EMBO Mol Med 5: 626–639. doi:10.1002/emmm.201202096
Murphy MM, Lawson JA, Mathew SJ, Hutcheson DA, Kardon G (2011) Satellitecells, connective tissue fibroblasts and their interactions are crucialfor muscle regeneration. Development 138: 3625–3637. doi:10.1242/dev.064162
Ohlendieck K, Campbell KP (1991) Dystrophin-associated proteins are greatlyreduced in skeletal muscle from mdx mice. J Cell Biol 115: 1685–1694.doi:10.1083/jcb.115.6.1685
Onopiuk M, Brutkowski W, Wierzbicka K, Wojciechowska S, Szczepanowska J,Fronk J, Lochmüller H, Górecki DC, Zabłocki K (2009) Mutation indystrophin-encoding gene affects energy metabolism in mousemyoblasts. Biochem Biophys Res Commun 386: 463–466. doi:10.1016/j.bbrc.2009.06.053
Pala F, Di Girolamo D, Mella S, Yennek S, Chatre L, Ricchetti M, Tajbakhsh S(2018) Distinct metabolic states govern skeletal muscle stem cell fatesduring prenatal and postnatal myogenesis. J Cell Sci 131: jcs212977.doi:10.1242/jcs.212977
Palamiuc L, Schlagowski A, Ngo ST, Vernay A, Dirrig-Grosch S, Henriques A,Boutillier AL, Zoll J, Echaniz-Laguna A, Loeffler JP, et al (2015) Ametabolic switch toward lipid use in glycolytic muscle is an earlypathologic event in a mouse model of amyotrophic lateral sclerosis.EMBO Mol Med 7: 526–546. doi:10.15252/emmm.201404433
Passaquin AC, Renard M, Kay L, Challet C, Mokhtarian A, Wallimann T, RueggUT (2002) Creatine supplementation reduces skeletal muscledegeneration and enhances mitochondrial function in mdx mice.Neuromuscul Disord 12: 174–182. doi:10.1016/s0960-8966(01)00273-5
Pauly M, Daussin F, Burelle Y, Li T, Godin R, Fauconnier J, Koechlin-RamonatxoC, Hugon G, Lacampagne A, Coisy-Quivy M, et al (2012) AMPK activationstimulates autophagy and ameliorates muscular dystrophy in themdx mouse diaphragm. Am J Pathol 181: 583–592. doi:10.1016/j.ajpath.2012.04.004
Percival JM, Siegel MP, Knowels G, Marcinek DJ (2012) Defects inmitochondriallocalization and ATP synthesis in the mdx mouse model of Duchennemuscular dystrophy are not alleviated by PDE5 inhibition. Hum MolGenet 22: 153–167. doi:10.1093/hmg/dds415
Perfetto L, Briganti L, Calderone A, Perpetuini AC, Iannuccelli M, Langone F,Licata L, Marinkovic M, Mattioni A, Pavlidou T, et al (2015) SIGNOR: Adatabase of causal relationships between biological entities. NucleicAcids Res. doi:10.1093/nar/gkv1048
Petrof BJ, Shrager JB, Stedman HH, Kelly AM, Sweeney HL (1993) Dystrophinprotects the sarcolemma from stresses developed during musclecontraction. Proc Natl Acad Sci U S A 90: 3710–3714. doi:10.1073/pnas.90.8.3710
Radley-Crabb HG, Fiorotto ML, Grounds MD (2011) The different impact of ahigh fat diet on dystrophic mdx and control C57Bl/10 mice. PLoS Curr3: RRN1276. doi:10.1371/currents.RRN1276
Reggio A, Rosina M, Palma A, Cerquone Perpetuini A, Petrilli LL, Gargioli C,Fuoco C, Micarelli E, Giuliani G, Cerretani M, et al (2019a) Adipogenesisof Skeletal Muscle Fibro/Adipogenic Progenitors Is Controlled by theWNT5a/GSK3/β-Catenin Axis. Rochester, NY: Social Science ResearchNetwork.
Reggio A, Spada F, Rosina M, Massacci G, Zuccotti A, Fuoco C, Gargioli C,Castagnoli L, Cesareni G (2019b) The immunosuppressant drugazathioprine restrains adipogenesis of muscle Fibro/AdipogenicProgenitors from dystrophic mice by affecting AKT signaling. Sci Rep 9:4360. doi:10.1038/s41598-019-39538-y
Rizzieri DA, Cooley S, Odenike O, Moonan L, Chow KH, Jackson K, Wang X, BrailL, Borthakur G (2016) An open-label phase 2 study of glycogensynthase kinase-3 inhibitor LY2090314 in patients with acuteleukemia. Leuk Lymphoma 57: 1800–1806. doi:10.3109/10428194.2015.1122781
Rodrıguez-Cruz M, Sanchez R, Escobar RE, Cruz-Guzman ODR, Lopez-AlarconM, Bernabe Garcia M, Coral-Vazquez R, Matute G, Velazquez Wong AC(2015) Evidence of insulin resistance and other metabolic alterationsin boys with Duchenne or becker muscular dystrophy. Int J Endocrinol2015: 867273–867278. doi:10.1155/2015/867273
Rudolf A, Schirwis E, Giordani L, Parisi A, Lepper C, Taketo MM, Le Grand F(2016) β-Catenin activation inmuscle progenitor cells regulates tissuerepair. Cell Rep 15: 1277–1290. doi:10.1016/j.celrep.2016.04.022
Ryall JG, Dell’Orso S, Derfoul A, Juan A, Zare H, Feng X, Clermont D, Koulnis M,Gutierrez-Cruz G, Fulco M, et al (2015) The NAD(+)-dependent SIRT1deacetylase translates a metabolic switch into regulatory epigeneticsin skeletal muscle stem cells. Cell Stem Cell 16: 171–183. doi:10.1016/j.stem.2014.12.004
Rybalka E, Timpani CA, Cooke MB, Williams AD, Hayes A (2014) Defects inmitochondrial ATP synthesis in dystrophin-deficient mdx skeletalmuscles may be caused by complex I insufficiency. PLoS One 9:e115763. doi:10.1371/journal.pone.0115763
Sacco F, Gherardini PF, Paoluzi S, Saez-Rodriguez J, Helmer-Citterich M,Ragnini-Wilson A, Castagnoli L, Cesareni G (2012) Mapping the humanphosphatome on growth pathways. Mol Syst Biol 8: 603. doi:10.1038/msb.2012.36
Sacco F, Silvestri A, Posca D, Pirro S, Gherardini PF, Castagnoli L, Mann M,Cesareni G (2016) Deep proteomics of breast cancer cells reveals thatmetformin rewires signaling networks away from a pro-growth state.Cell Syst 2: 159–171. doi:10.1016/j.cels.2016.02.005
Sambasivan R, Yao R, Kissenpfennig A, Van Wittenberghe L, Paldi A, Gayraud-Morel B, Guenou H, Malissen B, Tajbakhsh S, Galy A (2011) Pax7-
HFD reprograms dystrophic FAPs Rosina et al. https://doi.org/10.26508/lsa.202000660 vol 3 | no 3 | e202000646 23 of 24

expressing satellite cells are indispensable for adult skeletal muscleregeneration. Development 138: 3647–3656. doi:10.1242/dev.067587
Schindelin J, Arganda-Carreras I, Frise E, Kaynig V, Longair M, Pietzsch T,Preibisch S, Rueden C, Saalfeld S, Schmid B, et al (2012) Fiji: An open-source platform for biological-image analysis. Nat Methods 9:676–682. doi:10.1038/nmeth.2019
Schuh RA, Jackson KC, Khairallah RJ, Ward CW, Spangenburg EE (2012)Measuring mitochondrial respiration in intact single muscle fibers.Am J Physiol Regul Integr Comp Physiol 302: R712–R719. doi:10.1152/ajpregu.00229.2011
Seale P, Ishibashi J, Scime A, Rudnicki MA (2004) Pax7 is necessary andsufficient for the myogenic specification of CD45+:Sca1+ stem cellsfrom injured muscle. PLoS Biol 2: E130. doi:10.1371/journal.pbio.0020130
Shannon P, Markiel A, Ozier O, Baliga NS, Wang JT, Ramage D, Amin N,Schwikowski B, Ideker T (2003) Cytoscape: A software environment forintegrated models of biomolecular interaction networks. Genome Res13: 2498–2504. doi:10.1101/gr.1239303
Timpani CA, Hayes A, Rybalka E (2015) Revisiting the dystrophin-ATPconnection: How half a century of research still implicatesmitochondrial dysfunction in Duchenne Muscular Dystrophyaetiology. Med Hypotheses 85: 1021–1033. doi:10.1016/j.mehy.2015.08.015
Tyanova S, Temu T, Sinitcyn P, Carlson A, Hein MY, Geiger T, Mann M, Cox J(2016) The Perseus computational platform for comprehensiveanalysis of (prote)omics data. Nat Methods 13: 731–740. doi:10.1038/nmeth.3901
Uezumi A, Fukada S-I, Yamamoto N, Takeda S, Tsuchida K (2010)Mesenchymal progenitors distinct from satellite cells contribute to
ectopic fat cell formation in skeletal muscle. Nat Cell Biol 12: 143–152.doi:10.1038/ncb2014
Uezumi A, Ito T, Morikawa D, Shimizu N, Yoneda T, Segawa M, Yamaguchi M,Ogawa R, Matev MM, Miyagoe-Suzuki Y, et al (2011) Fibrosis andadipogenesis originate from a common mesenchymal progenitor inskeletal muscle. J Cell Sci 124: 3654–3664. doi:10.1242/jcs.086629
Vallecillo Garcia P, Orgeur M, Vom Hofe-Schneider S, Stumm J, Kappert V,Ibrahim DM, Borno ST, Hayashi S, Relaix F, Hildebrandt K, et al (2017)Odd skipped-related 1 identifies a population of embryonic fibro-adipogenic progenitors regulating myogenesis during limbdevelopment. Nat Commun 8: 1218. doi:10.1038/s41467-017-01120-3
Voisin V, Sebrie C, Matecki S, Yu H, Gillet B, Ramonatxo M, Israel M, De la PorteS (2005) L-arginine improves dystrophic phenotype in mdx mice.Neurobiol Dis 20: 123–130. doi:10.1016/j.nbd.2005.02.010
Wang Z, Li L, Zhao H, Peng S, Zuo Z (2015) Chronic high fat diet induces cardiachypertrophy and fibrosis in mice.Metabolism 64: 917–925. doi:10.1016/j.metabol.2015.04.010
Zanzoni A, Montecchi-Palazzi L, Quondam M, Ausiello G, Helmer-Citterich M,Cesareni G (2002) MINT: A molecular INTeraction database. FEBS Lett513: 135–140. doi:10.1016/s0014-5793(01)03293-8
Zhang J, Chen S, ZhangW, Zhang J, Liu X, Shi H, Che H, WangW, Li F, Yao L (2008)Human differentiation-related gene NDRG1 is a Myc downstream-regulated gene that is repressed by Myc on the core promoter region.Gene 417: 5–12. doi:10.1016/j.gene.2008.03.002
License: This article is available under a CreativeCommons License (Attribution 4.0 International, asdescribed at https://creativecommons.org/licenses/by/4.0/).
HFD reprograms dystrophic FAPs Rosina et al. https://doi.org/10.26508/lsa.202000660 vol 3 | no 3 | e202000646 24 of 24


![Edición para la Biblioteca Saavedra Fajardo de José … · inc.] Muy reverendo y no menos muy amado señor. [normalized text inc.] Cuando vos acordaréis así de las aflicciones](https://static.fdocuments.es/doc/165x107/5b9d5e3709d3f2a4348bc37e/edicion-para-la-biblioteca-saavedra-fajardo-de-jose-inc-muy-reverendo-y.jpg)