niño de 8 semanas y la induccion de obesidad y resistencia a la insulina.pdf
12
Fax +41 61 306 12 34 E-Mail [email protected] www.karger.com Original Paper J Nutrigenet Nutrigenomics 2009;2:280–291 DOI: 10.1159/000308466 An 8-Week High-Fat Diet Induces Obesity and Insulin Resistance with Small Changes in the Muscle Transcriptome of C57BL/6J Mice Janneke de Wilde a, e Egbert Smit a, e Ronny Mohren a, e Mark V. Boekschoten a, b Philip de Groot a, b Sjoerd A.A. van den Berg a, d Silvia Bijland d Peter J. Voshol d Ko Willems van Dijk a, d Nicole W.J. de Wit a, b Annelies Bunschoten c Gert Schaart f Martijn F.M. Hulshof a, e Edwin C.M. Mariman a, e a Nutrigenomics Consortium, Top Institute Food and Nutrition, and b Nutrition, Metabolism and Genomics Group, and c Human and Animal Physiology, Wageningen University, Wageningen, d Departments of Endocrinology and Human Genetics, Leiden University Medical Center, Leiden, and NUTRIM School for Nutrition, Toxicology and Metabolism, Departments of e Human Biology and f Movement Sciences, Maastricht University Medical Center, Maastricht, The Netherlands tively small ( !1.3-fold). In fact, 8-weeks of aging induced more pronounced changes than an HFD. One comparison revealed the transcriptional downregulation of the mito- gen-activated protein kinase cascade, whereas both com- parisons showed the upregulation of fatty acid oxidation, demonstrating that the two comparison strategies are con- firmative as well as complementary. Conclusion: We suggest using complementary analysis strategies in the genome- wide search for gene expression changes induced by mild interventions, such as an HFD. Copyright © 2010 S. Karger AG, Basel Background The metabolic syndrome (MS) is a multicomponent metabolic disorder characterized by central obesity, high blood pressure, increased plasma triglycerides, decreased plasma HDL cholesterol and insulin resistance and is as- sociated with an increased risk for type 2 diabetes and cardiovascular diseases [1, 2]. The increasing prevalence Key Words Metabolic syndrome Microarray analysis Nutrigenomics Skeletal muscle Abstract Background: Skeletal muscle is responsible for most of the insulin-stimulated glucose uptake and metabolism. There- fore, it plays an important role in the development of insulin resistance, one of the characteristics of the metabolic syn- drome (MS). As the prevalence of the MS is increasing, there is an urgent need for more effective intervention strategies. Methods: C57BL/6J mice were fed an 8-week low-fat diet (10 kcal%; LFD) or high-fat diet (45 kcal%; HFD). Microarray anal- ysis was performed by using two comparisons: (1) 8-week HFD transcriptome versus 8-week LFD transcriptome and (2) transcriptome of mice sacrificed at the start of the interven- tion versus 8-week LFD transcriptome and 8-week HFD tran- scriptome, respectively. Results: Although an 8-week HFD induced obesity and impaired insulin sensitivity, HFD-re- sponsive changes in the muscle transcriptome were rela- Received: January 11, 2010 Accepted: March 13, 2010 Published online: June 28, 2010 Janneke de Wilde Department of Human Biology, Maastricht University PO Box 616 NL–6200 MD Maastricht (The Netherlands) Tel. +31 43 38 81509, Fax +31 43 36 70976, E-Mail j.dewilde @ hb.unimaas.nl © 2010 S. Karger AG, Basel 1661–6499/09/0026–0280$26.00/0 Accessible online at: www.karger.com/jnn
-
Upload
aldo-gomez-contreras -
Category
Documents
-
view
220 -
download
1
Transcript of niño de 8 semanas y la induccion de obesidad y resistencia a la insulina.pdf

Fax +41 61 306 12 34E-Mail [email protected]
Original Paper
J Nutrigenet Nutrigenomics 2009;2:280–291 DOI: 10.1159/000308466
An 8-Week High-Fat Diet Induces Obesity and Insulin Resistance with Small Changesin the Muscle Transcriptome of C57BL/6J Mice
Janneke de Wilde a, e Egbert Smit a, e Ronny Mohren a, e Mark V. Boekschoten a, b Philip de Groot a, b Sjoerd A.A. van den Berg a, d Silvia Bijland d Peter J. Voshol d Ko Willems van Dijk a, d Nicole W.J. de Wit a, b Annelies Bunschoten c Gert Schaart f Martijn F.M. Hulshof a, e Edwin C.M. Mariman a, e
a Nutrigenomics Consortium, Top Institute Food and Nutrition, and b Nutrition, Metabolism and Genomics Group, and c Human and Animal Physiology, Wageningen University, Wageningen , d Departments of Endocrinology and Human Genetics, Leiden University Medical Center, Leiden , and NUTRIM School for Nutrition, Toxicology and Metabolism, Departments of e Human Biology and f Movement Sciences, Maastricht University Medical Center, Maastricht , The Netherlands
tively small ( ! 1.3-fold). In fact, 8-weeks of aging induced more pronounced changes than an HFD. One comparison revealed the transcriptional downregulation of the mito-gen-activated protein kinase cascade, whereas both com-parisons showed the upregulation of fatty acid oxidation, demonstrating that the two comparison strategies are con-firmative as well as complementary. Conclusion: We suggest using complementary analysis strategies in the genome-wide search for gene expression changes induced by mild interventions, such as an HFD.
Copyright © 2010 S. Karger AG, Basel
Background
The metabolic syndrome (MS) is a multicomponent metabolic disorder characterized by central obesity, high blood pressure, increased plasma triglycerides, decreased plasma HDL cholesterol and insulin resistance and is as-sociated with an increased risk for type 2 diabetes and cardiovascular diseases [1, 2] . The increasing prevalence
Key Words
Metabolic syndrome � Microarray analysis � Nutrigenomics � Skeletal muscle
Abstract
Background: Skeletal muscle is responsible for most of the insulin-stimulated glucose uptake and metabolism. There-fore, it plays an important role in the development of insulin resistance, one of the characteristics of the metabolic syn-drome (MS). As the prevalence of the MS is increasing, there is an urgent need for more effective intervention strategies. Methods: C57BL/6J mice were fed an 8-week low-fat diet (10 kcal%; LFD) or high-fat diet (45 kcal%; HFD). Microarray anal-ysis was performed by using two comparisons: (1) 8-week HFD transcriptome versus 8-week LFD transcriptome and (2) transcriptome of mice sacrificed at the start of the interven-tion versus 8-week LFD transcriptome and 8-week HFD tran-scriptome, respectively. Results: Although an 8-week HFD induced obesity and impaired insulin sensitivity, HFD- re-sponsive changes in the muscle transcriptome were rela-
Received: January 11, 2010 Accepted: March 13, 2010 Published online: June 28, 2010
Janneke de Wilde Department of Human Biology, Maastricht University PO Box 616 NL–6200 MD Maastricht (The Netherlands) Tel. +31 43 38 81509, Fax +31 43 36 70976, E-Mail j.dewilde @ hb.unimaas.nl
© 2010 S. Karger AG, Basel1661–6499/09/0026–0280$26.00/0
Accessible online at:www.karger.com/jnn

8-Week HFD Induces Obesity and Insulin Resistance in C57BL/6J Mice
J Nutrigenet Nutrigenomics 2009;2:280–291 281
of the MS is caused by a combination of lifestyle factors, such as nutrition and limited physical activity, which are known to contribute to the pathogenesis of the MS. While the etiology of the MS is complex and still not fully eluci-dated, central obesity and insulin resistance are consid-ered to be potential causative factors. Additionally, obe-sity is considered as the principal cause of insulin resis-tance [3, 4] . Because skeletal muscle is the major site of insulin-stimulated glucose metabolism, it plays an im-portant role in the development of insulin resistance and the MS. Two important ways by which central obesity can impair skeletal muscle insulin-stimulated glucose metab-olism are by the ectopic storage of lipids and by altera-tions in the secretion of adipokines [5] .
When adipose tissue expands as in obesity, plasma lev-els of fatty acids (FAs) and triacylglycerol (TAG) become elevated. This will lead to an increased flux of TAG and FAs into skeletal muscle [6] . Negative correlations be-tween high levels of intramuscular TAG and insulin sen-sitivity have been observed in both obese subjects and subjects with type 2 diabetes [7–10] . Paradoxically, en-durance training showed to improve insulin sensitivity together with increased levels of intramuscular TAG [11, 12] . Therefore, it has been proposed that not TAG, but lipid intermediates, such as long-chain fatty acyl CoAs, diacylglycerol and ceramides may act as signaling mole-cules interrupting insulin signaling and glucose metabo-lism, which eventually results in insulin resistance [13, 14] . In addition to the role of energy storage, adipose tis-sue functions as an endocrine organ that can respond to metabolic signals by secreting adipokines. These adipo-kines have different systemic effects including modulat-ing energy metabolism in skeletal muscle. Enlargement of adipose tissue, and especially visceral fat depots, will lead to alterations in the secretion of these adipokines. For example, increased plasma leptin levels and decreased plasma adiponectin levels are reported in both obese and insulin-resistant subjects. As such, alterations in the se-cretion of these adipokines are linked to the impairment of insulin-stimulated glucose metabolism [15–17] .
In the present study, we performed microarray analysis of skeletal muscle to get more insight into molecular mechanisms underlying the development of diet-induced obesity and insulin resistance in C57BL/6J mice. To find high-fat diet (HFD)-responsive changes, we compared the muscle transcriptome of mice fed an 8-week HFD with the muscle transcriptome of mice fed an 8-week low-fat diet (LFD). Biological processes in skeletal muscle affect-ed by the HFD were assessed by the analyses of predefined gene sets based on gene ontology, biochemical, metabolic
and signaling pathways. Since nutritional interventions induce subtle changes in gene expression [18, 19] , we used a second comparison strategy in which we compared the 8-week HFD muscle transcriptome as well as the 8-week LFD muscle transcriptome with the muscle transcrip-tome of mice sacrificed at the start of the intervention. By paralleling the outcomes of these comparisons, we could find overlapping changes, suggesting that these changes are related to aging rather than to the HFD, as well as HFD-specific responsive changes. Finally, we evaluated the results of the two comparison strategies demonstrat-ing their confirmative and complementary use.
Methods
Animals and Diet Male C57BL/6J mice were obtained from Harlan (Horst, The
Netherlands). At 9 weeks of age, mice were switched to a run-in diet consisting of an LFD (10 kcal% fat) for 3 weeks. Following the run-in period, mice were randomly assigned to the LFD or the HFD (45 kcal% fat) for 8 weeks. Both diets contained fat in the form of palm oil (based on D12450B and D12451; Research Diet Services, Wijk bij Duurstede, The Netherlands) as described pre-viously [20] . Study 1 : at the start of the intervention and after 8 weeks, mice (n = 10 per diet) were fasted for 6 h and anesthetized with a mixture of isofluorane (1.5%), nitrous oxide (70%) and ox-ygen (30%). Blood was collected by orbital puncture, after which the mice were sacrificed by cervical dislocation. The quadriceps muscle was dissected, snap-frozen in liquid nitrogen and stored at –80 ° C until further analysis. Study 2 : after an overnight fast, a hyperinsulinemic, euglycemic clamp was performed to measure whole-body insulin resistance and tissue-specific insulin-stimu-lated glucose uptake (n = 5 per diet) after 8 weeks of dietary inter-vention. The animal studies were approved by the Local Commit-tee for Care and Use of Laboratory Animals at Wageningen Uni-versity.
Assessment of Body Composition The percentages of body fat, lean body mass and total fat mass
were measured with Dual-energy X-ray absorptiometry using the Lunar PIXImus � densitometer (GE Lunar, Madison, Wisc., USA) at the start of the intervention, after 4 and 8 weeks of the dietary intervention. Prior to use, the Lunar PIXImus densitometer was calibrated according to the manufacturer’s instructions. Mice were anesthetized as described and measurements were per-formed on the whole body excluding the head area.
Plasma Insulin, Leptin and Adiponectin Measurements Blood was collected in EDTA-containing tubes (Sarstedt
AG & Co., Nümbrecht, Germany). Plasma was obtained after cen-trifugation at 11,000 g for 10 min and stored at –80 ° C for further analysis. Plasma insulin and leptin were measured simultaneous-ly with the mouse serum adipokine Linco plex kit (Linco Research, Nuclilab, Ede, The Netherlands) using the Luminex100 system (Applied Cytometry Systems, Sheffield, UK) with Starstation software (Applied Cytometry Systems) as described by van

de Wilde et al. J Nutrigenet Nutrigenomics 2009;2:280–291282
Schothorst et al. [21] . Plasma adiponectin was measured with the mouse Adiponectin/Acrp30 Quantikine ELISA Kit (R&D Sys-tems, Minneapolis, Minn., USA).
Hyperinsulinemic Euglycemic Clamp The hyperinsulinemic euglycemic clamp, preparation of tis-
sue homogenates, analytical procedures and calculations for stimulation whole-body glucose uptake, inhibition of hepatic glu-cose production and tissue-specific glucose uptake were per-formed as described previously [22–24] . Inhibition of lipolysis was calculated as the ratio between the plasma free fatty acid levels after and before the hyperinsulinemic euglycemic clamp.
Affymetrix Microarray Analysis Total RNA from the complete quadriceps muscle was isolated
and Affymetrix GeneChip � Mouse Genome 430 2.0 arrays were used as described earlier with minor adaptations [25] . Briefly, only probe sets with an average signal intensity 1 20, across all ar-rays, were selected for further analysis. Since nutritional interven-tions induce subtle changes in gene expression [18, 19] , we used a fold change 1 1.3 to find differentially expressed genes. To deter-mine the level of significance, we used a false discovery rate (FDR) ! 0.05, which is used to correct for multiple testing [26] . Only genes that satisfied both criteria were considered as significantly differentially expressed. Changes in gene expression were related to functional changes by using ErmineJ (FDR ! 0.001) [27] and Gene set enrichment analysis (GSEA; FDR ! 0.05) [28] . For the microarray analyses in this study we used two different compari-son strategies. Strategy 1: to identify HFD-responsive genes, we compared the muscle transcriptome of 8-week HFD mice with the muscle transcriptome of the 8-week LFD mice. Strategy 2: com-parison of the muscle transcriptome of mice sacrificed at the start of the intervention (start transcriptome) with the muscle tran-scriptome of 8-week LFD mice as well as the muscle transcrip-tome of 8-week HFD mice. Changes in gene expression, overrep-resented gene ontology (GO) classes and regulated gene sets that were only present in the 8-week HFD muscle transcriptome were considered as HFD-specific changes, whereas changes present in both the 8-week HFD muscle transcriptome and the 8-week LFD muscle transcriptome were considered as changes related to ag-ing. Array data have been submitted to the Gene Expression Om-nibus, GSE17576.
Verification of Microarray-Detected Changes To verify micro-array detected changes, we measured enzyme
activity levels or performed Western blotting to determine pro-tein expression.
Enzyme Activity Measurements Activity levels of the enzymes � -hydroxyacyl-CoA dehydro-
genase (HAD; � -oxidation) and citrate synthase (CS; TCA cycle) were determined in quadriceps muscle homogenates (n = 7) as described by Den Hoed et al. [29] .
Western Blotting To determine whether microarray-detected changes in skele-
tal muscle could be translated to the protein level we performed Western blotting as described earlier [25] . Briefly, total protein was separated by SDS-PAGE on 4–12% Bis-Tris Criterion gels at 150 V and transferred to a polyvinylidene fluoride membrane for
90 min at 100 V. Blocking steps were performed in TBST supple-mented with 5% nonfat dry milk (NFDM). Antibody (Ab) incu-bation steps of the membrane were performed in TBST supple-mented with 5% BSA or 5% NFDM. Membranes were incubated overnight with an anti-mouse monoclonal oxidative phosphory-lation Ab cocktail (1: 2,000; Mitosciences, Eugene, Oreg., USA), a polyclonal p38 Ab (1: 1,000; Cell Signaling, Danvers, Mass., USA) or a monoclonal phospho-p38 mitogen-activated protein kinase (MAPK) (Thr180/Tyr182) Ab (1: 1,000; Cell Signaling) or aGAPDH Ab (1: 3,000; Cell Signaling) at 4 ° C. After washing with TBST, membranes were incubated with a HRP-conjugated sec-ondary Ab and signals were detected by ECL using Pierce re-agents. Films were scanned with a GS800 densitometer (Bio-Rad) and signals were quantified with Quantity One software (Bio-Rad). As the GAPDH protein was stably expressed under the ap-plied conditions, we used the GAPDH signal to calculate the rela-tive protein abundance.
Statistical Analyses All data are expressed as means 8 SE. Microarray data were
analyzed as described above. All further statistical analyses were performed using Prism software (GraphPad Software, San Diego, Calif., USA). An unpaired t test was used to compare differences between the LFD and the HFD mice. As data for whole-body in-sulin resistance and tissue-specific glucose uptake were not nor-mally distributed, we used the non-parametric Mann-Whitney test to find differences. Repeated-measures ANOVA was used to find out whether body composition of LFD and HFD mice chang-es during the dietary intervention. When significant differences were found, a Tukey’s post hoc test was used to determine the ex-act location of the difference. One-way ANOVA was used to com-pare the protein levels of p38 MAPK, phospho-p38 MAPK and the ratio phospho-p38 MAPK versus p38 between mice sacrificed at the start of the intervention, LFD and HFD mice. When signifi-cant differences were found, a Tukey’s post hoc test was used to determine the exact location of the difference. p ! 0.05 was con-sidered as statistically significant.
Results
HFD Mice Develop Obesity After a 3-week run-in period, mice were put on an LFD
or HFD for 8 weeks. After 3 weeks, HFD mice had a sig-nificantly higher body mass than the LFD mice ( fig. 1 ). Dual-energy X-ray absorptiometry was used to examine differences in body composition throughout the dietary intervention. During the first 4 weeks, both the LFD mice and the HFD mice significantly gained lean body mass (LBM) (LFD: +1.6 g; HFD: +2.4 g). From the 4th week on-wards only the LFD mice significantly gained LBM (LFD: +0.8 g). No significant differences in LBM between the LFD and the HFD mice were observed. Both the LFD and the HFD mice increased their fat mass during the dietary intervention. However, the HFD mice accumulated sig-nificantly more fat mass than the LFD mice ( table 1 ).

8-Week HFD Induces Obesity and Insulin Resistance in C57BL/6J Mice
J Nutrigenet Nutrigenomics 2009;2:280–291 283
Plasma Adiponectin, Insulin and Leptin Levels Table 2 shows that at 8 weeks of dietary intervention,
adiponectin plasma levels were significantly lower in HFD mice than in LFD mice. Leptin levels were signifi-cantly higher in the HFD mice in comparison with the LFD mice. The difference in fat accumulation strongly correlated with plasma leptin levels (Pearson correla-tion = 0.713; p ! 0.001; 95% confidence interval: 0.39–0.88). Furthermore, we observed higher plasma insulin levels in the HFD mice than in the LFD mice.
An 8-Week HFD Induces Insulin Resistance After 8 weeks of dietary intervention, whole-body in-
sulin resistance was measured with a hyperinsulinemic
euglycemic clamp. Whereas in the LFD mice whole-body glucose utilization increased by 50% after insulin infu-sion, in the HFD mice whole-body glucose utilization re-mained unaffected (p = 0.06). Insulin-induced inhibition of hepatic glucose production was not different between LFD and HFD mice, indicating that the liver was still in-sulin sensitive in HFD mice. A clear tendency towards de-creased inhibition of lypolysis by insulin was observed in the HFD mice ( p = 0.06), indicating insulin resistance of adipose tissue ( fig. 2 ). Together these results point to pe-ripheral insulin resistance. Tissue-specific glucose uptake was determined under hyperinsulinemic euglycemic con-ditions after a bolus of 2-deoxy- D -[ 3 H] glucose. Glucose uptake was significantly lower in the visceral fat depots of
250
30
35
40
45
50Bo
dy m
ass
(g)
1 2 3 4Dietary intervention (weeks)
bc
cd
dd
5 6 7 8
LFDHFD
a
–50
0
50
100
Hyp
erin
sulin
emic
vs.
bas
al (%
)
Increase in GU
p = 0.06 LFDHFD
Inhibition of HPG Inhibition oflipolysis
p = 0.06
Fig. 1. Body mass development of LFD and HFD mice during 8 weeks of dietary intervention. Values are means 8 SE (n = 10). Differences as obtained by using an unpaired t test: a p ! 0.10, b p ! 0.05, c p ! 0.01 and d p ! 0.001.
Fig. 2. Increase in whole-body glucose utilization (GU) and inhi-bition of hepatic glucose production (HPG) and lipolysis after hy-perinsulinemic conditions in LFD and HFD mice. Values are means 8 SE (n = 5) and p values were obtained by using the Mann-Whitney test.
Table 1. B ody composition of LFD and HFD mice during the dietary intervention
0 weeks 4 weeks 8 weeks
LFD HFD LFD HFD
Total fat mass, g 6.880.3 9.880.6°°° 12.480.6**, °°° 14.580.8°°° 20.180.9***, °°°
Lean body mass, g 22.780.4 24.380.5°°° 25.180.6° 25.180.6° 25.880.9Fat, % 23.080.7 28.481.2°°° 36.381.1**, °°° 33.081.1°°° 44.080.9***, °°°
B ody composition was measured by dual-energy X-ray absorptiometry scanning at the start, after 4 and 8 weeks of the dietary in-tervention. Values are means 8 SE (week 0: n = 20 and weeks 4–8: n = 10). ** p < 0.01 and *** p < 0.001 indicate significant differ-ences between LFD and HFD mice as obtained by an unpaired t test; ° p < 0.05 and °°° p < 0.001 indicate significant differences between time points (0 weeks vs. 4 weeks and 4 weeks vs. 8 weeks) by repeated-measures ANOVA.

de Wilde et al. J Nutrigenet Nutrigenomics 2009;2:280–291284
the HFD mice as compared with the LFD mice. Glucose uptake was also lower in the heart and skeletal muscle; however, this was not statistically significant ( fig. 3 ).
Microarray Analysis We showed that an 8-week HFD induces obesity, insu-
lin resistance and disturbed plasma levels of adiponectin, insulin and leptin in C57BL/6J mice. To get more insight into the molecular mechanisms underlying the develop-ment of diet-induced obesity and insulin resistance, we performed microarray analysis of skeletal muscle. To find HFD-responsive changes, we compared the muscle tran-scriptome of mice fed an 8-week HFD with the muscle transcriptome of mice fed an 8-week LFD. Since nutri-tional interventions induce subtle changes in gene ex-pression [18, 19] , we used a second comparison strategy in which we compared the 8-week HFD muscle transcrip-tome as well as the 8-week LFD muscle transcriptome with the muscle transcriptome of mice sacrificed at the start of the intervention (start transcriptome). Regarding strategy 2, changes that were only present in the 8-week HFD muscle transcriptome were considered as HFD-spe-cific changes, whereas changes that were found to be overlapping between the 8-week LFD muscle transcrip-tome and the 8-week HFD muscle transcriptome were considered to be related to aging. To identify differen-tially expressed genes we used a fold change 1 1.3 and an FDR ! 0.05. ErmineJ was used to find overrepresented GO classes (FDR ! 0.001) and GSEA was applied to find regulated cellular processes (FDR ! 0.05).
FA Oxidation Is the Only Responsive Pathway inHFD Mice Compared with LFD Mice Comparing the 8-week HFD muscle transcriptome
with the 8-week LFD muscle transcriptome using the cri-teria of a fold change 1 1.3 and an FDR ! 0.05, we found no differentially expressed genes. Thus, an 8-week HFD in-duced changes in gene expression level that are relatively small. ErmineJ showed that only 3 GO classes, i.e. cyto-kine production (GO: 0001816), regulation of cellular bio-synthetic process (GO: 0031326) and steroid metabolic
Table 2. Pla sma adiponectin, insulin and leptin levels in 8-week LFD and 8-week HFD mice
LFD HFD p
Adiponectin, �g/ml 5.780.1 5.180.2 ≤0.05Insulin, ng/ml 0.980.1 1.380.2 ≤0.05Leptin, ng/ml 18.483.0 37.485.8 ≤0.01
Va lues are means 8 SE (n = 10). p values were obtained with an unpaired t test.
0
50
100
150
Tiss
ue-s
peci
fic g
luco
se u
ptak
e(n
mol
/mg
prot
ein)
Heart
p = 0.06
Quadriceps
LFDHFD
Visceral fat
p < 0.05
p = 0.11
Table 3. C hanged gene sets in HFD transcriptome as compared with the LFD transcriptome
n ES NES FDR
Upregulated cellular processesMitochondrial FA oxidation1 29 0.72 2.36 <0.001ECM receptor interaction2 80 0.51 2.11 0.006FA�-oxidation meta3 34 0.59 2.06 0.008Mitochondrial FA�-oxidation3 15 0.71 2.02 0.009Tissues blood and lymph 13 32 0.60 2.02 0.008FA�-oxidation3 29 0.60 1.95 0.012FA metabolism2 36 0.53 1.84 0.041
Downregulated cellular processesRNA polymerase2 20 –0.70 –2.26 0.001
G SEA was applied to identify upregulated and downregulated processes after an 8-week HFD. Presented are regulated processes with an FDR <0.05. An FDR was calculated to adjust for testing multiple hypotheses. n = Number of genes; ES = enrichment score for the gene set that reflects the degree to which a gene set is over-represented at the top or bottom of the ranked list; NES = normal-ized enrichment score, i.e. the normalized ES to account for the size of the gene set.
1 Source of the gene set: SK manual. 2 Source of the gene set: KEGG. 3 Source of the gene set: GENMAPP.
Fig. 3. Tissue-specific glucose uptake in heart, quadriceps and visceral fat deposits of LFD and HFD mice. Values are means 8 SE (n = 5). p values were obtained using the Mann-Whitney test.
8-Week HFD Induces Obesity and Insulin Resistance in C57BL/6J Mice
J Nutrigenet Nutrigenomics 2009;2:280–291 285
process (GO: 0008202) were overrepresented in the 8-week HFD muscle transcriptome. Using GSEA, we found that 7 gene sets were upregulated in the 8-week HFD tran-scriptome. Of these 7 upregulated gene sets, we could re-late 5 gene sets to FA oxidation. The only gene set that was downregulated was named RNA polymerase ( table 3 ).
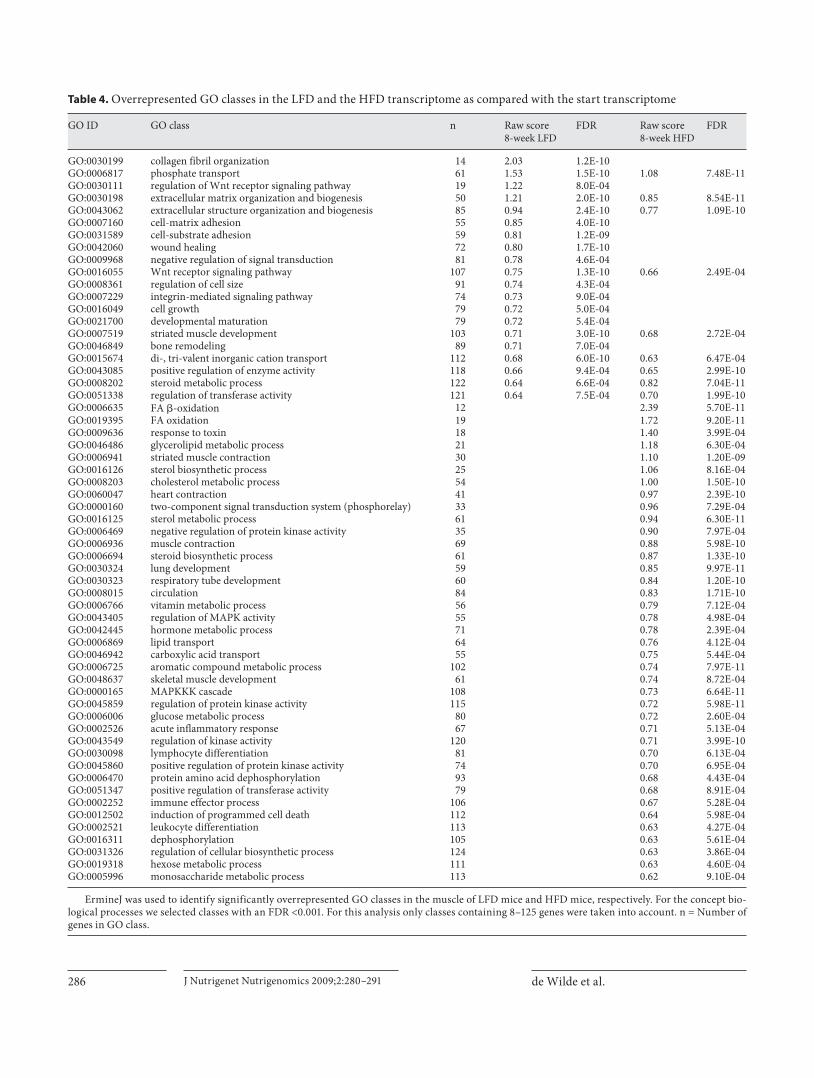
Descriptors for Cell-Cell Interaction and Development Are Regulated in Muscle of Both 8-Week LFD Mice and 8-Week HFD Mice, whereas the MAPK Cascade and FA Oxidation Are Only Regulated in 8-Week HFD Mice When we compared the 8-week LFD muscle transcrip-
tome to the start transcriptome, 72 genes were identified as differentially expressed (fold change 1 1.3 and FDR ! 0.05). ErmineJ showed that 20 GO classes were overrep-resented in the 8-week LFD muscle transcriptome. This list contained descriptors for development, signaling and cell-cell interaction ( table 4 ). GSEA revealed that only 2 gene sets were upregulated in the 8-week LFD muscle transcriptome. Nine gene sets were downregulated, in-
cluding 4 genes sets corresponding to cell-cell interaction and 2 gene sets named ‘Tissue blood and lymph’ ( table 5 ).
Comparison of the 8-week HFD muscle transcriptome with the start muscle transcriptome resulted in the iden-tification of 92 differentially expressed genes (fold change 1 1.3 and FDR ! 0.05). Using ErmineJ, we found that 48 GO classes were overrepresented in the 8-week HFD muscle transcriptome. This included descriptors for cell-cell interaction, contraction, development, FA oxidation and the MAPK cascade ( table 4 ). GSEA showed that 9 gene sets were upregulated in the 8-week HFD muscle transcriptome. This list contained 5 gene sets that were related to FA oxidation. The other 4 gene sets correspond-ed to protein metabolism and PPAR signaling. Four gene sets related to cell-cell interaction, 1 gene set describing the MAPK cascade and 1 gene set named ‘Tissue blood and lymph’ were downregulated ( table 5 ).
When we paralleled the outcomes of the comparison 8-week LFD muscle transcriptome versus start transcrip-tome with the comparison 8-week HFD muscle tran-scriptome versus start transcriptome we observed that a total of 39 genes showed an overlap. From the overrepre-sented GO classes we identified 9 GO classes, including striated muscle development and descriptors for cell-cell interaction, that were overlapping ( table 4 ). From the out-comes of GSEA, we found that 1 upregulated gene setand 5 downregulated gene sets were overlapping. Three downregulated gene sets corresponded to cell-cell inter-action and 1 gene set was ‘Tissue blood and lymph’.
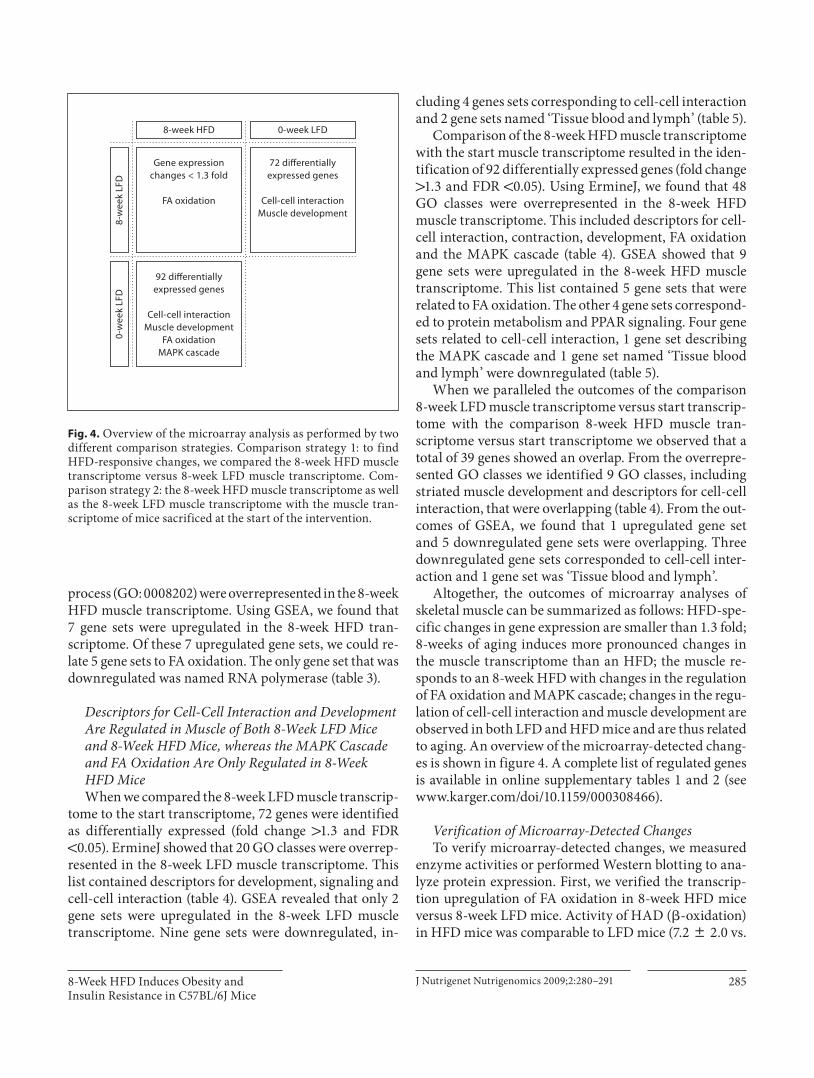
Altogether, the outcomes of microarray analyses of skeletal muscle can be summarized as follows: HFD-spe-cific changes in gene expression are smaller than 1.3 fold; 8-weeks of aging induces more pronounced changes in the muscle transcriptome than an HFD; the muscle re-sponds to an 8-week HFD with changes in the regulation of FA oxidation and MAPK cascade; changes in the regu-lation of cell-cell interaction and muscle development are observed in both LFD and HFD mice and are thus related to aging. An overview of the microarray-detected chang-es is shown in figure 4 . A complete list of regulated genes is available in online supplementary tables 1 and 2 (see www.karger.com/doi/10.1159/000308466).
Verification of Microarray-Detected Changes To verify microarray-detected changes, we measured
enzyme activities or performed Western blotting to ana-lyze protein expression. First, we verified the transcrip-tion upregulation of FA oxidation in 8-week HFD mice versus 8-week LFD mice. Activity of HAD ( � -oxidation) in HFD mice was comparable to LFD mice (7.2 8 2.0 vs.
Gene expressionchanges < 1.3 fold
FA oxidation
72 differentiallyexpressed genes
Cell-cell interactionMuscle development
8-week HFD 0-week LFD8-
wee
k LF
D0-
wee
k LF
D
92 differentiallyexpressed genes
Cell-cell interactionMuscle development
FA oxidationMAPK cascade
Fig. 4. Overview of the microarray analysis as performed by two different comparison strategies. Comparison strategy 1: to find HFD-responsive changes, we compared the 8-week HFD muscle transcriptome versus 8-week LFD muscle transcriptome. Com-parison strategy 2: the 8-week HFD muscle transcriptome as well as the 8-week LFD muscle transcriptome with the muscle tran-scriptome of mice sacrificed at the start of the intervention.
de Wilde et al. J Nutrigenet Nutrigenomics 2009;2:280–291286
Table 4. O verrepresented GO classes in the LFD and the HFD transcriptome as compared with the start transcriptome
GO ID GO class n Raw score8-week LFD
FDR Raw score8-week HFD
FDR
GO:0030199 collagen fibril organization 14 2.03 1.2E-10GO:0006817 phosphate transport 61 1.53 1.5E-10 1.08 7.48E-11GO:0030111 regulation of Wnt receptor signaling pathway 19 1.22 8.0E-04GO:0030198 extracellular matrix organization and biogenesis 50 1.21 2.0E-10 0.85 8.54E-11GO:0043062 extracellular structure organization and biogenesis 85 0.94 2.4E-10 0.77 1.09E-10GO:0007160 cell-matrix adhesion 55 0.85 4.0E-10GO:0031589 cell-substrate adhesion 59 0.81 1.2E-09GO:0042060 wound healing 72 0.80 1.7E-10GO:0009968 negative regulation of signal transduction 81 0.78 4.6E-04GO:0016055 Wnt receptor signaling pathway 107 0.75 1.3E-10 0.66 2.49E-04GO:0008361 regulation of cell size 91 0.74 4.3E-04GO:0007229 integrin-mediated signaling pathway 74 0.73 9.0E-04GO:0016049 cell growth 79 0.72 5.0E-04GO:0021700 developmental maturation 79 0.72 5.4E-04GO:0007519 striated muscle development 103 0.71 3.0E-10 0.68 2.72E-04GO:0046849 bone remodeling 89 0.71 7.0E-04GO:0015674 di-, tri-valent inorganic cation transport 112 0.68 6.0E-10 0.63 6.47E-04GO:0043085 positive regulation of enzyme activity 118 0.66 9.4E-04 0.65 2.99E-10GO:0008202 steroid metabolic process 122 0.64 6.6E-04 0.82 7.04E-11GO:0051338 regulation of transferase activity 121 0.64 7.5E-04 0.70 1.99E-10GO:0006635 FA �-oxidation 12 2.39 5.70E-11GO:0019395 FA oxidation 19 1.72 9.20E-11GO:0009636 response to toxin 18 1.40 3.99E-04GO:0046486 glycerolipid metabolic process 21 1.18 6.30E-04GO:0006941 striated muscle contraction 30 1.10 1.20E-09GO:0016126 sterol biosynthetic process 25 1.06 8.16E-04GO:0008203 cholesterol metabolic process 54 1.00 1.50E-10GO:0060047 heart contraction 41 0.97 2.39E-10GO:0000160 two-component signal transduction system (phosphorelay) 33 0.96 7.29E-04GO:0016125 sterol metabolic process 61 0.94 6.30E-11GO:0006469 negative regulation of protein kinase activity 35 0.90 7.97E-04GO:0006936 muscle contraction 69 0.88 5.98E-10GO:0006694 steroid biosynthetic process 61 0.87 1.33E-10GO:0030324 lung development 59 0.85 9.97E-11GO:0030323 respiratory tube development 60 0.84 1.20E-10GO:0008015 circulation 84 0.83 1.71E-10GO:0006766 vitamin metabolic process 56 0.79 7.12E-04GO:0043405 regulation of MAPK activity 55 0.78 4.98E-04GO:0042445 hormone metabolic process 71 0.78 2.39E-04GO:0006869 lipid transport 64 0.76 4.12E-04GO:0046942 carboxylic acid transport 55 0.75 5.44E-04GO:0006725 aromatic compound metabolic process 102 0.74 7.97E-11GO:0048637 skeletal muscle development 61 0.74 8.72E-04GO:0000165 MAPKKK cascade 108 0.73 6.64E-11GO:0045859 regulation of protein kinase activity 115 0.72 5.98E-11GO:0006006 glucose metabolic process 80 0.72 2.60E-04GO:0002526 acute inflammatory response 67 0.71 5.13E-04GO:0043549 regulation of kinase activity 120 0.71 3.99E-10GO:0030098 lymphocyte differentiation 81 0.70 6.13E-04GO:0045860 positive regulation of protein kinase activity 74 0.70 6.95E-04GO:0006470 protein amino acid dephosphorylation 93 0.68 4.43E-04GO:0051347 positive regulation of transferase activity 79 0.68 8.91E-04GO:0002252 immune effector process 106 0.67 5.28E-04GO:0012502 induction of programmed cell death 112 0.64 5.98E-04GO:0002521 leukocyte differentiation 113 0.63 4.27E-04GO:0016311 dephosphorylation 105 0.63 5.61E-04GO:0031326 regulation of cellular biosynthetic process 124 0.63 3.86E-04GO:0019318 hexose metabolic process 111 0.63 4.60E-04GO:0005996 monosaccharide metabolic process 113 0.62 9.10E-04
E rmineJ was used to identify significantly overrepresented GO classes in the muscle of LFD mice and HFD mice, respectively. For the concept bio-logical processes we selected classes with an FDR <0.001. For this analysis only classes containing 8–125 genes were taken into account. n = Number of genes in GO class.

8-Week HFD Induces Obesity and Insulin Resistance in C57BL/6J Mice
J Nutrigenet Nutrigenomics 2009;2:280–291 287
6.8 8 1.4 � mol/min/g protein with p = 0.88 in HFD vs. LFD). Also, the activity of CS (TCA cycle) in HFD mice was not different from LFD mice (24.1 8 3.5 vs. 21.5 8 3.0 � mol/min/g protein with p = 0.58 in HFD vs. LFD). Furthermore, protein levels of subunits of the 5 complex-es of oxidative phosphorylation were not detectably changed in the HFD mice as compared with the LFD mice (complex I: 0.64 8 0.10 vs. 0.60 8 0.09; complex II: 1.00 8 0.07 vs. 0.98 8 0.12; complex III: 0.85 8 0.07 vs. 0.86 8 0.13; complex IV: 0.85 8 0.14 vs. 0.80 8 0.13 and complex V: 0.84 8 0.08 vs. 0.87 8 0.09).
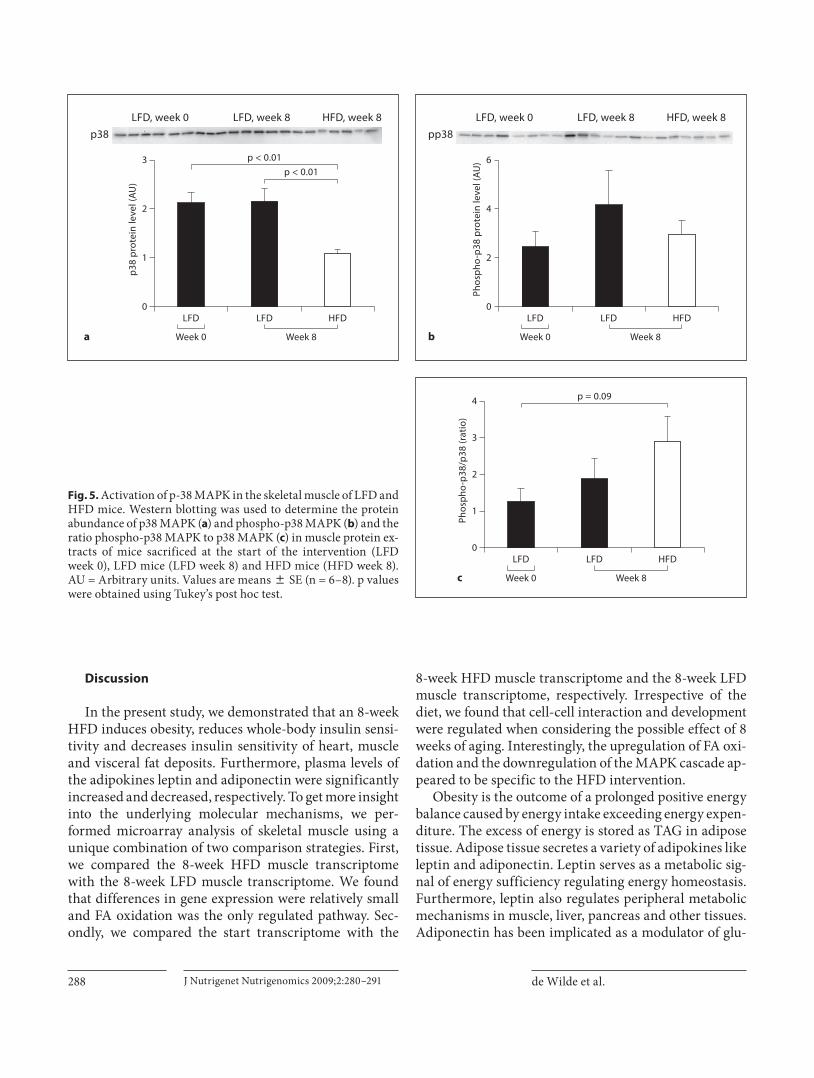
Secondly, we verified the transcriptional downregula-tion of the MAPK cascade in muscle of 8-week HFD mice versus mice sacrificed at the start of the intervention. The gene with the strongest regulation of the MAPK cascade was found to be Mek6 which is actually involved in the
activation p38 MAPK via phosphorylation [30] . To find out whether downregulation of Mek6 gene expression in-fluenced the activity of the p38 MAPK cascade, we ana-lyzed protein levels of p38 MAPK as well as phospho-p38 MAPK in protein extracts of mice sacrificed at the start of the dietary intervention, in 8-week LFD mice and 8-week HFD mice. Western blotting showed that the 8-week HFD significantly decreased p38 MAPK protein levels in skeletal muscle. The phospho-p38 MAPK pro-tein level was not different in the HFD mice as compared to mice sacrificed at the start of the dietary intervention and 8-week LFD mice. However, activation of p38 MAPK, which is expressed as the ratio phospho-p38 MAPK ver-sus p38-MAPK, tended to be higher in the HFD mice than in mice sacrificed at the start of the intervention(p = 0.09) ( fig. 5 ).
Table 5. C hanged gene sets in the LFD and the HFD transcriptome as compared with the start transcriptome
n 8-week LFD 8 -week HFD
ES NES FDR ES NES FDR
Upregulated cellular processesProteasome2 24 0.63 2.08 0.017 0.70 2.16 <0.001Olfactory transduction2 28 0.59 2.00 0.028Mitochondrial FA oxidation1 29 0.76 2.47 <0.001FA �-oxidation meta3 34 0.61 2.08 0.003PPAR signaling pathway2 63 0.53 2.04 0.005FA metabolism2 36 0.56 1.92 0.016Mitochondrial FA �-oxidation3 15 0.71 1.93 0.018FA �-oxidation3 29 0.57 1.89 0.026Tyrosine metabolism2 46 0.52 1.86 0.030Proteasome degradation3 59 0.46 1.80 0.048
Downregulated cellular processesCell communication2 91 –0.66 –2.73 <0.001 –0.56 –2.34 <0.001ECM receptor interaction2 80 –0.67 –2.68 <0.001 –0.57 –2.30 <0.001Focal adhesion2 170 –0.57 –2.57 <0.001 –0.48 –2.20 <0.001Focal adhesion3 182 –0.56 –2.52 <0.001 –0.46 –2.08 0.002MAPK cascade3 30 –0.60 –2.00 0.007Tissue blood and lymph 13 15 –0.77 –2.09 0.001 –0.69 –1.94 0.016Prostaglandin synthesis regulation3 31 –0.63 –2.10 0.001Tissue blood and lymph 23 32 –0.58 –1.92 0.012Inflammatory response pathway3 40 –0.56 –1.93 0.013Induction of apoptosis through Dr3 and
Dr4 and 5 death receptors4 27 –0.60 –1.89 0.017
GSE A was applied to identify upregulated and downregulated processes after an 8-week LFD and after an 8-week HFD, respec-tively. Presented are regulated processes with an FDR <0.05. An FDR was calculated to adjust for multiple hypotheses testing. n = Number of genes; ES = enrichment score for the gene set that re-flects the degree to which a gene set is overrepresented at the top
or bottom of the ranked list; NES = normalized enrichment score, i.e. the normalized ES to account for the size of the gene set.
1 Source of the gene set: SK manual. 2 Source of the gene set: KEGG. 3 Source of the gene set: GENMAPP. 4 Source of the gene set: BIOCARTA.
de Wilde et al. J Nutrigenet Nutrigenomics 2009;2:280–291288
Discussion
In the present study, we demonstrated that an 8-week HFD induces obesity, reduces whole-body insulin sensi-tivity and decreases insulin sensitivity of heart, muscle and visceral fat deposits. Furthermore, plasma levels of the adipokines leptin and adiponectin were significantly increased and decreased, respectively. To get more insight into the underlying molecular mechanisms, we per-formed microarray analysis of skeletal muscle using a unique combination of two comparison strategies. First, we compared the 8-week HFD muscle transcriptome with the 8-week LFD muscle transcriptome. We found that differences in gene expression were relatively small and FA oxidation was the only regulated pathway. Sec-ondly, we compared the start transcriptome with the
8-week HFD muscle transcriptome and the 8-week LFD muscle transcriptome, respectively. Irrespective of the diet, we found that cell-cell interaction and development were regulated when considering the possible effect of 8 weeks of aging. Interestingly, the upregulation of FA oxi-dation and the downregulation of the MAPK cascade ap-peared to be specific to the HFD intervention.
Obesity is the outcome of a prolonged positive energy balance caused by energy intake exceeding energy expen-diture. The excess of energy is stored as TAG in adipose tissue. Adipose tissue secretes a variety of adipokines like leptin and adiponectin. Leptin serves as a metabolic sig-nal of energy sufficiency regulating energy homeostasis. Furthermore, leptin also regulates peripheral metabolic mechanisms in muscle, liver, pancreas and other tissues. Adiponectin has been implicated as a modulator of glu-
0
1
2
3
p38p3
8 pr
otei
n le
vel (
AU)
LFD LFD HFD
Week 0
LFD, week 0 LFD, week 8 HFD, week 8
a Week 8
p < 0.01p < 0.01
0
2
4
6
pp38
Phos
pho-
p38
prot
ein
leve
l (AU
)
LFD LFD HFD
Week 0
LFD, week 0 LFD, week 8 HFD, week 8
b Week 8
p = 0.09
0
1
2
4
3
Phos
pho-
p38/
p38
(rat
io)
LFD LFD HFD
Week 0c Week 8
Fig. 5. Activation of p-38 MAPK in the skeletal muscle of LFD and HFD mice. Western blotting was used to determine the protein abundance of p38 MAPK ( a ) and phospho-p38 MAPK ( b ) and the ratio phospho-p38 MAPK to p38 MAPK ( c ) in muscle protein ex-tracts of mice sacrificed at the start of the intervention (LFDweek 0), LFD mice (LFD week 8) and HFD mice (HFD week 8). AU = Arbitrary units. Values are means 8 SE (n = 6–8). p values were obtained using Tukey’s post hoc test.

8-Week HFD Induces Obesity and Insulin Resistance in C57BL/6J Mice
J Nutrigenet Nutrigenomics 2009;2:280–291 289
cose and lipid metabolism in muscle and liver [17] . The observed strong correlation between obesity and leptin is in line with results of earlier studies describing that diet-induced obesity is accompanied by a state of leptin resis-tance [31] . Low circulating adiponectin levels have been demonstrated in diet-induced obesity in rodents as well as in human subjects [15] . Although only slightly lower, adiponectin levels were significantly different in HFD mice as compared to LFD mice in the present study.
Insulin resistance is manifested by decreased insulin-stimulated glucose uptake and metabolism in fat deposits and skeletal muscle and by an impaired suppression of hepatic glucose production [5] . Indeed, the HFD im-paired the insulin-stimulated uptake of glucose in vis-ceral fat deposits and muscle. Park et al. [32] showed that a 3-week HFD based on corn oil induces the development of insulin resistance simultaneously in the liver, adipose tissue and skeletal muscle in young adult C57BL/6 mice, whereas Kraegen et al. [33] found that diet-induced insu-lin resistance develops in liver and adipose tissue before it develops in skeletal muscle during a safflower oil-based HFD intervention in adult male Wistar rats. Here, we showed that an 8-week palm oil based HFD does not in-duce insulin resistance in the liver. Possible explanations for these different findings are differences in the studied species, age of the animals, but also the composition of the diet.
Previously, we showed that both a 3-day HFD as well as a 4-week HFD significantly changes the expression lev-el of more than a thousand genes in the quadriceps mus-cle of mice [25] . Since the 8-week HFD mice developed obesity and insulin resistance, we expected to find a con-siderable number of differentially expressed genes in the skeletal muscle of these mice as well. However, no genes were found with a significantly changed expression level of more than 1.3 fold. Despite the relatively small chang-es in gene expression, FA oxidation was identified by both microarray analysis strategies as one of two responsive pathways in muscle of HFD mice. Although mitochon-drial dysfunction has been observed in insulin resistance and type 2 diabetes, we observed that an HFD induces an upregulation of FA oxidation suggesting a metabolic ad-aptation. This is in line with numerous studies [25, 34–36] . Hoeks et al. [34] described that an 8-week HFD did not change mitochondrial function in rats as assessed by respirometry. In fact, they observed a tendency towards a higher respiratory control rate on lipid substrate, suggest-ing increased mitochondrial FA oxidative capacity [34] . Iossa et al. [35] also reported an increased lipid oxidative capacity in HFD rats. Two other groups, who assessed
several markers for mitochondrial FA oxidative capacity during HFD interventions, observed an increased rather than a decreased mitochondrial FA oxidative capacity [25, 36] . Altogether, these results suggest that skeletal muscle tissue can metabolically adapt to an increased lipid load. As such, the muscle can buffer the increased lipid supply. However, in this study we showed that the transcriptional upregulation of FA oxidative genes did not result in increased activity of HAD, an enzyme in-volved in � -oxidation. Additionally, CS activity (marker for the TCA cycle) and oxidative phosphorylation protein expression in HFD mice was comparable to LFD mice. Finally, the mitochondrial copy number, which is anoth-er indirect marker for mitochondrial oxidative capacity, was not changed in the HFD mice (data not shown). These results suggest that the capacity to oxidize lipids was still sufficient to handle the increased fat supply. Whether an HFD intervention results in impaired oxida-tive capacity in the long run is currently under investiga-tion.
The other HFD-responsive pathway was identified as an MAPK cascade. MAPK cascades are involved in the initiation of various cellular processes, such as prolifera-tion, differentiation and development, in response to ex-tracellular stimuli [37–39] . We observed a downregula-tion of the MAPK cascade in muscle of HFD mice. The gene with the strongest regulation was identified as the Mek6 gene (1.59-fold; FDR ! 0.001). Mek6 is involved in the activation of the p38 MAPK cascade via the phos-phorylation of p38 MAPK [30] . Since different in vitro studies have shown that activation of the p38 MAPK cas-cade decreases the uptake of glucose under the influence of insulin or exercise, it has been hypothesized that p38 MAPK is a negative regulator of the stimulated uptake of glucose in muscle [40–42] . Corresponding to the de-creased gene expression level of Mek6 , we found that p38 MAPK protein levels were decreased after an 8-week HFD. Since phospho-p38 MAPK protein levels were not changed, we observed increased activation of the p38 MAPK cascade in muscles of HFD mice. This is in line with results of Li et al. [43] , who observed increased p38 MAPK activation in heart tissue of HFD rats. Since in the present study the HFD mice were also insulin resistant, we consider these results support the hypothesis that p38 MAPK may act as a negative regulator of stimulated up-take of glucose.
We showed that 8-weeks of aging induce more pro-nounced changes in the muscle transcriptome than an HFD. We detected changes in the regulation of cell-cell interaction in the muscle transcriptome of both LFD
de Wilde et al. J Nutrigenet Nutrigenomics 2009;2:280–291290
and HFD mice. Interactions between cells as well as in-teractions between cells and the extracellular matrix are critical for cellular development, organization, mainte-nance and function of a certain tissue [44] . We also ob-served that genes involved in muscle development-relat-ed processes were changed in LFD mice as well as HFD mice. Indeed, throughout the 8-week intervention pe-riod, LFD and HFD mice showed an increase in LBM as evidenced by dual-energy X-ray absorptiometry. Since the mass of the skeleton increased only marginally ( � 0.09 g, data not shown), we consider the increase in the amount of LBM as an actual increase in muscle mass. Thus, within a period of 8 weeks, irrespective of diet, mice develop more muscle mass as reflected by the muscle transcriptome.
In conclusion, an 8-week HFD induces obesity and re-duced insulin sensitivity in C57BL/6J mice. However, HFD-responsive changes in the muscle transcriptome were relatively small. In fact, 8 weeks of aging induced
more pronounced changes in the muscle transcriptome than an HFD. Only one strategy revealed the transcrip-tional downregulation of the MAPK cascade, whereas both strategies showed the upregulation of FA oxidation, demonstrating that the two comparison strategies are confirmative as well as complementary. Therefore, we suggest using complementary analysis strategies in the genome-wide search for gene expression changes induced by mild interventions such as an HFD.
Acknowledgements
We thank Bert Weijers, Mechteld Grootte Bromhaar and Shohreh Keshtkar Ghiasabadi for excellent technical assistance with the animal experiment, hybridization of the microarrays and RNA isolations. Dr. Ping Wang is thanked for useful discus-sions. This study was funded by the Top Institute Food and Nutri-tion, with financial support from the Dutch government.
References
1 Alberti KG, Zimmet P, Shaw J: Metabolic syndrome – a new world-wide definition. A Consensus Statement from the International Diabetes Federation. Diabet Med 2006; 23: 469–480.
2 Zimmet P, Magliano D, Matsuzawa Y, Alber-ti G, Shaw J: The metabolic syndrome: a glob-al public health problem and a new defini-tion. J Atheroscler Thromb 2005; 12: 295–300.
3 Eckel RH, Grundy SM, Zimmet PZ: The metabolic syndrome. Lancet 2005; 365: 1415–1428.
4 Laaksonen DE, Niskanen L, Lakka HM, Lakka TA, Uusitupa M: Epidemiology and treatment of the metabolic syndrome. Ann Med. 2004; 36: 332–346.
5 Kahn BB, Flier JS: Obesity and insulin resis-tance. J Clin Invest 2000; 106: 473–481.
6 Goossens GH: The role of adipose tissue dys-function in the pathogenesis of obesity-relat-ed insulin resistance. Physiol Behav 2008; 94: 206–218.
7 Jacob S, Machann J, Rett K, Brechtel K, Volk A, Renn W, et al: Association of increased intramyocellular lipid content with insulin resistance in lean nondiabetic offspring of type 2 diabetic subjects. Diabetes 1999; 48: 1113–1119.
8 Krssak M, Falk Petersen K, Dresner A, Di-Pietro L, Vogel SM, Rothman DL, et al: In-tramyocellular lipid concentrations are cor-related with insulin sensitivity in humans: a 1 H NMR spectroscopy study. Diabetologia 1999; 42: 113–116.
9 Pan DA, Lillioja S, Kriketos AD, Milner MR, Baur LA, Bogardus C, et al: Skeletal muscle triglyceride levels are inversely related toinsulin action. Diabetes 1997; 46: 983–988.
10 Sinha R, Dufour S, Petersen KF, LeBon V, Enoksson S, Ma YZ, et al: Assessment of skel-etal muscle triglyceride content by 1 H nucle-ar magnetic resonance spectroscopy in lean and obese adolescents: relationships to insu-lin sensitivity, total body fat, and central ad-iposity. Diabetes 2002; 51: 1022–1027.
11 Goodpaster BH, He J, Watkins S, Kelley DE: Skeletal muscle lipid content and insulin re-sistance: evidence for a paradox in endur-ance-trained athletes. J Clin Endocrinol Metab 2001; 86: 5755–5761.
12 Phillips SM, Green HJ, Tarnopolsky MA, Heigenhauser GJ, Grant SM: Progressive ef-fect of endurance training on metabolic ad-aptations in working skeletal muscle. Am J Physiol 1996; 270(2 pt 1):E265–E272.
13 Petersen KF, Shulman GI: Etiology of insulin resistance. Am J Med 2006; 119(5 suppl 1):S10–S16.
14 Hegarty BD, Furler SM, Ye J, Cooney GJ, Kraegen EW: The role of intramuscular lipid in insulin resistance. Acta Physiol Scand 2003; 178: 373–383.
15 Trujillo ME, Scherer PE: Adipose tissue-de-rived factors: impact on health and disease. Endocr Rev 2006; 27: 762–778.
16 Nawrocki AR, Scherer PE: The delicate bal-ance between fat and muscle: adipokines in metabolic disease and musculoskeletal in-flammation. Curr Opin Pharmacol 2004; 4: 281–289.
17 Kershaw EE, Flier JS: Adipose tissue as an en-docrine organ. J Clin Endocrinol Metab 2004; 89: 2548–2556.
18 Muller M, Kersten S: Nutrigenomics: goals and strategies. Nat Rev Genet 2003; 4: 315–322.
19 Afman L, Muller M: Nutrigenomics: from molecular nutrition to prevention of disease. J Am Diet Assoc 2006; 106: 569–576.
20 de Wit NJ, Bosch-Vermeulen H, de Groot PJ, Hooiveld GJ, Bromhaar MM, Jansen J, et al: The role of the small intestine in the develop-ment of dietary fat-induced obesity and in-sulin resistance in C57BL/6J mice. BMC Med Genomics 2008; 1: 14.
21 van Schothorst EM, Bunschoten A, Schrau-wen P, Mensink RP, Keijer J: Effects of a high-fat, low- versus high-glycemic index diet:retardation of insulin resistance involves ad-ipose tissue modulation. FASEB J 2009; 23: 1092–1101.
22 Heijboer AC, Donga E, Voshol PJ, Dang ZC, Havekes LM, Romijn JA, et al: Sixteen hours of fasting differentially affects hepatic and muscle insulin sensitivity in mice. J Lipid Res 2005; 46: 582–588.

8-Week HFD Induces Obesity and Insulin Resistance in C57BL/6J Mice
J Nutrigenet Nutrigenomics 2009;2:280–291 291
23 Voshol PJ, Haemmerle G, Ouwens DM, Zim-mermann R, Zechner R, Teusink B, et al: In-creased hepatic insulin sensitivity together with decreased hepatic triglyceride stores in hormone-sensitive lipase-deficient mice. Endocrinology 2003; 144: 3456–3462.
24 Voshol PJ, Jong MC, Dahlmans VE, Kratky D, Levak-Frank S, Zechner R, et al: In mus-cle-specific lipoprotein lipase-overexpress-ing mice, muscle triglyceride content isincreased without inhibition of insulin-stimulated whole-body and muscle-specific glucose uptake. Diabetes 2001; 50: 2585–2590.
25 de Wilde J, Mohren R, van den Berg S, Boek-schoten M, Dijk KW, de Groot P, et al: Short-term high fat-feeding results in morphologi-cal and metabolic adaptations in the skeletal muscle of C57BL/6J mice. Physiol Genomics 2008; 32: 360–369.
26 Storey JD, Tibshirani R: Statistical signifi-cance for genomewide studies. Proc Natl Acad Sci USA. 2003; 100: 9440–9445.
27 Lee HK, Braynen W, Keshav K, Pavlidis P: ErmineJ: tool for functional analysis of gene expression data sets. BMC Bioinformatics 2005; 6: 269.
28 Subramanian A, Tamayo P, Mootha VK, Mukherjee S, Ebert BL, Gillette MA, et al: Gene set enrichment analysis: a knowledge-based approach for interpreting genome-wide expression profiles. Proc Natl Acad Sci USA 2005; 102: 15545–15550.
29 den Hoed M, Hesselink MK, van Kranen-burg GP, Westerterp KR: Habitual physical activity in daily life correlates positively with markers for mitochondrial capacity. J Appl Physiol 2008; 105: 561–568.
30 Stein B, Brady H, Yang MX, Young DB, Bar-bosa MS: Cloning and characterization of MEK6, a novel member of the mitogen-acti-vated protein kinase kinase cascade. J Biol Chem 1996; 271: 11427–11433.
31 Flier JS: Obesity wars: molecular progress confronts an expanding epidemic. Cell 2004; 116: 337–350.
32 Park SY, Cho YR, Kim HJ, Higashimori T, Danton C, Lee MK, et al: Unraveling the temporal pattern of diet-induced insulin re-sistance in individual organs and cardiac dysfunction in C57BL/6 mice. Diabetes 2005; 54: 3530–3540.
33 Kraegen EW, Clark PW, Jenkins AB, Daley EA, Chisholm DJ, Storlien LH: Development of muscle insulin resistance after liver insu-lin resistance in high-fat-fed rats. Diabetes 1991; 40: 1397–1403.
34 Hoeks J, Briede JJ, de Vogel J, Schaart G, Nab-ben M, Moonen-Kornips E, et al: Mitochon-drial function, content and ROS production in rat skeletal muscle: effect of high-fat feed-ing. FEBS Lett 2008; 582: 510–516.
35 Iossa S, Mollica MP, Lionetti L, Crescenzo R, Botta M, Liverini G: Skeletal muscle oxida-tive capacity in rats fed high-fat diet. Int J Obes Relat Metab Disord 2002; 26: 65–72.
36 Turner N, Bruce CR, Beale SM, Hoehn KL, So T, Rolph MS, et al: Excess lipid availabil-ity increases mitochondrial fatty acid oxida-tive capacity in muscle: evidence against a role for reduced fatty acid oxidation in lipid-induced insulin resistance in rodents. Diabe-tes 2007; 56: 2085–2092.
37 Han J, Lee JD, Bibbs L, Ulevitch RJ: A MAP kinase targeted by endotoxin and hyperos-molarity in mammalian cells. Science 1994; 265: 808–811.
38 Rouse J, Cohen P, Trigon S, Morange M, Alonso-Llamazares A, Zamanillo D, et al: A novel kinase cascade triggered by stress and heat shock that stimulates MAPKAP ki-nase-2 and phosphorylation of the small heat shock proteins. Cell 1994; 78: 1027–1037.
39 Seger R, Krebs EG: The MAPK signaling cas-cade. FASEB J 1995; 9: 726–735.
40 Fujishiro M, Gotoh Y, Katagiri H, Sakoda H, Ogihara T, Anai M, et al: Three mitogen-ac-tivated protein kinases inhibit insulin sig-naling by different mechanisms in 3T3-L1 adipocytes. Mol Endocrinol 2003; 17: 487–497.
41 Fujishiro M, Gotoh Y, Katagiri H, Sakoda H, Ogihara T, Anai M, et al: MKK6/3 and p38 MAPK pathway activation is not necessary for insulin-induced glucose uptake but regu-lates glucose transporter expression. J Biol Chem 2001; 276: 19800–19806.
42 Ho RC, Alcazar O, Fujii N, Hirshman MF, Goodyear LJ: p38 � MAPK regulation of glu-cose transporter expression and glucose up-take in L6 myotubes and mouse skeletal muscle. Am J Physiol Regul Integr Comp Physiol 2004; 286:R342–R349.
43 Li SY, Liu Y, Sigmon VK, McCort A, Ren J: High-fat diet enhances visceral advanced glycation end products, nuclear O-Glc-Nac modification, p38 mitogen-activated protein kinase activation and apoptosis. Diabetes, Obes Metab 2005; 7: 448–454.
44 Jamora C, Fuchs E: Intercellular adhesion, signalling and the cytoskeleton. Nature Cell Biol 2002; 4:E101–E108.