TESIS DOCTORAL - Archivo Digital UPMoa.upm.es/39604/1/MARIA_JOSE_HERNANDEZ_GARASA.pdftesis, uno de...
177
UNIVERSIDAD POLITÉCNICA DE MADRID ESCUELA TÉCNICA SUPERIOR DE INGENIEROS DE MONTES RESPUESTAS ANATÓMICO FISIOLÓGICAS FRENTE A ESTRÉS HÍDRICO EN PLANTACIONES DE ESPECIES DE CRECIMIENTO RÁPIDO PARA LA PRODUCCIÓN DE BIOMASA. TESIS DOCTORAL MARÍA JOSÉ HERNÁNDEZ GARASA Ingeniera de Montes Madrid, 2015
Transcript of TESIS DOCTORAL - Archivo Digital UPMoa.upm.es/39604/1/MARIA_JOSE_HERNANDEZ_GARASA.pdftesis, uno de...
UNIVERSIDAD POLITÉCNICA DE MADRID
ESCUELA TÉCNICA SUPERIOR
DE INGENIEROS DE MONTES
RESPUESTAS ANATÓMICO FISIOLÓGICAS
FRENTE A ESTRÉS HÍDRICO EN
PLANTACIONES DE ESPECIES DE
CRECIMIENTO RÁPIDO PARA LA
PRODUCCIÓN DE BIOMASA.
TESIS DOCTORAL
MARÍA JOSÉ HERNÁNDEZ GARASA
Ingeniera de Montes
Madrid, 2015

DEPARTAMENTO DE SILVOPASCICULTURA
ESCUELA TÉCNICA SUPERIOR DE INGENIEROS DE MONTES
UNIVERSIDAD POLITÉCNICA DE MADRID
RESPUESTAS ANATÓMICO FISIOLÓGICAS
FRENTE A ESTRÉS HÍDRICO EN
PLANTACIONES DE ESPECIES DE
CRECIMIENTO RÁPIDO PARA LA
PRODUCCIÓN DE BIOMASA.
TESIS DOCTORAL
AUTOR: MARÍA JOSÉ HERNÁNDEZ GARASA
Ingeniera de Montes
DIRECTORA: PILAR PITA ANDREU
Dr Ingeniero de Montes
Madrid, noviembre de 2015

Tribunal nombrado por el Mgfco. Y Excmo. Sr. Rector de la
Universidad Politécnica de Madrid, el día
….…....... de......................de…………….
Presidente D………………………………………………………
Vocal D………………………………………………………
Vocal D………………………………………………………
Vocal D………………………………………………………
Secretario D………………………………………………………
Realizado el acto de defensa y lectura de la Tesis el día
………………..de……………………………………….de 2015
Calificación………………………………………………………………
El Presidente Los Vocales
El Secretario

A FERNANDO

AGRADECIMIENTOS
Si estoy escribiendo estas líneas es por Pilar Pita, mi hada madrina y directora de tesis a la que
estoy sincera y profundamente agradecida por haberme animado a hacer la tesis con el vil
pretexto de no tirar el dinero pagado en concepto de tutela académica, en un momento en que
yo ya había tirado la toalla (y el dinero). Por haber tenido la santa paciencia de corregirme una y
otra vez, siempre con buen tono e incluso haciéndome reir, por haberme enseñado un montón
de cosas y haberme contagiado de ese entusiasmo que le generan los eucaliptos; porque rebosa
de ideas y de pasión por lo que hace, porque tiene la mente abierta, aunque le digas
barbaridades, las escucha atentamente ¡por si se puede aprovechar algo!. Me alegro de haberte
hecho caso Pilar y haber redactado la tesis, ¡me ha gustado hacerla!, y desde luego que sin tu
ayuda no lo hubiera conseguido. Muchísimas gracias, Pilar.
También tengo muchísimo que agradecer a Fernando, que ha sido un solete durante estos siete
meses intensivos y se ha encargado de todo para que yo pudiera dedicarme a esto; y a mis
hijos, que lo han entendido y han colaborado en lo que han podido.
También he de agradecer a Hortensia Sixto y a Isabel Cañellas, investigadoras de los proyectos
On Cultivos y Decocel en los que he estado trabajando desde 2006, que me hayan dado la
oportunidad de trabajar con ellas en esos proyectos en los que he aprendido mucho, y que me
permitieran llevar a cabo los trabajos necesarios para elaborar los dos últimos capítulos de esta
tesis, uno de los cuales, el tercero, me permitió conocer a Serfati, un auténtico artista del
microtomo, y a Chema, ambos de celulosas del CIFOR, a los que agradezco sinceramente su
colaboración y consejos.
Por último, y en primer lugar (son los agradecimientos, y aquí puedo contradecirme
alegremente) he de agradecer a mi madre esos magníficos 15 días del verano en que nos mimó
a mis hijos y a mi dándonos de comer cosas deliciosas mientras yo me dedicaba a hacer vida de
estudiante; y a mis hermanas, y a todos los que habéis colaborado para que yo consiguiera
terminar el librito. Por cierto tío Óscar, estoy esperando a ver qué te parece la introducción…..
Y ya para terminar y también en primer lugar quería dar las gracias al personal de apoyo del
INIA que es de lo mejorcito de ese centro de investigación tanto en lo laboral como en lo
personal: al Josepa, a Ana Parras, a M.Mario, Angelito y a mi queridísima Viscasillas, con la que
me he recorrido España entera midiendo chopos y con la que espero poder volver a trabajar
algún día. Gracias a todos.
¡Ah! , y a Carolina.

ÍNDICE
Resumen………………………………………………………………..13
Abstract…………………………………………………………………14
Introducción……………………………………………………………17
Objetivos………………………………………………………………..29
Resumen de material y métodos……………………………………...33
Capítulos………………………………………………………………..39
Capítulo 1……………………………………………………………....41
Capítulo 2…………………………………………………...………….67
Capítulo 3…………………………………………………………...….93
Capítulo 4……………………………………………………………..127
Discusión……………………………………………………………...145
Conclusiones………………………………………………………….157
Bibliografía………………………………………………………....…161

12
13
RESUMEN
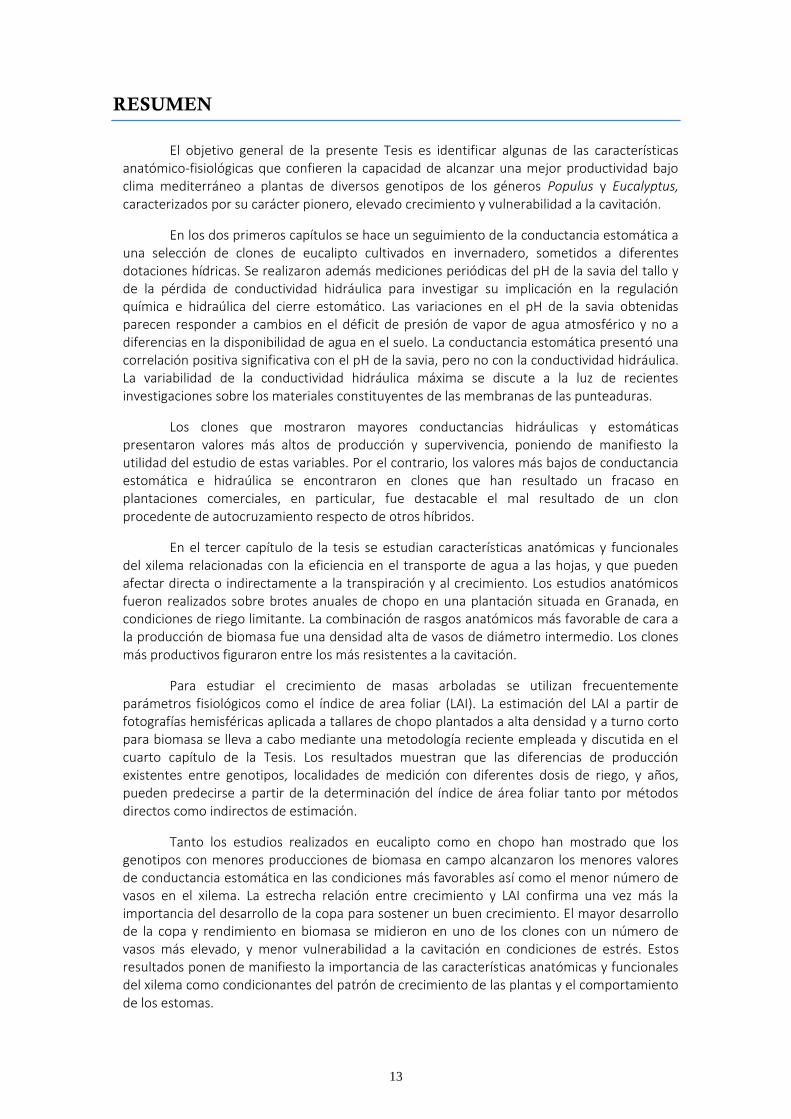
El objetivo general de la presente Tesis es identificar algunas de las características anatómico-fisiológicas que confieren la capacidad de alcanzar una mejor productividad bajo clima mediterráneo a plantas de diversos genotipos de los géneros Populus y Eucalyptus, caracterizados por su carácter pionero, elevado crecimiento y vulnerabilidad a la cavitación.
En los dos primeros capítulos se hace un seguimiento de la conductancia estomática a una selección de clones de eucalipto cultivados en invernadero, sometidos a diferentes dotaciones hídricas. Se realizaron además mediciones periódicas del pH de la savia del tallo y de la pérdida de conductividad hidráulica para investigar su implicación en la regulación química e hidraúlica del cierre estomático. Las variaciones en el pH de la savia obtenidas parecen responder a cambios en el déficit de presión de vapor de agua atmosférico y no a diferencias en la disponibilidad de agua en el suelo. La conductancia estomática presentó una correlación positiva significativa con el pH de la savia, pero no con la conductividad hidráulica. La variabilidad de la conductividad hidráulica máxima se discute a la luz de recientes investigaciones sobre los materiales constituyentes de las membranas de las punteaduras.
Los clones que mostraron mayores conductancias hidráulicas y estomáticas presentaron valores más altos de producción y supervivencia, poniendo de manifiesto la utilidad del estudio de estas variables. Por el contrario, los valores más bajos de conductancia estomática e hidraúlica se encontraron en clones que han resultado un fracaso en plantaciones comerciales, en particular, fue destacable el mal resultado de un clon procedente de autocruzamiento respecto de otros híbridos.
En el tercer capítulo de la tesis se estudian características anatómicas y funcionales del xilema relacionadas con la eficiencia en el transporte de agua a las hojas, y que pueden afectar directa o indirectamente a la transpiración y al crecimiento. Los estudios anatómicos fueron realizados sobre brotes anuales de chopo en una plantación situada en Granada, en condiciones de riego limitante. La combinación de rasgos anatómicos más favorable de cara a la producción de biomasa fue una densidad alta de vasos de diámetro intermedio. Los clones más productivos figuraron entre los más resistentes a la cavitación.
Para estudiar el crecimiento de masas arboladas se utilizan frecuentemente parámetros fisiológicos como el índice de area foliar (LAI). La estimación del LAI a partir de fotografías hemisféricas aplicada a tallares de chopo plantados a alta densidad y a turno corto para biomasa se lleva a cabo mediante una metodología reciente empleada y discutida en el cuarto capítulo de la Tesis. Los resultados muestran que las diferencias de producción existentes entre genotipos, localidades de medición con diferentes dosis de riego, y años, pueden predecirse a partir de la determinación del índice de área foliar tanto por métodos directos como indirectos de estimación.
Tanto los estudios realizados en eucalipto como en chopo han mostrado que los genotipos con menores producciones de biomasa en campo alcanzaron los menores valores de conductancia estomática en las condiciones más favorables así como el menor número de vasos en el xilema. La estrecha relación entre crecimiento y LAI confirma una vez más la importancia del desarrollo de la copa para sostener un buen crecimiento. El mayor desarrollo de la copa y rendimiento en biomasa se midieron en uno de los clones con un número de vasos más elevado, y menor vulnerabilidad a la cavitación en condiciones de estrés. Estos resultados ponen de manifiesto la importancia de las características anatómicas y funcionales del xilema como condicionantes del patrón de crecimiento de las plantas y el comportamiento de los estomas.
14
ABSTRACT
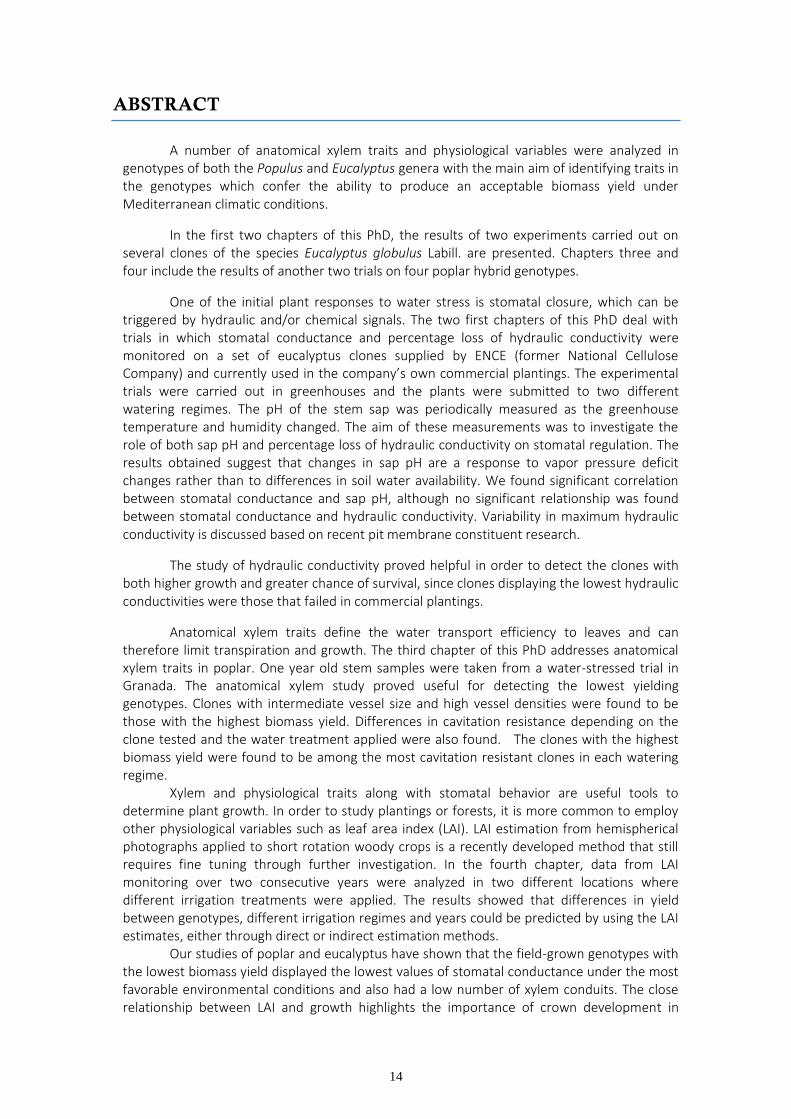
A number of anatomical xylem traits and physiological variables were analyzed in genotypes of both the Populus and Eucalyptus genera with the main aim of identifying traits in the genotypes which confer the ability to produce an acceptable biomass yield under Mediterranean climatic conditions.
In the first two chapters of this PhD, the results of two experiments carried out on several clones of the species Eucalyptus globulus Labill. are presented. Chapters three and four include the results of another two trials on four poplar hybrid genotypes.
One of the initial plant responses to water stress is stomatal closure, which can be triggered by hydraulic and/or chemical signals. The two first chapters of this PhD deal with trials in which stomatal conductance and percentage loss of hydraulic conductivity were monitored on a set of eucalyptus clones supplied by ENCE (former National Cellulose Company) and currently used in the company’s own commercial plantings. The experimental trials were carried out in greenhouses and the plants were submitted to two different watering regimes. The pH of the stem sap was periodically measured as the greenhouse temperature and humidity changed. The aim of these measurements was to investigate the role of both sap pH and percentage loss of hydraulic conductivity on stomatal regulation. The results obtained suggest that changes in sap pH are a response to vapor pressure deficit changes rather than to differences in soil water availability. We found significant correlation between stomatal conductance and sap pH, although no significant relationship was found between stomatal conductance and hydraulic conductivity. Variability in maximum hydraulic conductivity is discussed based on recent pit membrane constituent research.
The study of hydraulic conductivity proved helpful in order to detect the clones with both higher growth and greater chance of survival, since clones displaying the lowest hydraulic conductivities were those that failed in commercial plantings.
Anatomical xylem traits define the water transport efficiency to leaves and can therefore limit transpiration and growth. The third chapter of this PhD addresses anatomical xylem traits in poplar. One year old stem samples were taken from a water-stressed trial in Granada. The anatomical xylem study proved useful for detecting the lowest yielding genotypes. Clones with intermediate vessel size and high vessel densities were found to be those with the highest biomass yield. Differences in cavitation resistance depending on the clone tested and the water treatment applied were also found. The clones with the highest biomass yield were found to be among the most cavitation resistant clones in each watering regime.
Xylem and physiological traits along with stomatal behavior are useful tools to determine plant growth. In order to study plantings or forests, it is more common to employ other physiological variables such as leaf area index (LAI). LAI estimation from hemispherical photographs applied to short rotation woody crops is a recently developed method that still requires fine tuning through further investigation. In the fourth chapter, data from LAI monitoring over two consecutive years were analyzed in two different locations where different irrigation treatments were applied. The results showed that differences in yield between genotypes, different irrigation regimes and years could be predicted by using the LAI estimates, either through direct or indirect estimation methods.
Our studies of poplar and eucalyptus have shown that the field-grown genotypes with the lowest biomass yield displayed the lowest values of stomatal conductance under the most favorable environmental conditions and also had a low number of xylem conduits. The close relationship between LAI and growth highlights the importance of crown development in

15
biomass growth. The highest LAI and biomass yield were recorded in one of the clones with higher vessel density and the lowest vulnerability to cavitation under stress conditions. These results underline the importance of research into anatomical and functional traits as factors influencing plant growth patterns and stomatal behavior.

16
17
INTRODUCCIÓN

18

19
INTRODUCCIÓN
De los aproximadamente 15 millones de metros cúbicos de madera que se cortan
anualmente en España, el 68% se obtiene de plantaciones forestales intensivas de crecimiento
rápido, principalmente localizadas en el Norte de España, que posee un clima atlántico, suave y
lluvioso, favorable para la producción forestal. Parte de esas plantaciones forestales de
crecimiento rápido se encuentran en clima mediterráneo como son las plantaciones de
eucalipto situadas en el Suroeste de España, las choperas situadas en las vegas de toda la
Península o los tallares de chopo a turno corto con fines energéticos, experimentales en la
actualidad y cultivados en regadío. Eucalyptus globulus es la frondosa que produce el mayor
volumen anual de madera en España, seguida por los cultivos de híbridos de chopo (AEF 2013).
La Directiva 2009/28/CE del Parlamento Europeo y del Consejo de Europa relativa al
fomento del uso de energía procedente de fuentes renovables establece objetivos mínimos
vinculantes para el conjunto de la Unión Europea y para cada uno de los Estados miembros.
Concretamente, la directiva establece como objetivo conseguir una cuota mínima del 20% de
energía procedente de fuentes renovables en el consumo final bruto de energía de la Unión
Europea, y el mismo objetivo se ha establecido para España. Esta responsabilidad ha
revitalizado la investigación en materia de plantaciones de alta densidad y turno corto, que se
realiza en España principalmente con híbridos de chopo y ha conducido al cambio de uso de
algunas de las plantaciones existentes de Eucalyptus globulus Labill que han pasado a destinar
sus productos a centrales eléctricas. La principal característica de las plantaciones de
crecimiento rápido con fines energéticos estriba en los bajos requerimientos de calidad exigidos
a la madera.
Las plantaciones de crecimiento rápido localizadas en ambientes mediterráneos, debido
a la irregularidad inherente a este clima, están sometidas a un ambiente cambiante, a fuertes
dosis de irradiancia solar coincidentes con la temporada de sequía, altas temperaturas y a otros
tipos de estrés entre los que el más importante en nuestras latitudes es la falta de agua, la
sequía.
La sequía es uno de los factores que más inciden en la disminución de la producción de
todos los cultivos en el mundo (UNFCCC 94). Las plantas presentan diferentes estrategias para
afrontar la sequía (Larcher 95, Lewitt 80): desde las que eluden la sequía muriendo y dejando
sus semillas para que germinen en la siguiente estación hasta las que la soportan (resistentes),
como es el caso de los géneros y especies con los que tratamos en este trabajo: chopos y
eucaliptos.
En condiciones de estrés hídrico el suministro hídrico es menor o/y el déficit de presión
de vapor atmosférico es mayor, y las plantas presentan adaptaciones a la sequía orientadas a
controlar el gasto de agua, como disminuir la superficie foliar, y con ella el crecimiento,
aumentar la eficiencia en el uso del agua, para que al abrir los estomas, se pierda la menor
cantidad posible de vapor de agua por molécula de CO2 absorbida por la planta, modificar la
densidad estomática (David et al. 2005), incluso tirar las hojas para evitar la transpiración, o
incrementar la proporción de biomasa radical (absorbe agua) frente a biomasa aérea (pierde
agua).
20
El agua en la planta se mueve siguiendo un gradiente de potencial hídrico. Para
modelizar el transporte de agua se utiliza frecuentemente una analogía a la ley de Ohm o a la
ley de Darcy o de Fick (Meinzer 2002, Vilagrosa et al. 2012, Noblin et al. 2007), pues todas ellas
relacionan un flujo con un gradiente, ya sea de potencial hídrico, de energía potencial o de
concentración. En la ley de Ohm: V=IR-1, V es la diferencia de potencial eléctrico, R es la
resistencia al paso de la corriente e I es la intensidad de corriente, y para emplearla como
modelo de tranporte de agua en las plantas se considera que V es el gradiente de potencial
hídrico (TѰ ) entre el suelo y la atmósfera que rodea a las hojas, R es la resistencia al paso del
flujo de savia desde el suelo hasta las hojas, cuya inversa es la conductancia hidráulica (kh) y por
último I se asimila al flujo de agua transportado desde el suelo hasta las hojas donde es
transpirado en su mayor parte (95%) (Kramer and Boyer 1995), de modo que la ley puede
expresarse como:
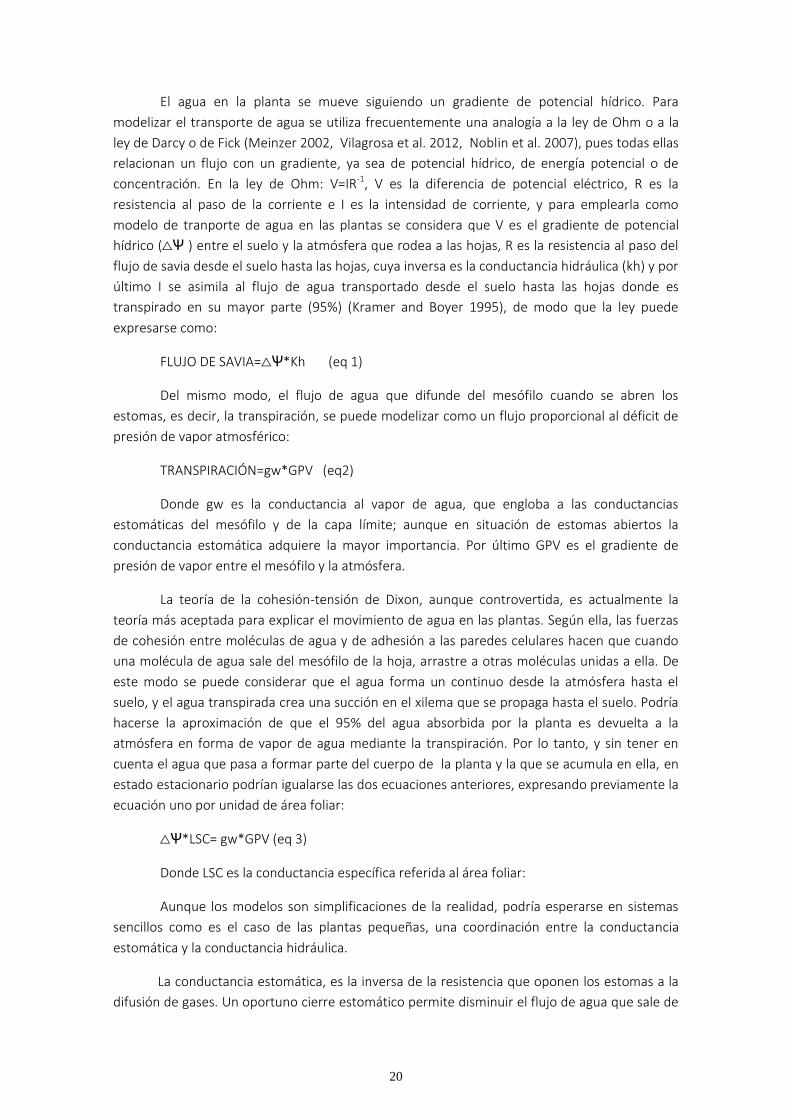
FLUJO DE SAVIA=TѰ*Kh (eq 1)
Del mismo modo, el flujo de agua que difunde del mesófilo cuando se abren los
estomas, es decir, la transpiración, se puede modelizar como un flujo proporcional al déficit de
presión de vapor atmosférico:
TRANSPIRACIÓN=gw*GPV (eq2)
Donde gw es la conductancia al vapor de agua, que engloba a las conductancias
estomáticas del mesófilo y de la capa límite; aunque en situación de estomas abiertos la
conductancia estomática adquiere la mayor importancia. Por último GPV es el gradiente de
presión de vapor entre el mesófilo y la atmósfera.
La teoría de la cohesión-tensión de Dixon, aunque controvertida, es actualmente la
teoría más aceptada para explicar el movimiento de agua en las plantas. Según ella, las fuerzas
de cohesión entre moléculas de agua y de adhesión a las paredes celulares hacen que cuando
una molécula de agua sale del mesófilo de la hoja, arrastre a otras moléculas unidas a ella. De
este modo se puede considerar que el agua forma un continuo desde la atmósfera hasta el
suelo, y el agua transpirada crea una succión en el xilema que se propaga hasta el suelo. Podría
hacerse la aproximación de que el 95% del agua absorbida por la planta es devuelta a la
atmósfera en forma de vapor de agua mediante la transpiración. Por lo tanto, y sin tener en
cuenta el agua que pasa a formar parte del cuerpo de la planta y la que se acumula en ella, en
estado estacionario podrían igualarse las dos ecuaciones anteriores, expresando previamente la
ecuación uno por unidad de área foliar:
TѰ*LSC= gw*GPV (eq 3)
Donde LSC es la conductancia específica referida al área foliar:
Aunque los modelos son simplificaciones de la realidad, podría esperarse en sistemas
sencillos como es el caso de las plantas pequeñas, una coordinación entre la conductancia
estomática y la conductancia hidráulica.
La conductancia estomática, es la inversa de la resistencia que oponen los estomas a la
difusión de gases. Un oportuno cierre estomático permite disminuir el flujo de agua que sale de
21
la planta, disminuyendo la transpiración. Es una de las variables clave a estudiar cuando se
analizan las respuestas de las plantas frente al estrés. La apertura estomática permite la
captación del CO2, y la refrigeración de la hoja cuando las temperaturas son altas. La diferencia
en la presión de vapor de agua existente entre el interior y exterior de la planta determina la
máxima tasa de transpiración. Transpiración y disponibilidad de agua en el suelo a su vez
determinan la magnitud del potencial hídrico, que si es muy negativo puede dar lugar a la
ruptura de la columna de agua y a la formación de embolismos que interrumpen el transporte
de la savia, y que si son muy numerosos pueden comprometer el suministro de agua dentro de
la planta. La existencia de un control estomático que permita cerrar estomas antes de que se
produzca un nivel de embolismo que colapse el xilema es fundamental para la supervivencia de
las plantas.
Los estomas responden a diferentes estímulos: luz, concentración de CO2, a mayor o menor
contenido de humedad en el suelo o en la atmósfera, a veces a través de posibles señales
químicas, como cambios en el pH de la savia en el xilema, cambios en la concentración de ácido
abscísico, (ABA), implicado en el cierre estomático (Israelsson et al. 2006) y a veces mediante
señales hidráulicas (descenso del potencial hídrico, pérdida de conductividad hidráulica)
(Tombesi et al. 2015, Holtä et al. 2012). La utilización de cultivos split pot, en los que la raíz de
una planta quedaba dividida en varios volúmenes de suelo sometidos a diferentes contenidos
de humedad, fortaleció la idea de la existencia de señales químicas, pues tras someter a una de
las partes de la raíz a estrés hídrico, se producía cierre estomático en las hojas de la planta sin
que ésta experimentara una caída importante en el potencial hídrico (Blackman & Davies 1985,
Comstock 2001). En la savia que fluye por el xilema se han medido incrementos en la
concentración de ácido abscísico (ABA) producido en raíces cuando las plantas se someten a
estrés, y se han propuesto mecanismos para explicar la relación entre el incremento de ABA en
la savia y el cierre estomático, basados en el papel que el ácido abscísico tiene sobre el tráfico
de iones en el transporte de solutos hacia las células de guarda y su cierre (Schroeder et al.
2001). El estudio de las señales implicadas en el cierre estomático puede conducirnos a detectar
diferencias clonales en la sensibilidad a las mismas que pueda suponer una ventaja para la
supervivencia en ambientes cambiantes.
La respuesta estomática de las plantas frente al estrés hídrico dista mucho de ser
homogénea. Mientras algunas plantas cierran estomas muy rápidamente ante pequeños
decrementos del potencial hídrico, y no sufren oscilaciones importantes del mismo (plantas
isohídricas), hay otras que no cierran estomas hasta haber disminuido notablemente su
potencial hídrico (anisohídricas). Las especies utilizadas en esta tesis pertenecen a ambos
grupos: Eucalyptus globulus muestra un comportamiento anisohídrico, y de entre los híbridos
empleados del género Populus, I-214 es considerado como isohídrico (Tardieu & Simmoneau
98), si bien, esta clasificación es relativa e incluso dentro de una misma especie se pueden
encontrar comportamientos diferentes en lo referente a la respuesta estomática. Damour et al.
(2010) en un artículo de revisión de modelos de conductancia estomática afirman que la
sensibilidad de la respuesta estomática al ácido abscísico depende del comportamiento
isohídrico o anisohídrico de la especie. En plantas isohídricas la sensibilidad es inversamente
proporcional al potencial hídrico y en plantas anisohídricas la respuesta estomática está
regulada fundamentalmente por el ácido abscísico (Tardieu et al. 1996).
22
En el segundo capítulo de la tesis se estudia el pH de la savia como posible señal de
cierre estomático en cinco clones de eucalipto
Cuando la sequía pasa de ser un fenómeno esporádico a convertirse en crónico,
puede que el control estomático no sea suficiente para evitar el colapso del xilema y
aparezcan respuestas adicionales. Numerosos estudios demuestran una disminución de la
conductancia hidráulica del xilema en condiciones de déficit hídrico (Lauri et al. 2014, Pangle
et al. 2015, Anderegg et al. 2014). Algunos autores han sugerido que esta respuesta puede
contribuir a un uso más gradual del agua en el suelo (Eamus et al.2000, Hutley et al. 2001 Do
et al. 2008). La planta puede incrementar la resistencia al paso del agua incrementando el
número de ramas o de brotes, haciéndose arbustiva, acortando la longitud de los vasos,
impermeabilizando las punteaduras, o disminuyendo el diámetro de los vasos, de modo que
se incremente la pérdida de carga en los mismos durante el transporte. Estos cambios
anatómicos suelen ir acompañados de una disminución del tamaño de las hojas y del
crecimiento, y no son reversibles; suponen una vez finalizado el periodo de limitación del
recurso, una limitación al crecimiento durante el tiempo necesario para crear nuevo tejido
conductor adaptado a las nuevas circunstancias. Estas posibles respuestas al estrés se
traducen generalmente en disminuciones de la vulnerabilidad a la cavitación. (Awad et al.
2012, Zolfaghar et al.2015)
La vulnerabilidad a la cavitación es otro de los parámetros más ampliamente utilizados
para estudiar la capacidad de las plantas de resistir situaciones de estrés. Cuando la diferencia
en el gradiente de presión de vapor existente entre la atmósfera y la planta es muy elevado,
se alcanzan potenciales hídricos muy negativos en el xilema que pueden dar lugar a la rotura
de las columnas de savia en el interior de los vasos xilemáticos. Si la planta no responde, no
cierra estomas o la respuesta no es suficiente y se mantienen presiones muy negativas en el
xilema en una superficie conductora cada vez menor, el embolismo puede propagarse por la
planta a través de las punteaduras.
La vulnerabilidad a la cavitación es una medida de la facilidad del xilema para
embolizarse y suele expresarse como la tensión xilemática a la que la planta pierde el 50% de
su conductividad máxima por entrada de aire en el xilema. Es una característica que cambia en
función del medio en que la planta crece, es una de las características que hacen que las
plantas se aclimaten a cambios en el ambiente. Pammenter (1998) o Zolfaghar (2015) en
eucalipto y Awad (2010) en chopo entre otros muchos trabajos han mostrado cómo las
plantas de estas especies sometidas a estrés incrementan su resistencia a la cavitación
respecto a las plantas bien regadas.
En los capítulos1, 2 y 3 se estudia la conductividad hidráulica y la vulnerabilidad a la
cavitación de eucaliptos y chopos y los cambios que el estrés provoca en estas variables.
La vulnerabilidad a la cavitación es una propiedad intrínseca de la anatomía del xilema
(Fichot 2015), y del mismo modo que lo hace la vulnerabilidad a la cavitación, las células
xilemáticas pueden cambiar para adaptarse a las condiciones del medio. Hay especies más y
menos plásticas, incluso dentro de la misma especie hay genotipos más y menos plásticos. En
el caso del estrés hídrico, es común observar en especies con bajo suministro hídrico una
23
disminución en el tamaño de las células en general (Lombardini 2006) y en las que componen
el xilema en particular; lo que en términos hidráulicos se traduce en un incremento de la
resistencia al paso del agua, o dicho de otro modo, en una disminución de la conductividad
hidráulica (Lovisolo y Schubert 98 en Vitis, Fichot et al. 2010 en chopo, Niijse et al 2001 en
Crisantemo, etc). El compromiso entre eficiencia hidráulica y seguridad frente a embolismos
es conocido como el trade-off efficiency safety: cuando las plantas aumentan la resistencia al
paso de la savia, ello supone un coste en términos de crecimiento pues disminuye la
capacidad de transporte, que está ligada a la capacidad de absorber los recursos necesarios
para el crecimiento de la planta. La existencia de este compromiso está muy documentada en
numerosas especies, aunque hay trabajos en los que la relación entre eficiencia y seguridad no
está clara. Por ejemplo, Maherali et al. (2004), revisando datos de 150 especies encuentran
claro el trade-off en coníferas pero no en angiospermas. Igualmente hay otros trabajos como
el de Burgess et al (2014) en sequoias o Fichot et al (2010) y Plavcová & Hacke (2012) en
chopo en los que se pone en duda la existencia de este trade off, dejando abierta la puerta a la
posibilidad de encontrar genotipos productivos y resistentes a la cavitación entre la
variabilidad genética existente. Es digno de mención el caso de Acacia harpophylla, (Van der
Driessche 1971), una especie australiana de regiones semiáridas altamente resistente al estrés
que presenta tasas fotosintéticas equivalentes a las de una especie de clima templado cuando
crece en condiciones de agua no limitantes y temperaturas suaves.
La relación entre la anatomía del xilema y la conductividad hidráulica, es una relación
que liga estructura y función. Los vasos de grandes luces, largos, con punteaduras permeables,
serán capaces de transportar un flujo mayor que vasos delgados, vasos con punteaduras poco
permeables o vasos cortos que obligan a la savia a atravesar mayor número de punteaduras.
Basándose en estudios florísticos como los del botánico Carlquist (1988), en los que se
observa que en las zonas tropicales la evolución ha conducido a la existencia de plantas con
tejido xilemático muy eficiente desde el punto de vista conductivo y muy vulnerables a la
cavitación, y que las plantas de zonas desérticas presentan xilemas de numerosos vasos de
pequeño diámetro y muy resistentes a la cavitación, se han realizado numerosos estudios
anatómicos del xilema buscando las causas de las diferencias en la vulnerabilidad a la
cavitación en las plantas, pensando que el diámetro de los elementos de los vasos podría ser
un elemento de gran importancia a la hora de determinar la vulnerabilidad a la cavitación y la
capacidad de crecimiento de la planta, pues dentro de una planta sí se ha comprobado que se
embolizan en primer lugar los vasos de mayor tamaño (Hacke & Sperry 2001). Hay muchos
resultados apoyando la relación entre el diámetro del vaso y la mayor vulnerabilidad de éstos
a la cavitación; por ejemplo, en climas fríos, hay una selección natural de especies con vasos
de diámetros pequeños (Schreiber et al.2011), pues los vasos de grandes diámetros son
embolizados fácilmente por la formación de burbujas que tiene lugar durante el deshielo. Sin
embargo, en el caso de las plantas sometidas a estrés hídrico, no está claro que las plantas
cuyos vasos presentan mayor diámetro sean más vulnerables a la cavitación, y es frecuente
encontrar falta de correlación entre vulnerabilidad a la cavitación y el diámetro de los vasos
(Tyree et al., 1994, Pockman & Sperry, 2000; Hacke et al., 2006, Burges et al 2006, Vynia et al
2013).
24
La longitud de los vasos debería tener una importancia crucial en la vulnerabilidad del
xilema a la cavitación, ya que la conducción de la savia de un vaso a otro ha de producirse por
punteaduras, que suponen una resistencia al paso del flujo muchísimo más elevada que la que
supone pasar de un elemento de vaso a otro. Por lo tanto, cuanto más largos sean los vasos,
menos punteaduras habrá de atravesar el flujo de savia, y la eficiencia en el transporte será
mayor; aunque el embolismo de un vaso sería más dañino en un vaso largo que en un vaso
corto (Comstock &Sperry 2000, Jacobsen et al 2012). Los estudios de longitud de vasos son
escasos, dado lo laborioso de la tarea. La longitud de un vaso en micrómetros, medida con un
microscopio, es de dimensiones enormes comparada con la magnitud del diámetro, y los
trabajos existentes sobre longitudes de vasos suelen basarse en estimaciones indirectas
haciendo una serie de cortes a lo largo de un segmento de tallo inyectado con alguna
sustancia coloreada y observando al microscopio el número de vasos rellenos en cada sección
muestreada (Zimmermann 1981, Ewers & Fisher 1989, Nijsee J 2004). Según la hipótesis de
“air-seeding” la cavitación de elementos conductores del xilema se inicia en las punteaduras
(Shen et al. 2012).
Wheeler et al en 2005 no encontraron relación entre la resistencia de las punteaduras
y la vulnerabilidad a la cavitación en 15 especies de angiospermas, por lo que propusieron
“the rare pit hypothesis”, hipótesis en la que se propone que las burbujas de aire, cuando las
tensiones son muy negativas, pasan de un vaso a otro lateralmente por la punteadura más
débil del vaso. Supuestamente, cuantas más punteaduras tiene un vaso, mayor sería la
probabilidad de que una fallara y se produjera el paso del aire a través de la punteadura. Sin
embargo, el hecho de que las especies que vegetan en sitios áridos presenten vasos de
diámetros menores que las especies de sitios húmedos hace pensar que pudiera existir una
relación entre el diámetro del vaso y las características de las punteaduras, de forma que los
vasos de mayor tamaño tuvieran punteaduras más débiles que las especies de vaso de menor
diámetro. Esto estaría justificado desde un punto de vista del desarrollo de la planta, pues
cuando existe un suministro de agua abundante la división celular es rápida, la demanda de
carbohidratos también, y la pared primaria se deposita con menos medios materiales y
mayores presiones debido a una mayor presión de turgencia de los tejidos que en el caso de
suministro limitante de agua, caso en el que la demanda de hidratos de carbono es menor y
las paredes primarias que forman las membranas de las punteaduras pueden percibir una
mayor cantidad de materia prima y presentar una menor porosidad (Tyree & Sperry 1989).
Si no existe relación entre el diámetro del vaso y las características de las punteaduras
es posible que no haya relación entre la vulnerabilidad a la cavitación y la eficiencia
conductiva. Vasos largos y de gran diámetro podrían presentar punteaduras muy resistentes al
paso de aire. Esto supondría un xilema en parte eficiente, por las magnitudes diámetro y
longitud, y en parte resistente, por las características de las punteaduras, aunque la parte
eficiente aporta vulnerabilidad, ya que la inutilización por embolia de un vaso voluminoso
supone un porcentaje de conductividad hidráulica no despreciable. La relación entre diámetro
y longitud de vasos no es clara: aunque algunos trabajos apuntan a que están relacionados
(Martínez-Vilalta et al. (2002), Cai et al. 2010, Zimmermann & Jeje 1981, Ewers & Fisher 1989),
otros como el de Jacobsen et al (2012) no encontraron relación lineal significativa entre
diámetro y longitud medios de vasos de diferentes especies de árboles y lianas y sí
encontraron relación entre ambas variables para arbustos.
25
Todas estas consideraciones han conducido a la publicación de trabajos en los que se
pone en duda la existencia en determinadas especies como en Sequoia (Burges et al 2006) o
en particular en chopo (Plavcová & Hacke 2012, Fichot et al 2010) del conocido como trade-
off efficiency safety, compromiso entre eficiencia y seguridad, por el cual se considera que si la
planta construye un xilema eficiente éste será será vulnerable y si invierte en xilema seguro
será ineficiente, y supondrá un mayor costo de creación del xilema y probablemente se
traducirá en un menor crecimiento. El hallazgo de casos en los que los genotipos más
productivos no son los más vulnerables indica la posible existencia, dentro de la variabilidad
genética que ofrecen especies como el chopo y el eucalipto, de genotipos que puedan
soportar condiciones de sequía y ofrecer crecimientos comerciales aceptables.
En el capítulo 3 se discute sobre la existencia del compromiso entre eficiencia y
seguridad en cuatro genotipos de Populus empleados en cultivos energéticos experimentales
en condiciones de estrés.
Del mismo modo que el xilema de la planta lleva impresas características funcionales
del mismo, el desarrollo de la superficie foliar se ve afectado por los cambios que se han ido
sucediendo en suministro hídrico, incrementos de déficit de presión de vapor, variaciones de
intensidad lumínica, etc. La sequía induce en los organismos vegetales respuestas
encaminadas generalmente a reducir la superficie foliar e incrementar el grosor del mesófilo;
se producen ajustes en la conductancia estomática y en la conductividad hidráulica y por tanto
en la tasa fotosintética y en último término en el crecimiento de las hojas y de la planta entera
(Marron et al 2005, Fichot et al 2009) que es lo que, también en último término, nos interesa.
Los trabajos de laboratorio e invernadero en condiciones semicontroladas aportan
información muy valiosa, pero también es conveniente realizar trabajos en el campo, que
tengan en cuenta todas las posibles causas de variación en las condiciones ambientales, y un
horizonte temporal más amplio al considerado en los ensayos de invernadero. La superficie
foliar capta la radiación fotosintéticamente activa y es la encargada de absorber CO2 y perder
agua, por lo que la determinación del índice de área foliar (LAI) aporta información no sólo de
la productividad de la plantación (Pellis et al. 2004, Dunlap & Stettler 1998, Ridge et al., 1986,
Zavitkovski et al., 1976), sino también de su consumo de agua. Distintas tasas de
conductancia estomática entre clones podrían equilibrarse con diferentes índices de área
foliar.
La medición de la superficie foliar es una tarea tediosa, por lo que se han desarrollado
métodos indirectos que permitan estimarlo a partir de otras variables fáciles de medir, como
la transmisión de la luz a través de la copa, empleada por ejemplo por el dispositivo LAI-2000.
Con el mismo fundamento científico puede estimarse el LAI a partir de fotografías
hemisféricas.
En el cuarto capítulo de la tesis se ha realizado el seguimiento del LAI en dos
plantaciones de demostración de chopo en turno corto y alta densidad en dos localidades del
norte y centro peninsular durante dos años, empleando los mismos clones estudiados en el
capítulo 3.
26
En estas plantaciones de crecimiento rápido es habitual utilizar material genético
mejorado, generalmente seleccionado para presentar elevadas producciones y resistencia a
enfermedades. Uno de los principales problemas de las especies comerciales: eucalipto,
chopo, pino radiata, picea abies….es que experimentan una marcada interacción genotipo x
ambiente en la producción de biomasa. Existe interacción genotipo-ambiente cuando un
mismo genotipo muestra diferentes producciones sometido a diferentes ambientes. Es un
fenómeno extraordinariamente común y dificulta la comparación general de genotipos, pues
el genotipo más productivo en una estación ecológica puede pasar a ser uno de los menos
productivos en otra y obliga en ocasiones a los mejoradores a seleccionar genotipos para un
determinado ambiente o a optar por genotipos intermedios, sacrificando productividad.
En todos los capítulos se estudian rasgos anatómicos y/o fisiológicos de plantas
sometidas a más de un ambiente o tratamiento con el objetivo final de encontrar diferencias
entre clones y entre diferentes ambientes que permitan identificar genotipos más y menos
adaptables así como qué rasgos puedan ser más importantes de cara a la producción de
biomasa y supervivencia de la masa.
A continuación se presenta un breve resumen del contenido de los cuatro capítulos
que componen la tesis doctoral:
En el primer capítulo se somete a seis clones de eucalipto a dos diferentes
tratamientos hídricos durante un mes, uno de los regímenes consiste en una reducción del
20% respecto a un tratamiento control (regado a 95% de la capacidad de campo).
Posteriormente, durante tres semanas más se somete a la totalidad de las plantas a un único
régimen hídrico, no limitante y se observan las respuestas de las plantas sometidas a cada
tratamiento al medioambiente del invernadero durante el mes de junio. Se estudiaron
variables anatómicas del xilema (número de vasos, diámetro de vasos, superficie conductora,
distribuciones diamétricas) y variables fisiológicas: de intercambio gaseoso y de conductividad
hidráulica. Se observó cómo se aclimataron las plantas sometidas a los dos tratamientos a las
nuevas condiciones. Durante el mes de junio se produjo una disminución de la conductividad
hidraúlica en las plantas sometidas a ambos tratamientos, siendo ésta mucho más notable en
las plantas que habían pertenecido al régimen de riego más favorable. No solamente
disminuyó la conductividad hidráulica, sino que disminuyó la conductividad hidráulica máxima,
también en ambos tratamientos. La disminución de la conductividad máxima no pudo ser
atribuída a la generación de un nuevo xilema menos conductivo, pues los análisis del xilema
indicaron precisamente lo contrario.
Las diferencias entre clones no fueron tan marcadas como las diferencias entre
tratamientos. Los clones que llegaron al final del ensayo con mayor y menor conductividad
hidráulica máxima coincidieron con los clones con menor tamaño de los vasos y con menor
número de vasos respectivamente.
Se propone como hipótesis que la disminución de la conductividad máxima sea una
consecuencia de la impermeabilización transitoria de las punteaduras de los vasos
embolizados con el objeto de aislarlos del resto del xilema para poder ser rellenados.
27
La conductancia estomática se coordinó con la conductividad hidráulica y ambas
disminuyeron hacia la tercera semana y última del experimento. La conductividad hidráulica
comenzó a disminuir antes que la conductancia estomática. Los resultados obtenidos sugieren
que la disminución del flujo de savia podría ser el desencadenante del cierre parcial
estomático detectado, sin descartar que pudiese existir alguna señal química implicada.
En el segundo capítulo se estudia cómo varían la conductancia estomática y la
conductividad hidraúlica en cinco clones de eucalipto a medida que cambian las condiciones
atmosféricas en plantas sometidas a diferentes dosis de riego. También se midió la variación
del pH de la savia y el potencial hídrico con el objeto de determinar si el cierre estomático
provocado por el estrés al bajar el potencial hídrico puede ser debido a señales hidráulicas,
químicas o a ambas. Los resultados mostraron que a raíz de una subida continuada en el
déficit de vapor de presión, el potencial hídrico bajó coincidiendo con una disminución tanto
en el pH de la savia como en la conductancia estomática. No hubo diferencias entre clones en
el valor del pH alcanzado, pero sí en los valores de conductancia estomática. Algunos clones
cerraron estomas más eficientemente que otros. La pérdida de conductividad hidráulica se
mantuvo sin cambios significativos a lo largo de todo el experimento, mientras que el pH de la
savia mostró una relación lineal con el potencial hídrico, sugiriendo la posible existencia de
una señal química como responsable del cierre estomático. Los cambios en el pH de la savia se
produjeron en ambos tratamientos de riego, indicando que la señal de cierre estomático
pueda no ser desencadenada por falta de agua en el suelo y por tanto, en caso de existir una
señal química desencadenante de cierre estomático, esta no parece que sea una señal emitida
desde la raíz a las hojas.
En el tercer capítulo, se lleva a cabo un estudio anatómico del xilema en plantas
pertenecientes a cuatro genotipos de chopo situados en una plantación experimental cuyo
objetivo era evaluar la producción de biomasa en densidades de 20.000 pies/ha. La plantación
fue sometida a restricciones hídricas que produjeron una defoliación total.
Se midieron número y diámetro de todos los vasos de las secciones normales (a 130
cm de altura) de una muestra de 52 elementos. El estudio tenía como fin encontrar
diferencias anatómicas entre clones relacionadas con el crecimiento. Para complementar este
estudio anatómico se construyeron unas curvas de vulnerabilidad con los mismos cuatro
genotipos sometidos a dos regímenes hídricos diferentes empleando dos métodos: centrífuga
y deshidratación. Se analizaron las diferencias en la vulnerabilidad a la cavitación entre clones.
Actualmente el método de la centrífuga para obtener curvas de vulnerabilidad es
controvertido, pues se sospecha que pueda generar curvas desplazadas hacia valores menos
negativos de potencial hídrico, es decir, incrementaría la vulnerabilidad. Los resultados,
efectivamente, mostraron que las curvas obtenidas a partir de muestras centrifugadas están
desplazadas hacia valores menos negativos, pero el ranking de clones por vulnerabilidad fue
parecido empleando ambos métodos.
Los resultados revelaron la aclimatación de las plantas a los distintos regímenes
hídricos y la diferente plasticidad de los clones estudiados frente a la vulnerabilidad a la
cavitación. Las diferencias en vulnerabilidad a la cavitación no explicaron las diferencias
clonales de crecimiento observadas en el campo. Se han encontrado diferencias significativas
28
en el xilema de los cuatro clones ensayados, desde clones con pocos vasos de gran diámetro a
clones con vasos muy pequeños y no demasiado numerosos. Esta información es de utilidad
para interpretar el comportamiento productivo de los clones en el campo y en parte para
relacionar la vulnerabilidad a la cavitación con la anatomía. Los clones más productivos
presentaron el mayor número de vasos de tamaño intermedio en condiciones de estrés.
Se discute sobre la posible no existencia del compromiso entre eficiencia y seguridad
pues los clones más productivos figuraron entre los más resistentes a la cavitación, aunque
algunos clones poco productivos resultaron tan resistentes o más que los que presentaron
mayores producciones.
El último y cuarto capítulo compara el índice de área foliar en dos plantaciones de
demostración de chopo con fines energéticos situadas en Almazán (Soria) y en Valtierra
(Navarra) empleando los mismos genotipos estudiados en el capítulo 3 durante dos años
consecutivos. Ambas localizaciones presentan una marcada diferencia climática y de dosis de
riego. En Navarra la dosis de riego fue aproximadamente el doble que la de Almazán. El LAI se
estimó por dos métodos: se tomaron fotografías hemisféricas de la cubierta de ambas
plantaciones para calcular el LAI a partir de modelos que relacionan el índice de huecos en la
cubierta con el índice de área foliar y se comparó con el LAI medido por métodos directos,
consistente en tomar una muestra de árboles representativa, pesar todas las hojas de la
muestra y multiplicar este peso por la inversa del área foliar específica (SLA) (g/m2) obtenido
en una submuestra menor.
Los resultados muestran una elevada correlación entre biomasa y LAI, ya sea estimado
a partir de métodos directos o indirectos. Los sitios y clones más productivos presentaron
mayores índices de área foliar y lo contrario sucedió con los sitios y clones menos productivos.
El LAI obtenido por medios indirectos no siempre infraestimó el LAI obtenido por
medios directos, como suele ser habitual al no cumplirse las hipótesis de partida para aplicar
la ley de Beer Lambert. La violación del supuesto de distribución aleatoria de hojas se produjo
en Almazán porque el diseño de la plantación, consistente en surcos dobles separados 3.5 m
entre sí, unido al escaso desarrollo de la plantación dio lugar a un espacio vacío regular entre
filas. Aunque los modelos empleados para estimar el LAI en Almazán arrojaron valores más
bajos que los obtenidos a partir del LAI directo, la infraestimación fue la misma para todos los
clones, de modo que las diferencias entre clones se conservaron iguales que en la estimación
directa. La plantación de Valtierra en el segundo año de medición fue afectada severamente
por la roya (Melampsora spp) y no se observó correlación entre la producción y el LAI, debido
a defoliación prematura. De un año a otro se observan cambios en el ranking clonal de
producción de biomasa. El clon I-214 durante el primer año figura entre los clones con menor
producción, mientras que el segundo año, después de un recepe pasa a ser el clon más
productivo en Almazán y equiparable a los de mayor crecimiento en Valtierra. Estos cambios
podrían tener su origen en la diferente afección de la roya y en la diferente distribución de los
recursos durante el primer año por parte de los clones. El recepe podría haber favorecido a los
clones que invierten más recursos en las raíces y no desarrollan la enfermedad.
29
OBJETIVOS

30
31
OBJETIVOS
El objetivo general de esta tesis es identificar algunas de las características anatómico-
fisiológicas que confieren la capacidad de alcanzar una mejor productividad bajo clima
mediterráneo a plantas de diversos genotipos de los géneros Populus y Eucalyptus,
caracterizados por su carácter pionero, elevado crecimiento y vulnerabilidad a la cavitación. Se
definen los siguientes objetivos concretos:
En eucalipto:
1)- Analizar las diferencias entre clones en la respuesta estomática a déficit hídrico y
déficit de presión de vapor de la atmósfera
2)- Investigar el papel del pH de la savia y de la conductancia hidráulica del tallo en la
regulación de la conductancia estomática y las posibles diferencias entre clones.
En chopo:
3)-Investigar la relación del crecimiento con los parámetros anatómicos: “número de
vasos por sección transversal de tallo”, “superficie conductora”, “area transversal media de los
vasos”, “densidad de vasos”, “ratio área-densidad” y “conductividad hidráulica teórica” e
investigar las diferencias entre clones
4)-Analizar si la vulnerabilidad a la cavitación de cuatro genotipos empleados en la Red
de Parcelas de Cultivos Leñosos en Alta Densidad y Turno Corto del INIA, está relacionada con
la producción.
5)-Analizar si los métodos indirectos de estimación del índice de área foliar son fiables
para hacer un seguimiento de la producción de las plantaciones y detectar diferencias entre
clones y años.
6)-Comprobar si el trabajo realizado contribuye a explicar las diferencias de
producción encontradas en los diferentes sitios de ensayo (interacción genotipo x ambiente)
dentro de la ya mencionada Red de Parcelas de Cultivos leñosos.

32
33
RESUMEN DE MATERIAL Y MÉTODOS

34
35
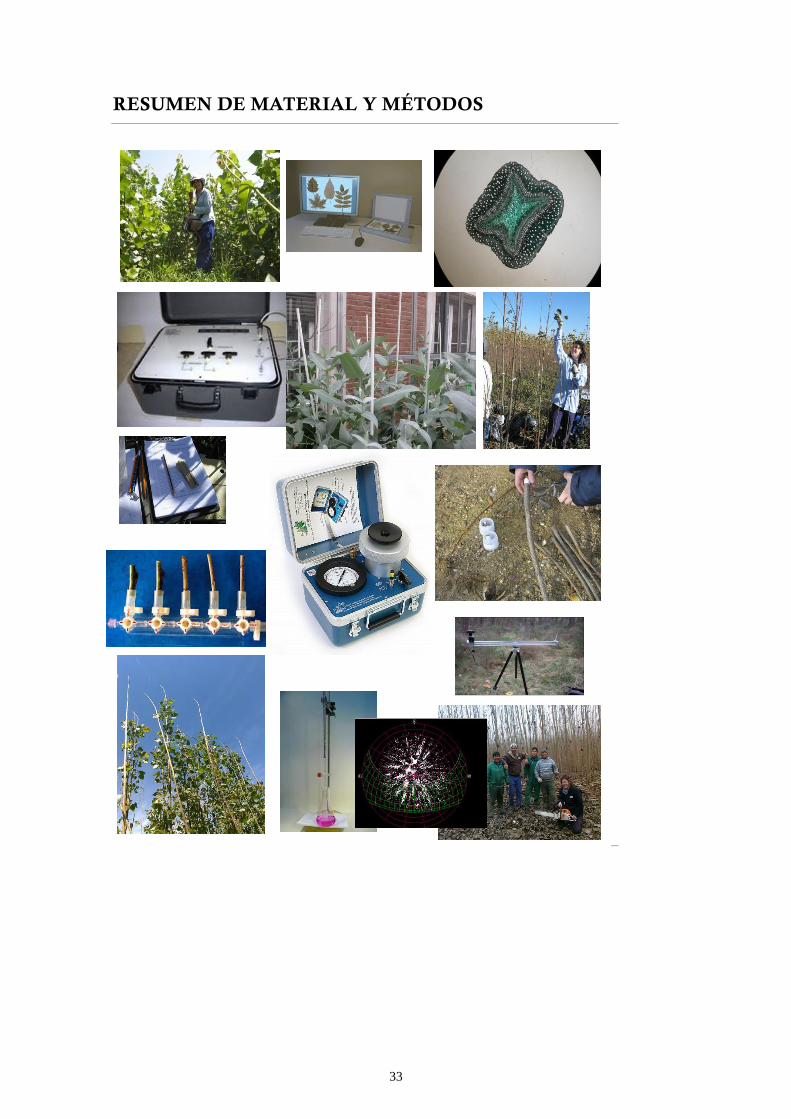
RESUMEN DE MATERIAL Y MÉTODOS
Se presenta a continuación un escueto resumen de los materiales y métodos
empleados. El contenido detallado se encuentra dentro de cada uno de los capítulos.
MATERIAL VEGETAL:
Capítulo uno: Eucalyptus globulus: dos clones F0: C13 y C14 y cuatro clones F1: H231,
H354, H456, y H491, éste último es un híbrido C14xC14.
Capítulo dos: Eucalyptus globulus: un clon F0: C14 y cuatro F1, OD, SA y PI, T, híbridos
de C14 y dos clones más: uno común para OD y SA y otro para PI y T
Capítulos tres y cuatro: se emplearon cuatro genotipos híbridos: dos clones Populus x
euramericana (AF2 e I-214) y dos híbridos Populus x interamericana x nigra (Monviso y
Pegaso).
MÉTODOS:
En los dos primeros capítulos se sometieron las plantas a dos tratamientos con
diferente dotación de riego en invernadero. En el capítulo uno, una vez finalizada la aplicación
de los tratamientos, se realizaron mediciones de potencial hídrico, conductividad hidraúlica, e
intercambio gaseoso; en el capítulo dos, las mediciones se llevaron a cabo mientras las plantas
seguían sometidas a los tratamientos de riego. En el capítulo dos además de lo anterior se
llevaron a cabo mediciones periódicas del pH de la savia. En ambos capítulos se midió el
crecimiento en superficie foliar y en biomasa.
En el capítulo tres se realizó un estudio de la anatomía del xilema de cuatro genotipos
híbridos de chopo en una plantación sometida a estrés hídrico severo situada en Granada. En
esta plantación se llevaron a cabo mediciones de intercambio gaseoso y de variables de
crecimiento. El estudio de la vulnerabilidad a la cavitación se realizó en un ensayo establecido
para tal fin en los campos de ensayo del CIFOR-INIA en Madrid sobre plantas de un año de los
mismos cuatro clones sometidas a dos regímenes de riego, uno de los cuales supuso la
interrupción del riego durante dos meses.
En el último capítulo se realizó un seguimiento del índice de área foliar de dos
plantaciones durante dos años consecutivos correspondientes a los dos primeros periodos
vegetativos de las plantaciones. El índice de área foliar (LAI) se estimó a partir del índice de
huecos medido en fotografías hemisféricas a partir de la ley de Beer Lambert y se comparó
posteriormente con el LAI obtenido directamente a partir de pesada de las hojas de los
árboles. Ambos se correlacionaron con la producción de biomasa de ambas plantaciones,
obtenida a partir de mediciones destructivas.
Listado de variables a las que se hace referencia en los capítulos y la discusión y
unidades:
Variables de crecimiento:
Biomasa leñosa (g, o Mg ha-1 año-1): pesada en estufa con 0% de humedad.
36
Área foliar (cm2): superficie de todas las hojas de la planta medida con Winfolia®
Área foliar apical (Lap) (m2): superficie de las hojas distales a la sección más pequeña
de la muestra empleada para realizar las mediciones de conductancia hidráulica.
SLA: Área foliar específica (cm2/g): área foliar dividida por el peso seco (0% humedad)
de la misma
Altura tallo (cm)
D10 (mm), d130 (mm): diámetros basales (d10) y normales (d130) medidos a 10 y 130 cm
de altura respectivamente, medidos con calibre desde el suelo.
Volumen (cm3): volumen de madera en verde calculado a partir de diámetros (d10,
d130) y alturas utilizando las fórmulas del cono y el tronco de cono.
Variables anatómicas:
Número de vasos: número de vasos en cada sección transversal.
Área media del vaso (µm2): promedio del área de todos los vasos por sección
transversal
Superficie conductora (µm2): suma del área de todos los vasos por sección transversal
Area de la sección transversal (mm2): incluye xilema, corteza y médula.
Densidad de vasos (mm-2)=número de vasos/ superficie del xilema (mm2)
AD-RATIO (µm2 mm2)= Área media del vaso/densidad de vasos
Conductividad hidráulica teórica Kht=π dh4/128h (dh=diámetro hidráulico de cada
vaso=4area/perímetro; h : coeficiente de viscosidad dinámica del agua)
Variables fisiológicas:
-De intercambio gaseoso, medidas con un IRGA (infrared gas analyzer):
Tasa de fotosíntesis (A):µmol m-2 s-1
Conductancia estomática (gs): mol m-2 s-1
Transpiración (E): mmol m-2 s-1
Eficiencia intrínseca en el uso del agua (IWUE): µmol mol-1
-Hidráulicas:
Conductancia hidráulica (k): (Kg s-1 MPa-1). Flujo de agua que pasa por una sección
transversal de tallo sometida a una presión dada de magnitud tal que no permite el
desplazamiento de las posibles burbujas de agua que pudieran existir en el xilema. Se obtiene
mediante pesadas (método de Sperry) o mediante lectura directa en el dispositivo Xyl’em®
37
Conductancia hidráulica nativa (ki): conductancia hidráulica medida sobre un
espécimen que no ha sido sometido a ninguna intervención previa.
Conductancia hidráulica máxima (kmax): (Kg s-1 MPa-1). Es la conductancia hidráulica
medida después de haber sometido a la muestra durante un periodo de tiempo al paso de
agua a una presión lo suficientemente alta como para permitir eliminar los posibles
embolismos existentes en el xilema.
Conductancia hidráulica específica relativa al área foliar (LSC): (Kg s-1 MPa-1 m-2). Es la
conductancia hidráulica relativa al área foliar distal a la sección mínima de la muestra.
LSC=ki/Lap ; donde ki es la conductancia hidráulica nativa y Lap es el área foliar apical
alimentada de savia a través de la sección considerada.
Conductividad hidráulica Q,K: (Kg s-1 MPa-1 m-1) . Es la conductancia hidráulica
multiplicada por la longitud de la muestra (L): Q=k*L
Conductividad hidráulica máxima Qmax, Kmax: (Kg s-1 MPa-1 m-1). Es la conductancia
hidráulica máxima multiplicada por la longitud de la muestra(L): Qmax=kmax*L
Conductividad hidráulica específica relativa al área foliar (QL): (Kg s-1 MPa-1 m-1) Es la
conductancia específica foliar relativa al área foliar multiplicada por la longitud de la muestra
(L): QL=LSC*L
Conductividad hidráulica específica máxima relativa al área foliar (QLMAX): (Kg s-1 MPa-1
m-1) Es la conductividad hidráulica máxima dividida entre el área foliar distal a la sección
mínima de la muestra: QLMAX=Qmax/Lap
Conductividad hidráulica específica relativa a la sección transversal (KXS): (Kg s-1 MPa-1
m-1). Es la conductividad hidráulica dividida entre el área de la sección transversal (As).
KXS=K/As
Pérdida de conductancia o conductividad hidráulica (PLC):(%) . Es la diferencia entre
conductancia máxima y nativa relativa a la conductividad máxima:
PLC (%) =100(kmax-ki)/kmax
-Otras:
Evapotranspiración: g/planta. Obtenida mediante medición del peso de la planta y su
envase antes y después de cada riego.
Potencial hídrico (Ѱ) (MPa): Medido con una cámara de Scholander.
Déficit de presión de vapor (DPV) (kPa): obtenido a partir del porcentaje de humedad
relativa y la temperatura en el invernadero proporcionados por un termohidrógrafo a partir de
la fórmula VPD=Psat(1-RH); donde Psat es la presión de vapor en saturación del agua a una
temperatura dada y RH es la humedad relativa del invernadero en tanto por uno.
pH: valor negativo del logaritmo de la concentración de protones en la savia del xilema
medidos con un microelectrodo en savia extraída de la planta.

38
39
CAPÍTULOS

40
41
CAPÍTULO 1

42
43
CAPÍTULO 1
HYDRAULIC CONSTRAINTS TO GAS EXCHANGE IN F0 AND F1 Eucalyptus globulus Labill.
CLONES
RESUMEN
Se realizaron mediciones de intercambio gaseoso, conductividad hidráulica del xilema
y crecimiento en plantas jóvenes de seis clones de Eucalyptus globulus Labill.: dos F0 y cuatro
F1 entre los que se incluyó un clon procedente de autocruzamiento. Las plantas se cultivaron
en invernadero y fueron sometidas a dos regímenes de riego. Las mediciones de
conductividad hidraúlica se llevaron a cabo en porciones de tallo sometidas a deshidratación
natural a lo largo de tres semanas consecutivas. El clon híbrido producto de autocruzamiento
figuró entre los clones que mostraron menores valores en las variables de crecimiento. La
vulnerabilidad a la cavitación se incrementó y la conductividad hidráulica específica relativa al
área foliar, tanto nativa (QL) como máxima (QL,MAX) disminuyeron de la primera a la tercera
semana de mediciones, sin que se observaran disminuciones en el diámetro o la superficie de
los vasos del xilema, sugiriendo la existencia de cambios en la permeabilidad de las
membranas de las punteaduras. Además se observó una disminución significativa de la
conductancia estomática máxima en la tercera semana de mediciones.
Los valores más elevados de QL,MAX se registraron en el clon que alcanzó el mayor
crecimiento, y los más bajos en el clon H491 procedente de autocruzamiento. Los máximos
valores de conductancia estomático obtenidos en H491 apenas llegaron a un tercio de los
valores medidos en el resto de los clones, indicando una reducidad capacidad de refrigeración
de la hoja y una pobre adaptación a ambientes mediterráneos.
El decrecimiento de la conductancia estomática sucedió simultáneamente a la
coincidencia en el tiempo de los valores de conductividad hidráulica específica referida al área
foliar alcanzados por plantas de los dos regímenes de riego. Este resultado sugiere que el
cierre estomático podría haberse producido para preservar la capacidad hidráulica del tallo.
44
HYDRAULIC CONSTRAINTS TO GAS EXCHANGE IN F0 AND F1 Eucalyptus globulus Labill.
CLONES MARIA JOSE HERNANDEZ
2, SVEN MUTKE
2, FERNANDO MONTES
2 and PILAR PITA
1,3.
(1) Unidad de Anatomía, Fisiología y Genética Forestal. Escuela Técnica Superior de Ingenieros de Montes. Ciudad
Universitaria, 28040 Madrid, Spain.
(2) Dep. Sistemas y Recursos Forestales, CIFOR-INIA, Carretera La Coruña km 7.5, 28040 Madrid, Spain.
ABSTRACT
Growth, gas exchange, and xylem hydraulic conductivity were measured in young
plants from two F0 and four F1 Eucalyptus globulus Labill. clones (including one inbred clone)
Plants were grown under two different watering regimes in a greenhouse experiment.
Hydraulic measurements were carried out on stem portions that had undergone natural
drying, over three consecutive weeks. The inbred clone was always among those displaying
the lowest values for growth variables. Xylem vulnerability to cavitation increased and both
native and maximum leaf specific hydraulic conductivity (QL and QL,MAX) decreased from the
first to the third week, with no changes in the vessel area to leaf area ratio, suggesting the
existence of changes in the permeability of intervessel pit membranes. Accordingly, a
significant decrease in maximum stomatal conductance was observed in the third week of
measurements. The highest values of QL,MAX were measured in the clone that attained the
highest growth, and the lowest in the inbred clone. Maximum values of stomatal conductance
measured in the inbred clone were a third of those measured in the rest of the clones,
indicating a reduced evaporative cooling capacity and poor adaptation to Mediterranean
environments. A decline in stomatal conductance was found to concur with the convergence
of leaf specific hydraulic conductivity values for plants belonging to both watering treatments.
This result suggests that stomatal closure may act to preserve the hydraulic capacity of the
stem.
Keywords: Drought resistance, growth, hydraulic conductance, inbreeding, stomatal
conductance, xylem cavitation.
INTRODUCTION
Increasing xylem tensions due to high evaporative demand or soil water deficit lead to
vessel embolism through air seeding (Tyree and Zimmermann 2002), xylem cavitation and
thus xylem dysfunction, and a decrease in water transport capacity in trees. This may be
particularly relevant in Mediterranean environments, where high temperature and low
relative humidity may cause xylem water potential to drop below the cavitation threshold
even when soil water is abundant. High cavitation resistance is considered a key component of
drought tolerance (Maherali et al. 2004). Woody plants from dry habitats usually show greater
resistance to water stress induced cavitation than plants from more mesic habitats (Brodribb
and Hill 1999, Kavanagh et al. 1999, Sperry 2000, Froux et al. 2002). However, species showing
relatively low xylem resistance to cavitation might be able to survive and grow in drought-
prone environments, developing alternative mechanisms to maintain a favourable water
45
status, such as deep rooting, early leaf shedding or early stomatal closure (Vilagrosa et al.
2003, Piñol and Sala 2000, Machado and Tyree 1994). Results from several studies suggest
that xylem conduits, in some species at least, undergo frequent cycles of cavitation and
embolism repair (refilling) (Holbrook et al 2001, Domec et al. 2006, Martorell et al. 2013).
Though the underlying mechanism still remains unclear, refilling may be concurrent with
transpiration (McCully 1999, Tyree et al. 1999, Hacke and Sperry 2003), causing hydraulic
conductance to vary diurnally as a result of both processes. In this context, not only xylem
vulnerability to cavitation, but also the capability of refilling embolized vessels should be
considered in ecological studies (Zwieniecki and Holbrook 1998). In the present study, native
embolism was measured directly on portions detached from plants that had undergone
natural drying. This was done not only to account for both cavitation and refilling but also to
avoid undesirable effects of artificial drying such as the flow rate increases over the course of
the measurement period reported by Prior and Eamus (2000) or the changes in the
vulnerability profile reported by Wickberg and Ogren (2004).
Decreases in stomatal conductance have been found to prevent xylem cavitation in
several woody species (Vilagrosa et al. 2003, Cochard et al. 2002, Lemoine et al. 2002, Salleo
et al. 2000). However, stomatal responses to drought stress may only help to avoid cavitation
in the short term. Long-term responses such as early leaf shedding or decreasing maximum
hydraulic conductance have been found in several tree species, including eucalypts (Vander
Willigen and Pammenter 1998, Vilagrosa et al. 2003, Pita et al. 2003).
Species with high hydraulic conductance may achieve higher diurnal stomatal
conductance, and thus higher photosynthetic rates and growth (Nardini and Salleo 2000).
However, increased hydraulic conductance has been related to higher vulnerability to
cavitation (Nardini and Pitt 1999, Nardini and Salleo 2000, Himrane et al. 2004) and may
threaten survival, especially in exceptionally hot and dry years, a fact that must be taken into
account in a scenario of global climate change. Hydraulic conductance has been reported to
decrease under drought conditions, limiting tree water use even after the conclusion of a
drought period (Eamus et al. 2000). Moreover, high resistance to cavitation has been related
to wood density (Wikberg and Ögren 2004) and may be costly in mesic environments
(Maherali et al. 2004). Wikberg and Ögren (2004, 2007) suggested that increasing drought
tolerance may lead to decreased growth in willow (Salix sp.). Similar results have been
reported for Salix and Populus by Cochard et al. (2007). Conversely, Wang et al. (2003) found
that selecting for both fast growth and drought tolerance may be possible in the case of the
Lodgepole pine (Pinus contorta Dougl. ex Loud).
Fast-growing pioneer species are often susceptible to water deficits in the early stages
of growth due to increased biomass allocation to the shoot (Brodribb and Hill 2000).
Eucalyptus globulus Labill. plantations established in SW Spain are frequently submitted to
severe water stress. In a previous study, lower values were measured for long-term water use
efficiency in those E. globulus genotypes that attained higher growth and survival rates under
field conditions (Pita et al. 2001). This suggests that the ability to support high transpiration
rates may be crucial in terms of successfully competing for available water. The main
objectives of our study were (1) to identify hydraulic differences between six E. globulus
clones displaying contrasting growth and survival rates under a Dry Mediterranean climate
46
and (2) to assess the relevance of hydraulic constraints on gas exchange in young plants of the
species.
MATERIALS AND METHODS
PLANT MATERIAL AND GROWING CONDITIONS
Rooted cuttings from two F0 and four F1 clones were obtained from Grupo Empresarial
ENCE S.A., Spain. Both C13 and C14 clones are representative of the commercial F0 clones, and
are currently used in eucalypt plantations in Spain. The F1 clones (H231, H354, H463 and
H491) were derived from crosses between C14 and other commercial clones, except H491,
which is an inbred C14 x C14 clone. Results from two field trials revealed that three years after
plantation, the survival rate, height and diameter at breast height (DBH) were severely limited
in the inbred clone (Table 1). Survival was similar or slightly lower in F1 compared to F0 clones
(excluding H491), whereas growth was higher in F1 clones (again excluding the inbred H491) at
both study sites (Table 1). Clone H231 displayed both high growth and survival rates and is
considered to be the best of the six clones tested. Differences between clones in growth and
survival were greater in the trial established on deep, sandy soil compared with that
established on more shallow, slate soil, as might be expected (Table 1).
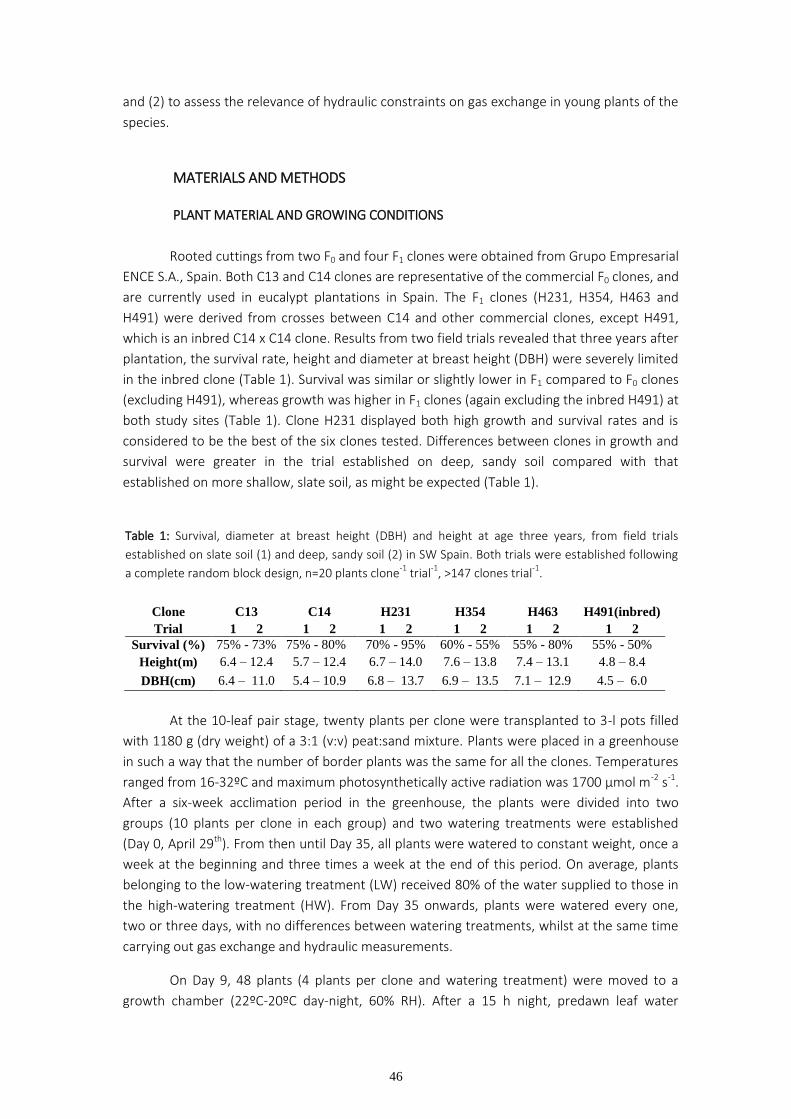
Table 1: Survival, diameter at breast height (DBH) and height at age three years, from field trials
established on slate soil (1) and deep, sandy soil (2) in SW Spain. Both trials were established following
a complete random block design, n=20 plants clone-1
trial-1
, >147 clones trial-1
.
Clone C13 C14 H231 H354 H463 H491(inbred)
Trial 1 2 1 2 1 2 1 2 1 2 1 2
Survival (%) 75% - 73% 75% - 80% 70% - 95% 60% - 55% 55% - 80% 55% - 50%
Height(m) 6.4 – 12.4 5.7 – 12.4 6.7 – 14.0 7.6 – 13.8 7.4 – 13.1 4.8 – 8.4
DBH(cm) 6.4 – 11.0 5.4 – 10.9 6.8 – 13.7 6.9 – 13.5 7.1 – 12.9 4.5 – 6.0
At the 10-leaf pair stage, twenty plants per clone were transplanted to 3-l pots filled
with 1180 g (dry weight) of a 3:1 (v:v) peat:sand mixture. Plants were placed in a greenhouse
in such a way that the number of border plants was the same for all the clones. Temperatures
ranged from 16-32ºC and maximum photosynthetically active radiation was 1700 µmol m-2 s-1.
After a six-week acclimation period in the greenhouse, the plants were divided into two
groups (10 plants per clone in each group) and two watering treatments were established
(Day 0, April 29th). From then until Day 35, all plants were watered to constant weight, once a
week at the beginning and three times a week at the end of this period. On average, plants
belonging to the low-watering treatment (LW) received 80% of the water supplied to those in
the high-watering treatment (HW). From Day 35 onwards, plants were watered every one,
two or three days, with no differences between watering treatments, whilst at the same time
carrying out gas exchange and hydraulic measurements.
On Day 9, 48 plants (4 plants per clone and watering treatment) were moved to a
growth chamber (22ºC-20ºC day-night, 60% RH). After a 15 h night, predawn leaf water
47
potential was measured on a single fully-expanded leaf of the seventh node using a pressure
chamber (PMS Instruments Co., Corvallis, OR). The plants in their containers were weighed
and volumetric soil water content was measured with a TDR device (Trime-FM, IMKO
Micromodultechnik Gmbh, Ettlingen, Germany). Once these measurements had been taken,
the plants were returned to the greenhouse. On Day 14, the whole procedure was carried out
on 48 drought-treated plants (8 plants per clone).
Volumetric soil water content (SWC) was measured on Days 9 and 14 as well as on
days 35-55 when hydraulic conductivity measurements were also taken. Volumetric soil water
content was positively correlated with the weight of each plant plus its container (WT)
throughout SWC=0.0362WT-56.195 (R2=0.84, n=199) (Eqn.1). No significant differences were
found among regression lines fitted to data from different dates, indicating a negligible effect
of time (and thus plant size) on the relationship between both variables. A single equation was
thus obtained for all data combined. This equation was used to calculate soil water content
values from WT following the imposition of the watering treatments (Figure 1a), avoiding an
excessive use of the TDR probe, which could damage the roots.
GROWTH, ANATOMICAL AND MORPHOLOGICAL TRAITS
On Day 0, non-destructive measurements of leaf area were obtained by drawing all
the leaves of two plants per clone on tracing paper. An Image Analyzer (LI-3000, Li-Cor Inc)
was used to estimate leaf area from leaf drawings. Leaf area (LA) was related to maximum leaf
blade length (LL) and width (LW) throughout LA=a + b LW+ c LL (one equation for each clone,
R2>0.90 for all the clones). Mean plant leaf area was calculated from leaf blade length and
width, measured on all the leaves of six randomly chosen plants per clone on Day 0.
When the hydraulic conductivity measurements were carried out (Days 35-55), the
whole plant leaf area was also measured, separating those leaves distal to the segment used
for hydraulic measurements from the rest of the leaves, and leaves on lateral shoots (auxiliary
leaves) from leaves directly attached to the main stem (main leaves). Leaves were oven-dried
to constant weight at 70ºC and the dry weight of the main and auxiliary leaves measured.
Specific leaf area (SLA) of the main and auxiliary leaves was calculated as the quotient of leaf
area by leaf dry weight. Total height (cm) and dry biomass shoot weight (g) were also
recorded.
Distal portions of half the stems used in hydraulic measurements were kept in FAA
(ethanol, glacial acetic acid and formaldehyde, 90:5:5) and later cut with a sliding microtome
(Leica SM2400, Leica Microsystems GmbH) and stained with fast green. Unfortunately, some
of the samples were damaged and only 20 LW plants (3-4 per clone) and 19 HW plants (2-5
per clone) could be used to determine the number of vessels, vessel lumen area distribution,
total vessel lumen area per cross section (VLA) and cross section area using WinCell Regular®
software (Regent Instruments Inc., Canada).
48
GAS EXCHANGE
On Days 35, 43 and 50, stomatal conductance, transpiration rate and net
photosynthetic rate were measured on one single leaf of the sixth node (counted from the
apex), using a LCA4 IRGA (Analytical Development Co, Hoddesdon UK). Measurements were
carried out inside the greenhouse, under natural light (PAR>1100 µmol m-2 s-1), between 9:30
and 11:30 (solar time). Vapour pressure deficit ranged from 3.2-4.0 kPa on Day 35 to 2.5-3.3
kPa on Days 43 and 50. Gas exchange parameters were measured on 4-9 LW plants per clone
each day. Measurements were carried out in batches (one plant per clone in each batch). Gas
exchange measurements were carried out only on LW plants to avoid increasing the time of
measurement and the effect of midday stomatal closure.
HYDRAULIC TRAITS
Xylem embolism in plant stems was quantified by determining the hydraulic
conductance (Kg H2O MPa-1 s-1) of the xylem before and after removing embolism using the
flushing method (Sperry et al. 1988). Hydraulic measurements were carried out at mid-
morning (8:00-9:30, solar time), over three weeks (Days 35-55). Environmental conditions
remained stable throughout the sampling days, with minimum temperature ranging from 18-
20ºC, a maximum temperature of 32ºC inside the greenhouse and sunny weather. In order to
minimize the effect of time lapse, one or two plants per clone from one single watering
treatment were measured each day. Each day, 6-10 plants were taken to the laboratory (less
than 5 minutes from the greenhouse) in groups of two. Leaf water potential was measured
immediately on a single leaf of the sixth node (counted from the apex) with a pressure
chamber. Each plant was weighed with its container and volumetric soil water content was
measured. The stem was then cut under water (at the base and just below the sixth node). All
the leaves were removed under water. The stems were left soaking for at least 20 minutes
before placing them in the rubber tubes for the hydraulic conductance measurements.
Hydraulic conductance was measured at a pressure drop of 0.0064 MPa before (Ki) and after
(Km) pressurizing the stems at 0.08 MPa for 30 min, which was found to be enough to remove
embolism since further perfusion did not result in increased conductance. The perfusing
solution was 1‰ HCl in distilled water, degassed by agitating under vacuum and filtered to 0.2
µm. The percentage loss of hydraulic conductance (PLC) was calculated from: PLC=100 (Km-Ki)
Km-1. The stem length and cross-section stem diameters were then measured. The hydraulic
conductivity (Qh) was calculated as the hydraulic conductance multiplied by the length of the
stem segment, and leaf specific hydraulic conductivity (QL) was obtained by dividing Qh by the
amount of leaf area distal to the cut end.
The maximum hydraulic conductivity (Qh,MAX) was calculated as the maximum
hydraulic conductance multiplied by the length of the stem segment, and maximum leaf
specific hydraulic conductivity (QL,MAX) was obtained by dividing Qh,MAX by the amount of leaf
area distal to the cut end.
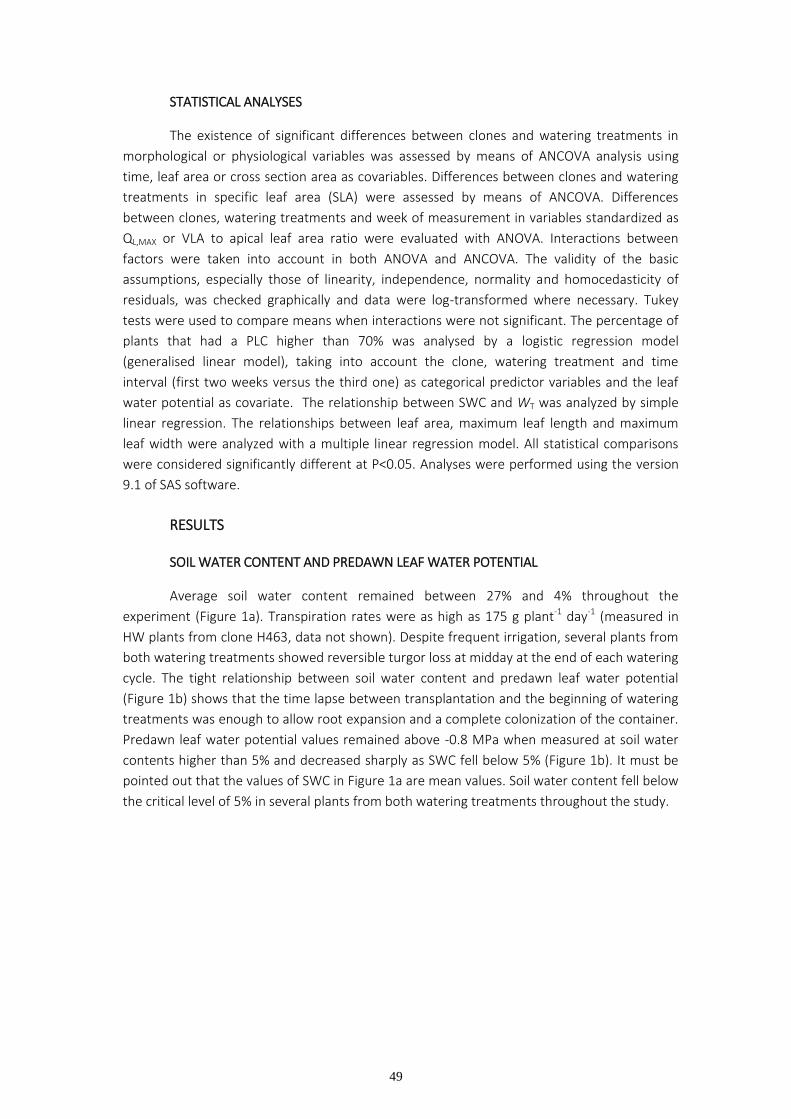
49
STATISTICAL ANALYSES
The existence of significant differences between clones and watering treatments in
morphological or physiological variables was assessed by means of ANCOVA analysis using
time, leaf area or cross section area as covariables. Differences between clones and watering
treatments in specific leaf area (SLA) were assessed by means of ANCOVA. Differences
between clones, watering treatments and week of measurement in variables standardized as
QL,MAX or VLA to apical leaf area ratio were evaluated with ANOVA. Interactions between
factors were taken into account in both ANOVA and ANCOVA. The validity of the basic
assumptions, especially those of linearity, independence, normality and homocedasticity of
residuals, was checked graphically and data were log-transformed where necessary. Tukey
tests were used to compare means when interactions were not significant. The percentage of
plants that had a PLC higher than 70% was analysed by a logistic regression model
(generalised linear model), taking into account the clone, watering treatment and time
interval (first two weeks versus the third one) as categorical predictor variables and the leaf
water potential as covariate. The relationship between SWC and WT was analyzed by simple
linear regression. The relationships between leaf area, maximum leaf length and maximum
leaf width were analyzed with a multiple linear regression model. All statistical comparisons
were considered significantly different at P<0.05. Analyses were performed using the version
9.1 of SAS software.
RESULTS
SOIL WATER CONTENT AND PREDAWN LEAF WATER POTENTIAL
Average soil water content remained between 27% and 4% throughout the
experiment (Figure 1a). Transpiration rates were as high as 175 g plant-1 day-1 (measured in
HW plants from clone H463, data not shown). Despite frequent irrigation, several plants from
both watering treatments showed reversible turgor loss at midday at the end of each watering
cycle. The tight relationship between soil water content and predawn leaf water potential
(Figure 1b) shows that the time lapse between transplantation and the beginning of watering
treatments was enough to allow root expansion and a complete colonization of the container.
Predawn leaf water potential values remained above -0.8 MPa when measured at soil water
contents higher than 5% and decreased sharply as SWC fell below 5% (Figure 1b). It must be
pointed out that the values of SWC in Figure 1a are mean values. Soil water content fell below
the critical level of 5% in several plants from both watering treatments throughout the study.
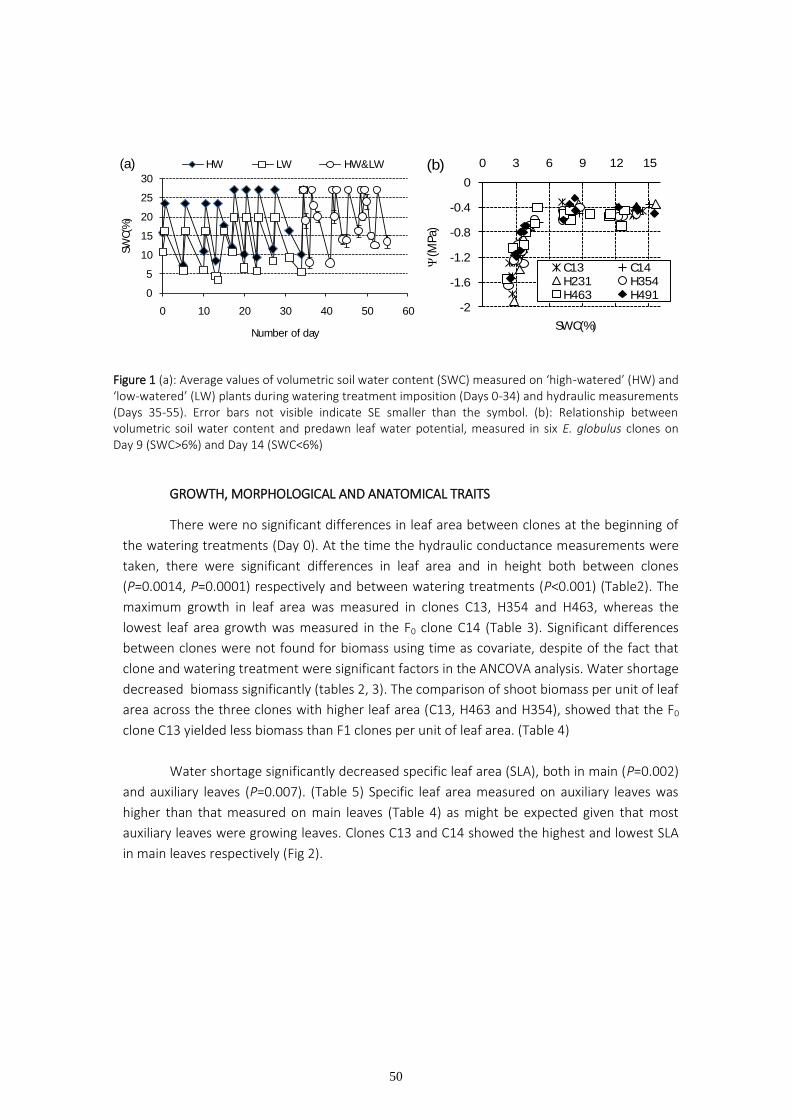
50
Figure 1 (a): Average values of volumetric soil water content (SWC) measured on ‘high-watered’ (HW) and ‘low-watered’ (LW) plants during watering treatment imposition (Days 0-34) and hydraulic measurements (Days 35-55). Error bars not visible indicate SE smaller than the symbol. (b): Relationship between volumetric soil water content and predawn leaf water potential, measured in six E. globulus clones on Day 9 (SWC>6%) and Day 14 (SWC<6%)
GROWTH, MORPHOLOGICAL AND ANATOMICAL TRAITS
There were no significant differences in leaf area between clones at the beginning of
the watering treatments (Day 0). At the time the hydraulic conductance measurements were
taken, there were significant differences in leaf area and in height both between clones
(P=0.0014, P=0.0001) respectively and between watering treatments (P<0.001) (Table2). The
maximum growth in leaf area was measured in clones C13, H354 and H463, whereas the
lowest leaf area growth was measured in the F0 clone C14 (Table 3). Significant differences
between clones were not found for biomass using time as covariate, despite of the fact that
clone and watering treatment were significant factors in the ANCOVA analysis. Water shortage
decreased biomass significantly (tables 2, 3). The comparison of shoot biomass per unit of leaf
area across the three clones with higher leaf area (C13, H463 and H354), showed that the F0
clone C13 yielded less biomass than F1 clones per unit of leaf area. (Table 4)
Water shortage significantly decreased specific leaf area (SLA), both in main (P=0.002)
and auxiliary leaves (P=0.007). (Table 5) Specific leaf area measured on auxiliary leaves was
higher than that measured on main leaves (Table 4) as might be expected given that most
auxiliary leaves were growing leaves. Clones C13 and C14 showed the highest and lowest SLA
in main leaves respectively (Fig 2).
0
5
10
15
20
25
30
0 10 20 30 40 50 60
SWC(%
)
Number of day
(a) HW LW HW&LW
-2
-1.6
-1.2
-0.8
-0.4
0
0 3 6 9 12 15
Y(M
Pa)
SWC(%)
(b)
C13 C14H231 H354H463 H491
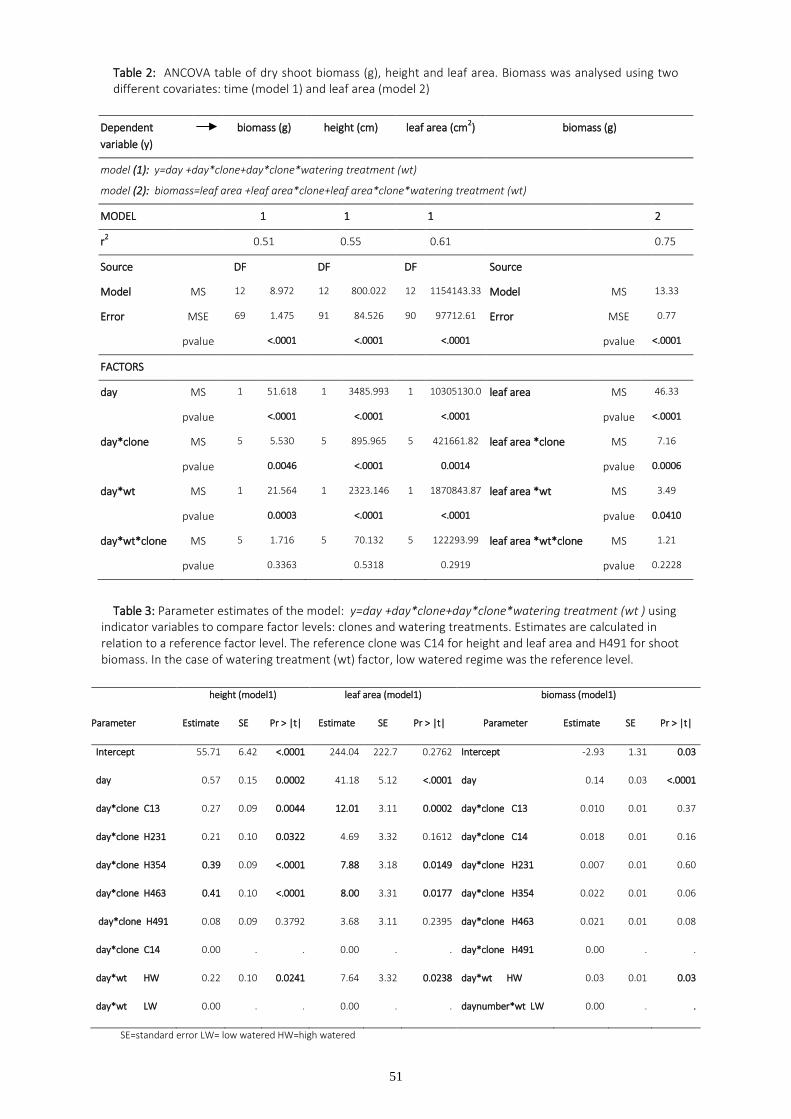
51
Table 2: ANCOVA table of dry shoot biomass (g), height and leaf area. Biomass was analysed using two different covariates: time (model 1) and leaf area (model 2)
Dependent
variable (y)
biomass (g) height (cm) leaf area (cm2) biomass (g)
model (1): y=day +day*clone+day*clone*watering treatment (wt)
model (2): biomass=leaf area +leaf area*clone+leaf area*clone*watering treatment (wt)
MODEL 1 1 1 2
r2 0.51 0.55 0.61 0.75
Source DF DF DF Source
Model MS 12 8.972 12 800.022 12 1154143.33 Model MS 13.33
Error MSE 69 1.475 91 84.526 90 97712.61 Error MSE 0.77
pvalue <.0001 <.0001 <.0001 pvalue <.0001
FACTORS
day MS 1 51.618 1 3485.993 1 10305130.0 leaf area MS 46.33
pvalue <.0001 <.0001 <.0001 pvalue <.0001
day*clone MS 5 5.530 5 895.965 5 421661.82 leaf area *clone MS 7.16
pvalue 0.0046 <.0001 0.0014 pvalue 0.0006
day*wt MS 1 21.564 1 2323.146 1 1870843.87 leaf area *wt MS 3.49
pvalue 0.0003 <.0001 <.0001 pvalue 0.0410
day*wt*clone MS 5 1.716 5 70.132 5 122293.99 leaf area *wt*clone MS 1.21
pvalue 0.3363 0.5318 0.2919 pvalue 0.2228
Table 3: Parameter estimates of the model: y=day +day*clone+day*clone*watering treatment (wt ) using indicator variables to compare factor levels: clones and watering treatments. Estimates are calculated in relation to a reference factor level. The reference clone was C14 for height and leaf area and H491 for shoot biomass. In the case of watering treatment (wt) factor, low watered regime was the reference level.
height (model1) leaf area (model1) biomass (model1)
Parameter Estimate SE Pr > |t| Estimate SE Pr > |t| Parameter Estimate SE Pr > |t|
Intercept 55.71 6.42 <.0001 244.04 222.7 0.2762 Intercept -2.93 1.31 0.03
day 0.57 0.15 0.0002 41.18 5.12 <.0001 day 0.14 0.03 <.0001
day*clone C13 0.27 0.09 0.0044 12.01 3.11 0.0002 day*clone C13 0.010 0.01 0.37
day*clone H231 0.21 0.10 0.0322 4.69 3.32 0.1612 day*clone C14 0.018 0.01 0.16
day*clone H354 0.39 0.09 <.0001 7.88 3.18 0.0149 day*clone H231 0.007 0.01 0.60
day*clone H463 0.41 0.10 <.0001 8.00 3.31 0.0177 day*clone H354 0.022 0.01 0.06
day*clone H491 0.08 0.09 0.3792 3.68 3.11 0.2395 day*clone H463 0.021 0.01 0.08
day*clone C14 0.00 . . 0.00 . . day*clone H491 0.00 . .
day*wt HW 0.22 0.10 0.0241 7.64 3.32 0.0238 day*wt HW 0.03 0.01 0.03
day*wt LW 0.00 . . 0.00 . . daynumber*wt LW 0.00 . .
SE=standard error LW= low watered HW=high watered
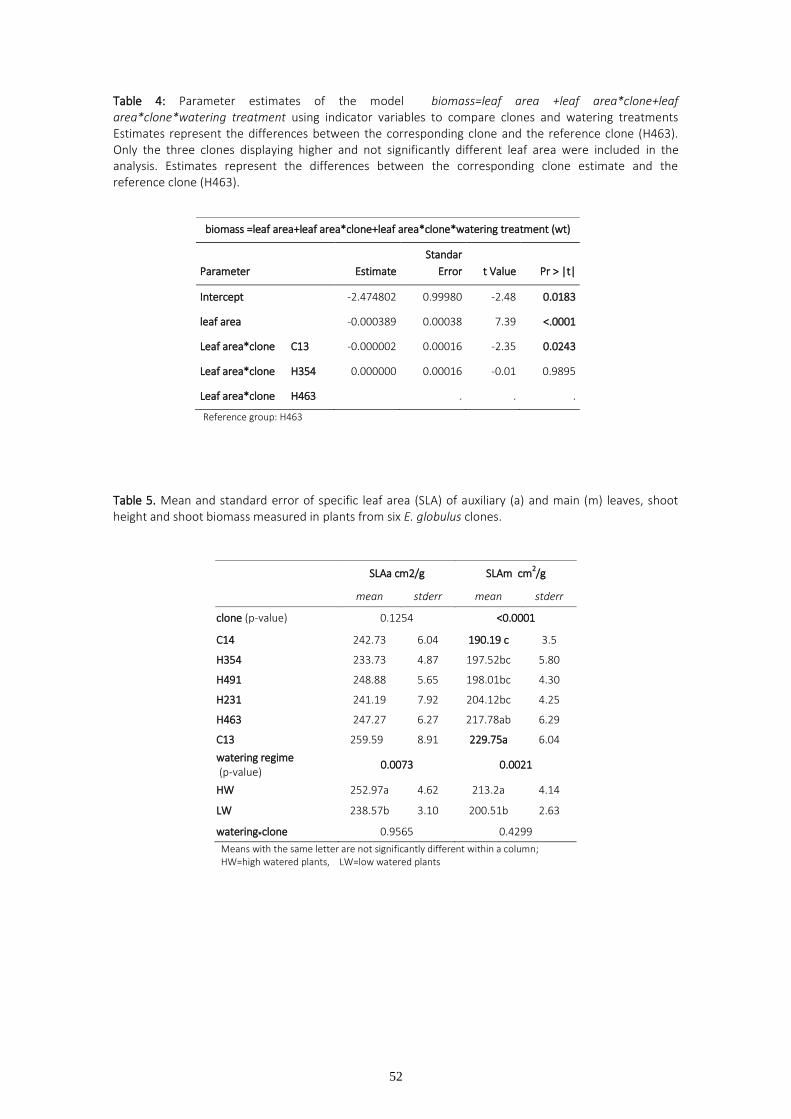
52
Table 4: Parameter estimates of the model biomass=leaf area +leaf area*clone+leaf area*clone*watering treatment using indicator variables to compare clones and watering treatments Estimates represent the differences between the corresponding clone and the reference clone (H463). Only the three clones displaying higher and not significantly different leaf area were included in the analysis. Estimates represent the differences between the corresponding clone estimate and the reference clone (H463).
Reference group: H463
Table 5. Mean and standard error of specific leaf area (SLA) of auxiliary (a) and main (m) leaves, shoot height and shoot biomass measured in plants from six E. globulus clones.
SLAa cm2/g SLAm cm
2/g
mean stderr mean stderr
clone (p-value) 0.1254 <0.0001
C14 242.73 6.04 190.19 c 3.5
H354 233.73 4.87 197.52bc 5.80
H491 248.88 5.65 198.01bc 4.30
H231 241.19 7.92 204.12bc 4.25
H463 247.27 6.27 217.78ab 6.29
C13 259.59 8.91 229.75a 6.04
watering regime (p-value)
0.0073 0.0021
HW 252.97a 4.62 213.2a 4.14
LW 238.57b 3.10 200.51b 2.63
watering*clone 0.9565 0.4299
Means with the same letter are not significantly different within a column; HW=high watered plants, LW=low watered plants
biomass =leaf area+leaf area*clone+leaf area*clone*watering treatment (wt)
Parameter Estimate
Standar
Error t Value Pr > |t|
Intercept -2.474802 0.99980 -2.48 0.0183
leaf area -0.000389 0.00038 7.39 <.0001
Leaf area*clone C13 -0.000002 0.00016 -2.35 0.0243
Leaf area*clone H354 0.000000 0.00016 -0.01 0.9895
Leaf area*clone H463 . . .
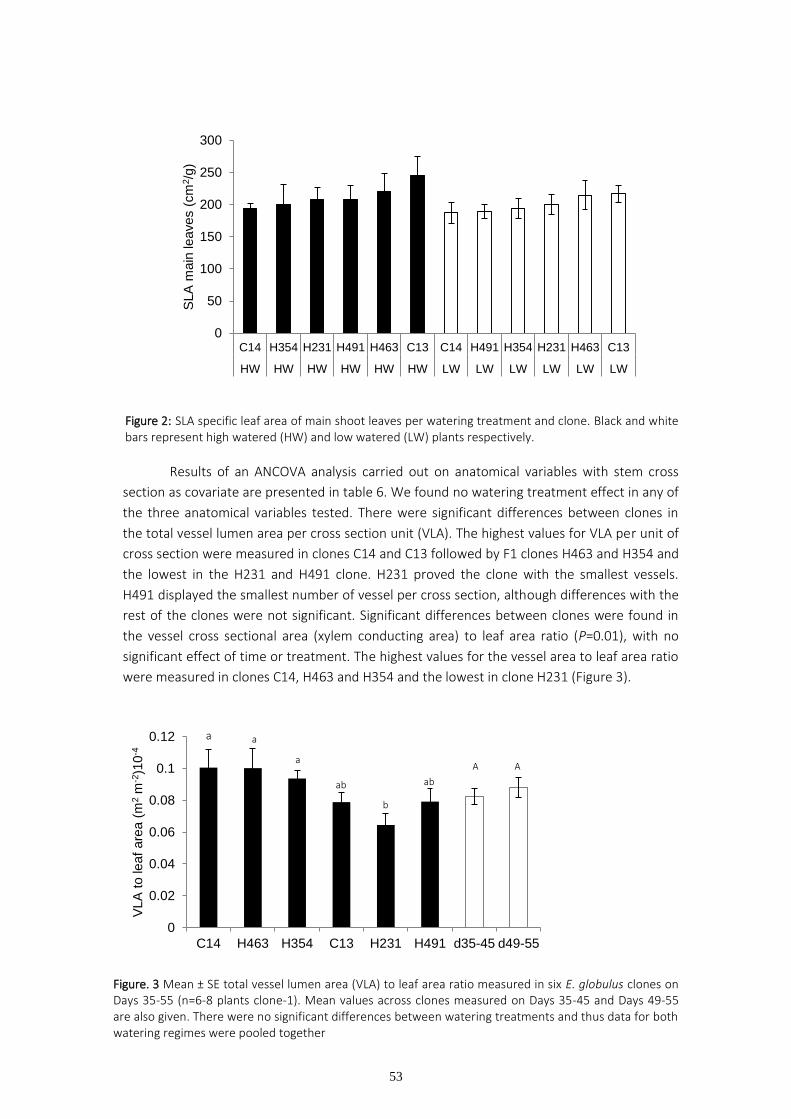
53
Figure 2: SLA specific leaf area of main shoot leaves per watering treatment and clone. Black and white bars represent high watered (HW) and low watered (LW) plants respectively.
Results of an ANCOVA analysis carried out on anatomical variables with stem cross
section as covariate are presented in table 6. We found no watering treatment effect in any of
the three anatomical variables tested. There were significant differences between clones in
the total vessel lumen area per cross section unit (VLA). The highest values for VLA per unit of
cross section were measured in clones C14 and C13 followed by F1 clones H463 and H354 and
the lowest in the H231 and H491 clone. H231 proved the clone with the smallest vessels.
H491 displayed the smallest number of vessel per cross section, although differences with the
rest of the clones were not significant. Significant differences between clones were found in
the vessel cross sectional area (xylem conducting area) to leaf area ratio (P=0.01), with no
significant effect of time or treatment. The highest values for the vessel area to leaf area ratio
were measured in clones C14, H463 and H354 and the lowest in clone H231 (Figure 3).
Figure. 3 Mean ± SE total vessel lumen area (VLA) to leaf area ratio measured in six E. globulus clones on Days 35-55 (n=6-8 plants clone-1). Mean values across clones measured on Days 35-45 and Days 49-55 are also given. There were no significant differences between watering treatments and thus data for both watering regimes were pooled together
0
50
100
150
200
250
300
C14 H354 H231 H491 H463 C13 C14 H491 H354 H231 H463 C13
HW HW HW HW HW HW LW LW LW LW LW LW
SLA
main
leaves (
cm
2/g
)
0
0.02
0.04
0.06
0.08
0.1
0.12
C14 H463 H354 C13 H231 H491 d35-45 d49-55
VLA
to leaf
are
a (
m2 m
-2)1
0-4
a a
ab
b ab
b
A A a
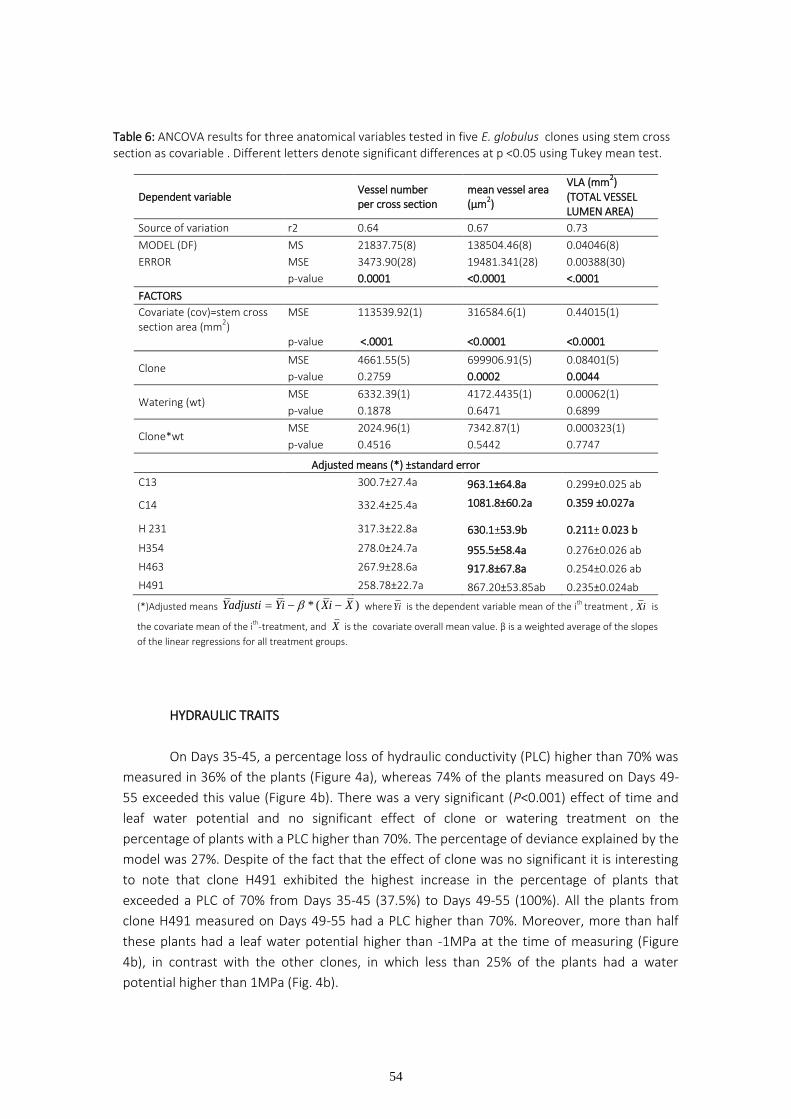
54
Table 6: ANCOVA results for three anatomical variables tested in five E. globulus clones using stem cross section as covariable . Different letters denote significant differences at p <0.05 using Tukey mean test.
Dependent variable Vessel number per cross section
mean vessel area (µm
2)
VLA (mm2)
(TOTAL VESSEL LUMEN AREA)
Source of variation r2 0.64 0.67 0.73
MODEL (DF) MS 21837.75(8) 138504.46(8) 0.04046(8)
ERROR MSE 3473.90(28) 19481.341(28) 0.00388(30)
p-value 0.0001 <0.0001 <.0001
FACTORS
Covariate (cov)=stem cross section area (mm
2)
MSE 113539.92(1) 316584.6(1) 0.44015(1)
p-value <.0001 <0.0001 <0.0001
Clone MSE 4661.55(5) 699906.91(5) 0.08401(5)
p-value 0.2759 0.0002 0.0044
Watering (wt) MSE 6332.39(1) 4172.4435(1) 0.00062(1)
p-value 0.1878 0.6471 0.6899
Clone*wt MSE 2024.96(1) 7342.87(1) 0.000323(1)
p-value 0.4516 0.5442 0.7747
Adjusted means (*) ±standard error
C13 300.7±27.4a 963.1±64.8a 0.299±0.025 ab
C14 332.4±25.4a 1081.8±60.2a 0.359 ±0.027a
H 231 317.3±22.8a 630.1±53.9b 0.211± 0.023 b
H354 278.0±24.7a 955.5±58.4a 0.276±0.026 ab
H463 267.9±28.6a 917.8±67.8a 0.254±0.026 ab
H491 258.78±22.7a 867.20±53.85ab 0.235±0.024ab
(*)Adjusted means * ( )Yadjusti Yi Xi X where Yi is the dependent variable mean of the ith treatment , Xi is
the covariate mean of the ith-treatment, and X is the covariate overall mean value. β is a weighted average of the slopes
of the linear regressions for all treatment groups.
HYDRAULIC TRAITS
On Days 35-45, a percentage loss of hydraulic conductivity (PLC) higher than 70% was
measured in 36% of the plants (Figure 4a), whereas 74% of the plants measured on Days 49-
55 exceeded this value (Figure 4b). There was a very significant (P<0.001) effect of time and
leaf water potential and no significant effect of clone or watering treatment on the
percentage of plants with a PLC higher than 70%. The percentage of deviance explained by the
model was 27%. Despite of the fact that the effect of clone was no significant it is interesting
to note that clone H491 exhibited the highest increase in the percentage of plants that
exceeded a PLC of 70% from Days 35-45 (37.5%) to Days 49-55 (100%). All the plants from
clone H491 measured on Days 49-55 had a PLC higher than 70%. Moreover, more than half
these plants had a leaf water potential higher than -1MPa at the time of measuring (Figure
4b), in contrast with the other clones, in which less than 25% of the plants had a water
potential higher than 1MPa (Fig. 4b).
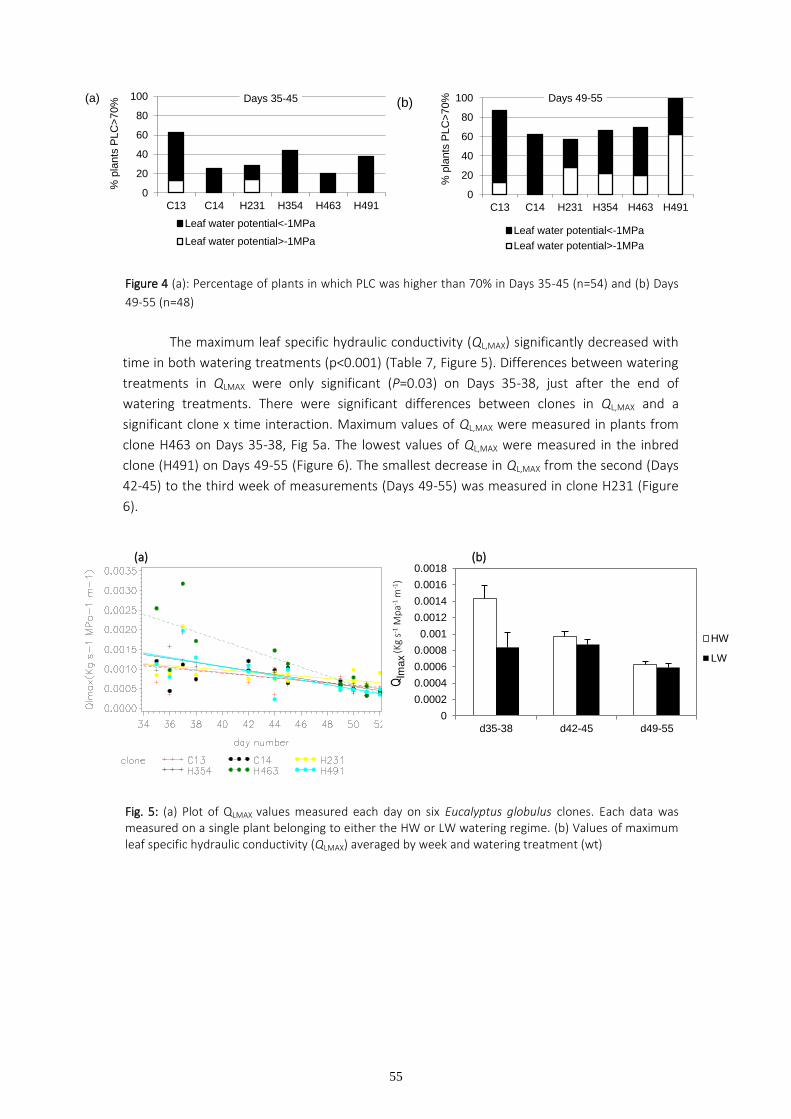
55
Figure 4 (a): Percentage of plants in which PLC was higher than 70% in Days 35-45 (n=54) and (b) Days
49-55 (n=48)………………
The maximum leaf specific hydraulic conductivity (QL,MAX) significantly decreased with
time in both watering treatments (p<0.001) (Table 7, Figure 5). Differences between watering
treatments in QLMAX were only significant (P=0.03) on Days 35-38, just after the end of
watering treatments. There were significant differences between clones in QL,MAX and a
significant clone x time interaction. Maximum values of QL,MAX were measured in plants from
clone H463 on Days 35-38, Fig 5a. The lowest values of QL,MAX were measured in the inbred
clone (H491) on Days 49-55 (Figure 6). The smallest decrease in QL,MAX from the second (Days
42-45) to the third week of measurements (Days 49-55) was measured in clone H231 (Figure
6).
Fig. 5: (a) Plot of QLMAX values measured each day on six Eucalyptus globulus clones. Each data was measured on a single plant belonging to either the HW or LW watering regime. (b) Values of maximum leaf specific hydraulic conductivity (QLMAX) averaged by week and watering treatment (wt)
0
0.0002
0.0004
0.0006
0.0008
0.001
0.0012
0.0014
0.0016
0.0018
d35-38 d42-45 d49-55
Qlm
ax
(K
g s-1
Mp
a-1 m
-1)
HW
LW
(a) (b)
0
20
40
60
80
100
C13 C14 H231 H354 H463 H491
% p
lants
PLC
>70%
Days 35-45 (a)
Leaf water potential<-1MPa
Leaf water potential>-1MPa
0
20
40
60
80
100
C13 C14 H231 H354 H463 H491
% p
lants
PLC
>70%
Days 49-55 (b)
Leaf water potential<-1MPa
Leaf water potential>-1MPa
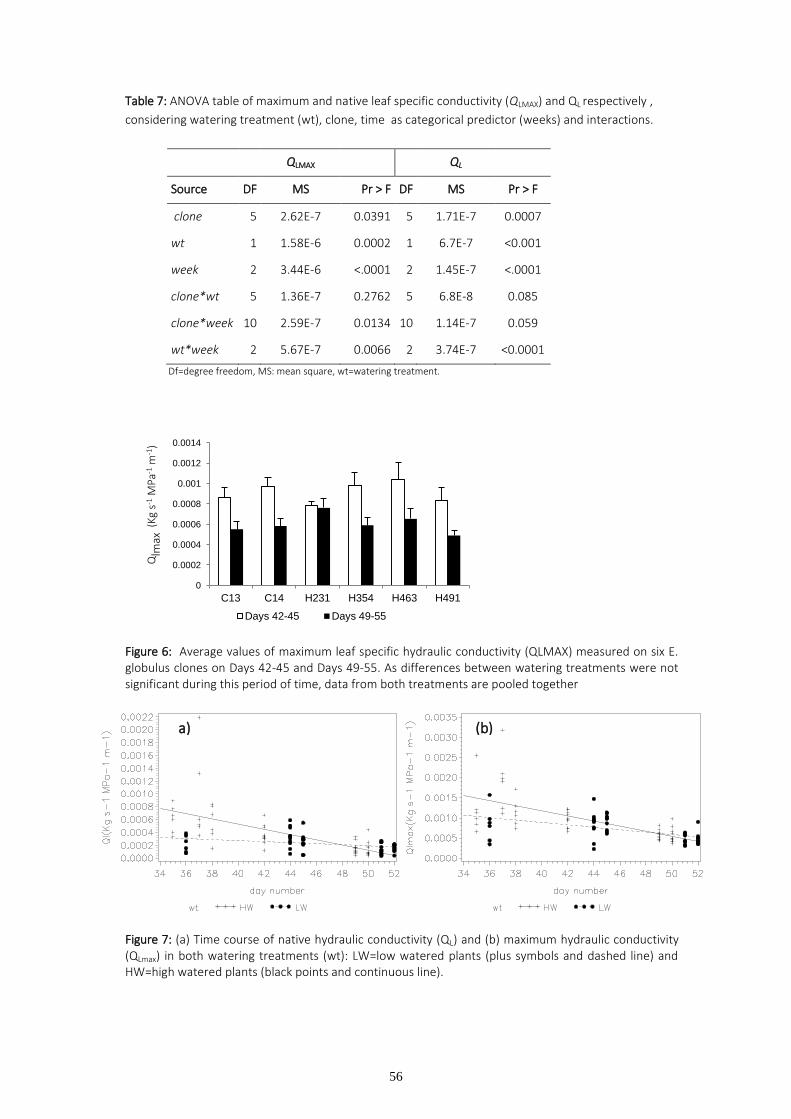
56
Table 7: ANOVA table of maximum and native leaf specific conductivity (QLMAX) and QL respectively ,
considering watering treatment (wt), clone, time as categorical predictor (weeks) and interactions.
QLMAX QL
Source DF MS Pr > F DF MS Pr > F
clone 5 2.62E-7 0.0391 5 1.71E-7 0.0007
wt 1 1.58E-6 0.0002 1 6.7E-7 <0.001
week 2 3.44E-6 <.0001 2 1.45E-7 <.0001
clone*wt 5 1.36E-7 0.2762 5 6.8E-8 0.085
clone*week 10 2.59E-7 0.0134 10 1.14E-7 0.059
wt*week 2 5.67E-7 0.0066 2 3.74E-7 <0.0001
Df=degree freedom, MS: mean square, wt=watering treatment.
…………………
Figure 6: Average values of maximum leaf specific hydraulic conductivity (QLMAX) measured on six E. globulus clones on Days 42-45 and Days 49-55. As differences between watering treatments were not significant during this period of time, data from both treatments are pooled together
Figure 7: (a) Time course of native hydraulic conductivity (QL) and (b) maximum hydraulic conductivity (QLmax) in both watering treatments (wt): LW=low watered plants (plus symbols and dashed line) and HW=high watered plants (black points and continuous line).
………
0
0.0002
0.0004
0.0006
0.0008
0.001
0.0012
0.0014
C13 C14 H231 H354 H463 H491
Qlm
ax (
Kg
s-1 M
Pa-1
m-1
)
Days 42-45 Days 49-55
a) (b)
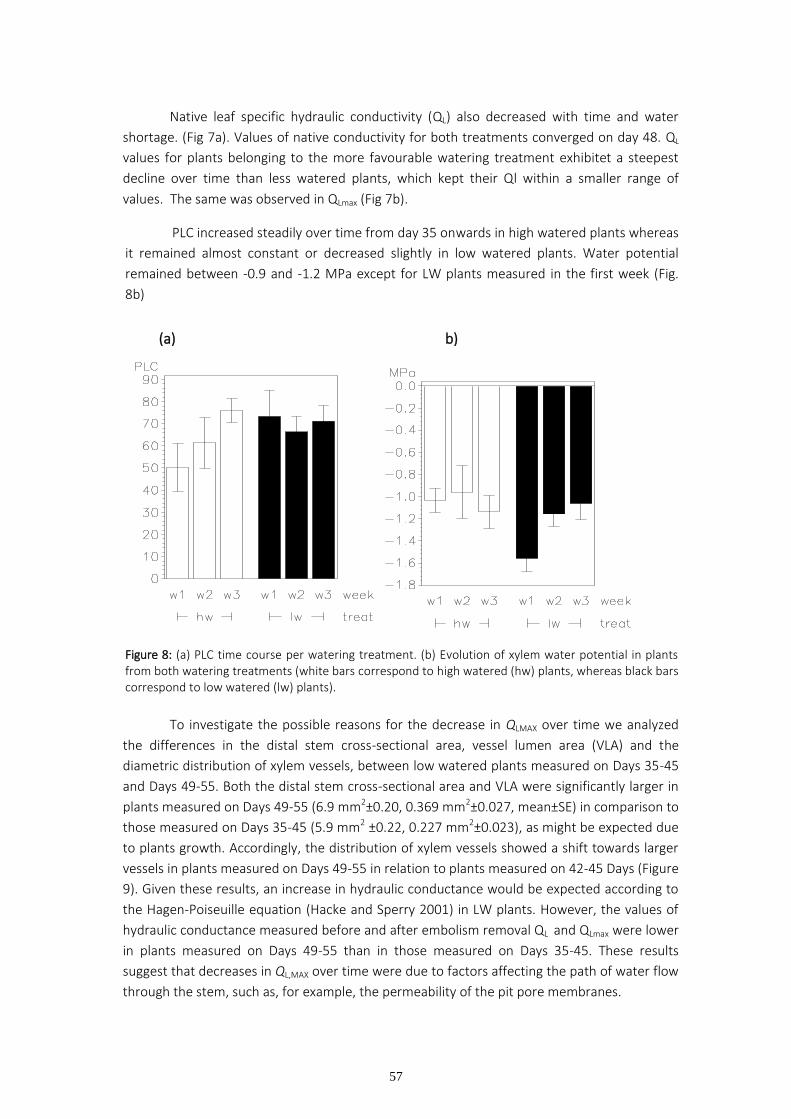
57
Native leaf specific hydraulic conductivity (QL) also decreased with time and water
shortage. (Fig 7a). Values of native conductivity for both treatments converged on day 48. QL
values for plants belonging to the more favourable watering treatment exhibitet a steepest
decline over time than less watered plants, which kept their Ql within a smaller range of
values. The same was observed in QLmax (Fig 7b).
PLC increased steadily over time from day 35 onwards in high watered plants whereas
it remained almost constant or decreased slightly in low watered plants. Water potential
remained between -0.9 and -1.2 MPa except for LW plants measured in the first week (Fig.
8b)
Figure 8: (a) PLC time course per watering treatment. (b) Evolution of xylem water potential in plants from both watering treatments (white bars correspond to high watered (hw) plants, whereas black bars correspond to low watered (lw) plants).
To investigate the possible reasons for the decrease in QLMAX over time we analyzed
the differences in the distal stem cross-sectional area, vessel lumen area (VLA) and the
diametric distribution of xylem vessels, between low watered plants measured on Days 35-45
and Days 49-55. Both the distal stem cross-sectional area and VLA were significantly larger in
plants measured on Days 49-55 (6.9 mm2±0.20, 0.369 mm2±0.027, mean±SE) in comparison to
those measured on Days 35-45 (5.9 mm2 ±0.22, 0.227 mm2±0.023), as might be expected due
to plants growth. Accordingly, the distribution of xylem vessels showed a shift towards larger
vessels in plants measured on Days 49-55 in relation to plants measured on 42-45 Days (Figure
9). Given these results, an increase in hydraulic conductance would be expected according to
the Hagen-Poiseuille equation (Hacke and Sperry 2001) in LW plants. However, the values of
hydraulic conductance measured before and after embolism removal QL and QLmax were lower
in plants measured on Days 49-55 than in those measured on Days 35-45. These results
suggest that decreases in QL,MAX over time were due to factors affecting the path of water flow
through the stem, such as, for example, the permeability of the pit pore membranes.
(a) b) a)
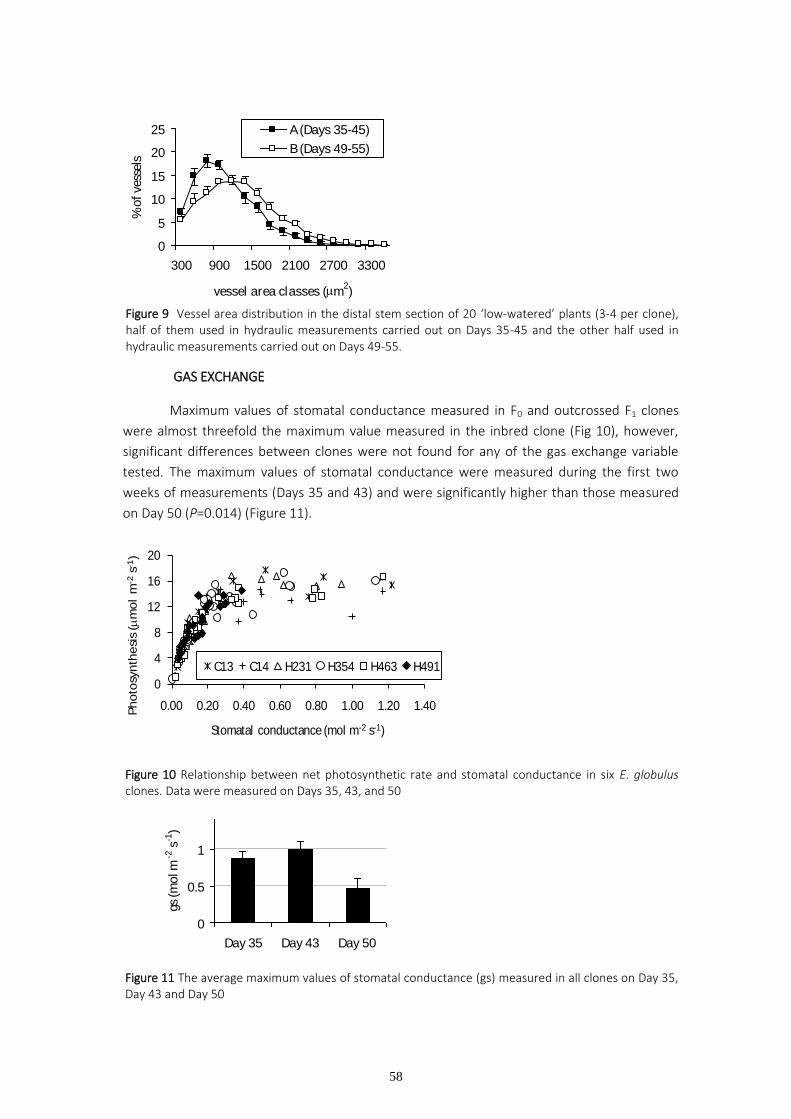
58
Figure 9 Vessel area distribution in the distal stem section of 20 ‘low-watered’ plants (3-4 per clone), half of them used in hydraulic measurements carried out on Days 35-45 and the other half used in hydraulic measurements carried out on Days 49-55.
GAS EXCHANGE
Maximum values of stomatal conductance measured in F0 and outcrossed F1 clones
were almost threefold the maximum value measured in the inbred clone (Fig 10), however,
significant differences between clones were not found for any of the gas exchange variable
tested. The maximum values of stomatal conductance were measured during the first two
weeks of measurements (Days 35 and 43) and were significantly higher than those measured
on Day 50 (P=0.014) (Figure 11).
Figure 10 Relationship between net photosynthetic rate and stomatal conductance in six E. globulus clones. Data were measured on Days 35, 43, and 50
Figure 11 The average maximum values of stomatal conductance (gs) measured in all clones on Day 35, Day 43 and Day 50
0
5
10
15
20
25
300 900 1500 2100 2700 3300
vessel area classes (mm2)
% o
f ve
ssel
sA (Days 35-45)
B (Days 49-55)
0
4
8
12
16
20
0.00 0.20 0.40 0.60 0.80 1.00 1.20 1.40Photo
synth
esi
s (m
mol
m-2
s-1)
Stomatal conductance (mol m-2 s-1)
C13 C14 H231 H354 H463 H491
0
0.5
1
Day 35 Day 43 Day 50
gs (m
ol m
-2 s
-1)
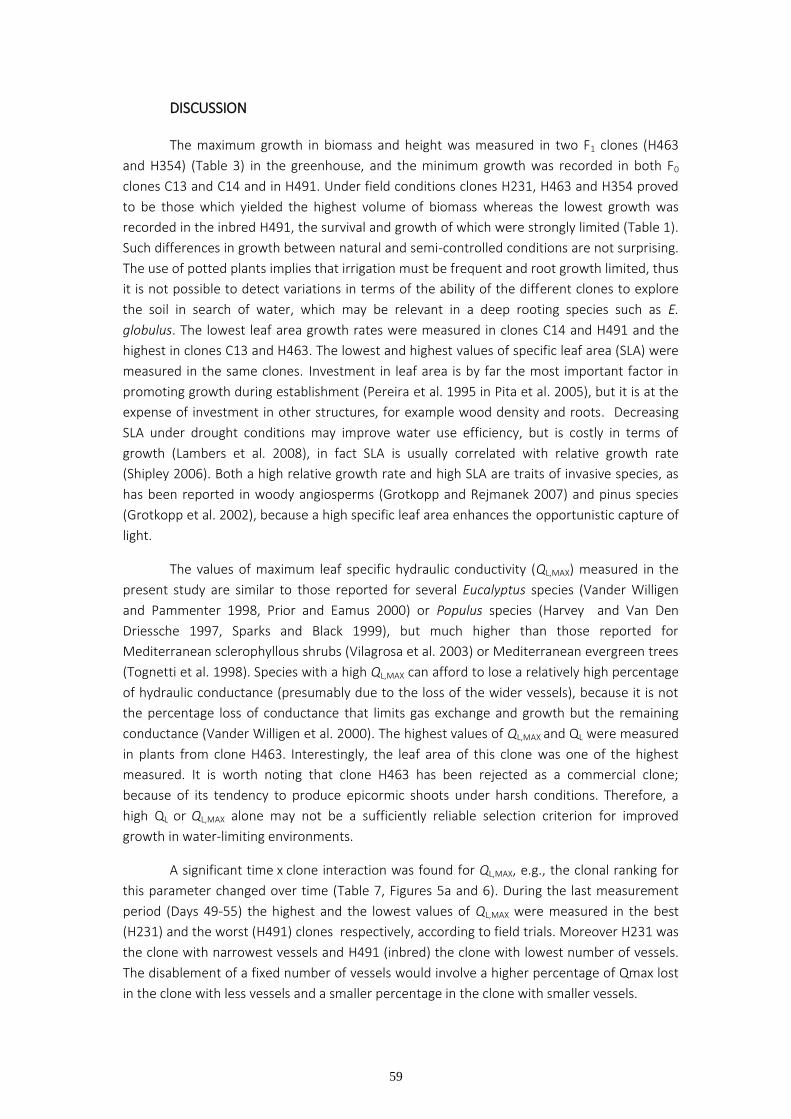
59
DISCUSSION
The maximum growth in biomass and height was measured in two F1 clones (H463
and H354) (Table 3) in the greenhouse, and the minimum growth was recorded in both F0
clones C13 and C14 and in H491. Under field conditions clones H231, H463 and H354 proved
to be those which yielded the highest volume of biomass whereas the lowest growth was
recorded in the inbred H491, the survival and growth of which were strongly limited (Table 1).
Such differences in growth between natural and semi-controlled conditions are not surprising.
The use of potted plants implies that irrigation must be frequent and root growth limited, thus
it is not possible to detect variations in terms of the ability of the different clones to explore
the soil in search of water, which may be relevant in a deep rooting species such as E.
globulus. The lowest leaf area growth rates were measured in clones C14 and H491 and the
highest in clones C13 and H463. The lowest and highest values of specific leaf area (SLA) were
measured in the same clones. Investment in leaf area is by far the most important factor in
promoting growth during establishment (Pereira et al. 1995 in Pita et al. 2005), but it is at the
expense of investment in other structures, for example wood density and roots. Decreasing
SLA under drought conditions may improve water use efficiency, but is costly in terms of
growth (Lambers et al. 2008), in fact SLA is usually correlated with relative growth rate
(Shipley 2006). Both a high relative growth rate and high SLA are traits of invasive species, as
has been reported in woody angiosperms (Grotkopp and Rejmanek 2007) and pinus species
(Grotkopp et al. 2002), because a high specific leaf area enhances the opportunistic capture of
light.
The values of maximum leaf specific hydraulic conductivity (QL,MAX) measured in the
present study are similar to those reported for several Eucalyptus species (Vander Willigen
and Pammenter 1998, Prior and Eamus 2000) or Populus species (Harvey and Van Den
Driessche 1997, Sparks and Black 1999), but much higher than those reported for
Mediterranean sclerophyllous shrubs (Vilagrosa et al. 2003) or Mediterranean evergreen trees
(Tognetti et al. 1998). Species with a high QL,MAX can afford to lose a relatively high percentage
of hydraulic conductance (presumably due to the loss of the wider vessels), because it is not
the percentage loss of conductance that limits gas exchange and growth but the remaining
conductance (Vander Willigen et al. 2000). The highest values of QL,MAX and QL were measured
in plants from clone H463. Interestingly, the leaf area of this clone was one of the highest
measured. It is worth noting that clone H463 has been rejected as a commercial clone;
because of its tendency to produce epicormic shoots under harsh conditions. Therefore, a
high QL or QL,MAX alone may not be a sufficiently reliable selection criterion for improved
growth in water-limiting environments.
A significant time x clone interaction was found for QL,MAX, e.g., the clonal ranking for
this parameter changed over time (Table 7, Figures 5a and 6). During the last measurement
period (Days 49-55) the highest and the lowest values of QL,MAX were measured in the best
(H231) and the worst (H491) clones respectively, according to field trials. Moreover H231 was
the clone with narrowest vessels and H491 (inbred) the clone with lowest number of vessels.
The disablement of a fixed number of vessels would involve a higher percentage of Qmax lost
in the clone with less vessels and a smaller percentage in the clone with smaller vessels.
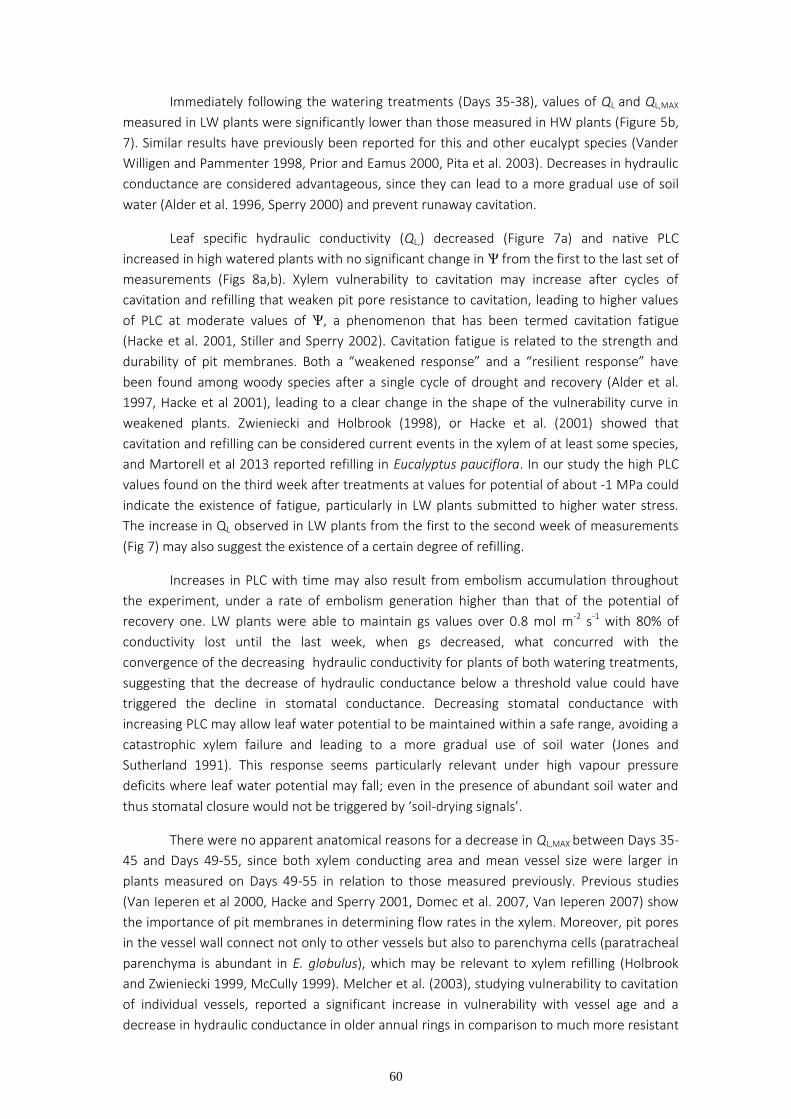
60
Immediately following the watering treatments (Days 35-38), values of QL and QL,MAX
measured in LW plants were significantly lower than those measured in HW plants (Figure 5b,
7). Similar results have previously been reported for this and other eucalypt species (Vander
Willigen and Pammenter 1998, Prior and Eamus 2000, Pita et al. 2003). Decreases in hydraulic
conductance are considered advantageous, since they can lead to a more gradual use of soil
water (Alder et al. 1996, Sperry 2000) and prevent runaway cavitation.
Leaf specific hydraulic conductivity (QL,) decreased (Figure 7a) and native PLC
increased in high watered plants with no significant change in Ѱ from the first to the last set of
measurements (Figs 8a,b). Xylem vulnerability to cavitation may increase after cycles of
cavitation and refilling that weaken pit pore resistance to cavitation, leading to higher values
of PLC at moderate values of Ѱ, a phenomenon that has been termed cavitation fatigue
(Hacke et al. 2001, Stiller and Sperry 2002). Cavitation fatigue is related to the strength and
durability of pit membranes. Both a “weakened response” and a “resilient response” have
been found among woody species after a single cycle of drought and recovery (Alder et al.
1997, Hacke et al 2001), leading to a clear change in the shape of the vulnerability curve in
weakened plants. Zwieniecki and Holbrook (1998), or Hacke et al. (2001) showed that
cavitation and refilling can be considered current events in the xylem of at least some species,
and Martorell et al 2013 reported refilling in Eucalyptus pauciflora. In our study the high PLC
values found on the third week after treatments at values for potential of about -1 MPa could
indicate the existence of fatigue, particularly in LW plants submitted to higher water stress.
The increase in QL observed in LW plants from the first to the second week of measurements
(Fig 7) may also suggest the existence of a certain degree of refilling.
Increases in PLC with time may also result from embolism accumulation throughout
the experiment, under a rate of embolism generation higher than that of the potential of
recovery one. LW plants were able to maintain gs values over 0.8 mol m-2 s-1 with 80% of
conductivity lost until the last week, when gs decreased, what concurred with the
convergence of the decreasing hydraulic conductivity for plants of both watering treatments,
suggesting that the decrease of hydraulic conductance below a threshold value could have
triggered the decline in stomatal conductance. Decreasing stomatal conductance with
increasing PLC may allow leaf water potential to be maintained within a safe range, avoiding a
catastrophic xylem failure and leading to a more gradual use of soil water (Jones and
Sutherland 1991). This response seems particularly relevant under high vapour pressure
deficits where leaf water potential may fall; even in the presence of abundant soil water and
thus stomatal closure would not be triggered by ‘soil-drying signals’.
There were no apparent anatomical reasons for a decrease in QL,MAX between Days 35-
45 and Days 49-55, since both xylem conducting area and mean vessel size were larger in
plants measured on Days 49-55 in relation to those measured previously. Previous studies
(Van Ieperen et al 2000, Hacke and Sperry 2001, Domec et al. 2007, Van Ieperen 2007) show
the importance of pit membranes in determining flow rates in the xylem. Moreover, pit pores
in the vessel wall connect not only to other vessels but also to parenchyma cells (paratracheal
parenchyma is abundant in E. globulus), which may be relevant to xylem refilling (Holbrook
and Zwieniecki 1999, McCully 1999). Melcher et al. (2003), studying vulnerability to cavitation
of individual vessels, reported a significant increase in vulnerability with vessel age and a
decrease in hydraulic conductance in older annual rings in comparison to much more resistant
61
younger vessels. Our results support these findings, suggesting that changes in the sap flow
path that increase xylem vulnerability to cavitation may also decrease maximum hydraulic
conductance even over short periods of time. Recent studies concerning hydrated pit
membranes suggest that the microfibrill network of pit membranes could be covered by a gel
phase (Pesacreta 2005, Lee et al 2012 in Rockwell et al 2014). This led us to hypothesize in
order to explain changes in QLmax that plants could have suffered chemical changes in some pit
membrane components that would have lead to a transient impermeabilization of pits that
would confine air in embolized vessels and would keep sap from being driven through the
impermeabilized pits, diminishing the connectivity of the xylem vessel network and thus the
maximum conductivity, since many hydrogel sealed pits with pectin as components would
have resisted the flushing of 80 Pa applied to remove embolism. Hong et al (2008) reported
that the pore pressure in a hydrogel swelling in equilibrium is less negative than in solid
microfibrills because the stress on the pit membrane fibril network covered by hidrogel is
absorbed mainly by the molecules (solvent) that can migrate within the polymeric gel causing
changes in shape and volume. The transient pit impermeabilization process would have
progressed in our study with the rise in PLC, as did the decrease in Qlmax.
Clone H231 exhibited the lowest decrease in QL,MAX between Days 42-45 and Days 49-
55 (Figure 6) and the lowest QL,MAX under the more favourable conditions of Days 42-45, when
higher values of stomatal conductance were measured compared to Days 49-55. These results
could be related with the fact that H231 displayed the narrowest vessels. According to the
Hagen-Poiseuille equation, flow in xylem vessels is proportional to the fourth power of vessel
radius. Therefore, the loss (due to embolism) or hindrance (due to a decrease in the
permeability of the pit pore membranes) of flow in a high-conducting, wide xylem vessel
should result in a greater decrease in the hydraulic conductance of the stem if compared to
narrow vessels. Clone H491 had the second narrowest vessels, but in contrast to clone H231 it
did exhibit a decrease in QL,MAX between the second and third week of measurements. This
result could be explained by the fact that H491 also had the lowest number of vessels per
stem section. Although caution should be exercised when interpreting the results, given the
reduced size of the sample, it is worth noting that in the present study only six plants had less
than 200 vessels. Four of these plants belonged to the inbred clone (H491), which displayed
the lowest survival rates under field conditions. Ewers et al. in a study of 2007 examined the
adaptive value of vessel redundancy (number of vessels per organ) in order to increase the
resistance of plants to water stress. They concluded that a high number of vessels would
improve water stress tolerance. The frequency of vessels has been found to increase along a
mesic-xeric gradient in several Mediterranean trees and shrubs (De Micco et al 2008),
whereas decreased water availability resulted in a significant increase in vessel density in
Populus deltoides x Populus nigra hybrids (Fichot et al 2009).
The maximum values of stomatal conductance measured in clone H491 were one
third of those measured in the rest of the clones. Increased stomatal conductance may
improve evaporative cooling capacity and heat tolerance. Therefore, reduced stomatal
conductance and transpiration rate in the inbred clone (H491) may explain the lower values
for growth and survival measured in field trials (Table 1) not only resulting from a decrease in
photosynthesis but also because of a decrease in heat tolerance. It has been reported that
inbreeding has a negative effect on survival and growth rates in tree species although no
differences were detected in gas exchange or stable carbon isotope discrimination among
62
inbred and out-crossed black spruce (Picea mariana (Mill) B.S.P) trees (Johnsen et al. 1999,
Johnsen et al. 2003). The lower values of stomatal conductance measured in the inbred clone
in the present study lead to a slightly lower maximum value of photosynthesis in relation to
other F1 clones and, perhaps more importantly, a narrower margin for adjusting water use
without a significant drop in photosynthesis (Figure 10), displaying less plasticity than the
other five clones tested.
ACKNOWLEDGEMENTS
Financial support for this project was provided by the Ministerio de Industria y Energía
of Spain and CYCIT-CDTI. The authors thank Adam Collins for checking the English version of
the manuscript and Francisco Masedo and Ruth Castro for their generous technical assistance.
REFERENCES
Alder NN, Sperry JS Pockman WT (1996) Root and stem xylem embolism, stomatal conductance
and leaf turgor in Acer grandidentatum populations along a soil moisture gradient. Oecologia
105, 293-301
Alder NN, Pockman WT, Sperry JS, Nuismer S (1997) Use of centrifugal force in the study of
xylem cavitation. Journal of Experimental Botany 48, 665-674
Brodribb TJ, Hill RS (1999) The importance of xylem constraints in the distribution of conifer
species. New Phytol. 143, 365-372
Brodribb TJ, Hill RS (2000) Increases in water potential gradient reduce xylem conductivity in
whole plants. Evidence from a low-pressure conductivity method. Plant Physiology 123, 1021-
1028
Cochard H, Coll L, Le Roux X, Ameglio T (2002) Unraveling the effects of plant hydraulics on
stomatal closure during water stress in walnut. Plant Physiology 128, 282-290
Cochard H, Casella E, Mencuccini M (2007) Xylem vulnerabitity to cavitation varies among
poplar and willow clones and correlates with yield. Tree Physiology 27, 1761-1767
De Mico V, Aronne G, Baas P (2008) Wood anatomy and hydraulic architecture of stems and
twigs of some Mediterranean trees and shrubs along a mesic-xeric gradient. Trees 22, 643-655
Domec J-C, Meinzer FC, Lachenbruch B, Housset J (2007) Dynamic variation in sapwood specific
conductivity in six woody species. Tree Physiology 27, 1389-1400
Domec J-C, Scholz FG, Bucci SJ, Meinzer FC, Goldstein G, Villalobos-Vega R (2006). Diurnal and
seasonal variation in root xylem embolism in neotropical savanna woody species: impact on
stomatal control of plant water status. Plant Cell and Environment 29, 26-35.
63
Eamus, D, O´Grady AP, Hutley L (2000) Dry season conditions determine wet season water use
in the wet-dry tropical savannas of northern Australia. Tree Physiol. 20, 1219-1226
Ewers FW, Ewers JM, Jacobsen AL, López-Portillo J (2007) Vessel redundancy: modelling safety
in numbers. IAWA Journal 28, 373-388
Fichot R, Laurans F, Monclus R, Moreau A, Pilate G, Brignolas F (2009) Xylem anatomy correlates
with gas exchange, water-use efficiency and growth performance under contrasting water
regimes: evidence from Populus deltoides x Populus nigra hybrids. Tree Physiology 29 (12),
1537-1549
Froux F, Huc R, Ducrey M, Dreyer E (2002) Xylem hydraulic efficiency versus vulnerability in
seedlings of four contrasting Mediterranean tree species (Cedrus atlantica, Cupressus
sempervirens, Pinus halepensis and Pinus nigra). Ann. For. Sci. 59, 409-418
Grotkopp E, Remanek M, Rost T (2002) Toward a casual explanation of plant invasiveness:
seedling growth and life-history strategies of 29 pine (Pinus) species. American Naturalist 159,
396-419
Grotkopp E, Rejmanek M (2007) High seedling relative growth rate and specific leaf area are
traits of invasive species: phylogenetically independent contrast of woody angiosperms.
American Journal of Botany 94(4), 526-532
Hacke UG, Sperry JS (2001) Functional and ecological xylem anatomy. Perspectives in Plant
Ecology, Evolution and Systematics. Vol. 4/2:97-115
Hacke UG, Stiller V, Sperry JS, Pittermann J, McCulloh KA (2001) Cavitation fatigue. Embolism
and refilling cycles can weaken the cavitation resistance of xylem. Plant Physiology 125:779-786
Hacke UG, Sperry JS (2003) Limits to xylem refilling under negative pressure in Laurus nobilis
and Acer negundo. Plant Cell and Environment 26, 303-311.
Harvey HP, Van Den Driessche R (1997) Nutrition, xylem cavitation and drought resistance in
hybrid poplar. Tree Physiol. 17, 647-654
Himrane H, Camarero JJ, Gil-Pelegrin E (2004) Morphological and ecophysiological variation of
the hybrid oak Quercus subpyrenaica (Q. faginea x Q. pubescens). Trees 18, 566-575
Holbrook NM, Zwieniecki A (1999) Embolism repair and xylem tension: Do we need a miracle?
Plant Physiology 120, 7-10
Holbrook NM, Ahrens ET, Burns MJ, Zwieniecki A (2001) In vivo observation of cavitation and
embolism repair using magnetic resonance imaging. Plant Physiology 126, 27-31
64
Johnsen KH, Flanagan LB, Huber DA, Major JE (1999) Genetic variation in growth and carbon
isotope discrimination in Picea mariana: analyses from a half-diallel mating design using field
grown trees. Can. J. For. Res. 29, 1727-1735.
Johnsen K, Major JE, Maier CA (2003) Selfing results in inbreeding depression of growth but not
of gas exchange or surviving adult black spruce trees. Tree Physiol. 23, 1005-1008
Jones J, Sutherland RA (1991) Stomatal control of xylem embolism. Plant Cell and Environment.
6, 607-612
Kavanagh et al. 1999. Shoot and root vulnerability to xylem cavitation in four populations of
Douglas-fir seedlings. Tree Phys. 19, 31-37.
Lambers H, Chapin III FS, Pons TL (2008) Plant Physiological Ecology. Springer-Verlag New York.
Lemoine D, Cochard H, Granier A (2002) Within crown variation in hydraulic architecture in
beech (Fagus sylvatica L): evidence for a stomatal control of xylem embolism. Ann. For. Sci. 59,
19-27.
Machado J-L, Tyree MT (1994) Patterns of hydraulic architecture and water relations of two
tropical canopy trees with contrasting leaf phenologies: Ochroma pyramidale and
Pseudobombax septenatum. Tree Physiology 18, 219-240.
Maherali H, Pockman WT, Jackson RB (2004) Adaptive variation in the vulnerability of woody
plants to xylem cavitaiton. Ecology 85 (8), 2184-2199
Martorell S., Diaz-Espejo A., Medrano H, Ball MC, Choat B (2014) Rapid hydraulic recovery in Eucalyptus pauciflora after drought: linkages between stem hydraulics and leaf gas exchange Plant, Cell & Environment 37, 3617–626
McCully ME (1999) Root xylem embolisms and refilling. Relation to water potentials of soil,
roots and leaves, and osmotic potentials of root xylem sap. Plant Physiology 119:1001-1008.
Melcher PJ, Zwieniecki A, Holbrook NM (2003) Vulnerability of xylem vessels to cavitation in
sugar maple. Scaling from individual vessels to whole branches. Plant Physiology 131, 1775-
1780.
Nardini A, Pitt F (1999) Drought resistance of Quercus pubescens as a function of root hydraulic
conductance, xylem embolism and hydraulic architecture. New Phytol. 143:485-493.
Nardini N, Salleo S (2000) Limitation of stomatal conductance by hydraulic traits: sensing or
preventing xylem cavitation? Trees 15, 14-24
Piñol J Sala A (2000) Ecological implications of xylem cavitation for several Pinaceae in the
Pacific Northern USA. Funtional Ecology 14, 538-545.
65
Pita P, Soria F, Cañas I, Toval G, Pardos JA (2001) Carbon isotope discrimination and its
relationship to drought resistance under field conditions in genotypes of Eucalyptus globulus
Labill. For. Ecol. Manage. 141, 211-221.
Pita P, Gascó A, Pardos JA (2003) Xylem cavitation, leaf growth and leaf water potential in
Eucalyptus globulus clones under well-watered and drought condictions. Functional Plant
Biology 30, 891-899
Prior LD, Eamus D (2000) Seasonal changes in hydraulic conductance, xylem embolism and leaf
area in Eucalyptus tetrodonta and Eucalyptus miniata saplings in a north Australia savanna.
Plant, Cell and Environment 23, 955-965
Salleo S, Nardini A, Pitt F, Lo Gullo MA (2000) Xylem cavitation and hydraulic control of stomatal
conductance in Laurel (Laurus nobilis L.). Plant Cell and Environment 23, 71-79
Sparks JP, Black RA (1999) Regulation of water loss in populations of Populus trichocarpa: the
role of stomatal control in preventing xylem cavitation. Tree Physiol. 19, 453-459
Sperry JS, Donnelly JR, Tyree MT (1988) A method for measuring hydraulic conductivity and
embolism in xylem. Plant, Cell and Environment 11, 35-40
Sperry JS (2000) Hydraulic constraints on plant gas exchange. Agricultural and Forest
Meteorology 104, 13-23.
Stiller V, Sperry JS (2002) Cavitation fatigue and its reversal in sunflower (Helianthus annuus L.)
Journal of Experimental Botany 53 (371), 1155-1161
Tognetti R, Longobucco A, Raschi A (1998) Vulnerability of xylem to embolism in relation to
plant hydraulic resistance in Quercus pubescens and Quercus ilex co-occurring in a
Mediterranean coppice stand in central Italy. New Phytol. 139, 437-447.
Tyree MT, Salleo S, Nardini A, Lo Gullo MA, Mosca R (1999) Refilling of embolized vessels in
young stems of laurel. Do we need a new paradigm? Plant Physiol 120, 11-21
Tyree MT, Zimmermann MH (2002) Xylem structure and the ascent of sap. Springer Series in
Wood Science Springer-Verlag Berlin Heidelberg New York
Vander Willigen C, Pammenter NW (1998) Relationship between growth and xylem hydraulic
characteristica of clones of Eucalyptus spp. at contrasting sites. Tree Physiology 18, 595-600
Vander Willigen C, Sherwin HW, Pammenter NW (2000) Xylem hydraulic characteristics of
subtropical trees from contrasting habitats grown under identical environmental conditions.
New Phytol. 145, 51-59
Van Ieperen W, van Meeteren U. van Gelder H (2000) Fluid ionic composition influences
hydraulic conductance of xylem conduits. Journal of Experimental Botany 51, 769-776
66
Vilagrosa A, Bellot J, Vallejo VR, Gil-Pelegrín E (2003) Cavitation, stomatal conductance, and leaf
dieback in seedlings of two co-occurring Mediterranean shrubs during an intense drought.
Journal of Experimental Botany 54 (390), 2015-2024
Wang T, Aitken SN, Kavanagh KL (2003) Selection for improved growth and wood quality in
lodgepole pine: effects on phenology, hydraulic architecture and growth of seedlings. Trees. 17,
269-277
Wikberg J, Ögren E (2004) Interrelationships between water use and growth traits in biomass-
producing willows. Trees 18, 70-76
Wikberg J, Ögren E (2007) Variation in drought resistance, drought acclimation and water
conservation in four willow cultivars used for biomass production. Tree Physiology 27, 1339-
1346.
Zwieniecki MA, Holbrook NM (1998) Diurnal variation in xylem hydraulic conductivity in white
ash (Fraxinus americana L.), red maple (Acer rubrum L.) and red spruce (Picea rubens Sarg.).
Plant, Cell and Environment 21, 1173-1180. ………………………………………………………………………….
67
CAPÍTULO 2

68
69
CAPÍTULO 2
THE EFFECT OF VAPOUR PRESSURE DEFICIT ON STOMATAL CONDUCTANCE, SAP PH AND LEAF-SPECIFIC HYDRAULIC CONDUCTANCE IN Eucalyptus globulus CLONES GROWN UNDER TWO WATERING REGIMES
RESUMEN
La conductancia estomática es considerada un factor clave en el estudio de la
adaptación de las plantas al estrés hídrico. Las predicciones de cambio climático auguran un
incremento de fenómenos meteorológicos extremos, que podrían comprometer la
supervivencia de las plantaciones de Eucalyptus globulus situadas en el Suroeste de España. En
este capítulo se investiga en qué medida las variaciones observadas en la conductancia
estomática en respuesta al déficit de presión de vapor atmosférico se deben a la intermediación
de señales hidráulicas o químicas en cinco clones de Eucalyptus globulus cultivados en
invernadero.
Se plantaron bajo invernadero estaquillas ya enraizadas en envases de 5 l. a las que se
sometió a dos regímenes de riego. En cada planta se tomaron mediciones consecutivas de
conductancia estomática, potencial hídrico del tallo, pH de la savia y conductancia hidráulica.
Estas mediciones se llevaron a cabo durante cuatro semanas en las que el rango de valores de
déficit de presión de vapor osciló entre 0.42 y 2.25 kPa. También se midieron la
evapotranspiración, el crecimiento del área foliar y la biomasa del tallo.
Se observaron diferencias significativas entre clones y diferentes tratamientos de riego
en la conductancia estomática y en la conductancia hidráulica referida al área foliar pero no en
el pH de la savia. El pH de la savia, el potencial hídrico y la conductancia estomática sufrieron un
descenso durante unos días consecutivos en los que se incrementó el déficit de presión de
vapor. No se encontró correlación significativa entre la conductancia estomática y la
conductividad específica referida al área foliar. El cierre estomático evitó que el potencial
hídrico bajara de -1.8 MPa. La pérdida de conductividad hidráulica se mantuvo entre valores de
un 40% y un 85%. Los valores máximos y mínimos de conductividad hidráulica referida al área
foliar se midieron en clones pertenecientes a las mismas familias. La escasez de agua produjo
una reducción tanto en el crecimiento como en la evapotranspiración. La disminución de la
transpiración osciló entre el 14 y el 32% en los cinco clones ensayados.
La alcalinización de la savia parece ser un mecanismo de respuesta a cambios en las
condiciones atmosféricas más que a cambios en el contenido de agua en el suelo.
El cierre estomático se produjo tras una pérdida importante de conductancia hidráulica. Se han
encontrado diferencias intraespecíficas que sugieren la posibilidad de mejora de la producción
mediante la selección en condiciones limitantes de agua combinadas con elevadas
temperaturas en las primeras etapas del crecimiento.
70
THE EFFECT OF VAPOUR PRESSURE DEFICIT ON STOMATAL CONDUCTANCE, SAP PH AND LEAF-SPECIFIC HYDRAULIC CONDUCTANCE IN Eucalyptus globulus CLONES GROWN UNDER TWO WATERING REGIMES Maria Jose HERNANDEZ2, Fernando MONTES2, Federico RUIZ3, Gustavo LOPEZ3,4, Pilar PITA1
(1) E.T.S.I. Montes, Universidad Politécnica de Madrid. Ciudad Universitaria s/n. 28040 Madrid, Spain.
(2) CIFOR-INIA, Ctra de la Coruña km 7.5, 28040 Madrid, Spain.
(3) Grupo Empresarial ENCE SA. Ctra A-5000 km 7.5. Apartado 223. 21007 Huelva, Spain.
(4) Current address: R&D Arara Abadi, Sinarmas Forestry, Riau, Indonesia
ABSTRACT
Stomatal conductance has long been considered of key interest in the study of plant
adaptation to water stress. The expected increase in extreme meteorological events under a
climate change scenario may compromise survival in Eucalyptus globulus plantations
established in southwestern Spain. We investigated to what extent changes in stomatal
conductance in response to high vapour pressure deficits and water shortage are mediated by
hydraulic and chemical signals in greenhouse grown Eucalyptus globulus clones.
Rooted cuttings were grown in pots and submitted to two watering regimes. Stomatal
conductance, shoot water potential, sap pH and hydraulic conductance were measured
consecutively in each plant over four weeks under vapour pressure deficits ranging 0.42 to 2.25
kPa. Evapotranspiration, growth in leaf area and shoot biomass were also determined.
We found a significant effect of both clone and watering regime in stomatal conductance and
leaf-specific hydraulic conductance, but not in sap pH. Sap pH decreased as water potential and
stomatal conductance decreased under increasing vapour pressure deficit. There was no
significant relationship between stomatal conductance and leaf specific hydraulic conductance.
Stomata closure precluded shoot water potential from falling below -1.8MPa. The
percentage loss of hydraulic conductance ranged from 40% to 85%. The highest and lowest leaf-
specific hydraulic conductances were measured in clones from the same half-sib families. Water
shortage reduced growth and evapotranspiration, decreases in evapotranspiration ranging 14%-
32% in the five clones tested. ……………………………………………………………………………………
Sap alkalization appears to be a mechanism of response to changes in atmospheric
conditions rather than soil water in the species. Stomata closed after a considerable amount of
hydraulic conductance was lost, although intra-specific differences in leaf specific hydraulic
conductance suggest the possibility of selection for improved productivity under water limiting
conditions combined with high temperatures in the early stages of growth.
INTRODUCTION
Eucalyptus globulus Labill. is widely used for pulp production around the world and can
be considered one of the most important eucalypt species given its high growth rate and
pulping properties. E. globulus plantations established in SW Spain are submitted to both high
temperatures and severe summer drought (Pita et al. 2001). The use of selected clones has
improved both growth and survival under such limiting conditions. However, some of these
71
clones might fail under extreme meteorological conditions, as shown by the effects of the
exceptional drought of 2005.
Stomatal conductance has long been considered of key interest in the study of plant
adaptation to drought and high temperatures (Damour et al 2010, Grossnickle and Russel 2010,
Pearce et al. 2005). This is particularly true for E. globulus plantations established under
Mediterranean climates. Firstly, because high vapour pressure deficits may result in water
stress even when soil water is abundant. Secondly, because E. globulus was found to reach its
highest productivities through lower water-use efficiency in field trials established in
southwestern Spain (Pita et al. 2001a). After analyzing the strong dependence of a wide range
of photosynthetic parameters on stomatal conductance, Medrano et al. (2002) proposed the
use of mid-morning, light-saturated stomatal conductance as a reference parameter to reflect
the intensity of water stress. Stomata control several trade-offs that determine growth under
water limiting conditions. Minimizing water loss by stomatal closure under drought conditions
reduces CO2 uptake and leaf cooling via transpiration but increases water use efficiency while
allowing the plant to avoid low shoot water potentials. Stomata have long been recognized as
an efficient means of controlling the risk of xylem embolism (Jones and Sutherland 1991), at
least under non-extreme soil water deficits (Meinzer et al. 2009). In some species, stomata may
close at the incipience of xylem embolism, as in walnut (Juglans regia x nigra) (Cochard et al.
2002). In other species, stomatal conductance and transpiration are maximized at the expense
of a certain degree of embolism (Manzoni et al. 2013).
Both hydraulic and chemical signals participate in the regulation of stomatal
conductance. Among others, stomata have been found to respond to cavitation-induced
changes in stem hydraulic conductance (Tombasi et al 2015, Ripullone et al. 2007), the abscisic
acid (ABA) concentration in the xylem sap (Heilmeier et al. 2007, McAdam &Brodribb 2015) and
changes in xylem sap pH: xylem sap alkalization (Sobeih et al. 2004, Wan et al. 2004).
Root-to-shoot signalling is often considered to be important in regulating shoot growth
and water use when soil conditions change. Identifying signal molecules and their roles is seen
as a potential way to modify crop water use (Dodd 2005). In contrast, root signalling has been
considered less effective for very tall species, in which signal transmission may be too slow for a
feed-forward model of short-term stomatal response and thus other factors, such as ABA
production or release within the leaves may be more important (Heilmeier et al. 2007).
However, it must be considered that changes in xylem sap may arise from root export of
signalling substances but also from changes in sap composition during long-distance transport
in the stem (Dodd 2005). The vessel-associated cells from axial xylem parenchyma are those
which are best suited to play a major role in the control of sap composition (Alves et al. 2004).
In this sense, working with a species like E. globulus would seem particularly interesting, not
only because it is capable of reaching both great heights and high transpiration rates, but also
because it has abundant axial parenchyma in the xylem. The use of juvenile plant material
seems appropriate since juvenile size classes tend to suffer more extreme stress because of
their relatively shallow root systems (Matzner et al. 2003). Moreover, the highest values of
stomatal conductance were found to be reached at early stages of growth in several tree
species (Matzner et al. 2003, Mediavilla and Escudero 2003).
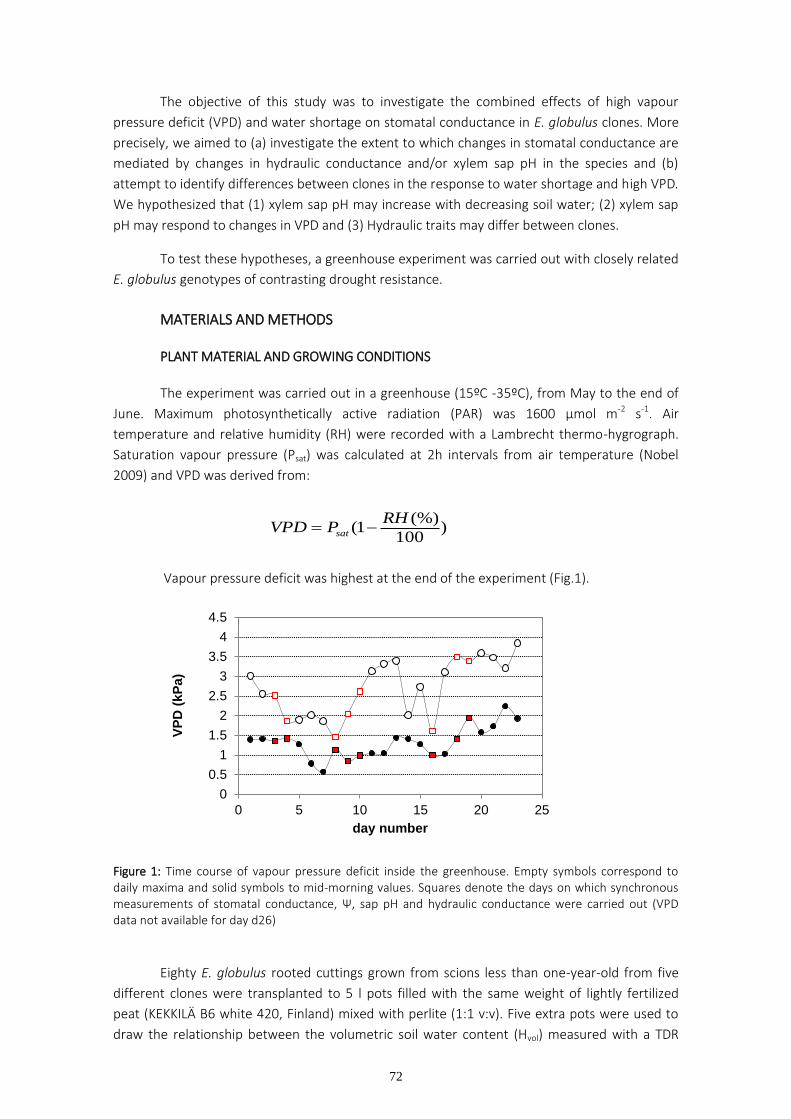
72
The objective of this study was to investigate the combined effects of high vapour
pressure deficit (VPD) and water shortage on stomatal conductance in E. globulus clones. More
precisely, we aimed to (a) investigate the extent to which changes in stomatal conductance are
mediated by changes in hydraulic conductance and/or xylem sap pH in the species and (b)
attempt to identify differences between clones in the response to water shortage and high VPD.
We hypothesized that (1) xylem sap pH may increase with decreasing soil water; (2) xylem sap
pH may respond to changes in VPD and (3) Hydraulic traits may differ between clones.
To test these hypotheses, a greenhouse experiment was carried out with closely related
E. globulus genotypes of contrasting drought resistance.
MATERIALS AND METHODS
PLANT MATERIAL AND GROWING CONDITIONS
The experiment was carried out in a greenhouse (15ºC -35ºC), from May to the end of
June. Maximum photosynthetically active radiation (PAR) was 1600 µmol m-2 s-1. Air
temperature and relative humidity (RH) were recorded with a Lambrecht thermo-hygrograph.
Saturation vapour pressure (Psat) was calculated at 2h intervals from air temperature (Nobel
2009) and VPD was derived from:
(%)(1 )
100sat
RHVPD P
Vapour pressure deficit was highest at the end of the experiment (Fig.1).
Figure 1: Time course of vapour pressure deficit inside the greenhouse. Empty symbols correspond to daily maxima and solid symbols to mid-morning values. Squares denote the days on which synchronous measurements of stomatal conductance, Ѱ, sap pH and hydraulic conductance were carried out (VPD data not available for day d26)
Eighty E. globulus rooted cuttings grown from scions less than one-year-old from five
different clones were transplanted to 5 l pots filled with the same weight of lightly fertilized
peat (KEKKILÄ B6 white 420, Finland) mixed with perlite (1:1 v:v). Five extra pots were used to
draw the relationship between the volumetric soil water content (Hvol) measured with a TDR
0
0.5
1
1.5
2
2.5
3
3.5
4
4.5
0 5 10 15 20 25
VP
D (
kP
a)
day number
73
probe (Trime IMKO, Germany) and pot weight, covering the range of weight values in the
experiment. The relationship between both variables (Hvol= 0.0162W-16.45, r2=0.96 n=25) was
used to determine volumetric soil water content from the weight of the potted plants. Plant
weight was considered negligible, since it was much lower that the pot weight (Figure 2). Clones
T and OD are F1 clones that had been widely used in commercial plantations in SW Spain.
Interestingly, both clones differed in their response to the exceptional drought of 2005 (worst
drought since 1947, Aemet 2005). Clone T was most affected and therefore withdrawn from
production from then on. Clone C14 is a F0 clone that shows an enhanced survival rate but
lower growth rates than clones OD and T. Clones PI and SA are F1 clones that belong to the
same half-sib families as OD and T respectively, and were chosen for this study simply because
of their shared affiliation with the others, clone C14 being the common progenitor.
After transplanting, plants were allowed to grow and acclimate for a period of three
weeks. Plants were watered two to three times a week and fertilized twice with 1g plant-1 of
soluble Peters® (20:20:20) during this period. On May 31 (d0), two watering regimes (R1 and R2)
were established. In the case of R1, the plants were watered until a weight of 2600 g was
reached, while for R2 plants the figure was 2300 g. These values corresponded to 90% and 73%
of volumetric soil water content at field capacity for R1 and R2 respectively. Plants from both
watering regimes were watered up to these weights throughout the experiment. All plants were
watered on Mondays, Wednesdays and Fridays except during the third week of measurements
in which R2 plants were not watered on Wednesday to increase the level of water stress.
MEASUREMENTS
The amount of water lost by evapotranspiration was calculated between irrigations
from the weight of each plant before and after watering.
Synchronous measurement of stomatal conductance, sap pH, Ѱ and hydraulic
conductance (physiological parameters hereafter) were carried out plant by plant on days d3,
d4, d8, d9, d10, d16, d18 d19, d23 and d26. From day d3 to day d10, six plants per day (three
from each watering regime, from the same clones) were measured and harvested. On days d16-
d19 the sample size was increased up to ten plants per day (one per clone and watering
regime). Ten plants from one single watering regime (two per clone) were measured on d23
(R1) and d26 (R2) in order to establish whether the moment at which the measurements were
taken had a significant effect on the physiological parameters.
Stomatal conductance to water vapour and net photosynthetic rate were measured in
the youngest fully expanded leaf using a portable gas exchange chamber Li-Cor 6400XT (Li-Cor;
Lincoln, USA). All measurements were made between 11:00 and 13:00 hours (local time), under
300 W metal halide lamps to ensure a PAR above 1000 µmol m-2 s-1. We later verified that there
was no significant relationship between the rate of photosynthesis and PAR values in the range
1000-1600µmol m-2 s-1, meaning that light intensity could be considered saturating for all
measurements.
Immediately after measuring gas exchange, each plant was taken to the laboratory (less
than five minutes from the greenhouse), weighed with its container and cut under water just
below the 6th-7th node. Time of harvesting was annotated for each plant. Water potential (Ѱ)
was determined in the shoot apex using a Scholander type pressure chamber (Plant Moisture
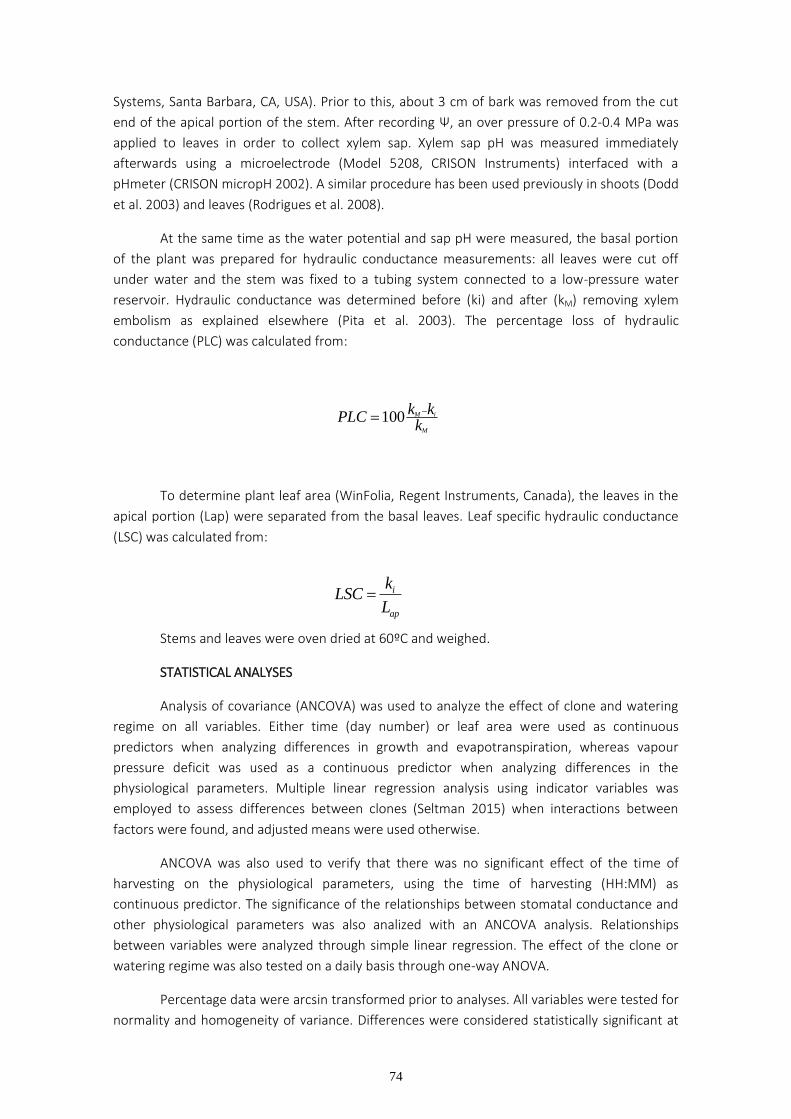
74
Systems, Santa Barbara, CA, USA). Prior to this, about 3 cm of bark was removed from the cut
end of the apical portion of the stem. After recording Ѱ, an over pressure of 0.2-0.4 MPa was
applied to leaves in order to collect xylem sap. Xylem sap pH was measured immediately
afterwards using a microelectrode (Model 5208, CRISON Instruments) interfaced with a
pHmeter (CRISON micropH 2002). A similar procedure has been used previously in shoots (Dodd
et al. 2003) and leaves (Rodrigues et al. 2008).
At the same time as the water potential and sap pH were measured, the basal portion
of the plant was prepared for hydraulic conductance measurements: all leaves were cut off
under water and the stem was fixed to a tubing system connected to a low-pressure water
reservoir. Hydraulic conductance was determined before (ki) and after (kM) removing xylem
embolism as explained elsewhere (Pita et al. 2003). The percentage loss of hydraulic
conductance (PLC) was calculated from:
100 M i
M
k kPLC
k
To determine plant leaf area (WinFolia, Regent Instruments, Canada), the leaves in the
apical portion (Lap) were separated from the basal leaves. Leaf specific hydraulic conductance
(LSC) was calculated from:
Stems and leaves were oven dried at 60ºC and weighed.
STATISTICAL ANALYSES
Analysis of covariance (ANCOVA) was used to analyze the effect of clone and watering
regime on all variables. Either time (day number) or leaf area were used as continuous
predictors when analyzing differences in growth and evapotranspiration, whereas vapour
pressure deficit was used as a continuous predictor when analyzing differences in the
physiological parameters. Multiple linear regression analysis using indicator variables was
employed to assess differences between clones (Seltman 2015) when interactions between
factors were found, and adjusted means were used otherwise.
ANCOVA was also used to verify that there was no significant effect of the time of
harvesting on the physiological parameters, using the time of harvesting (HH:MM) as
continuous predictor. The significance of the relationships between stomatal conductance and
other physiological parameters was also analized with an ANCOVA analysis. Relationships
between variables were analyzed through simple linear regression. The effect of the clone or
watering regime was also tested on a daily basis through one-way ANOVA.
Percentage data were arcsin transformed prior to analyses. All variables were tested for
normality and homogeneity of variance. Differences were considered statistically significant at
i
ap
kLSC
L
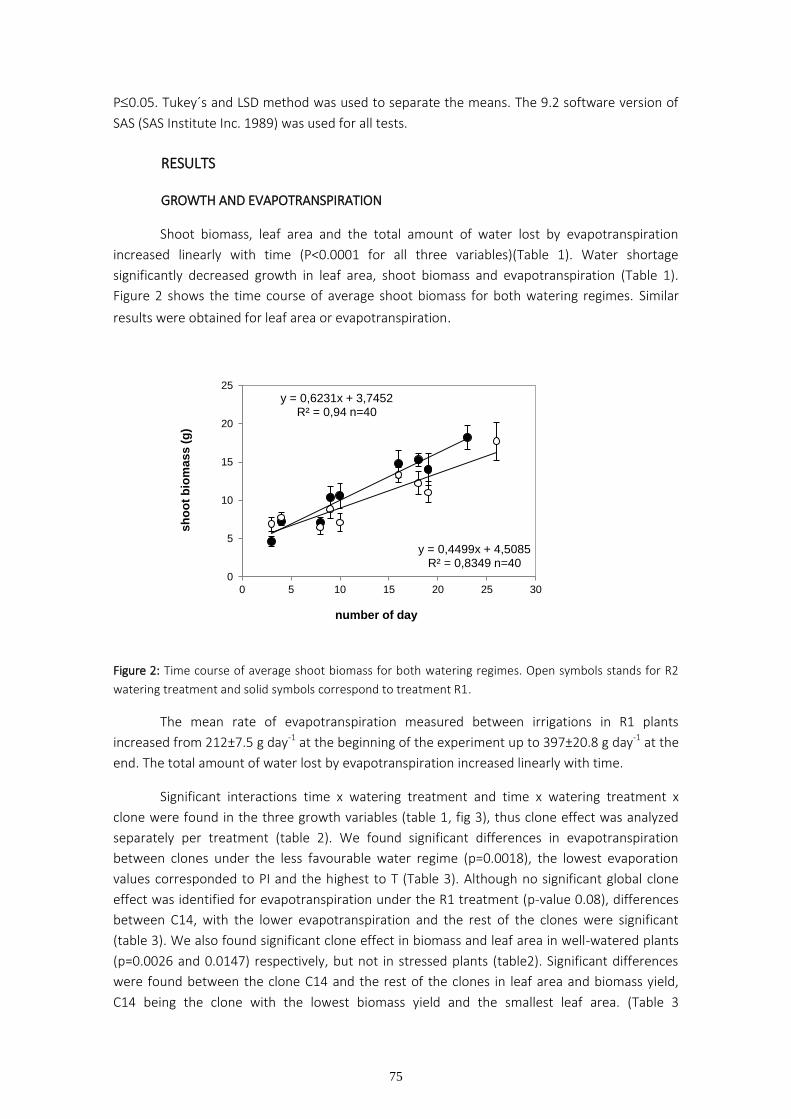
75
P0.05. Tukey´s and LSD method was used to separate the means. The 9.2 software version of
SAS (SAS Institute Inc. 1989) was used for all tests.
RESULTS
GROWTH AND EVAPOTRANSPIRATION
Shoot biomass, leaf area and the total amount of water lost by evapotranspiration
increased linearly with time (P<0.0001 for all three variables)(Table 1). Water shortage
significantly decreased growth in leaf area, shoot biomass and evapotranspiration (Table 1).
Figure 2 shows the time course of average shoot biomass for both watering regimes. Similar
results were obtained for leaf area or evapotranspiration.
Figure 2: Time course of average shoot biomass for both watering regimes. Open symbols stands for R2
watering treatment and solid symbols correspond to treatment R1.
The mean rate of evapotranspiration measured between irrigations in R1 plants
increased from 212±7.5 g day-1 at the beginning of the experiment up to 397±20.8 g day-1 at the
end. The total amount of water lost by evapotranspiration increased linearly with time.
Significant interactions time x watering treatment and time x watering treatment x
clone were found in the three growth variables (table 1, fig 3), thus clone effect was analyzed
separately per treatment (table 2). We found significant differences in evapotranspiration
between clones under the less favourable water regime (p=0.0018), the lowest evaporation
values corresponded to PI and the highest to T (Table 3). Although no significant global clone
effect was identified for evapotranspiration under the R1 treatment (p-value 0.08), differences
between C14, with the lower evapotranspiration and the rest of the clones were significant
(table 3). We also found significant clone effect in biomass and leaf area in well-watered plants
(p=0.0026 and 0.0147) respectively, but not in stressed plants (table2). Significant differences
were found between the clone C14 and the rest of the clones in leaf area and biomass yield,
C14 being the clone with the lowest biomass yield and the smallest leaf area. (Table 3
y = 0,6231x + 3,7452 R² = 0,94 n=40
y = 0,4499x + 4,5085 R² = 0,8349 n=40
0
5
10
15
20
25
0 5 10 15 20 25 30
sh
oo
t b
iom
as
s (
g)
number of day
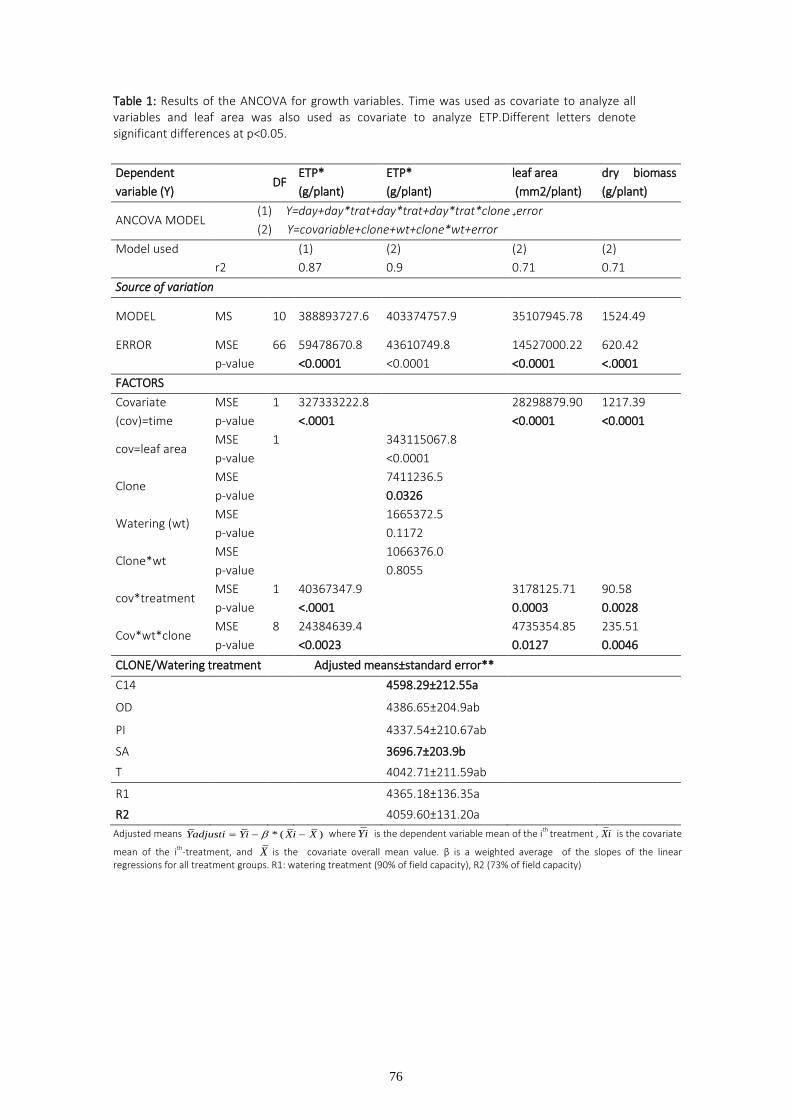
76
Table 1: Results of the ANCOVA for growth variables. Time was used as covariate to analyze all variables and leaf area was also used as covariate to analyze ETP.Different letters denote significant differences at p<0.05.
Dependent
variable (Y) DF
ETP*
(g/plant)
ETP*
(g/plant)
leaf area
(mm2/plant)
dry biomass
(g/plant)
ANCOVA MODEL (1) Y=day+day*trat+day*trat+day*trat*clone +error
(2) Y=covariable+clone+wt+clone*wt+error
Model used (1) (2) (2) (2)
r2 0.87 0.9 0.71 0.71
Source of variation
MODEL MS 10 388893727.6 403374757.9 35107945.78 1524.49
ERROR MSE 66 59478670.8 43610749.8 14527000.22 620.42
p-value <0.0001 <0.0001 <0.0001 <.0001
FACTORS
Covariate
(cov)=time
MSE 1 327333222.8
28298879.90 1217.39
p-value <.0001
<0.0001 <0.0001
cov=leaf area MSE 1 343115067.8
p-value <0.0001
Clone MSE 7411236.5
p-value 0.0326
Watering (wt) MSE 1665372.5
p-value 0.1172
Clone*wt MSE 1066376.0
p-value 0.8055
cov*treatment MSE 1 40367347.9 3178125.71 90.58
p-value <.0001 0.0003 0.0028
Cov*wt*clone MSE 8 24384639.4 4735354.85 235.51
p-value <0.0023 0.0127 0.0046
CLONE/Watering treatment Adjusted means±standard error**
C14 4598.29±212.55a
OD 4386.65±204.9ab
PI 4337.54±210.67ab
SA 3696.7±203.9b
T
4042.71±211.59ab
R1 4365.18±136.35a
R2 4059.60±131.20a
Adjusted means * ( )Yadjusti Yi Xi X where Yi is the dependent variable mean of the ith treatment , Xi is the covariate
mean of the ith-treatment, and X is the covariate overall mean value. β is a weighted average of the slopes of the linear regressions for all treatment groups. R1: watering treatment (90% of field capacity), R2 (73% of field capacity)
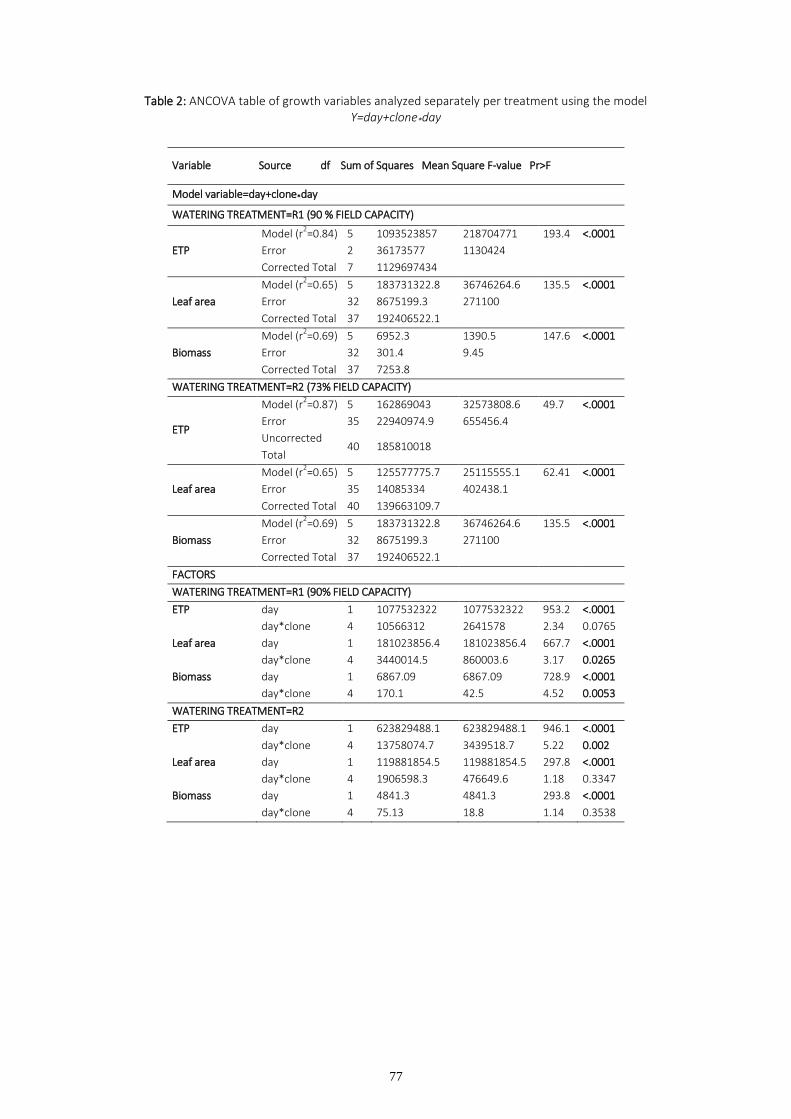
77
Table 2: ANCOVA table of growth variables analyzed separately per treatment using the model Y=day+clone*day
Variable Source df Sum of Squares Mean Square F-value Pr>F
Model variable=day+clone*day
WATERING TREATMENT=R1 (90 % FIELD CAPACITY)
ETP
Model (r2=0.84) 5 1093523857 218704771 193.4 <.0001
Error 2 36173577 1130424
Corrected Total 7 1129697434
Leaf area
Model (r2=0.65) 5 183731322.8 36746264.6 135.5 <.0001
Error 32 8675199.3 271100
Corrected Total 37 192406522.1
Biomass
Model (r2=0.69) 5 6952.3 1390.5 147.6 <.0001
Error 32 301.4 9.45
Corrected Total 37 7253.8
WATERING TREATMENT=R2 (73% FIELD CAPACITY)
ETP
Model (r2=0.87) 5 162869043 32573808.6 49.7 <.0001
Error 35 22940974.9 655456.4
Uncorrected
Total 40 185810018
Leaf area
Model (r2=0.65) 5 125577775.7 25115555.1 62.41 <.0001
Error 35 14085334 402438.1
Corrected Total 40 139663109.7
Biomass
Model (r2=0.69) 5 183731322.8 36746264.6 135.5 <.0001
Error 32 8675199.3 271100
Corrected Total 37 192406522.1
FACTORS
WATERING TREATMENT=R1 (90% FIELD CAPACITY)
ETP day 1 1077532322 1077532322 953.2 <.0001
day*clone 4 10566312 2641578 2.34 0.0765
Leaf area day 1 181023856.4 181023856.4 667.7 <.0001
day*clone 4 3440014.5 860003.6 3.17 0.0265
Biomass day 1 6867.09 6867.09 728.9 <.0001
day*clone 4 170.1 42.5 4.52 0.0053
WATERING TREATMENT=R2
ETP day 1 623829488.1 623829488.1 946.1 <.0001
day*clone 4 13758074.7 3439518.7 5.22 0.002
Leaf area day 1 119881854.5 119881854.5 297.8 <.0001
day*clone 4 1906598.3 476649.6 1.18 0.3347
Biomass day 1 4841.3 4841.3 293.8 <.0001
day*clone 4 75.13 18.8 1.14 0.3538
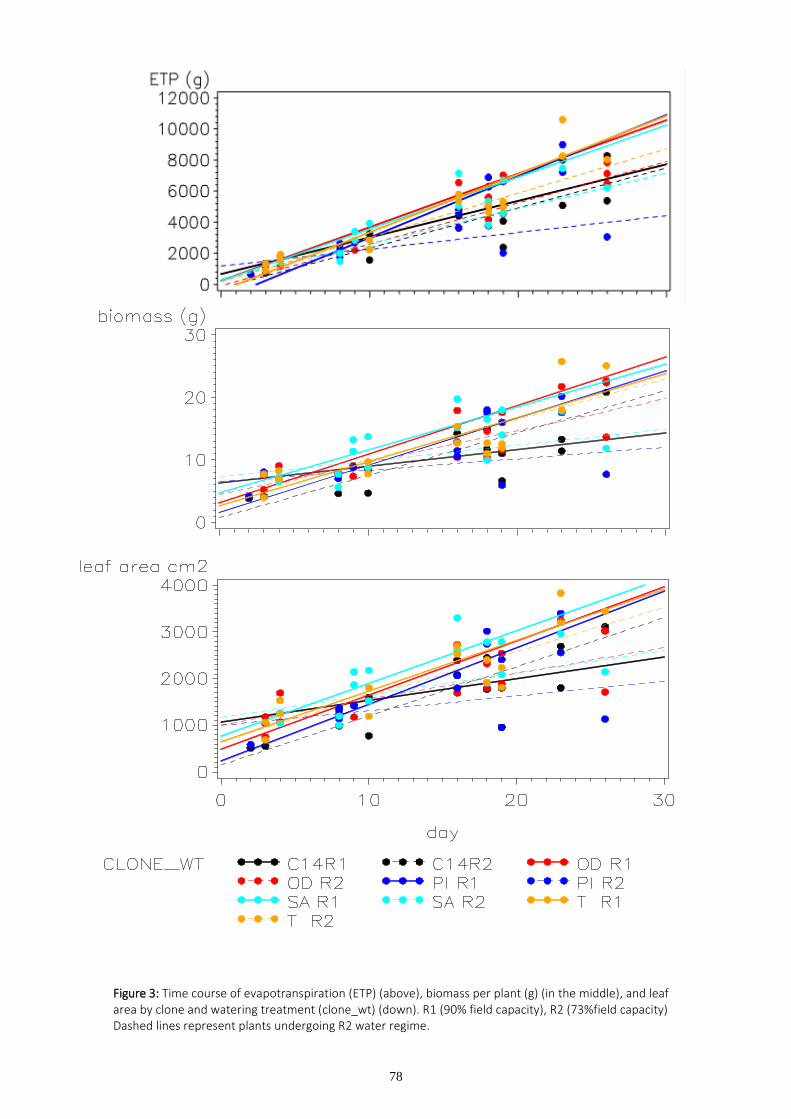
78
Figure 3: Time course of evapotranspiration (ETP) (above), biomass per plant (g) (in the middle), and leaf area by clone and watering treatment (clone_wt) (down). R1 (90% field capacity), R2 (73%field capacity) Dashed lines represent plants undergoing R2 water regime.

79
Table 3: Parameter estimates obtained from multiple regression analysis using indicator variables to test
differences between clones. The model used was: variable=day+ (day*clone *Ij-1) , where j=levels of factor clone, I=indicator variable Ii=1 when clone=clonei , otherwise Ii=0. Reference groups were clone C14 for treatment R1 and clone T for R2, such that estimates represent the difference in model estimates between the corresponding clone and the reference clone
Variable Parameter Estimate Standard
t Value Pr > |t| Parameter Estimate Standard
t Value Pr > |t| Error Error
WATERING TREATMENT =R1 (90% FIELD CAPACITY) WATERING TREATMENT =R2 (73% FIELD CAPACITY)
ETP
day 272.4 22.8 11.9 <.0001 day 294.51 19.46 15.14 <.0001
day*clone OD 86.2 35.2 2.4 0.02 day*clone OD -32.09 24.35 -1.32 0.1958
day*clone T 81.3 32.4 2.5 0.0176 day*clone C14 -48.88 25.41 -1.92 0.0623
day*clone PI 72.3 32.4 2.2 0.0326 day*clone PI -119.42 27.45 -4.35 0.0001
day*clone SA 75.3 34.2 2.2 0.0353 day*clone SA -47.12 27.01 -1.75 0.0894
day*clone C14 0 (reference clone) day*clone T 0 (reference clone)
Leaf area
day 104.3 11.1 9.3 <.0001 day 132.09 15.20 8.69 <.0001
day*clone OD 40.2 17.2 2.33 0.026 day*clone OD -28.61 19.02 -1.50 0.1416
day*clone T 39.8 15.9 2.5 0.0176 day*clone C14 -18.45 21.34 -0.86 0.3931
day*clone PI 29.8 15.8 1.88 0.0688 day*clone PI -43.79 21.45 -2.04 0.0487
day*clone SA 55.7 16.7 3.32 0.0022 day*clone SA -15.81 21.10 -0.75 0.4587
day*clone C14 0 (reference clone) day*clone T 0 (reference clone)
Biomass
day 0.61 0.06 9.22 <.0001 day 0.84 0.10 8.64 <.0001
day*clone OD 0.35 0.1 3.43 0.0017 day*clone OD -0.12 0.12 -0.96 0.3456
day*clone T 0.24 0.09 2.59 0.0145 day*clone C14 -0.12 0.14 -0.87 0.3899
day*clone PI 0.23 0.09 2.47 0.0189 day*clone PI -0.29 0.14 -2.09 0.0437
day*clone SA 0.37 0.09 3.73 0.0008 day*clone SA -0.16 0.14 -1.19 0.2439
day*clone C14 0 (reference clone) day*clone T 0 (reference clone)
PHYSIOLOGICAL PARAMETERS
Increasing maximum VPD inside the greenhouse (Fig. 1) led to a decrease in both Ѱ and
mid-morning stomatal conductance in plants from both watering regimes the last days of the
study. Stomatal conductance and Ѱ remained above 0.5 mol m-2 s-1 and -1.4 MPa respectively
from d3 to d16 and fell below these threshold values from d18 onwards (Fig. 4a,b). Xylem sap
pH tended to decrease as stomatal conductance decreased (Fig. 4a,c), whereas PLC remained
high and stable throughout the experiment (except for plants from treatment R2 on d4).
No significant effect of the watering regime on xylem sap pH was found on any of the
measurement occasions (Fig. 4c, Table 4). This result was particularly striking for d18 and d19,
when R2 plants were submitted to a four-day drought cycle, while R1 plants were watered
every two days. Stomatal conductance was significantly higher in R1 plants compared to R2
plants on d18 and d19 (Fig.4a). Despite the differences in soil water and stomatal conductance,
xylem sap pH values were almost identical for both watering regimes on both days (Fig. 4c).
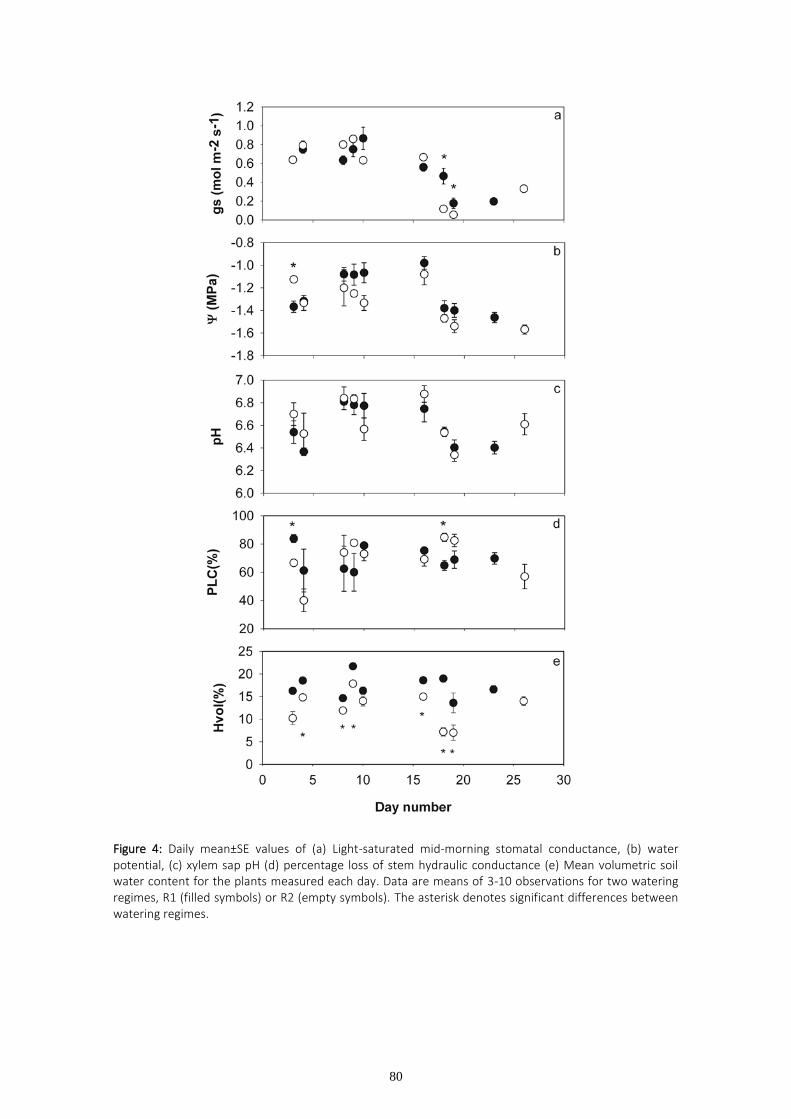
80
Figure 4: Daily mean±SE values of (a) Light-saturated mid-morning stomatal conductance, (b) water potential, (c) xylem sap pH (d) percentage loss of stem hydraulic conductance (e) Mean volumetric soil water content for the plants measured each day. Data are means of 3-10 observations for two watering regimes, R1 (filled symbols) or R2 (empty symbols). The asterisk denotes significant differences between watering regimes.
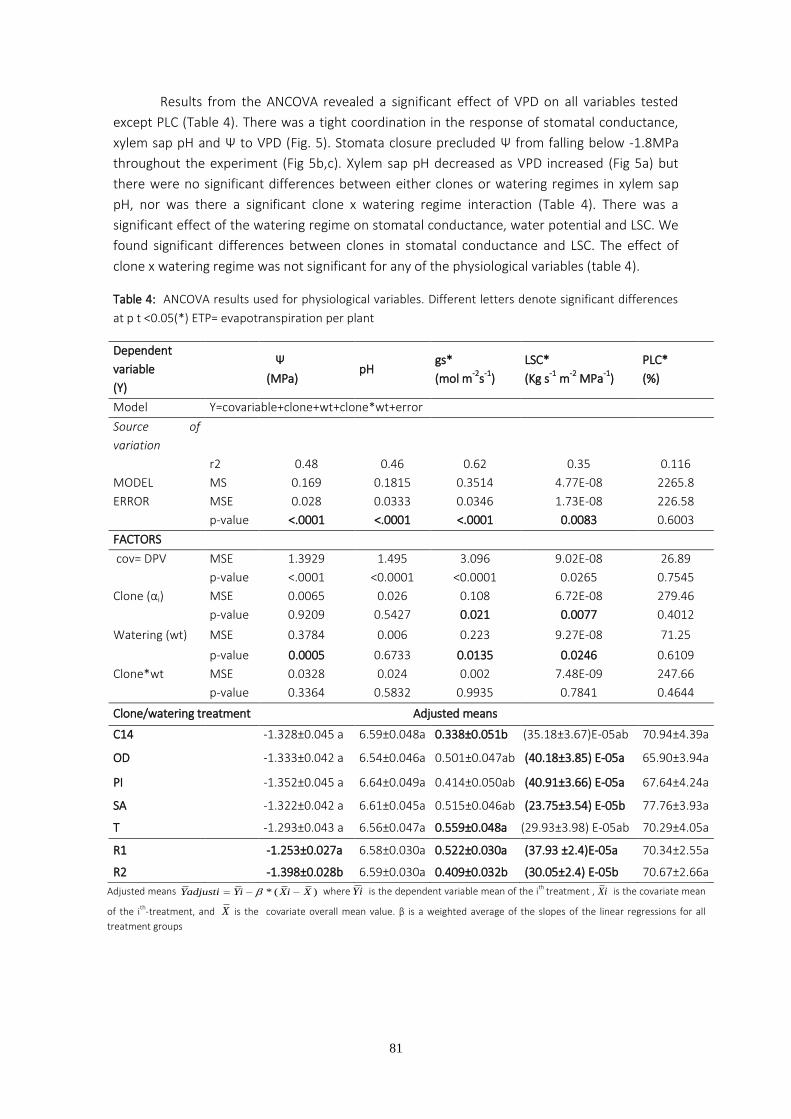
81
Results from the ANCOVA revealed a significant effect of VPD on all variables tested
except PLC (Table 4). There was a tight coordination in the response of stomatal conductance,
xylem sap pH and Ѱ to VPD (Fig. 5). Stomata closure precluded Ѱ from falling below -1.8MPa
throughout the experiment (Fig 5b,c). Xylem sap pH decreased as VPD increased (Fig 5a) but
there were no significant differences between either clones or watering regimes in xylem sap
pH, nor was there a significant clone x watering regime interaction (Table 4). There was a
significant effect of the watering regime on stomatal conductance, water potential and LSC. We
found significant differences between clones in stomatal conductance and LSC. The effect of
clone x watering regime was not significant for any of the physiological variables (table 4).
Table 4: ANCOVA results used for physiological variables. Different letters denote significant differences
at p t <0.05(*) ETP= evapotranspiration per plant
Dependent
variable
(Y)
Ѱ
(MPa) pH
gs*
(mol m-2
s-1
)
LSC*
(Kg s-1
m-2
MPa-1
)
PLC*
(%)
Model Y=covariable+clone+wt+clone*wt+error
Source of
variation
r2 0.48 0.46 0.62 0.35 0.116
MODEL MS 0.169 0.1815 0.3514 4.77E-08 2265.8
ERROR MSE 0.028 0.0333 0.0346 1.73E-08 226.58
p-value <.0001 <.0001 <.0001 0.0083 0.6003
FACTORS
cov= DPV
MSE 1.3929 1.495 3.096 9.02E-08 26.89
p-value <.0001 <0.0001 <0.0001 0.0265 0.7545
Clone (αi)
MSE 0.0065 0.026 0.108 6.72E-08 279.46
p-value 0.9209 0.5427 0.021 0.0077 0.4012
Watering (wt)
MSE 0.3784 0.006 0.223 9.27E-08 71.25
p-value 0.0005 0.6733 0.0135 0.0246 0.6109
Clone*wt
MSE 0.0328 0.024 0.002 7.48E-09 247.66
p-value 0.3364 0.5832 0.9935 0.7841 0.4644
Clone/watering treatment Adjusted means
C14 -1.328±0.045 a 6.59±0.048a 0.338±0.051b (35.18±3.67)E-05ab 70.94±4.39a
OD -1.333±0.042 a 6.54±0.046a 0.501±0.047ab (40.18±3.85) E-05a 65.90±3.94a
PI -1.352±0.045 a 6.64±0.049a 0.414±0.050ab (40.91±3.66) E-05a 67.64±4.24a
SA -1.322±0.042 a 6.61±0.045a 0.515±0.046ab (23.75±3.54) E-05b 77.76±3.93a
T
-1.293±0.043 a 6.56±0.047a 0.559±0.048a (29.93±3.98) E-05ab 70.29±4.05a
R1 -1.253±0.027a 6.58±0.030a 0.522±0.030a (37.93 ±2.4)E-05a 70.34±2.55a
R2 -1.398±0.028b 6.59±0.030a 0.409±0.032b (30.05±2.4) E-05b 70.67±2.66a
Adjusted means * ( )Yadjusti Yi Xi X where Yi is the dependent variable mean of the ith treatment , Xi is the covariate mean
of the ith-treatment, and X is the covariate overall mean value. β is a weighted average of the slopes of the linear regressions for all
treatment groups
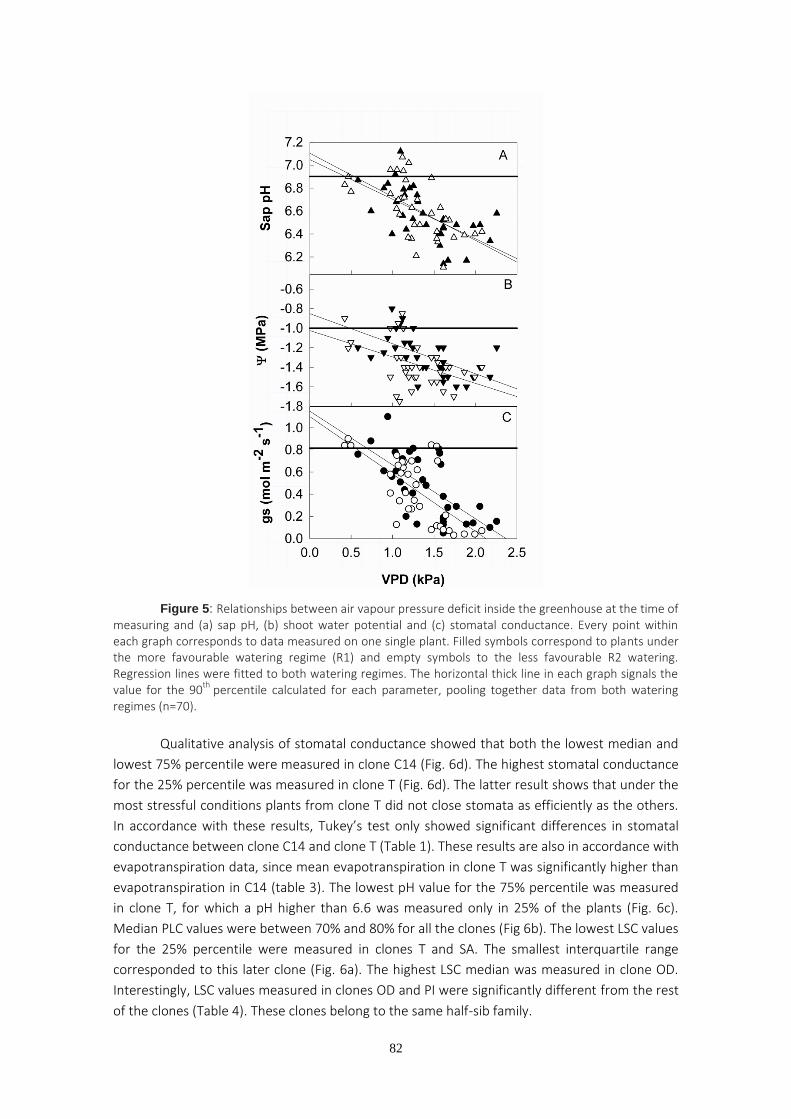
82
Figure 5: Relationships between air vapour pressure deficit inside the greenhouse at the time of measuring and (a) sap pH, (b) shoot water potential and (c) stomatal conductance. Every point within each graph corresponds to data measured on one single plant. Filled symbols correspond to plants under the more favourable watering regime (R1) and empty symbols to the less favourable R2 watering. Regression lines were fitted to both watering regimes. The horizontal thick line in each graph signals the value for the 90
th percentile calculated for each parameter, pooling together data from both watering
regimes (n=70).
Qualitative analysis of stomatal conductance showed that both the lowest median and
lowest 75% percentile were measured in clone C14 (Fig. 6d). The highest stomatal conductance
for the 25% percentile was measured in clone T (Fig. 6d). The latter result shows that under the
most stressful conditions plants from clone T did not close stomata as efficiently as the others.
In accordance with these results, Tukey’s test only showed significant differences in stomatal
conductance between clone C14 and clone T (Table 1). These results are also in accordance with
evapotranspiration data, since mean evapotranspiration in clone T was significantly higher than
evapotranspiration in C14 (table 3). The lowest pH value for the 75% percentile was measured
in clone T, for which a pH higher than 6.6 was measured only in 25% of the plants (Fig. 6c).
Median PLC values were between 70% and 80% for all the clones (Fig 6b). The lowest LSC values
for the 25% percentile were measured in clones T and SA. The smallest interquartile range
corresponded to this later clone (Fig. 6a). The highest LSC median was measured in clone OD.
Interestingly, LSC values measured in clones OD and PI were significantly different from the rest
of the clones (Table 4). These clones belong to the same half-sib family.
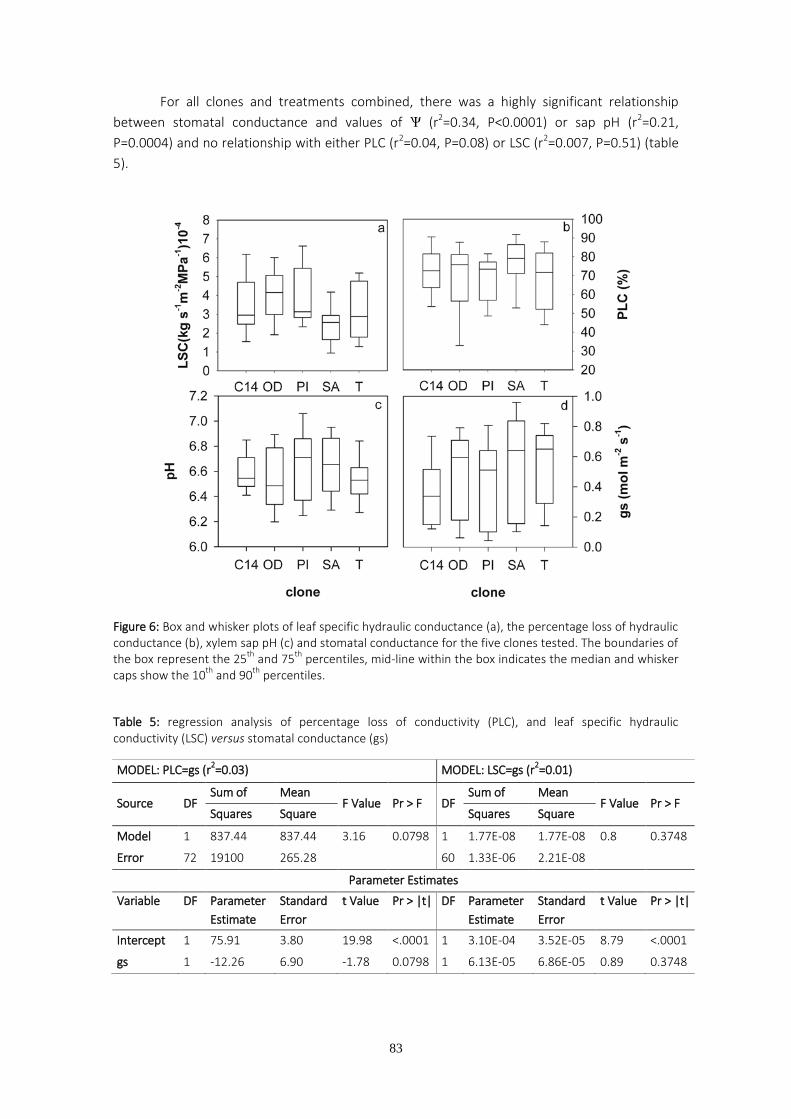
83
For all clones and treatments combined, there was a highly significant relationship
between stomatal conductance and values of Ѱ (r2=0.34, P<0.0001) or sap pH (r2=0.21,
P=0.0004) and no relationship with either PLC (r2=0.04, P=0.08) or LSC (r2=0.007, P=0.51) (table
5).
Figure 6: Box and whisker plots of leaf specific hydraulic conductance (a), the percentage loss of hydraulic conductance (b), xylem sap pH (c) and stomatal conductance for the five clones tested. The boundaries of the box represent the 25
th and 75
th percentiles, mid-line within the box indicates the median and whisker
caps show the 10th
and 90th
percentiles.
Table 5: regression analysis of percentage loss of conductivity (PLC), and leaf specific hydraulic conductivity (LSC) versus stomatal conductance (gs)
MODEL: PLC=gs (r2=0.03) MODEL: LSC=gs (r
2=0.01)
Source DF Sum of Mean
F Value Pr > F DF Sum of Mean
F Value Pr > F Squares Square Squares Square
Model 1 837.44 837.44 3.16 0.0798 1 1.77E-08 1.77E-08 0.8 0.3748
Error 72 19100 265.28 60 1.33E-06 2.21E-08
Parameter Estimates
Variable DF Parameter
Estimate
Standard
Error
t Value Pr > |t| DF Parameter
Estimate
Standard
Error
t Value Pr > |t|
Intercept 1 75.91 3.80 19.98 <.0001 1 3.10E-04 3.52E-05 8.79 <.0001
gs 1 -12.26 6.90 -1.78 0.0798 1 6.13E-05 6.86E-05 0.89 0.3748
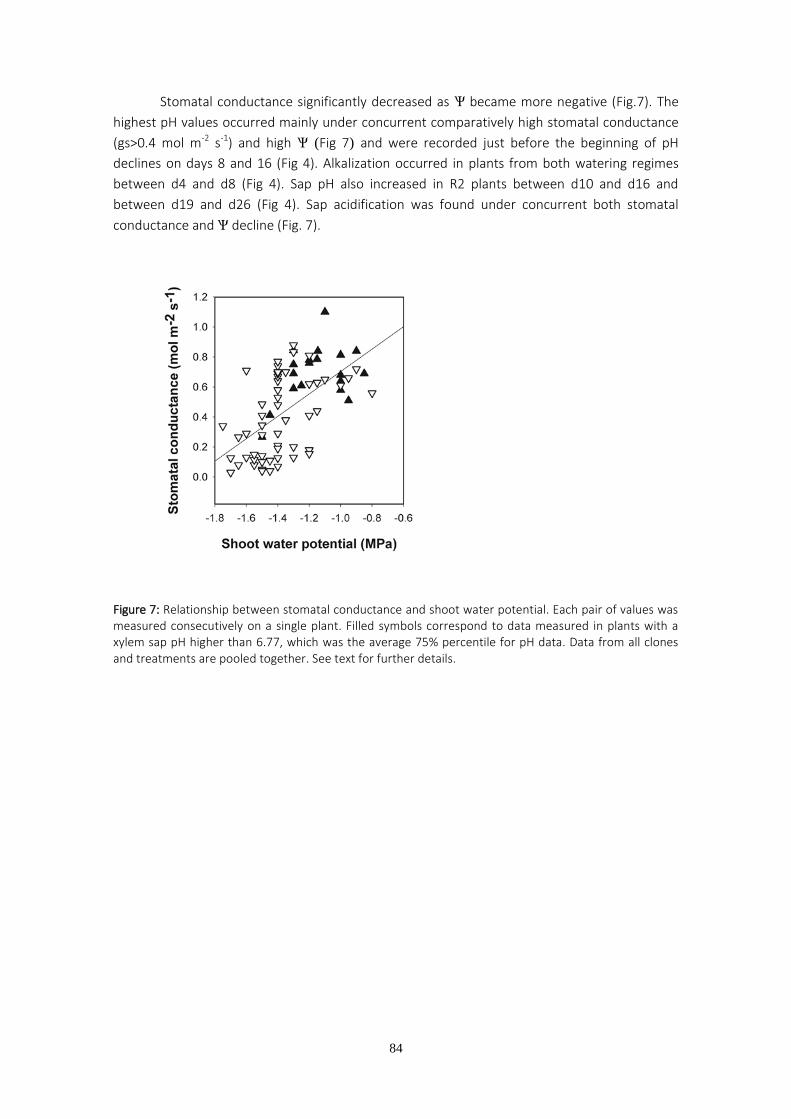
84
Stomatal conductance significantly decreased as Ѱ became more negative (Fig.7). The
highest pH values occurred mainly under concurrent comparatively high stomatal conductance
(gs>0.4 mol m-2 s-1) and high Ѱ (Fig 7) and were recorded just before the beginning of pH
declines on days 8 and 16 (Fig 4). Alkalization occurred in plants from both watering regimes
between d4 and d8 (Fig 4). Sap pH also increased in R2 plants between d10 and d16 and
between d19 and d26 (Fig 4). Sap acidification was found under concurrent both stomatal
conductance and Ѱ decline (Fig. 7).
Figure 7: Relationship between stomatal conductance and shoot water potential. Each pair of values was measured consecutively on a single plant. Filled symbols correspond to data measured in plants with a xylem sap pH higher than 6.77, which was the average 75% percentile for pH data. Data from all clones and treatments are pooled together. See text for further details.
85
DISCUSSION
STOMATAL CONDUCTANCE AND HYDRAULIC CONDUCTANCE OF THE STEM
High values of stomatal conductance, such as those measured in the present study
(Fig. 5) have been associated with low water-use efficiency in fast-growing pioneer species
(Pearce et al. 2005) and may be advantageous to compete for available soil water. The
adaptive advantage of comparatively high stomatal conductance for eucalypt plantations will
depend on the ability to keep a tight control of stomata, in order to avoid a catastrophic xylem
failure. Previous studies have reported high values of native embolism in this (Pita et al. 2003)
and other woody species. For example, a PLC as high as 76.7% was measured in less than two-
year old twigs from field grown Eucalyptus crebra and Eucalyptus xanthoclada (Rice et al.
2004). Native root xylem embolism was found to increase in Pinus ponderosa from 45% to
75% as the dry season progressed (Domec et al. 2004). In a recent study Trifilò et al. (2014)
concluded that PLC values as high as 50-60% were still compatible with a relatively high
stomatal conductance in Ceratonia siliqua, Laurus nobilis and Olea europea trees. It has been
suggested that the formation of embolism may be common in some woody species (Tyree and
Sperry 1988) and may even have some positive side effects, such as increasing the hydraulic
capacitance (Vergeynst et al 2014). Though common occurrence of xylem cavitation remains
controversial (Cochard and Delzon 2013), the differences in stomatal regulation between
coexisting ferns and angiosperms reported by Brodribb and Holbrook (2004) suggest that the
evolution of a more specialized stomatal physiology may allow gas exchange to be maximized
by forcing the xylem to achieve its highest flow rate, in a riskier but more successful water-use
strategy (Sperry 2004). Tolerance of a certain degree of embolism may depend, although not
exclusively, on the ability of some species to refill embolized vessels (Trifilò et al. 2014). The
suggestion that the hydraulic conductance of the stem is overbuilt (Sterck et al 2011) must be
taken into consideration. In addition, growth of xylem tissue may allow a significant recovery
of lost hydraulic function in some tree species (Urli et al. 2013). Furthermore, tree species
such as Populus tremula or Quercus robur may lose all their leaves when reaching a PLC
higher than 80%, but still be capable of resprouting after watering (Urli et al 2013). Therefore,
not only the loss of hydraulic conductance but also the amount of remaining hydraulic
conductance must be considered when analyzing stem hydraulic constraints to gas exchange.
Leaf specific hydraulic conductance (LSC) is a measure of the hydraulic sufficiency of
the stem to supply water to the leaves (Tyree and Zimmmermann 2002). Values of LSC may
vary between plants showing similar PLC values, due to differences in the maximum hydraulic
conductance, which is strongly dependent on vessel size (Tyree and Zimmmermann 2002) or
differences in the surface of leaves fed by the stem. This was the case for plants belonging to
different watering regimes in the present study. Although water shortage significantly
decreased LSC, it had no significant effect on PLC. Decreases in LSC under drought conditions
have been previously reported in other tree species (Domec et al. 2009, Sellin et al. 2014) and
are considered a plastic response to water stress that may compromise water use, and
therefore growth, even after the water supply is restored (Eamus et al. 2000). The effect of
decreasing LSC on growth was inconclusive in our study, since both LSC and growth decreased
in R2 in relation to R1 plants but the significant effect of the clone on LSC values did not result
in significant differences in growth between clones.
86
We found no significant relationship between values of stomatal conductance and
either PLC or LSC. Moreover, values of stomatal conductance as high as 0.81mol m-2 s-1 were
measured in plants with a PLC close to 80% in the present study (Fig.4). These results suggest
that loss of hydraulic conductance had scarce effect on limiting stomatal conductance under
our experimental conditions. On the other hand, stomata closure precluded shoot water
potential to drop below -1.8MPa (Fig 5) while average PLC remained below 80% throughout the
experiment (Fig 4). Therefore, stomata closure does not seem to be a consequence of
decreases in hydraulic conductance as previously documented in other species (Hubbard et al.
2001, Ocheltree et al. 2013), but rather, is an attempt to prevent stem hydraulic conductance
from decreasing any further. In accordance with these results, Urli et al. (2013) found that the
embolism threshold leading to irreversible drought damage was close to 88% in five angiosperm
tree species. Moreover, it was found that four out of the five tree species reached water
potentials close to their minimum recoverable potential under drought conditions.
XYLEM SAP PH
Water shortage reduced shoot growth, water potential, stomatal conductance and LSC,
but had no significant effect on sap pH. Under our experimental conditions, the values for xylem
sap pH ranged from 6.1 to 7. These values are similar to those reported for Populus deltoides
(Aubrey et al. 2011) and Populus nigra (Secchi et al. 2012) but are higher than those measured
in stems of field grown E. globulus by Cerasoli et al (2009). Despite this wide range of values, we
found no significant variation in xylem sap pH between watering regimes. This result suggests
that the variation in sap pH did not act as a mechanism of root to shoot signalling of soil water
deficit under our experimental conditions. This is particularly interesting given the short size of
the plants used, since the effect of path length on signal transmission is negligible in seedlings
compared to tall trees.
Changes in sap pH can be triggered by environmental conditions that stimulate
transpiration, such as VPD (Chaves and Oliveira 2004). In a recent study, Aubrey et al (2011)
observed that xylem sap pH derived from stems and twigs of Populus deltoides L. increased
when VPD was lowest, and concluded that sap pH may increase under environmental conditions
that result in low transpiration rates. In eucalyptus we found a negative correlation between
sap pH and VPD (Fig.5), and measured the highest values of sap pH in plants that showed no
strong stomatal limitations to transpiration.
Whereas xylem sap alkalization has been reported as a common effect of several kinds
of stress, the response pattern of stomatal conductance to elevated xylem pH remains unclear.
Sharp and Davies (2009) showed that increasing sap pH was not a universal response to water
stress; they tested 22 perennial species and found concurrent sap alkalization and stomatal
closure in 4 cases, acidification in 4 cases and no correlation between sap pH and stomatal
conductance in the rest of the species. Secchi et al. (2012) observed that severe water stress
resulted in a sudden drop of xylem sap pH in Populus nigra that could be linked to the chemistry
of the energy demanding refilling process in which proton pumps are involved (De Boer &
Volkov 2003). In accordance with this, we measured a decrease of about 0.4 pH units from d16
to d19 (Fig 4). After the pH decline, alkalization occurred (Fig 4). This alkalization may be the
natural recovery of sap pH level once the process that yields protons ceases. In fact PLC
87
decreased on day 26 for R2 plants. The values of sap pH found were high enough to allow the
anionic form of abscisic acid to reach the leaf apoplast in a percentage higher than 50% without
being trapped in the symplast (Wilkinson & Davies 98, Boursiac et al. 2013).
The lowest values of stomatal conductance were measured on d19 in plants from both
watering regimes, which indicates that plants measured on d19 were suffering a high level of
water stress according to Medrano et al. (2002). Stem sap alkalization occurred mainly under
concurrent high stomatal conductances and high Ѱ under our experimental conditions (Fig 7).
Interestingly, sap pH values in the 90th percentile were measured at VPD ranging from 0.97 to
1.2 kPa, whereas the VPD range for stomatal conductance values in the 90th percentile was 0.42
to 1.53 kPa (Fig 5). These results suggest that sap alkalization may have preceded stomata
closure in response to increasing VPD.
Unfortunately, it is not possible to confirm whether mid-morning sap alkalization in the
stem could have resulted in stomata closure at midday or in the afternoon. Therefore, the role
of stem sap pH in stomata regulation in the species awaits further research.
CLONAL EFFECTS
Since there were no significant differences in evapotranspiration at the beginning, the
differences found for the whole period of time reflect the combined effect of the increase in
leaf area and variations in stomatal conductance between plants belonging to different
watering regimes or clones. In accordance with these results, we found a significant clone effect
for stomatal conductance (Table 4). The lowest evapotranspiration rate was measured under
the more favourable watering regime in the F0 clone (C14) (Table 3, Fig.3). Stomatal
conductance was also lowest in this clone (Fig.6). Therefore, F1 clones were able to profit from
extra soil water to a greater extent than the F0 clone.
The highest rate of evapotranspiration was measured in clone T under the less
favourable R2 treatment (Table 3). Accordingly, values of stomatal conductance measured
under the most stressful conditions were higher in clone T than in the rest of the clones (Table
4). These results can contribute to explain why clone T was severely affected by the exceptional
drought of 2005, particularly if we consider that the lowest values of LSC were measured in
clones T and SA (Fig. 6a). In a previous study, Vilagrosa et al. (2003) suggested the existence of a
LSC threshold for early leaf shedding. This is a common response to drought in E. globulus
plantations established in SW Spain. It is also a costly response in terms of growth and
productivity. Early leaf shedding can also be considered the last line of plant defense against the
effects of drought. Clones with a low LSC seem therefore less capable of achieving a reasonable
growth and survival under Mediterranean climates. This seems particulary relevant under a
climate change scenario with a predicted increase in extreme meterological events.
In conclusion: Changes in xylem sap did not show a clear relationship with soil water
status, contrary to our first hypothesis, but sap pH decreased significantly as VPD increased, in
agreement with our second hypothesis. Stomata closed after a considerable amount of
hydraulic conductance was lost, although the clone effect for leaf specific hydraulic
conductance was significant, suggesting the possibility of selection for improved productivity
under water limiting conditions combined with high temperatures in the early stages of growth.
88
REFERENCES
Aemet (2005) Año hidrometeorológico. Siete meses de extrema sequía. Spanish Meteorological
Agency Web. http://www.aemet.es./es/noticias/2005/2005/0905, Accesed April 1, 2015 .
Alves G, Ameglio T, Guilliot A, Fleurat-Lessard P, Lacointe A, Sakr S, Petel G, Julien JL (2004)
Winter variation in xylem sap pH of walnut trees: involvement of plasma membrane H+-ATPase
of vessel-associated cells. Tree Physiol 24, 99-105
Aubrey DP, Boyles JG, Krynsky LS, Teskey RO (2011) Spatial and temporal patterns of xylem sap
pH derived from stems and twigs of Populus deltoides L. Environ Exp Bot 71, 376-381
Boursiac Y, Léran S, Corratgé-Faillie C, Gojon A, Krouk G, Lacombe B.(2013). ABA transport and transporters. Trends Plant Sci. 18, 325–333
Brodribb TJ, Holbrook NM (2004) Stomatal protection against hydraulic failure: a comparison of
coexisting ferns and angiosperms. New Phytol 162, 663-670
Cerasoli S, McGuire MA, Faria J, Mourato M, Schimidt M, Pereira JS, Chaves MM, Teskey RO
(2009) CO2 efflux, CO2 concentration and photosynthetic refixation in stems of Eucalyptus
globulus (Labill.). J Exp Bot 60, 99-105
Chaves MM, Oliveira MM (2004) Mechanisms underlying plant resilience to water deficits:
prospects for water-saving agriculture. J Exp Bot 55, 2365-2384.
Cochard H, Delzon S (2013) Hydraulic failure and repair are not routine in trees. Ann For Sci 70,
659-661
Cochard H, Coll L, Le Roux X, Ameglio T (2002) Unravelling the effects of plant hydraulics on
stomatal closure during water stress in walnut. Plant Physiol 128, 282-290
Damour G., Simonneau T, Cochard H, Urban L. (2010) An overview of models of stomatal
conductance at the leaf level. Plant, Cell and Environment 33, 1419-1438
Davies, W. J. & Zhang, J. (1991) Root signals and the regulation of growth and development of
plants in drying soil. Ann. Rev. Plant.Physiol. Plant. Mol. Biol. 42, 55–76
Dodd IC, Tan LP, He J (2003) Do increases in xylem sap pH and/or ABA concentration medayte
stomatal closure following nitrate deprivation? J Exp Bot 54, 1281-1288
Dodd IC (2005) Root-to-shoot signalling: Assessing the roles of “up” in the up and down world of
long-distance signalling in planta. Plant Soil 274, 251-270
Domec J-C, Warren JM, Meinzer FC, Brooks JR, Coulombe R (2004) Native root xylem embolism
and stomatal closure in stands of Douglasa fir and ponderosa pine: mitigation by hydraulic
redistribution. Oecologia 141, 7-16
89
Domec J-C, Noormets A, King JS, Sun G, McNulty SG, Gavazzi MJ, Boggs JL, Treasure EA (2009)
Decoupling the influence of leaf and root hydraulic conductances on stomatal conductance and
its sensitivity to vapour pressure deficit as soil dries in a loblolly pine plantation. Plant Cell Enviro
32, 980-991
Eamus D, O’Grady AP, Hutley L (2000) Dry season conditions determine wet season water use in
the wet-dry tropical savannas of northern Australia. Tree Phys 20, 1219-1226
Grossnickle SC, Russell JH (2010) Physiological variation among western red cedar (Thuja plicata
Donn ex D. Don) populations in response to short-term drought. Ann For Sci 67, 506-517.
doi10.1051/forest/2010008
Heilmeier H, Schulze ED, Fan J, Hartung W (2007) General relations of stomatal responses to
xylem sap abscisic acid under stress in the rooting zone- A global perspective. Flora 202, 624-
636.
Hubbard RM, Ryan MG, Stiller V, Sperry JS (2001) Stomatal conductance and photosynthesis
vary linearly with plant hydraulic conductance in ponderosa pine. Plant Cell Environ 24, 113-121
Jones HG, Sutherland RA (1991). Stomatal control of xylem embolism. Plant Cell Environ 14,
607-612
Manzoni S, Vico G, Katul G, Palmroth S, Jackson RB, Porporato A (2013). Hydraulic limits on
maximum plant transpiration and the emergence of the safety-efficiency trade-off. New Phytol
198: 169-178
Matzner SL, Rice KJ, Richards JH (2003) Patterns of stomatal conductance among blue oak
(Quercus douglasii) size classes and populations: implications for seedling establishment. Tree
Physiol 23, 777-784.
Mediavilla S, Escudero A (2003) Mature trees versus seedlings: Differences in leaf traits and gas
exchange patterns in three co-occurring Mediterranean oaks. Ann For Sci 60, 455-460
Medrano H, Escalona JM, Bota J, Gulías J, Flexas J (2002) Regulation of photosynthesis of C3
plants in response to progressive drought: stomatal conductance as a reference parameter. Ann
Bot 89, 895-905
Meinzer FC, Johnson DM, Lachenbruch B, McCulloh KA, Woodruff DR (2009) Xylem hydraulic
safety margins in woody plants: coordination of stomatal control of xylem tension with
hydraulic capacitance. Funct Ecol 23, 922-930
Nardini A & Salleo S. Limitation of stomatal conductance by hydraulic traits: sensing or
preventing xylem cavitation? Trees 15, 14–24 (2000)
90
Nobel PS (2009) Physicochemical and environmental plant physiology. Elsevier, Oxford
Ocheltree TW Nippert JB, Prasad PVV (2013) Stomatal response to changes in vapor pressure
deficit reflect tissue-specific differences in hydraulic conductance. Plant Cell Environ doi:
10.1111/pce.12137
Pearce DW, Millard S, Bray DF, Rood SB (2005) Stomatal characteristic of riparian poplar species
in a semi-arid environment. Tree Phys 26, 211-218
Pita P, Soria F, Cañas I, Toval G, Pardos JA (2001a) Carbon isotope discrimination and its
relationship to drought resistance under field conditions in genotypes of Eucalyptus globulus
Labill. For Ecol Manage 141, 211-221
Pita P, Pardos JA (2001b) Growth, leaf morphology, water use and tissue water relations of
Eucalyptus globulus clones in response to water deficit. Tree Phys 21, 599-607
Pita P, Gascó A, Pardos JA (2003) Xylem cavitation and leaf water potential in Eucalyptus
globulus clones under well-watered and drought conditions. Funct Plant Biol 30:891-899
Struct Funct. 21, 371-378
Rice KJ, Matzner SL, Byer W, Brown JR (2004) Patterns of tree dieback in Queensland, Australia:
the importance of drought stress and the role of resistance to cavitation. Oecologia 139, 190-
198
Ripullone F, Guerrieri MR, Nole A, Magnani F, Borghetti M (2007) Stomatal conductance and
leaf water potential responses to hydraulic conductance variation in Pinus pinaster seedlings.
Tree
Rodrigues ML, Santos TP, Rodrigues AP, de Souza CR, Lopes CM, Maroco JP, Pereira JS, Chaves
MM (2008). Hydraulic and chemical signalling in the regulation of stomatal conductance and
plant water use in field grapevines growing under deficit irrigation. Funct Plant Biol 35, 565-579
Secchi F, Zwieniecki MA (2012) Analysis of xylem sap from functional (non-embolized) and non-
functional vessels of Populus nigra- chemistry of refilling. Plant Physiol
doi:10.1104/pp.112.200824
SAS 9.2. STAT. Users guide SAS Institute, Cary, NC
Selling A, Niglas A, Öunapuu-Pikas E, Kupper P (2014) Rapid and long-term effects of water
deficit on gas exchange and hydraulic conductance of silver birch trees grown under varying
atmospheric humidity. BMC Plant Biol 14:72, doi:10.1186/1471-2229-14-72
Seltman H. Experimental design and analysis (2015) Chapter 10 http://www.stat.cmu.edu/∼
hseltman/309/Book/Book.pdf
91
Sharp RG, Davies WJ (2009) Variability among species in the apoplastic pH signalling response to
drying soils. J Exp Bot 60, 4363-4370
Sobeih WY, Dodd IC, Bacon MA, Grierson D, Davies WJ (2004) Long-distance signals regulating
stomatal conductance and leaf growth in tomato (Lycopersicon esculentum) plants subjected to
partial root- zone drying. J Exp Bot 55, 2353-2363
Sperry JS (2004) Coordinating stomatal and xylem functioning-an evolutionary perspective. New
Phytol 162, 568-570
Sterck F, Markesteijn L, Schieving F, Poorter L (2011) Functional traits determine trade-offs and
niches in a tropical forest community. PNAS 108 (51), 20627-20632
Tombesi S., Nardini A., Frioni T, Soccolini M, Zadra C, Farinelli D, Poni S, Palliotti A. (2015).
Stomatal closure is induced by hydraulic signals and maintained by ABA in drought-stressed
grapevine. Scientific Reports 5, Article number:12449. doi:10.1038/srep12449
Trifilò P, Barbera PM, Raimondo F, Nardini A, LoGullo MA (2013) Coping with drought-induced xylem cavitation: coordination of embolism repair and ionic effects in three Mediterranean evergreens. Tree Phys 00, 1-14 doi:10.1093/treephys/tpt119
Tyree MT, Sperry SJ (1988) Do woody plants operate near the point of catastrophic xylem
dysfunction caused by dynamic water stress? Plant Physiol 88, 574-580
Tyree MT, Zimmermann MH (2002) Xylem structure and the ascent of sap. Springer-Verlag,
Berlin, Heidelberg
Urli M, Portè AJ, Cochard H, Guengant Y, Burlett R, Delzon S (2013) Xylem embolism threshold
for catastrophic hydraulic failure in angiosperm trees. Tree Phys 33, 672-683
doi:10.1093/treephys/tpt030
Vergeynst LL, Dierick M, Bogaers J, Cnudde V, Steppe K (2014) Cavitation: a blessing in disguise?
New method to establish vulnerability curves and assess hydraulic capacitance of woody tissues.
Tree Physiology doi:10.1093/treephys/tpu056
Vilagrosa A, Bellot J, Vallejo R, Gil-Pelegrin E (2003) Cavitation, stomatal conductance and leaf
dieback in seedlings of two co-occurring Mediterranean shrubs during an intense drought. J Exp
Bot 54, 2015-2024
Wan X, Landhäusser SM, Zwiazek JJ, Lieffers VJ (2004) Stomatal conductance and xylem sap
properties of aspen (Populus tremuloides) in response to low soil temperature. Physiol Plant
122, 79-85
Wilkinson S, Davies WJ. 1997. Xylem sap pH increase: a drought signal received at the apoplastic
face of the guard cell which involves saturable ABA uptake by the epidermal symplast. Plant
Physiology 113, 559–573.

92
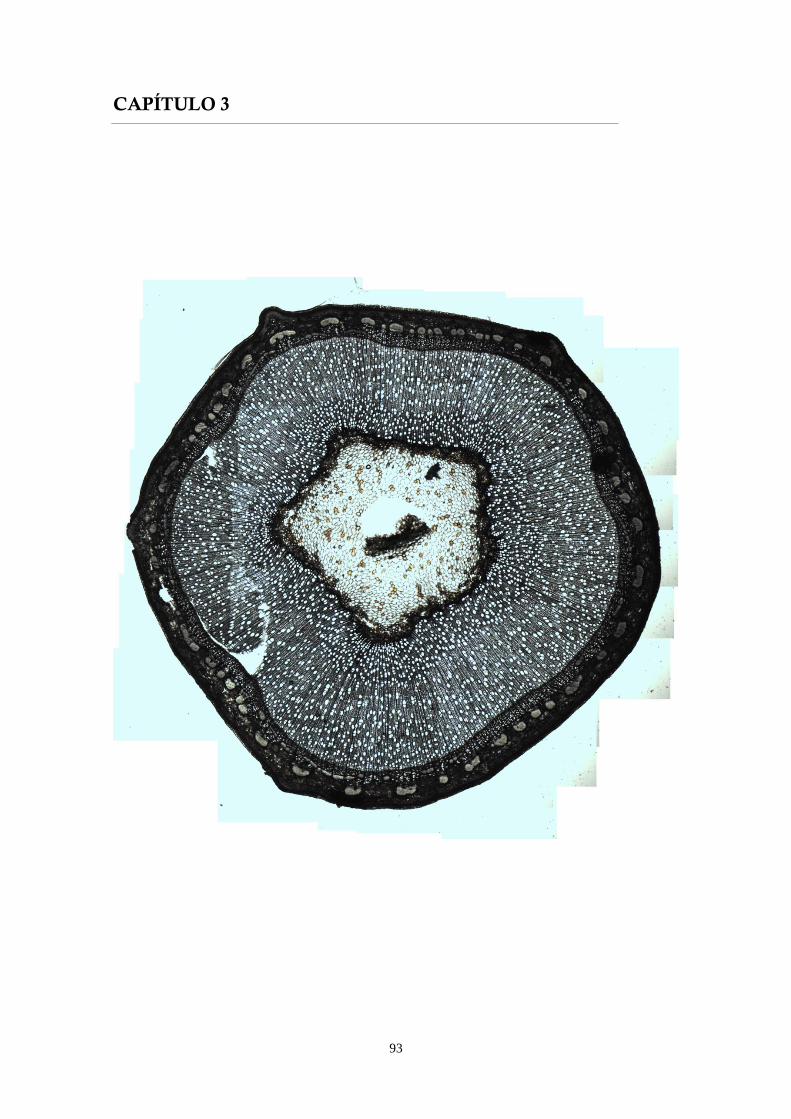
93
CAPÍTULO 3

94
95
CAPÍTULO 3
GROWTH, VULNERABILITY TO CAVITATION AND ANATOMICAL TRAITS OF FOUR HYBRID POPLAR CLONES USED AS SHORT ROTATION ENERGY CROPS IN SPAIN
RESUMEN
En 2005 se creó la Red de Parcelas de Cultivos Leñosos en Alta Densidad y Turno
Corto, con el objeto de evaluar la viabilidad de cultivos intensivos de alta densidad y turno
corto con fines energéticos en localidades con clima mediterráneo. Entender las respuestas de
una selección de genotipos híbridos de chopo al estrés hídrico tiene interés para ayudar a los
propietarios de plantaciones de este tipo a seleccionar los mejores clones en términos de
producción y resistencia a la sequía.
La conductividad hidráulica máxima es la máxima capacidad que tiene la planta de
transportar agua a través del tallo y está relacionada con el crecimiento. La conductancia
hidráulica puede limitar el crecimiento imponiendo límites físicos al transporte de agua y por
ende a la transpiración y a la fotosíntesis.
Con el objeto de investigar si las diferencias de producción encontradas entre clones
pueden explicarse a partir de diferencias anatómicas en el xilema, se midieron una serie de
variables de crecimiento y anatómicas en cuatro genotipos híbridos de chopo en una parcela
de demostración de la producción de cuatro hectáreas situada en Granada, en el sur de
España. La plantación de Granada sufrió restricciones hídricas y no fue regada en dos meses.
En Madrid se instaló un ensayo con los mismos cuatro clones sometidos a dos
regímenes de riego para construir las curvas de vulnerabilidad empleando dos métodos:
centrífuga y deshidratación.
Los cuatro clones presentaron diferencias en sus características xilemáticas. Los clones
más productivos presentaron un mayor número de vasos de tamaño intermedio. Esta
combinación de elementos xilemáticos parece haber optimizado la eficiencia conductiva y la
seguridad. Monviso, uno de los clones que alcanzó mayores producciones, emitió el mayor
número de ramas silépticas. Los clones menos productivos fueron Pegaso, que exhibió la
menor superficie conductora, y el clon I-214 con el menor número de ramas silépticas y el
mayor valor para el ratio entre área media del vaso y densidad de vasos.
Las curvas de vulnerabilidad construidas a partir de muestras centrifugadas no
presentaron diferencias significativas entre clones, mientras que sí las presentaron las curvas
generadas mediante el método de deshidratación. Las curvas correspondientes a las plantas
regadas mostraron una vulnerabilidad (P50) significativamente mayor que las de las plantas
estresadas. Los clones que acumularon más biomasa figuraron entre los más resistentes a la
cavitación, lo que sugiere que existe la posibilidad de conseguir mejorar la producción
mediante selección clonal en ambientes con episodios de sequía.

96
La vulnerabilidad a la cavitación de los clones ensayados ha presentado diferentes
grados de plasticidad. El clon I-214 fue el más plástico. Las plantas de este clon sometidas a
estrés fueron las más vulnerables, mientras que las estresadas mostraron la mayor resistencia.
97
GROWTH, VULNERABILITY TO CAVITATION AND ANATOMICAL TRAITS OF FOUR HYBRID
POPLAR CLONES USED AS SHORT ROTATION ENERGY CROPS IN SPAIN
HERNÁNDEZ GARASA M.J.1, SIXTO BLANCO H1.,CAÑELLAS REY DE VIÑAS I.1, PITA ANDREU P.2,
(1) CIFOR-INIA, Ctra de la Coruña km 7.5, 28040 Madrid, Spain.
(2) E.T.S.I. Montes, Universidad Politécnica de Madrid. Ciudad Universitaria s/n. 28040 Madrid, Spain.
ABSTRACT
In 2005, a network of experimental short-rotation Poplar plots was established across
Spain in order to assess the viability of this type of crops in Mediterranean environments.
Understanding the responses to water stress in certain poplar genotypes used for short
rotation forestry is of particular interest to help tree breeders select the most suitable
genotypes in terms of yield and drought resistance.
Maximum hydraulic conductivity in a plant stem implies maximum water
transportation capacity through the stem and is related to growth. Hydraulic conductance
may constrain plant growth by imposing physical limits to water transport and therefore
transpiration and photosynthesis.
In order to investigate the extent to which differences in yield between poplar clones
can be explained by differences in xylem anatomy, xylem anatomical traits and growth
variables were measured in four poplar clones in a four hectare demonstration trial in the
South of Spain (Granada), where plants had experienced a severe summer drought. With the
aim of detecting possible vulnerability to cavitation differences between clones, an
experimental trial was established in Madrid, testing the same four poplar clones previously
tested in Granada but with two contrasting water regimes. This trial provided samples for
building vulnerability curves for both centrifuge and dehydration methods
Anatomical differences were found between clones growing under drought
conditions. The clones with the highest biomass yield, Monviso and AF2, had a higher number
of intermediate size vessels. This anatomical combination of xylem elements (number and
vessel area) seems to optimize efficiency and safety in the more productive clones. Monviso,
one of the highest yielding clones, developed the largest number of sylleptic branches. In
contrast, the clones with the lowest yield displayed the smallest conducting area, in the case
of Pegaso, and the highest AD-ratio along with the lowest number of sylleptic branches in the
case of I-214.
Centrifuge based vulnerability curves did not reveal significant differences between
clones, whereas the bench dehydration method did. Results from the dehydration method
showed significantly higher vulnerability (P50) for well-watered plants than for plants subjected
to water stress. The clones which displayed the highest biomass yield were among the most
cavitation resistant, which suggests that through appropriate clone selection yields could be
improved in drought-prone environments.
98
Different clones showed different degrees of plasticity as regards vulnerability to
cavitation when submitted to different watering regimes. Clone I-214 showed the greatest
plasticity for P50, being the most vulnerable clone under the well-watered regime and the
most resistant under drought conditions.
INTRODUCTION
The European Union (EU) energy policy has to address a number of challenges such as
greenhouse gas emissions, which should be reduced by more than 80% by 2050, and the
dependency on imported energy source (UE 2012 Energy Roadmap 2050). Two essential
elements of the EU energy policy are the increase in reliance on renewable energy and the
diversification of energy sources. As a renewable energy source, biomass provides an
interesting alternative due to the null carbon balance resulting from its production and use as
well as the opportunity to use abandoned agricultural land (Sixto et al. 2010).
Short rotation poplar crops are widespread throughout Europe both for biomass
production and research purposes. However, most of the existing plantations are used for
experimental purposes, with the exceptions of the UK, Sweden, and Italy (Eppler U& Petersen
J.E. 2007). Poplar trees of the gender Populus are among the fastest growing temperate trees,
consistent with their role as vegetational pioneers (Eckenwalder 1996). Besides their fast
growth, it is known that poplars are very drought sensitive trees (Cochard et al. 2007). In
Mediterranean environments, where drought lasts at least 2 months, it is necessary to irrigate
short rotation crops. Maintaining irrigation in large areas can be problematic and water
restrictions may be imposed due to drought. As a result, low irrigation doses could lead to
high stress and even death of the poplar plantation.
In 2005, a network of experimental short-rotation Poplar plots was established across
Spain in order to assess the viability of this type of crop on irrigated land in Mediterranean
environments. Understanding the responses to water stress in certain poplar genotypes used
for short rotation forestry is of particular interest to help tree breeders select the most
suitable genotypes in terms of yield and drought resistance.
Given that xylem hydraulic conductivity can limit plant productivity (Manzoni 2013)
and even cause plant death (Barigah et al. 2013), it is particularly important in drought prone
environments to choose genotypes capable of withstanding drought events. When xylem is
exposed to very high negative pressures, water is thought to be transported in a metastable
state, and cavitation occurs in some vessels due to the sudden change of state of sap to gas.
Air can then pass through the intervessel pit membrane pores from embolized vessels to
adjacent, intact vessels or through cracks in the vessel walls. This is known as the air seeding
hypothesis (Tyree and Zimmermann 2002).
Differences among species as regards cavitation resistance are partially explained by
the ‘rare pit’ hypothesis. This hypothesis suggests that cavitation resistance depends on the
leakiest pit of a vessel, such that the larger the pit vessel area the greater the probability of pit
failure (Wheeler et al. 2005, Christman et al. 2009). Recent studies (Lens et al. 2011, Plavcova
& Hacke 2013, Capron et al. 2014,) have shown the importance not only of the quantity of pits
and their probability of failure, but also the importance of quality. It is thought that the
99
membrane deflects as a result of the difference in pressure across vessels, and that pores
become larger by deformation. This was confirmed by Capron et al.(2014) who characterized
the microstructure of the vessel of poplar through optical, electronic transmission and atomic
force microscopy. The thickness, porosity, elasticity, and recovery capacity of the membrane
pit constituents should play a key role in the cavitation resistance of plants. Taking all this into
account, the cavitation resistance of a plant depends mainly on the quality and quantity of pits
rather than on the vessel diameter (Lens et al. 2011). However, a relationship may exist
between vessel diameter and both pit number and diameter or between vessel growth speed
and quality of pits. A number of authors such as Martinez-Vilalta et al. (2002), when
comparing several species, have obtained results which are consistent with a positive
relationship between vessel diameter and the extent of intervessel pitting. However, the
relationship between intervessel pitting and vessel size is not clear. Some authors have
reported either no correlation or only a very weak correlation between vessel diameter and
cavitation resistance in poplar (Cochard et al. 2007, Fichot et al. 2010) whereas others, in
contrast, have pointed to the existence of a relationship (Awad et al. 2010). The fact that no
correlation was found between vessel diameter and cavitation resistance could mean that
vessel diameter and pit properties are unrelated and therefore it should be possible find
clones with relatively high conductive efficiency which are both drought resistant and
potentially high yielding.
Vulnerability curves are an accepted tool for assessing the cavitation resistance of
plants, which is an intrinsic property of the xylem tissue (Fichot et al. 2015). Thus, vulnerability
curves indirectly provide information with regard to the intrinsic properties of xylem.
The plasticity of poplar species has been widely documented. Many authors have
found different phenotypic responses to different treatments. For example, Harvey & Van Den
Driessche (1996) found different pit pore diameters in plants submitted to different
phosphorus fertilization treatments while Plavcová et al. (2012) found differences in growth,
xylem anatomy and vulnerability to cavitation in plants submitted to different irrigation and
fertilization treatments. Plavcová et al. (2010) also reported differences in pit membrane and
middle compound lamella thickness between plants subjected to different irradiance
treatments and Fichot et al. (2010) found differences in cell size between plants subjected to
different irrigation regimes, etc. This plasticity contributes to the known genotype x
environment interaction, further complicating the choice of the most appropriate genotype
for each environment.
In this study, certain xylem traits, among them the vessel area, were studied in four
poplar clones, three of which were selected specifically for short rotation crops in Italy. The
fourth clone was I-214, commonly used in Spain and in the Mediterranean poplar sector. The
vulnerability curves of these clones were built using two methods: centrifuge and dehydration,
and the results were compared.
Bearing in mind the general aim which is to select the highest yielding clone capable of
withstanding the environmental conditions at each site, the main focus of this study was to
investigate the relationships between yield and both cavitation resistance and xylem anatomy
in four poplar clones. We hypothesized that (1) clones with larger vessels may not attain the
highest productivity under drought conditions, (2) that clones attaining the highest yield under
100
well-watered conditions would be more vulnerable to cavitation than low yielding clones,(3)
that under stress conditions the highest yielding clone may be one of the most cavitation
resistant clones.
MATERIALS AND METHODS
EXPERIMENTAL SITES, PLANT MATERIAL, TREATMENT IMPOSITION
A four-complete randomized block design, each of a hectare in size, was established in
Granada (37º 12´N; 3º 42´W) in March 2006. 20.000 unrooted cuttings per hectare of four
hybrid poplar clones were planted in rows 1m apart. The plantation was basin irrigated every
15 days in 2006. In January 2007 the plantation was cut back and multiple shoots resprouted
from the stumps in spring. Watering of the Granada crop was performed only twice in 2007, at
the end of June and at the beginning of September, due to water restrictions imposed by the
lack of rain during that year. The plants suffered an almost complete defoliation due to water
stress. In each block, a representative assessment plot of 4x4 plants was established per clone
and measurements were taken in January 2008 on one year old shoots.
The four hybrid poplar clones tested were: two Populus x euramericana clones AF2,
and I-214, and two Populus x interamericana x Populus nigra clones Monviso and Pegaso.
In the Spring of 2013, an experimental trial was established in Madrid in a nursery
field belonging to the CIFOR-INIA (40º 27’ N; 3º 45’W). Unrooted cuttings of the same four
poplar clones used in Granada were planted. The trial was 12x6 m in size, the plants being
distributed in 12 rows 1m apart, each row including 12 randomly placed plants (3 per clone)
with a spacing of 0.5m. In Madrid, 14l day-1 were applied to all plants by means of a drip
irrigation system. All the plants were fertilized in mid-June with the same amount (25 ml) of
NPK 21:8:11 (ENTEC®Nitrofoska®21 Eurochem agro) placed close to each plant next to the
drip line. In August, the first two water regimes were imposed in order to compare growth and
vulnerability curves between well-watered and stressed plants. Well-watered plants (The six
most northerly rows) were kept watered with 14l day-1, and the stressed plants were watered
with 14l every other day until August the 10th and after this date irrigation was suppressed.
Buds began to close in the last week of September.
GROWTH MEASUREMENTS
Measurements in Granada were carried out in January 2008 on 16 plants (without
leaves) per clone and block (assessment plots). All basal and breast height shoot diameters
(dbh), were measured with digital calipers and shoot height was measured using a graduated
pole. Branches per plant were counted in all plots. The plants were then cut, weighed and the
humidity content determined in the lab by oven drying a subsample to constant weight.
Volume per plant was calculated by adding the volumes of all single shoots assuming the
shape of a shoot to be a cone. Shoot biomass was estimated from plant biomass by assigning
to each shoot a biomass ratio equal to the shoot to plant volume ratio.
In Madrid, the basal and breast height shoot diameters and height were recorded for
all shoots per plant except those located in the four central rows, which were not measured to
avoid the border effect. Dry biomass yield was estimated from a shoot weight-volume
regression obtained from data collected during the first vegetative period in Granada. A
101
4
128
iDhKht
comparison of this regression model with another shoot weight volume regression built from
data obtained in the first vegetative period in Soria (located 200 Km from Madrid) using the
same genotypes and planting density, revealed no significant differences between both lines.
Although the plantation located in Granada was subjected to a drought environment while the
plantation in Soria was well-watered, no significant differences in the weight-volume
regressions were found despite differences in the biomass yield (0.435 Mg ha-1 año-1 in Soria
and 4.11 Mg ha-1 año-1 in Granada) and all the data were pooled together to obtain the
abovementioned regression equation.
ANATOMICAL MEASUREMENTS
Sampling of plant material for anatomical measurements was performed once
shedding was finished in January 2008 on one year old poplar shoots taken from the Granada
trial. In the first three blocks, the measured shoots of two plants per clone were marked with
a white tape at breast height, and 2 cm long stem samples were taken at that height and kept
in 50% alcohol until lab storage, where the alcohol was changed for FAA (20% formaldehyde,
glacial acetic acid, 50% alcohol and distilled water at a ratio of 7,1: 3,6: 64,3: 25). Stem cross
sections with a thickness of 40 µm were taken from the stem samples by means of a sledge
microtome, mounted with glycerin and observed using a light microscope (MEIJI ML 5000
Techno Co LTd). The images were captured at a magnification of 40x using a digital camera
(Moticam 2300) and joined together using Adobe Photoshop CS2 to compose a single image
of the whole cross section.
The area corresponding to pith, xylem and bark were measured in each cross section
using the cell^D (Olympus) software, and within the xylem, the number of vessels, area,
diameter and perimeter of each vessel were also recorded. For each cross section, the
following variables were calculated from these data: sum of vessel hydraulic diameters
calculated as four times the vessel area divided by the perimeter in order to take into account
the vessel shape (López & Mintegui 83), conducting area as the sum of the individual vessel
areas, average vessel diameter and area, vessel density as the number of vessels per xylem
area in mm2, AD ratio defined as the average vessel diameter divided by vessel density, and
the theoretical hydraulic conductivity (Kht) calculated by means of the Hagen Poiseuille law
(Equation 1), where Dhi is the hydraulic diameter of each vessel in one cross section and η is
the dynamic viscosity index of water considered at lab temperature.
equation 1
PHYSIOLOGICAL MEASUREMENTS
Gas exchange measurements
On the morning of June 27th2007, the day after the first watering, between 10:30 and
12:30 a.m., net CO2asimilation rate, ( A, µmolm-2 s-1), stomatal conductance to water vapour
(gs, mol m-2 s-1), and transpiration rate (E, mmol m-2 s-1) were measured in Granada on five
102
max
max
100ik k
PLCk
plants per block and clone using an IRGA LCA-4 (ADC BioScientific Ltd). Intrinsic water use
efficiency (IWUE, µmol/mol) was then calculated as the ratio of A to gs.
Hydraulic measurements
Samples for hydraulic measurements were taken in October 2013 from a one year old
experimental plot established in Madrid. Since this trial was located about 15 minutes from
the lab, undesiderable effects arising during transport such as gel formation, or wound
responses were minimized.
Shoots were cut in early morning at their base and under water by placing a plastic
funnel full of water around the base of the plant. The cut plant was then wrapped in wet
paper towel, placed in a black bag and carried to the lab where the plants were taken out of
the bag one-by-one to measure the hydraulic conductance using a XYL’EM (Xylem Embolism
Meter, Bronkhorst, Montigny les Cormeilles, France).
Firstly, progressive negative tensions were achieved in the xylem via centrifugation,
using a centrifuge (Sorvall RC 5C PLUS). Segments used for hydraulic measurements were
taken from each shoot just under the first mature leaf, and trimmed with a razor blade
underwater to a final length of 14 cm. Before the samples were inserted in the centrifuge,
stem segments were fitted to the xyl’em manifold, immerged under water. A flow of water
was made to pass through the samples at a pressure of 2kPa in order to obtain the native
hydraulic conductance (knative). This water head was selected so as not to exceed the 2T/rc
threshold, where T is the surface tension of water (0.0728 N m-1.at 20ºC) and rc is the radius of
the widest conduit in the sample (Van Ieperen et al. 2001 in Melcher et al. 2012). To obtain
the maximum hydraulic conductance (kmax), an additional flush lasting 5 minutes at 180 kPa
was applied to the samples in order to eliminate xylem embolisms. Conductance
measurements were performed using degassed 10mMKCl and 1mMCaCl2 solution 0.2µm
filtered to avoid slow clogging in vessels.
Stem segments were then inserted in the centrifuge and spun repeatedly to
progressively more negative pressures ranging from -0.12 to -2.5 MPa. Hydraulic conductance
(ki) was measured after each pressure increment until it dropped below 95% of the kmax value.
Percentage loss of hydraulic conductance was calculated using equation 2.
equation 2
The initial plan was to induce cavitation by centrifugation but only part of the plants
could be measured prior to the irreparable centrifuge breakdown. Cavitation was induced in
the rest of the plants by bench drying. The total number of stem segments used per clone and
watering treatment to measure hydraulic conductance at the moment of centrifuge
breakdown varied between 6 and 16, and only some of the watering regime-clone
combinations had been measured.
Cavitation was induced by bench dehydration in an additional sample of 160 stem
segments in order to complete the PLC measurements. Plants were allowed to dehydrate
103
gradually on the lab bench, and the xylem tension was measured with a Scholander chamber
on a leaf separated from the plant under water. Stem samples of around 4 cm in length
located under the first mature leaf were cut under water, placed in the manifold of the xyl’em
apparatus and the conductance measured ki. A flush lasting 4 minutes at 180 kPa was then
applied and the maximum conductance (kmax) and PLC (eq2) were measured again.
Percentage loss of hydraulic conductivity (PLC) was plotted against the corresponding
xylem pressure to generate vulnerability curves (VCs), fitted to the Pammenter and Vander
Willigen equation for each clone and water regime combination (Equation 3.), where ψ is the
negative tension in the xylem and a and b are parameters. Parameter b in the Pammenter
equation represents the xylem pressure at which percentage loss of conductivity reaches 50%.
(P50). It is commonly used as a measure of vulnerability to cavitation. Parameter a is related to
the slope of the VC. The higher the slope, the greater the vulnerability and it is thought to be
related to the variation in pit pore diameters (Pammenter & Vander Willigen 98).
( )
100
1 a bPLC
e
equation3
The cross section areas at both ends of each sample were impregnated with ink and
printed on paper. These impressions were then photographed with a digital camera and
measured using image analysis software (cell^D) to determine the stem cross section surface.
The specific hydraulic conductance (kxs) of the stem cross section was calculated as the ratio
of hydraulic conductance (ki) to the largest stem cross section As (eq4). Specific hydraulic
conductivity Kxs was calculated as the product of kxs by the stem segment length (eq 5).
equation 4
equation 5
STATISTICS
All the analyses were carried out using the GLM and NLIN procedures of the SAS
software version 9.2 (SAS Institute Inc. 1989).
Growth variables
In order to evaluate the clone effect on plant growth variables, a one way analysis of
variance (ANOVA) was carried out in Granada. In Madrid, a two way ANOVA was performed to
evaluate the effect of clone and watering treatment on growth. The General Linear Model
procedure of the SAS/STAT software version 9.2 was used for this purpose. The general linear
model used to fit the measured data was:
*xs xsK k length
ixs
s
kK
A
104
GW=water regime+clone+(water regime*clone)+ ε
Where GW represents the growth variable tested, water regime and clone are the
fixed effect factors and (water regime* clone) represents the interaction between factors. ε
stands for the random error.
Differences between means were tested using the Newman Keuls mean test with a
significance level of 0.05.
Anatomical features
Given the high correlation found between the anatomical features of xylem and the
shoot size, in order to evaluate differences between clones, a covariance analysis (ANCOVA)
was carried out using the shoot volume distal to breast height as covariate, since the cross
sections were taken at this height. Distal volume is the volume that receives the sap from the
analyzed section. Significance level was 5% and variables were log transformed in order to
ensure linearity.
When significant interaction between factors was not found, adjusted means were
calculated by means of the Tukey test.
Physiological variables
Gas exchange:
A high correlation was found between gas exchange measurements and the time at
which measurements were recorded, therefore, in order to assess the differences between
clones in terms of gas exchange variables an ANCOVA was carried out using time as covariate,
clone as categorical predictor and the interaction between the two of them was also included
in the model. Clonal differences between intercept and slope values of the regression lines
fitted to each clone were assessed by comparing parameters of the models by means of F
tests (option solution in SAS GLM procedure).
Hydraulic measurements:
Pairs of observations of xylem water potential and PLC were fitted to the Pammenter
& Vander Willigen equation by means of the SAS nlin procedure. Mean square reduction tests
were used to compare the VCs obtained by different methods (www.ats.ucla.edu). Since they
proved to be significantly different, well-watered to stressed plants along with the different
possible combinations of clone-treatment were also compared using mean square reduction
tests separately per method.
Having determined that there were also significant differences between watering
treatments, clones and clone-water treatment interaction , the significance of the differences
between parameters (a, b) corresponding to the different clone-water regime combinations
was evaluated by comparing confidence intervals, setting the appropriate significance level in
accordance with the number of comparisons carried out. Parameters were considered
significantly different when their confidence intervals did not overlap.
105
Finally, differences in specific hydraulic conductivity Kxs for both clone and treatment
were assessed by means of an ANCOVA, using xylem water potential as covariate. The model
used was:
Kxs~ xylem water potential+clone+watering-treatment+clone*watering-treatment
RESULTS
GROWTH
In Granada, clone I-214 yielded the lowest amount of dry biomass per hectare and
showed significantly lower values than the rest of the clones for all measured growth variables
except for the number of shoots per plant (I-124 having the highest number). In contrast, the
clones with the highest biomass yield were Monviso and AF2, the former also presenting
significantly higher values than the rest of the clones for dominant shoot volume and number
of branches per plant (Table 1).
In Madrid, significant differences in growth between watering treatments were not
found for any of the variables. The growth increment in Populus xeuramericana hybrids from
stressed to watered treatments was greater than for Populus xinteramericanaxnigra, the
Monviso clone even registering a decrease. The clone effect, volume per plant, main shoot
volume per plant and estimated dry biomass were significantly higher for AF2 than for the rest
of the clones. Interaction between factors was only detected for estimated dry biomass. Clone
AF2 and Monviso had the highest biomass yield in the well-watered and water-deficit
treatments respectively, their means differing from those of the rest of the clones. The Pegaso
clone exhibited the lowest biomass yield in both treatments and was significantly different
from AF2 in the well-watered regime and from Monviso in the water-deficit treatment.
Differences in biomass yield between stressed plants in Madrid and Granada are
attributed to the differences in root age in each plantation.
The growth variables in Madrid were transformed by standardizing their variance
function in order to avoid heterocedasticity.
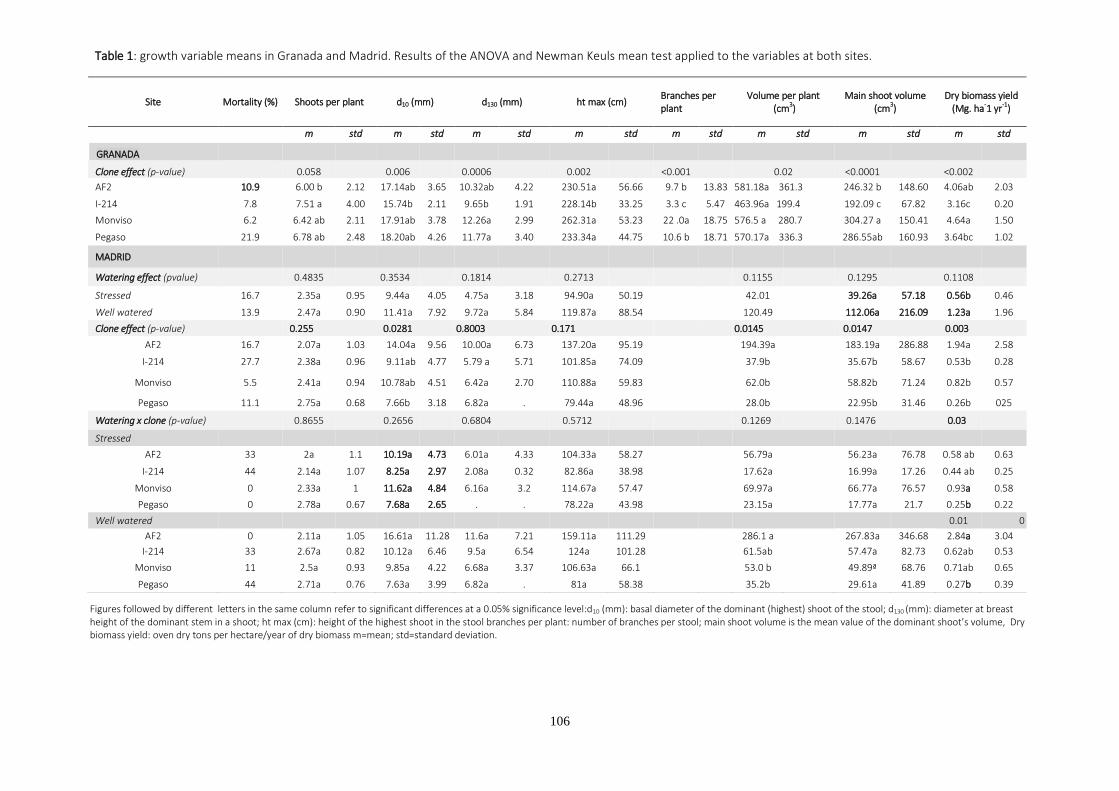
106
Table 1: growth variable means in Granada and Madrid. Results of the ANOVA and Newman Keuls mean test applied to the variables at both sites.
Figures followed by different letters in the same column refer to significant differences at a 0.05% significance level:d10 (mm): basal diameter of the dominant (highest) shoot of the stool; d130 (mm): diameter at breast height of the dominant stem in a shoot; ht max (cm): height of the highest shoot in the stool branches per plant: number of branches per stool; main shoot volume is the mean value of the dominant shoot’s volume, Dry biomass yield: oven dry tons per hectare/year of dry biomass m=mean; std=standard deviation.
Site Mortality (%) Shoots per plant d10 (mm) d130 (mm) ht max (cm) Branches per plant
Volume per plant (cm3)
Main shoot volume (cm3)
Dry biomass yield (Mg. ha-1 yr-1)
m std m std m std m std m std m std m std m std
GRANADA
Clone effect (p-value) 0.058 0.006 0.0006 0.002 <0.001 0.02 <0.0001 <0.002
AF2 10.9 6.00 b 2.12 17.14ab 3.65 10.32ab 4.22 230.51a 56.66 9.7 b 13.83 581.18a 361.3 246.32 b 148.60 4.06ab 2.03
I-214 7.8 7.51 a 4.00 15.74b 2.11 9.65b 1.91 228.14b 33.25 3.3 c 5.47 463.96a 199.4 192.09 c 67.82 3.16c 0.20
Monviso 6.2 6.42 ab 2.11 17.91ab 3.78 12.26a 2.99 262.31a 53.23 22 .0a 18.75 576.5 a 280.7 304.27 a 150.41 4.64a 1.50
Pegaso 21.9 6.78 ab 2.48 18.20ab 4.26 11.77a 3.40 233.34a 44.75 10.6 b 18.71 570.17a 336.3 286.55ab 160.93 3.64bc 1.02
MADRID
Watering effect (pvalue) 0.4835 0.3534 0.1814 0.2713 0.1155 0.1295 0.1108
Stressed 16.7 2.35a 0.95 9.44a 4.05 4.75a 3.18 94.90a 50.19 42.01 39.26a 57.18 0.56b 0.46
Well watered 13.9 2.47a 0.90 11.41a 7.92 9.72a 5.84 119.87a 88.54 120.49 112.06a 216.09 1.23a 1.96
Clone effect (p-value) 0.255 0.0281 0.8003 0.171 0.0145 0.0147 0.003
AF2 16.7 2.07a 1.03 14.04a 9.56 10.00a 6.73 137.20a 95.19 194.39a 183.19a 286.88 1.94a 2.58
I-214 27.7 2.38a 0.96 9.11ab 4.77 5.79 a 5.71 101.85a 74.09 37.9b 35.67b 58.67 0.53b 0.28
Monviso 5.5 2.41a 0.94 10.78ab 4.51 6.42a 2.70 110.88a 59.83 62.0b 58.82b 71.24 0.82b 0.57
Pegaso 11.1 2.75a 0.68 7.66b 3.18 6.82a . 79.44a 48.96 28.0b 22.95b 31.46 0.26b 025
Watering x clone (p-value) 0.8655 0.2656 0.6804 0.5712 0.1269 0.1476 0.03
Stressed
AF2 33 2a 1.1 10.19a 4.73 6.01a 4.33 104.33a 58.27 56.79a 56.23a 76.78 0.58 ab 0.63
I-214 44 2.14a 1.07 8.25a 2.97 2.08a 0.32 82.86a 38.98 17.62a 16.99a 17.26 0.44 ab 0.25
Monviso 0 2.33a 1 11.62a 4.84 6.16a 3.2 114.67a 57.47 69.97a 66.77a 76.57 0.93a 0.58
Pegaso 0 2.78a 0.67 7.68a 2.65 . . 78.22a 43.98 23.15a 17.77a 21.7 0.25b 0.22
Well watered 0.01 0
AF2 0 2.11a 1.05 16.61a 11.28 11.6a 7.21 159.11a 111.29 286.1 a 267.83a 346.68 2.84a 3.04
I-214 33 2.67a 0.82 10.12a 6.46 9.5a 6.54 124a 101.28 61.5ab 57.47a 82.73 0.62ab 0.53
Monviso 11 2.5a 0.93 9.85a 4.22 6.68a 3.37 106.63a 66.1 53.0 b 49.89ª 68.76 0.71ab 0.65
Pegaso 44 2.71a 0.76 7.63a 3.99 6.82a . 81a 58.38 35.2b 29.61a 41.89 0.27b 0.39
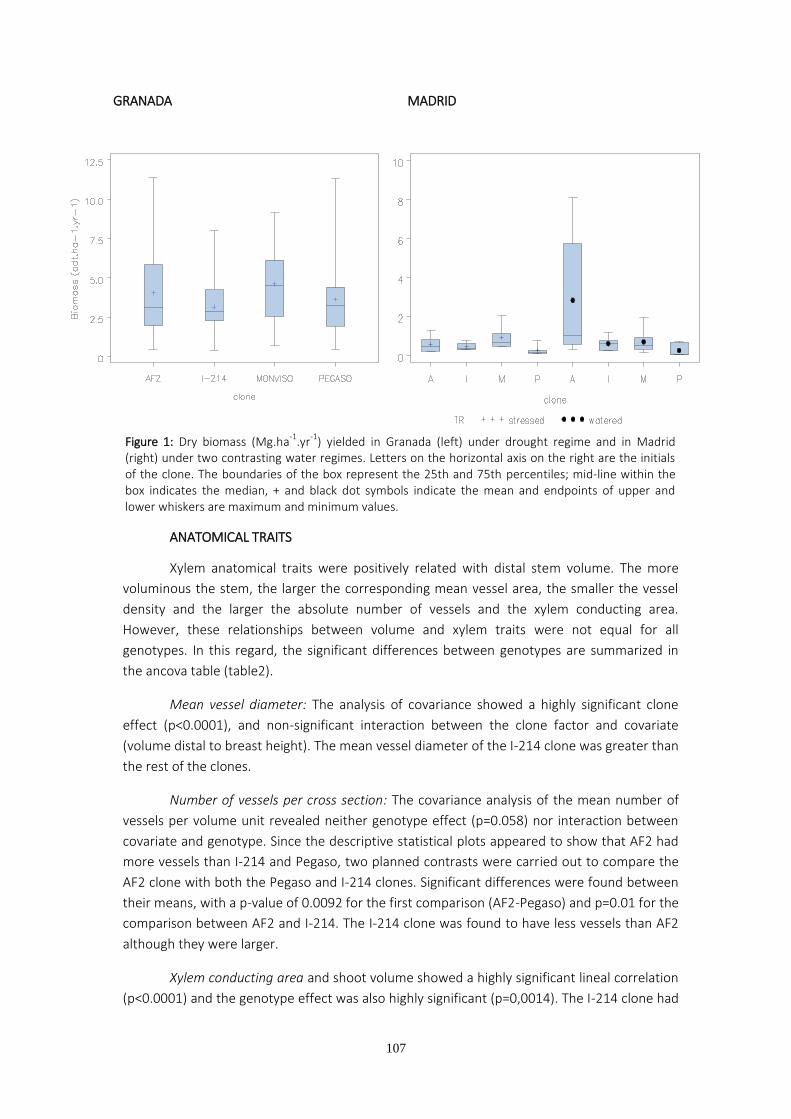
107
Figure 1: Dry biomass (Mg.ha-1
.yr-1
) yielded in Granada (left) under drought regime and in Madrid (right) under two contrasting water regimes. Letters on the horizontal axis on the right are the initials of the clone. The boundaries of the box represent the 25th and 75th percentiles; mid-line within the box indicates the median, + and black dot symbols indicate the mean and endpoints of upper and lower whiskers are maximum and minimum values.
ANATOMICAL TRAITS
Xylem anatomical traits were positively related with distal stem volume. The more
voluminous the stem, the larger the corresponding mean vessel area, the smaller the vessel
density and the larger the absolute number of vessels and the xylem conducting area.
However, these relationships between volume and xylem traits were not equal for all
genotypes. In this regard, the significant differences between genotypes are summarized in
the ancova table (table2).
Mean vessel diameter: The analysis of covariance showed a highly significant clone
effect (p<0.0001), and non-significant interaction between the clone factor and covariate
(volume distal to breast height). The mean vessel diameter of the I-214 clone was greater than
the rest of the clones.
Number of vessels per cross section: The covariance analysis of the mean number of
vessels per volume unit revealed neither genotype effect (p=0.058) nor interaction between
covariate and genotype. Since the descriptive statistical plots appeared to show that AF2 had
more vessels than I-214 and Pegaso, two planned contrasts were carried out to compare the
AF2 clone with both the Pegaso and I-214 clones. Significant differences were found between
their means, with a p-value of 0.0092 for the first comparison (AF2-Pegaso) and p=0.01 for the
comparison between AF2 and I-214. The I-214 clone was found to have less vessels than AF2
although they were larger.
Xylem conducting area and shoot volume showed a highly significant lineal correlation
(p<0.0001) and the genotype effect was also highly significant (p=0,0014). The I-214 clone had
GRANADA MADRID
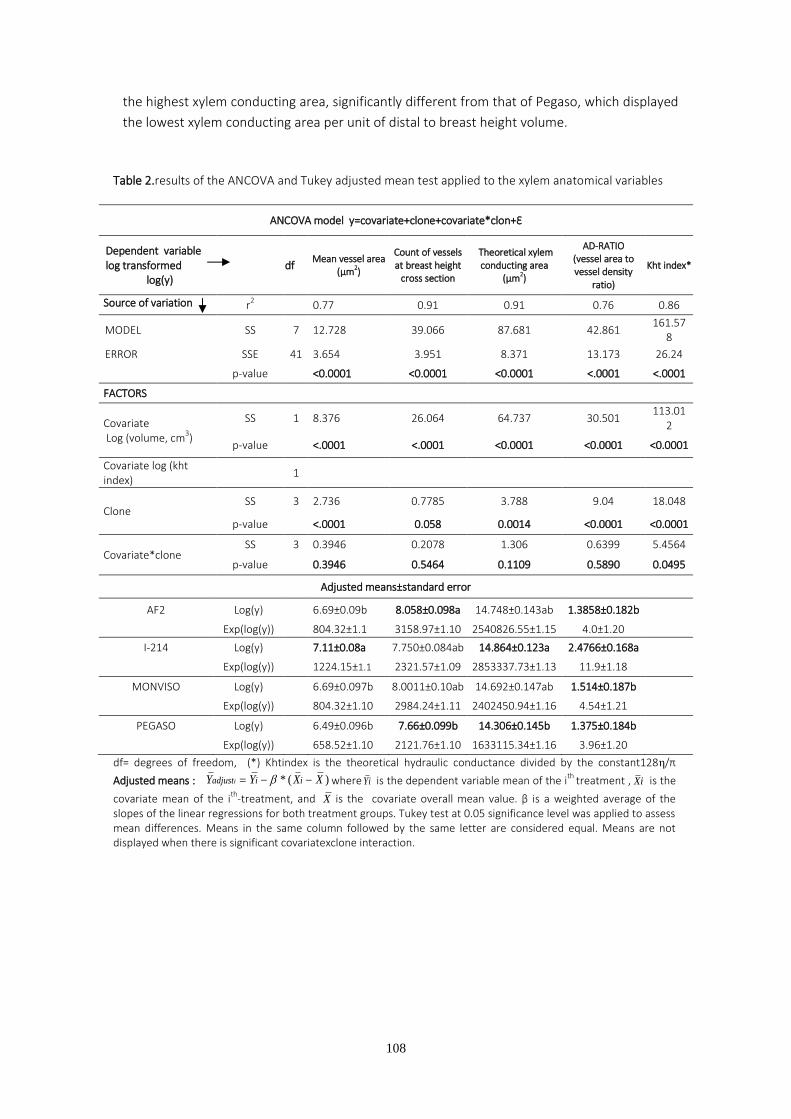
108
the highest xylem conducting area, significantly different from that of Pegaso, which displayed
the lowest xylem conducting area per unit of distal to breast height volume.
Table 2.results of the ANCOVA and Tukey adjusted mean test applied to the xylem anatomical variables
ANCOVA model y=covariate+clone+covariate*clon+Ԑ
Dependent variable log transformed
log(y) df
Mean vessel area (µm2)
Count of vessels at breast height
cross section
Theoretical xylem conducting area
(µm2)
AD-RATIO (vessel area to vessel density
ratio)
Kht index*
Source of variation r2 0.77 0.91 0.91 0.76 0.86
MODEL SS 7 12.728 39.066 87.681 42.861 161.57
8
ERROR SSE 41 3.654 3.951 8.371 13.173 26.24
p-value <0.0001 <0.0001 <0.0001 <.0001 <.0001
FACTORS
Covariate Log (volume, cm
3)
SS 1 8.376 26.064 64.737 30.501 113.01
2
p-value <.0001 <.0001 <0.0001 <0.0001 <0.0001
Covariate log (kht index)
1
Clone SS 3 2.736 0.7785 3.788 9.04 18.048
p-value <.0001 0.058 0.0014 <0.0001 <0.0001
Covariate*clone SS 3 0.3946 0.2078 1.306 0.6399 5.4564
p-value 0.3946 0.5464 0.1109 0.5890 0.0495
Adjusted means±standard error
AF2 Log(y) 6.69±0.09b 8.058±0.098a 14.748±0.143ab 1.3858±0.182b
Exp(log(y)) 804.32±1.1 3158.97±1.10 2540826.55±1.15 4.0±1.20
I-214 Log(y) 7.11±0.08a 7.750±0.084ab 14.864±0.123a 2.4766±0.168a
Exp(log(y)) 1224.15±1.1 2321.57±1.09 2853337.73±1.13 11.9±1.18
MONVISO Log(y) 6.69±0.097b 8.0011±0.10ab 14.692±0.147ab 1.514±0.187b
Exp(log(y)) 804.32±1.10 2984.24±1.11 2402450.94±1.16 4.54±1.21
PEGASO Log(y) 6.49±0.096b 7.66±0.099b 14.306±0.145b 1.375±0.184b
Exp(log(y)) 658.52±1.10 2121.76±1.10 1633115.34±1.16 3.96±1.20
df= degrees of freedom, (*) Khtindex is the theoretical hydraulic conductance divided by the constant128h/π
Adjusted means : * ( )iadjust i iY Y X X where Yi is the dependent variable mean of the ith
treatment , Xi is the
covariate mean of the ith
-treatment, and X is the covariate overall mean value. β is a weighted average of the slopes of the linear regressions for both treatment groups. Tukey test at 0.05 significance level was applied to assess mean differences. Means in the same column followed by the same letter are considered equal. Means are not displayed when there is significant covariatexclone interaction.
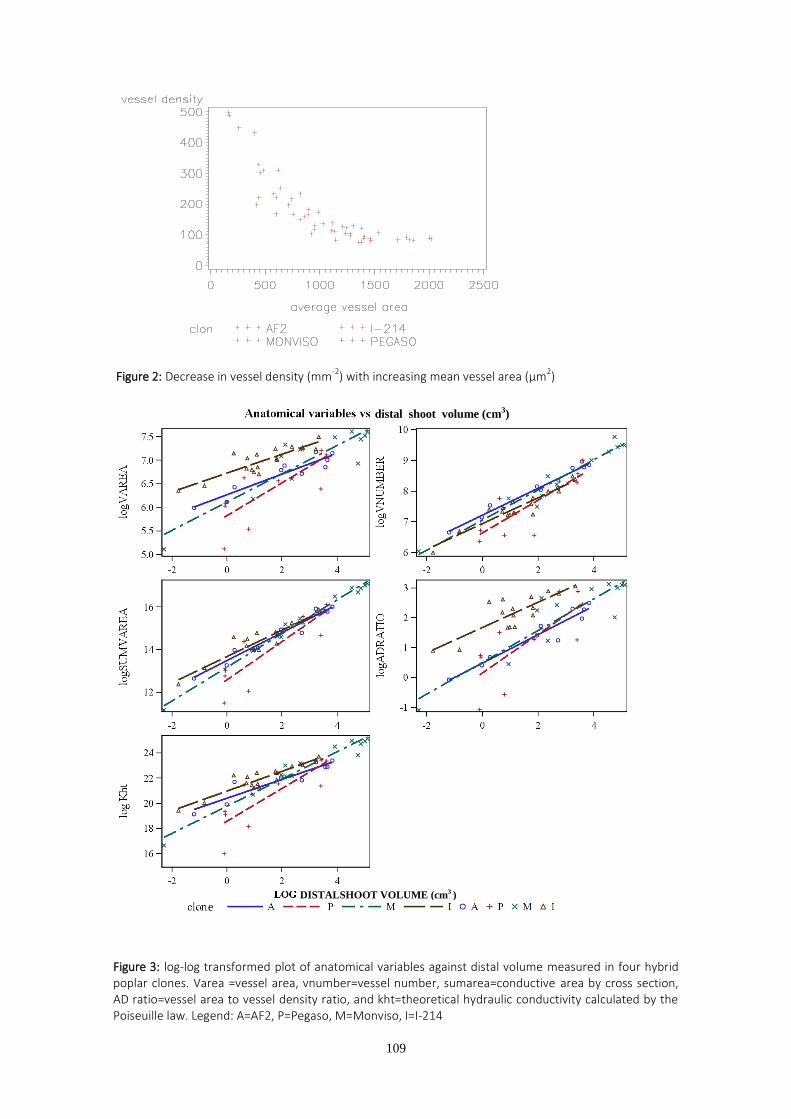
109
Figure 2: Decrease in vessel density (mm-2
) with increasing mean vessel area (µm2)
Figure 3: log-log transformed plot of anatomical variables against distal volume measured in four hybrid poplar clones. Varea =vessel area, vnumber=vessel number, sumarea=conductive area by cross section, AD ratio=vessel area to vessel density ratio, and kht=theoretical hydraulic conductivity calculated by the Poiseuille law. Legend: A=AF2, P=Pegaso, M=Monviso, I=I-214
distal shoot volume (cm3)
DISTALSHOOT VOLUME (cm3 )
e
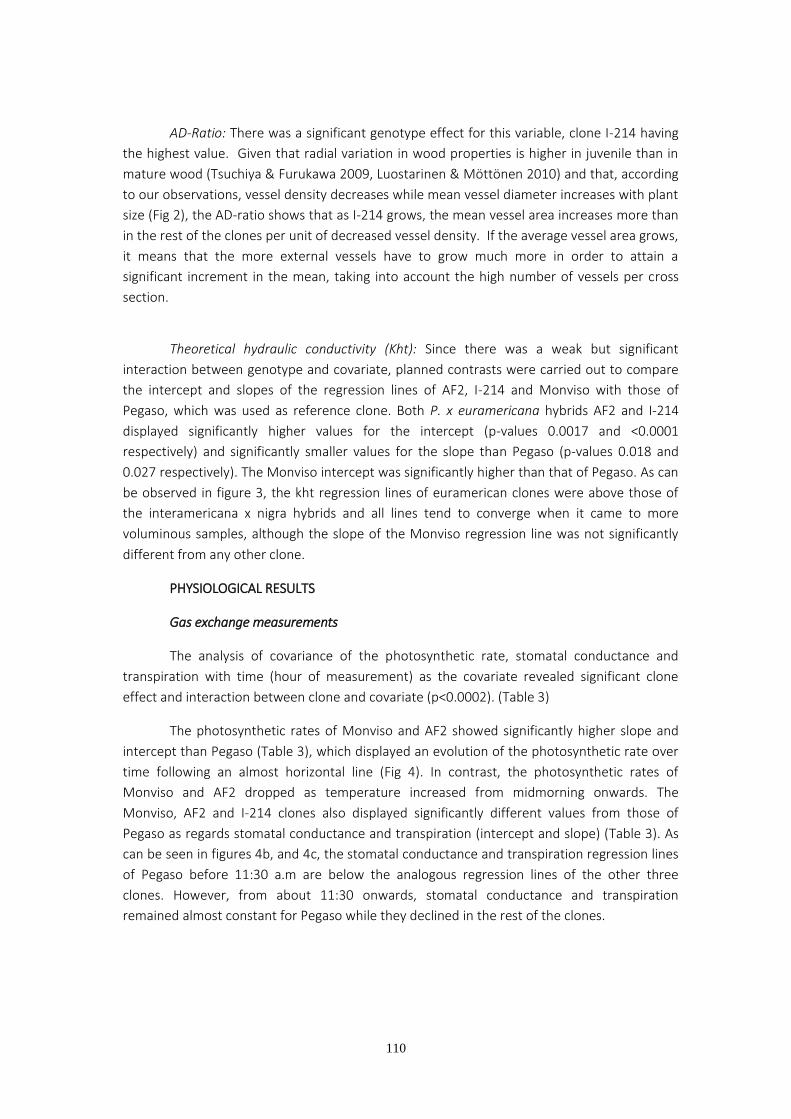
110
AD-Ratio: There was a significant genotype effect for this variable, clone I-214 having
the highest value. Given that radial variation in wood properties is higher in juvenile than in
mature wood (Tsuchiya & Furukawa 2009, Luostarinen & Möttönen 2010) and that, according
to our observations, vessel density decreases while mean vessel diameter increases with plant
size (Fig 2), the AD-ratio shows that as I-214 grows, the mean vessel area increases more than
in the rest of the clones per unit of decreased vessel density. If the average vessel area grows,
it means that the more external vessels have to grow much more in order to attain a
significant increment in the mean, taking into account the high number of vessels per cross
section.
Theoretical hydraulic conductivity (Kht): Since there was a weak but significant
interaction between genotype and covariate, planned contrasts were carried out to compare
the intercept and slopes of the regression lines of AF2, I-214 and Monviso with those of
Pegaso, which was used as reference clone. Both P. x euramericana hybrids AF2 and I-214
displayed significantly higher values for the intercept (p-values 0.0017 and <0.0001
respectively) and significantly smaller values for the slope than Pegaso (p-values 0.018 and
0.027 respectively). The Monviso intercept was significantly higher than that of Pegaso. As can
be observed in figure 3, the kht regression lines of euramerican clones were above those of
the interamericana x nigra hybrids and all lines tend to converge when it came to more
voluminous samples, although the slope of the Monviso regression line was not significantly
different from any other clone.
PHYSIOLOGICAL RESULTS
Gas exchange measurements
The analysis of covariance of the photosynthetic rate, stomatal conductance and
transpiration with time (hour of measurement) as the covariate revealed significant clone
effect and interaction between clone and covariate (p<0.0002). (Table 3)
The photosynthetic rates of Monviso and AF2 showed significantly higher slope and
intercept than Pegaso (Table 3), which displayed an evolution of the photosynthetic rate over
time following an almost horizontal line (Fig 4). In contrast, the photosynthetic rates of
Monviso and AF2 dropped as temperature increased from midmorning onwards. The
Monviso, AF2 and I-214 clones also displayed significantly different values from those of
Pegaso as regards stomatal conductance and transpiration (intercept and slope) (Table 3). As
can be seen in figures 4b, and 4c, the stomatal conductance and transpiration regression lines
of Pegaso before 11:30 a.m are below the analogous regression lines of the other three
clones. However, from about 11:30 onwards, stomatal conductance and transpiration
remained almost constant for Pegaso while they declined in the rest of the clones.
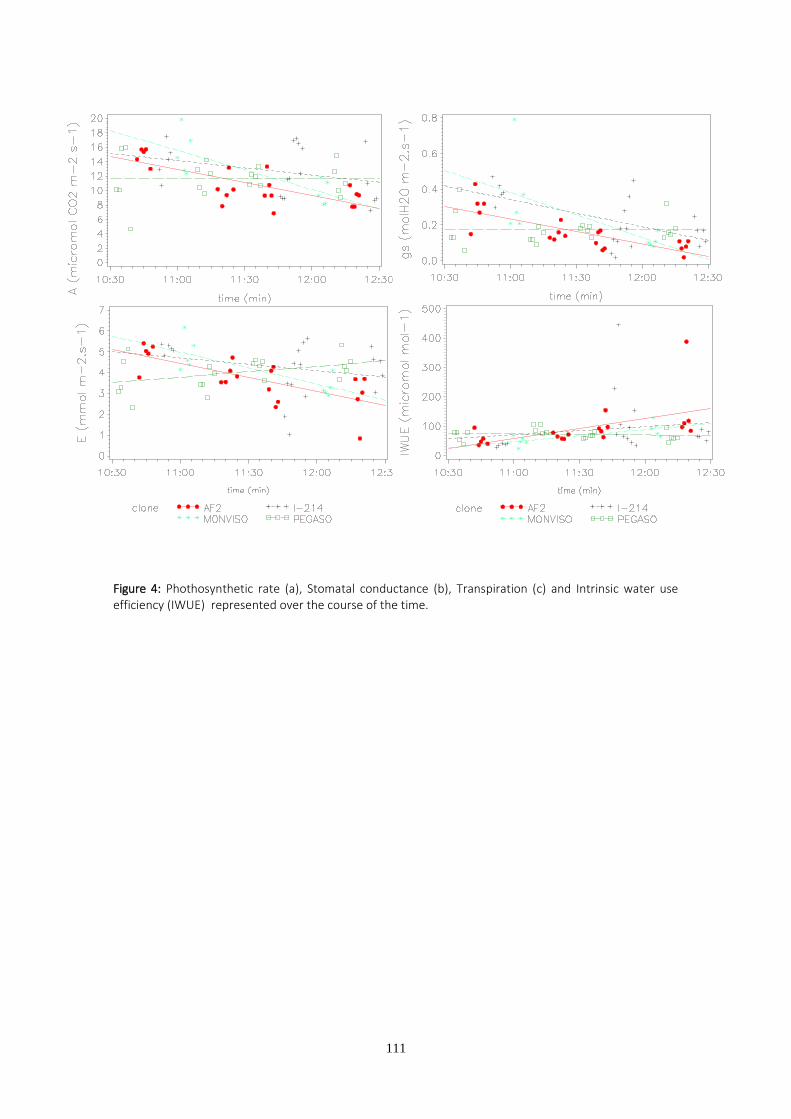
111
Figure 4: Phothosynthetic rate (a), Stomatal conductance (b), Transpiration (c) and Intrinsic water use efficiency (IWUE) represented over the course of the time.
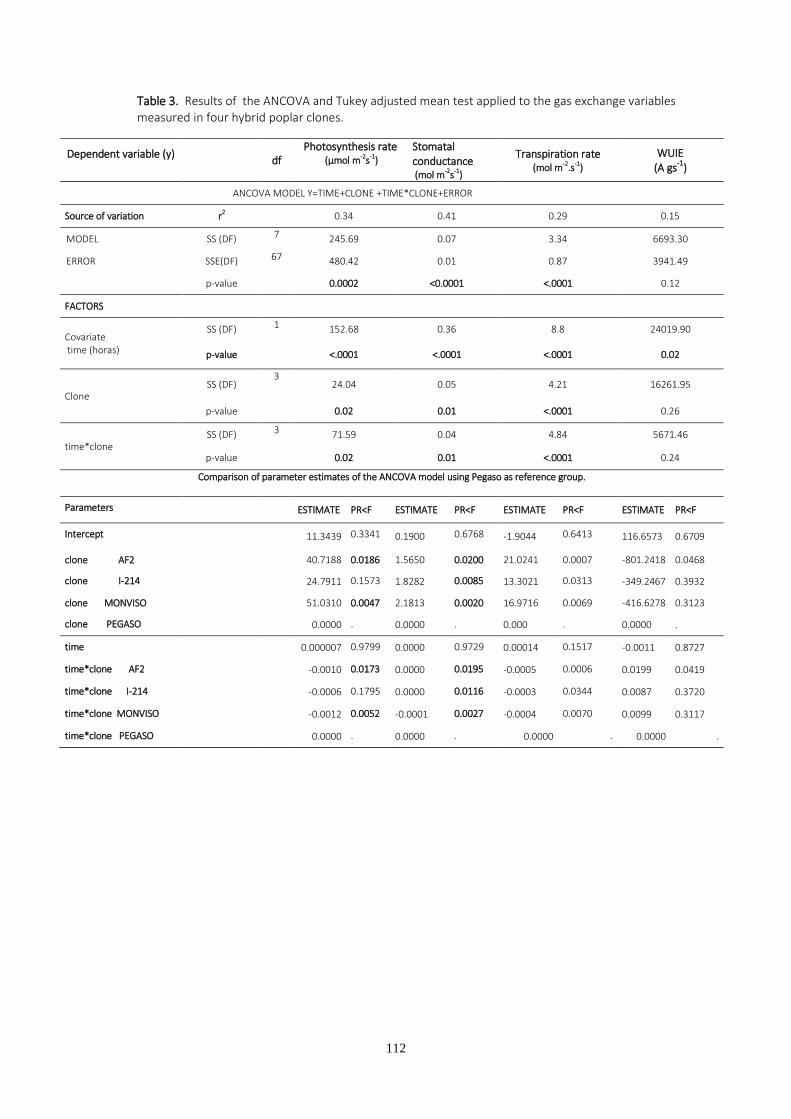
112
Table 3. Results of the ANCOVA and Tukey adjusted mean test applied to the gas exchange variables measured in four hybrid poplar clones.
Dependent variable (y)
df Photosynthesis rate
(µmol m-2s-1)
Stomatal conductance (mol m-2s-1)
Transpiration rate (mol m-2.s-1)
WUIE (A gs
-1)
ANCOVA MODEL Y=TIME+CLONE +TIME*CLONE+ERROR
Source of variation r2 0.34 0.41 0.29 0.15
MODEL SS (DF) 7 245.69 0.07 3.34 6693.30
ERROR SSE(DF) 67 480.42 0.01 0.87 3941.49
p-value 0.0002 <0.0001 <.0001 0.12
FACTORS
Covariate time (horas)
SS (DF) 1 152.68 0.36 8.8 24019.90
p-value
<.0001 <.0001 <.0001 0.02
Clone SS (DF)
3 24.04 0.05 4.21 16261.95
p-value 0.02 0.01 <.0001 0.26
time*clone SS (DF) 3 71.59 0.04 4.84 5671.46
p-value
0.02 0.01 <.0001 0.24
Comparison of parameter estimates of the ANCOVA model using Pegaso as reference group.
Parameters
ESTIMATE PR<F ESTIMATE PR<F ESTIMATE PR<F ESTIMATE PR<F
Intercept 11.3439 0.3341 0.1900 0.6768 -1.9044 0.6413 116.6573 0.6709
clone AF2 40.7188 0.0186 1.5650 0.0200 21.0241 0.0007 -801.2418 0.0468
clone I-214 24.7911 0.1573 1.8282 0.0085 13.3021 0.0313 -349.2467 0.3932
clone MONVISO 51.0310 0.0047 2.1813 0.0020 16.9716 0.0069 -416.6278 0.3123
clone PEGASO 0.0000 . 0.0000 . 0.000 . 0.0000 .
time 0.000007 0.9799 0.0000 0.9729 0.00014 0.1517 -0.0011 0.8727
time*clone AF2 -0.0010 0.0173 0.0000 0.0195 -0.0005 0.0006 0.0199 0.0419
time*clone I-214 -0.0006 0.1795 0.0000 0.0116 -0.0003 0.0344 0.0087 0.3720
time*clone MONVISO -0.0012 0.0052 -0.0001 0.0027 -0.0004 0.0070 0.0099 0.3117
time*clone PEGASO 0.0000 . 0.0000 . 0.0000 . 0.0000 .
113
Hydraulic measurements
Table 4 shows both a and b parameter estimates of the Pammenter and Vander
Willigen curves, mean square errors, and confidence intervals for each method, clone and
water treatment. Figure 5 shows the plotted means and confidence intervals of b coefficients
to facilitate understanding of the text.
Figure 5: means (black dots) and confidence intervals of b coefficients per clone, treatment and method (CL_TR_MT) ordered by method and magnitude. The first of the three letters on the vertical axis denotes the clone (A=AF2, I=I-214, M=Monviso and P=pegaso), the second letter corresponds to the watering regime (W) or stressed (S), and the third letter is the method employed to induce embolism: D (dehydration) and C (centrifuge
Comparison of vulnerability curves (VCs) built using different methods:
The results of the mean square reduction test applied to data obtained from different
methods revealed a significantly higher b value for those obtained through centrifuge (Table 4,
Fig.5). The VCs obtained using both methods were s-shaped as well as r-shaped. For instance,
the dehydration-based VC for well-watered I-214 as well as the centrifuge based curve for
stressed AF2 were r–shaped, whilst the centrifuge-based VC for stressed Monviso and
dehydration-based VC for stressed I-214 were s-shaped (Fig. 6).
Vulnerability curves obtained using the dehydration method:
Differences between treatments:
Dehydration-based VC corresponding to stressed plants was shifted towards more negative
xylem tensions than the well-watered one. Differences between their corresponding b-
coefficient values were significant (their confidence intervals did not overlap, (Table 4). The
coefficient a of the stressed curve was also significantly lower than that of the well-watered
vulnerability curve. (Table 4)
b
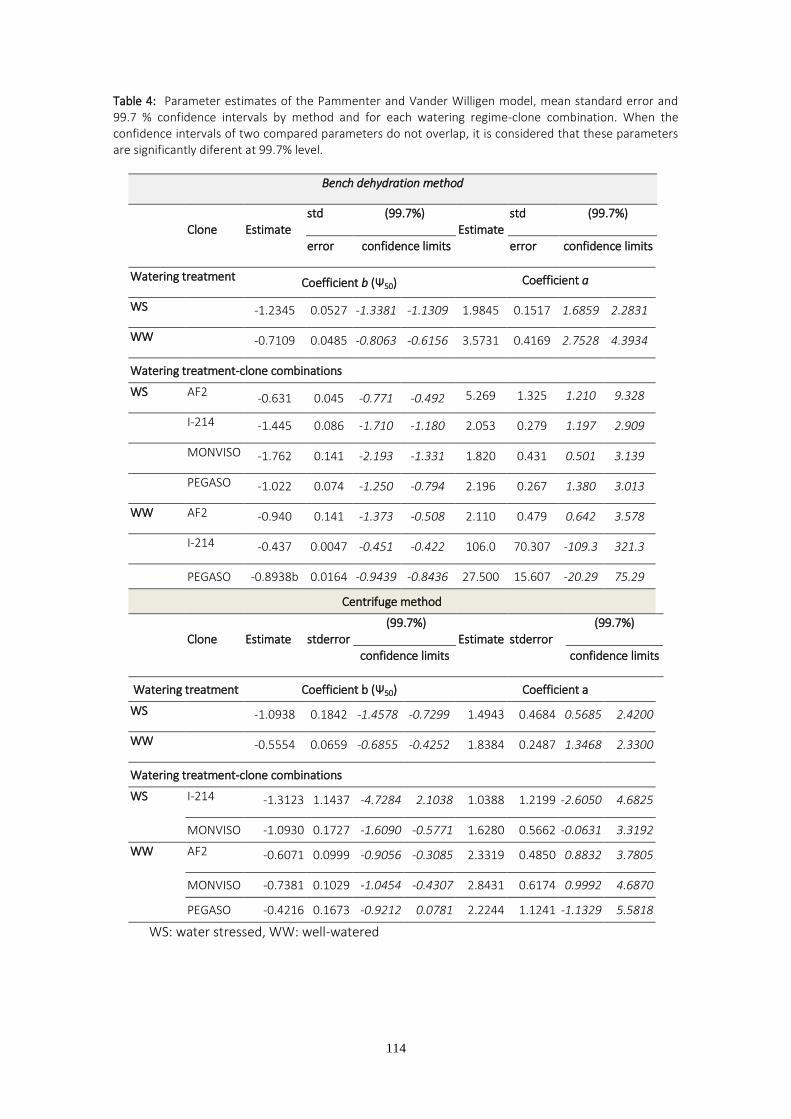
114
Table 4: Parameter estimates of the Pammenter and Vander Willigen model, mean standard error and 99.7 % confidence intervals by method and for each watering regime-clone combination. When the confidence intervals of two compared parameters do not overlap, it is considered that these parameters are significantly diferent at 99.7% level.
Bench dehydration method
Clone Estimate std
error
(99.7%)
confidence limits Estimate
std
error
(99.7%)
confidence limits
Watering treatment Coefficient b (Ѱ50) Coefficient a
WS -1.2345 0.0527 -1.3381 -1.1309 1.9845 0.1517 1.6859 2.2831
WW -0.7109 0.0485 -0.8063 -0.6156 3.5731 0.4169 2.7528 4.3934
Watering treatment-clone combinations
WS AF2 -0.631 0.045 -0.771 -0.492 5.269 1.325 1.210 9.328
I-214 -1.445 0.086 -1.710 -1.180 2.053 0.279 1.197 2.909
MONVISO -1.762 0.141 -2.193 -1.331 1.820 0.431 0.501 3.139
PEGASO -1.022 0.074 -1.250 -0.794 2.196 0.267 1.380 3.013
WW AF2 -0.940 0.141 -1.373 -0.508 2.110 0.479 0.642 3.578
I-214 -0.437 0.0047 -0.451 -0.422 106.0 70.307 -109.3 321.3
PEGASO -0.8938b 0.0164 -0.9439 -0.8436 27.500 15.607 -20.29 75.29
Centrifuge method
Clone Estimate stderror (99.7%)
confidence limits Estimate stderror
(99.7%)
confidence limits
Watering treatment Coefficient b (Ѱ50) Coefficient a
WS -1.0938 0.1842 -1.4578 -0.7299 1.4943 0.4684 0.5685 2.4200
WW -0.5554 0.0659 -0.6855 -0.4252 1.8384 0.2487 1.3468 2.3300
Watering treatment-clone combinations
WS I-214 -1.3123 1.1437 -4.7284 2.1038 1.0388 1.2199 -2.6050 4.6825
MONVISO -1.0930 0.1727 -1.6090 -0.5771 1.6280 0.5662 -0.0631 3.3192
WW AF2 -0.6071 0.0999 -0.9056 -0.3085 2.3319 0.4850 0.8832 3.7805
MONVISO -0.7381 0.1029 -1.0454 -0.4307 2.8431 0.6174 0.9992 4.6870
PEGASO -0.4216 0.1673 -0.9212 0.0781 2.2244 1.1241 -1.1329 5.5818
WS: water stressed, WW: well-watered
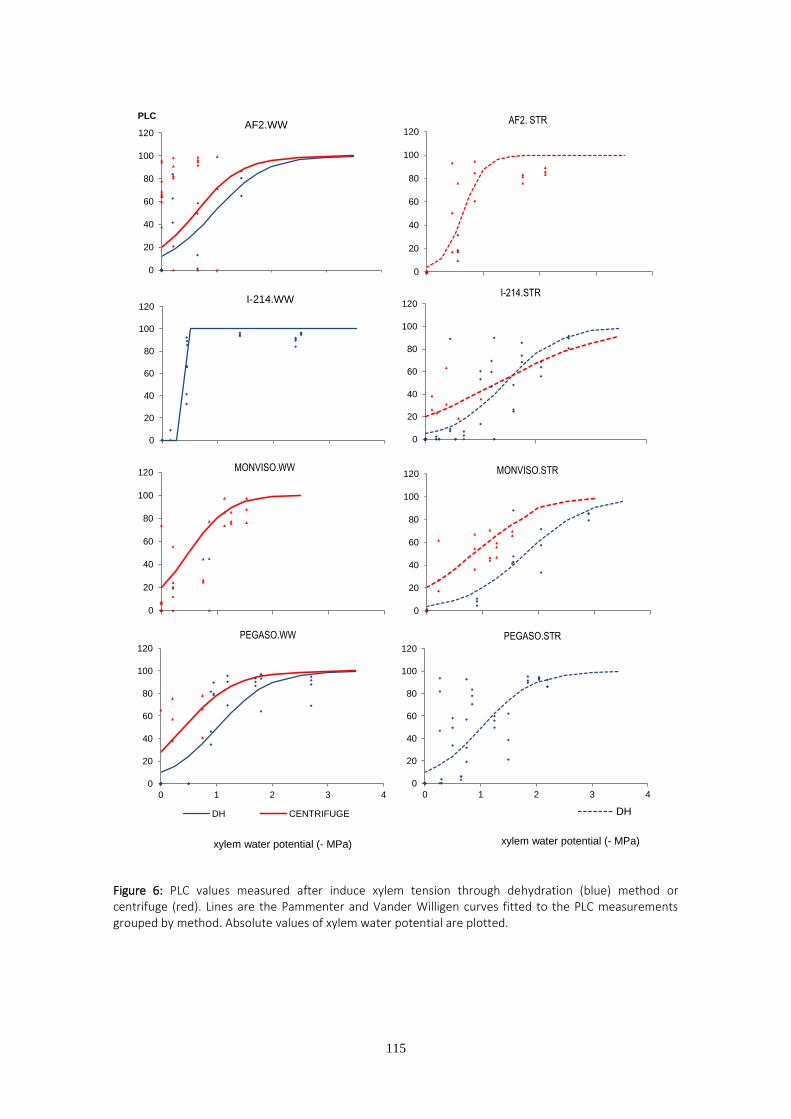
115
Figure 6: PLC values measured after induce xylem tension through dehydration (blue) method or centrifuge (red). Lines are the Pammenter and Vander Willigen curves fitted to the PLC measurements grouped by method. Absolute values of xylem water potential are plotted.
0
20
40
60
80
100
120
0 1 2 3 4
xylem water potential (- MPa)
PEGASO.WW
DH CENTRIFUGE
0
20
40
60
80
100
120MONVISO.WW
0
20
40
60
80
100
120 MONVISO.STR
0
20
40
60
80
100
120I-214.STR
0
20
40
60
80
100
120I-214.WW
0
20
40
60
80
100
120
PLC AF2.WW
0
20
40
60
80
100
120
AF2. STR
0
20
40
60
80
100
120
0 1 2 3 4
xylem water potential (- MPa)
PEGASO.STR
DH
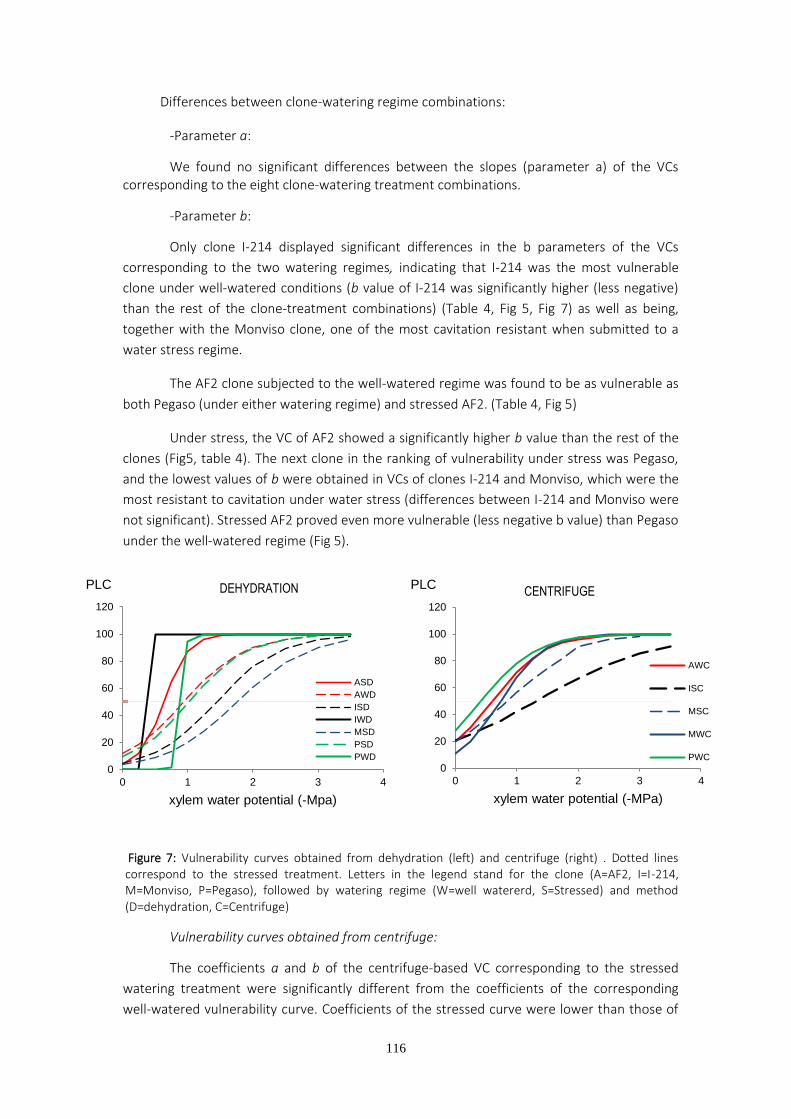
116
Differences between clone-watering regime combinations:
-Parameter a:
We found no significant differences between the slopes (parameter a) of the VCs corresponding to the eight clone-watering treatment combinations.
-Parameter b:
Only clone I-214 displayed significant differences in the b parameters of the VCs
corresponding to the two watering regimes, indicating that I-214 was the most vulnerable
clone under well-watered conditions (b value of I-214 was significantly higher (less negative)
than the rest of the clone-treatment combinations) (Table 4, Fig 5, Fig 7) as well as being,
together with the Monviso clone, one of the most cavitation resistant when submitted to a
water stress regime.
The AF2 clone subjected to the well-watered regime was found to be as vulnerable as
both Pegaso (under either watering regime) and stressed AF2. (Table 4, Fig 5)
Under stress, the VC of AF2 showed a significantly higher b value than the rest of the
clones (Fig5, table 4). The next clone in the ranking of vulnerability under stress was Pegaso,
and the lowest values of b were obtained in VCs of clones I-214 and Monviso, which were the
most resistant to cavitation under water stress (differences between I-214 and Monviso were
not significant). Stressed AF2 proved even more vulnerable (less negative b value) than Pegaso
under the well-watered regime (Fig 5).
Figure 7: Vulnerability curves obtained from dehydration (left) and centrifuge (right) . Dotted lines correspond to the stressed treatment. Letters in the legend stand for the clone (A=AF2, I=I-214, M=Monviso, P=Pegaso), followed by watering regime (W=well watererd, S=Stressed) and method (D=dehydration, C=Centrifuge)
Vulnerability curves obtained from centrifuge:
The coefficients a and b of the centrifuge-based VC corresponding to the stressed
watering treatment were significantly different from the coefficients of the corresponding
well-watered vulnerability curve. Coefficients of the stressed curve were lower than those of
0
20
40
60
80
100
120
0 1 2 3 4
PLC
xylem water potential (-Mpa)
DEHYDRATION
ASD
AWD
ISD
IWD
MSD
PSD
PWD
0
20
40
60
80
100
120
0 1 2 3 4
PLC
xylem water potential (-MPa)
CENTRIFUGE
AWC
ISC
MSC
MWC
PWC
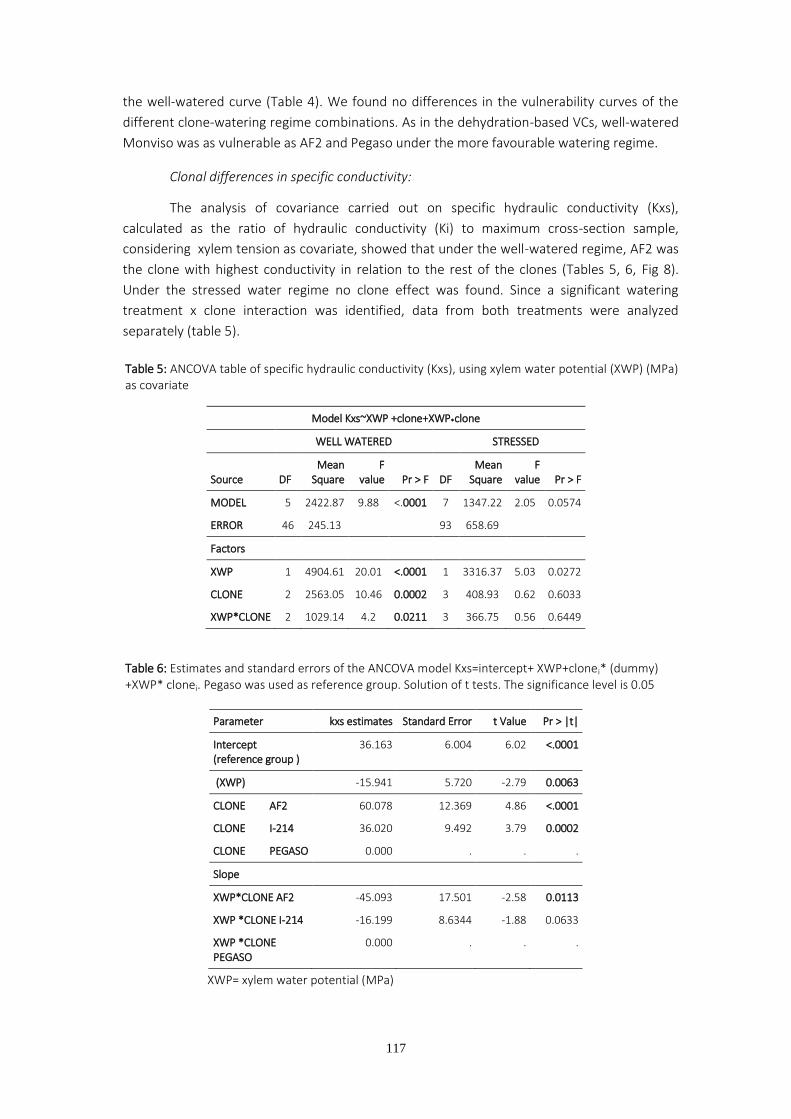
117
the well-watered curve (Table 4). We found no differences in the vulnerability curves of the
different clone-watering regime combinations. As in the dehydration-based VCs, well-watered
Monviso was as vulnerable as AF2 and Pegaso under the more favourable watering regime.
Clonal differences in specific conductivity:
The analysis of covariance carried out on specific hydraulic conductivity (Kxs),
calculated as the ratio of hydraulic conductivity (Ki) to maximum cross-section sample,
considering xylem tension as covariate, showed that under the well-watered regime, AF2 was
the clone with highest conductivity in relation to the rest of the clones (Tables 5, 6, Fig 8).
Under the stressed water regime no clone effect was found. Since a significant watering
treatment x clone interaction was identified, data from both treatments were analyzed
separately (table 5).
Table 5: ANCOVA table of specific hydraulic conductivity (Kxs), using xylem water potential (XWP) (MPa) as covariate
Model Kxs~XWP +clone+XWP*clone
WELL WATERED STRESSED
Source DF Mean
Square F
value Pr > F
DF Mean
Square F
value Pr > F
MODEL 5 2422.87 9.88 <.0001 7 1347.22 2.05 0.0574
ERROR 46 245.13 93 658.69
Factors
XWP 1 4904.61 20.01 <.0001 1 3316.37 5.03 0.0272
CLONE 2 2563.05 10.46 0.0002 3 408.93 0.62 0.6033
XWP*CLONE 2 1029.14 4.2 0.0211 3 366.75 0.56 0.6449
Table 6: Estimates and standard errors of the ANCOVA model Kxs=intercept+ XWP+clonei* (dummy) +XWP* clonei. Pegaso was used as reference group. Solution of t tests. The significance level is 0.05.
AAA
XWP= xylem water potential (MPa)
Parameter kxs estimates Standard Error t Value Pr > |t|
Intercept (reference group )
36.163 6.004 6.02 <.0001
(XWP) -15.941 5.720 -2.79 0.0063
CLONE AF2 60.078 12.369 4.86 <.0001
CLONE I-214 36.020 9.492 3.79 0.0002
CLONE PEGASO 0.000 . . .
Slope
XWP*CLONE AF2 -45.093 17.501 -2.58 0.0113
XWP *CLONE I-214 -16.199 8.6344 -1.88 0.0633
XWP *CLONE PEGASO
0.000 . . .
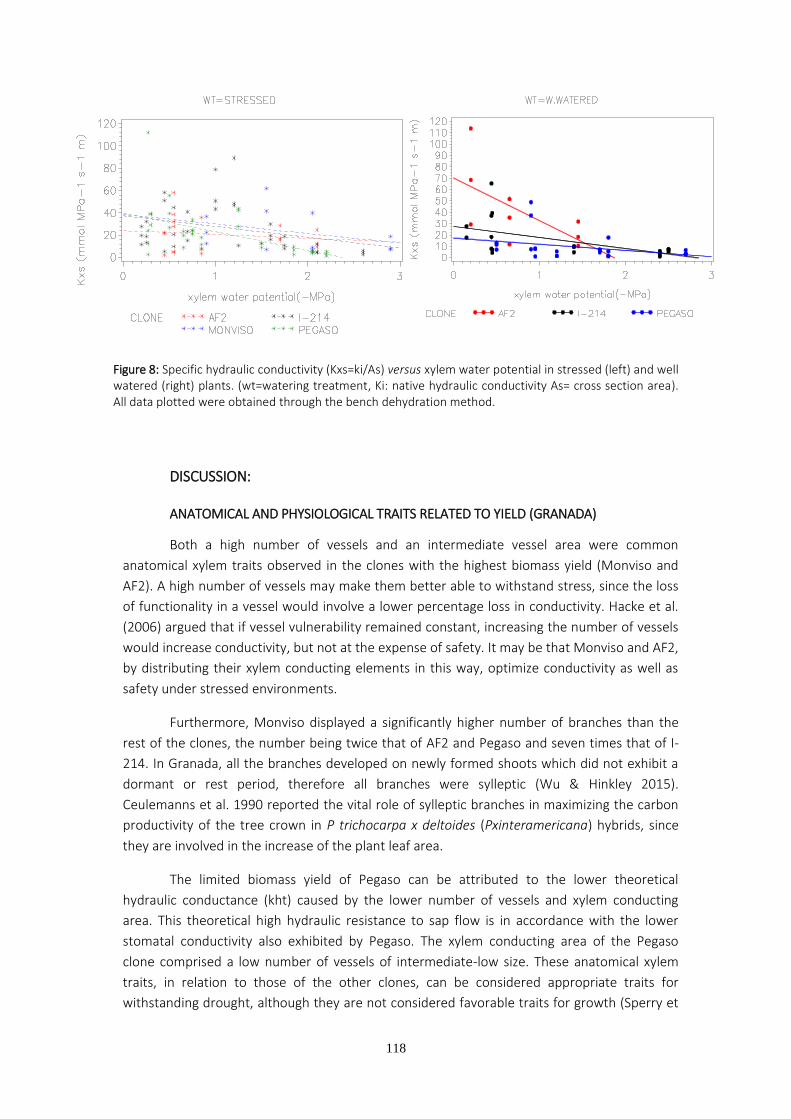
118
Figure 8: Specific hydraulic conductivity (Kxs=ki/As) versus xylem water potential in stressed (left) and well watered (right) plants. (wt=watering treatment, Ki: native hydraulic conductivity As= cross section area). All data plotted were obtained through the bench dehydration method.
DISCUSSION:
ANATOMICAL AND PHYSIOLOGICAL TRAITS RELATED TO YIELD (GRANADA)
Both a high number of vessels and an intermediate vessel area were common
anatomical xylem traits observed in the clones with the highest biomass yield (Monviso and
AF2). A high number of vessels may make them better able to withstand stress, since the loss
of functionality in a vessel would involve a lower percentage loss in conductivity. Hacke et al.
(2006) argued that if vessel vulnerability remained constant, increasing the number of vessels
would increase conductivity, but not at the expense of safety. It may be that Monviso and AF2,
by distributing their xylem conducting elements in this way, optimize conductivity as well as
safety under stressed environments.
Furthermore, Monviso displayed a significantly higher number of branches than the
rest of the clones, the number being twice that of AF2 and Pegaso and seven times that of I-
214. In Granada, all the branches developed on newly formed shoots which did not exhibit a
dormant or rest period, therefore all branches were sylleptic (Wu & Hinkley 2015).
Ceulemanns et al. 1990 reported the vital role of sylleptic branches in maximizing the carbon
productivity of the tree crown in P trichocarpa x deltoides (Pxinteramericana) hybrids, since
they are involved in the increase of the plant leaf area.
The limited biomass yield of Pegaso can be attributed to the lower theoretical
hydraulic conductance (kht) caused by the lower number of vessels and xylem conducting
area. This theoretical high hydraulic resistance to sap flow is in accordance with the lower
stomatal conductivity also exhibited by Pegaso. The xylem conducting area of the Pegaso
clone comprised a low number of vessels of intermediate-low size. These anatomical xylem
traits, in relation to those of the other clones, can be considered appropriate traits for
withstanding drought, although they are not considered favorable traits for growth (Sperry et
119
al. 2007). Poplars are considered pioneers trees (Eckenwalder 96). High hydraulic efficiency
and stomatal conductance are traits of these species that reflect an opportunistic behavior
(Tyree et al., 98).
The AD-ratio is similar to the Carlquist (1977) vulnerability index (VI), with mean vessel
area instead of vessel diameter to vessel density ratio. Higher VI values would provide a rough
indication of the ability of the plant to withstand drought (Scholz et al. 2013). According to
these indexes, the I-214 clone was significantly less able than the others to withstand drought.
As the shoot stem grows, I-214 develops wider vessels, which may lead to higher vulnerability
and therefore low hydraulic conductivity due to dysfunction if a positive link between vessel
diameter and pit properties is considered. Given the high number of shoots developed by I-
214, it would appear that the strategy of this clone is to avoid having excessively wide vessels
by sprouting a greater number of thinner shoots with smaller vessels instead of a few wider
shoots. The low number of branches growing on the shoots of the I-214 clone may have
contributed to a lower leaf area development, which in turn may have reduced plant growth.
Returning to anatomy, if pit properties and vessel diameter were unrelated, wide
vessels might be more cavitation resistant than narrower vessels (Lens et al. 2010). If this was
the case, as suggested by the results from the vulnerability curves, the low biomass yield of
I-214 could be attributed to low conductivity caused by pit impermeability instead of by vessel
embolism dysfunction. This lack of trade-off between growth and vessel diameter was also
found by other authors such as Hajek et al. (2014), who calculated Kht in certain demes of
Populus tremula and P.tremuloides, and found no correlation between growth rate and
theoretical hydraulic conductivity. However, they did find correlation between xylem specific
hydraulic conductivity and growth, suggesting that this could be due to differences in pit
properties between different genotypes.
YIELD-CAVITATION RESISTANCE (MADRID)
The Values of P50 obtained in this work were of the same magnitude as those obtained
by Lenka Plavcová et al. (2012) for a hybrid clone (P. trichocarpa x deltoides).
In addition, in order to relate growth with vulnerability to cavitation, the Madrid trial
was directed towards obtaining a rough estimation of the relationship between cavitation
resistance and xylem anatomy. We use the term ‘rough estimation’ because we are conscious
of the fact that the environmental conditions and soil properties are not identical in the
stressed treatment plots in Madrid and Granada. However both locations have similarly hot,
dry summers without rain or irrigation for two whole months, a high level of irradiance and
maximum temperatures at midday around 35 ºC; hence high evaporative demand and dry soil
conditions. Furthermore, in line with our observations in the present study, Weitz et al. (2006)
reported that average vessel area (in each clone) is determined mainly by stem diameter
rather than height or age. Therefore, there is no reason to believe that stressed plants in
Madrid might have a very different xylem anatomy to those in Granada. The plant diameters
in Madrid fall within the range of plant diameters recorded in Granada. Given that in Granada
I-214 was the clone with the highest vessel diameter and AD-ratio, it was expected to be the
most vulnerable clone under water stress conditions in Madrid. However, the results revealed
the opposite. I-214 proved to be the most resistant clone under stressed conditions along with
120
Monviso, whereas Pegaso and AF2 were more vulnerable than both Monviso and I-214. In
accordance with these results, Beikircher et al. (2013) reported the highest vulnerability to
cavitation in the Malus cultivar with the narrowest vessels. Moreover, AF2, with a significantly
higher number of vessels, was more vulnerable under the stressed water regime than Pegaso,
suggesting that differences in pit properties carry more weight as regards vulnerability to
cavitation than number and diameter of vessels.
Drought-induced vulnerability to cavitation depends on many factors such as number
and diameter of vessels, vessel length (Jacobsen et al. 2012), xylem networking or pit
permeability, which includes mechanical and chemical pit properties (Lens et al. 2010, Awad
et al. 2010, Loepfe et al. 2007, Rockwell et al. 2014). The interaction of all these factors makes
it difficult predict vulnerability from vessel number and diameter and while some authors,
such as Martínez-Vilalta (2002) in different species or Awad et al. (2010) in a hybrid poplar
clone, have found a positive relationship between vessel diameter and vulnerability to
cavitation, others have reported only a weak relationship (Gleason et al. 2015) or no
relationship at all.
In the experimental trial in Madrid, the clones with the highest yield were among the
most cavitation resistant of the clones analyzed separately according to the watering regime
applied. AF2, under the well-watered regime, was more cavitation resistant than I-214, and
Monviso was more resistant than both AF2 and Pegaso under stressed conditions. Pegaso and
I-214 were the clones which yielded the least biomass regardless of the watering regime they
were subjected to and they were grouped as either resistant or vulnerable clones depending
on the watering regime to which they were subjected. Therefore, the clones classified as
resistant do not necessarily exhibit high growth, although it should be noted that within the
genotype range tested it is possible to select the clone with the highest biomass yield and
greatest resistance to cavitation. These results are in accordance with those obtained by
Fichot et al. in 2010, who compared eight unrelated euramerican poplar genotypes and
obtained the highest growth for the most cavitation resistant clonal copies. Guet et al. (2015)
also found no correlation between resistance to cavitation and growth in 33 genotypes of
Populus nigra, although they found relationship between vulnerability to cavitation and
hydraulic efficiency. However, in a study of willows and poplars, Cochard et al. (2007) did find
a correlation between xylem cavitation and yield. This disparity of results is not surprising
considering the above mentioned factors and interactions affecting cavitation resistance in
addition to the known phenotypic plasticity and acclimation ability of poplar (Awad et al. 2010,
Wu & Hincley 2010, Plavcová et al. 2012)
Under the well-watered regime, clone AF2 displayed higher (cross-section) specific
hydraulic conductivity and growth (Fig 3), whereas the most vulnerable to cavitation was the I-
214 clone. Among the stressed plants, no clonal differences were found as regards specific
conductivity but there were differences in vulnerability to cavitation. These results do not
point to an efficiency/safety trade-off, which may mean that it would be possible to find high
yielding clones which are resistant to cavitation. Many authors report that the
efficiency/safety trade-off is far from universal. For example, Maherali et al. (2004), in an
analysis of data from 150 species, found a clear efficiency/safety trade-off in conifers and
evergreen angiosperm but not in deciduous angiosperms. In the case of the latter, no
121
correlation between Ѱ50 and hydraulic conductivity was found. Gleason et al. (2015) found a
weak trade-off in a study of 355 angiosperm species. Similarly, research conducted by Burgess
et al. (2014), working with Sequoia sempervirens.Don, as well as studies undertaken by Fichot
et al. (2010) and Plavcová & Hacke (2012) with poplar, all obtained results that questioned the
universal occurrence of the efficiency/safety trade-off. Of the 355 species tested by Gleason et
al. (2015) some were found to be vulnerable to cavitation and exhibited low efficiency, but
none of them were found to display resistance as well as efficiency.
Clone I-214 had the greatest plasticity as regards vulnerability to cavitation, becoming
the most or the least vulnerable depending on the water treatment, which is supported by
some studies reporting high plasticity in poplar vulnerability to cavitation. Plavcová et al.
(2011, 2012), found differences in pit membrane thickness and porosity when the same
poplar clone was subjected to different irradiance treatments, such that shaded plants were
less cavitation resistant and had a thinner pit membrane. Choat et al. (2008) studied the pit
properties of 14 hardwood species and found that the more vulnerable species had thinner pit
membranes. The new xylem grown by I-214 under stress may have incorporated certain
characteristics that provide it with high cavitation resistance such as less permeable pit
membranes, or shorter vessels, or both, whereas well-watered plants may have suffered pit
fatigue, a well-known occurrence in poplar (Hacke et al.2001, Feng et al. 2015).
In summary, we found clonal differences in xylem anatomical traits and, as expected,
the clone with the widest vessels, I-214, did not exhibit the highest biomass yield under water
stress conditions in Granada, nor was it the highest yielding clone under the well-watered
regime in Madrid. Xylem anatomical characteristics along with the number of sylleptic
branches were useful traits for detecting differences between clones in terms of biomass
yield. Resistance to cavitation is one the traits common to the clones with the highest biomass
yield in Madrid regardless of the water regime to which they were subjected, although it is
also possible to find cavitation resistant but poor yielding clones. There is no clear trade-off
between efficiency and safety.
ACKNOWLEDGEMENTS
The authors wish to thank Estrella Viscasillas, Ernesto Serrallé, J.Pablo de la Iglesia,
Ana Parras and M.Mario Sánchez for their priceless help in the lab and in the field.
REFERENCES
Atkinson C J, Else M A, Taylor L and Dover C J (2003) Root and stem hydraulic conductivity as determinants of growth potential in grafted trees of apple (Malus pumila Mill) Journal of Experimental Botany 54, 385, 1221-1229
Awad H, Barigah T, Badela E, Cochard H Herbette S(2010) Poplar vulnerability to xylem cavitation acclimates to drier soil conditions Physiologia Plantarum 139,280-288 Barigah ST, Charrier O, Douris M, Bonhomme M, Herbette S, Ameglio T, Fichot R, Brignolas F, Cochard H (2013) Water stress-induced xylem hydraulic failure is a causal factor of tree mortality in beech and poplar Annals of Botany 112, 1431-1437
122
Beikircher B, De Cesare C, Mayr S (2013) Hydraulics of high-yield orchard trees: a case study of three Malus domestica cultivars Tree Physiology 33, 12, 1296-1307 Capron M, Tordjeman P, Charru F, Badel E &Cochard H (2014) Gas flow in plant microfluidic networks controlled by capillary valves Physical Review 89, 033019 Carlquist, S 1977 Ecological factors in w ood evolution: a floristic approach AmerJBot64:887-896 Ceulemans, R, Stettler, R F, Hinckley, T M, Isebrands, J G, and Heilman, P E (1990) Crown architecture of Populus clones as determined by branch orientation and branch characteristics. Tree Physiol. 7: 157-1 67. Christmann MA, Sperry JS, Adler FR (2009) Testing the ‘rare pit’ hypothesis for xylem cavitation resistance in three species of Acer. New Phytologist 182, 3, 664-674. Cochard H., Casella E., Mencuccini M. (2007) Xylem vulnerability to cavitation varies among poplar and willow clones and correlates with yield. Tree Physiology 27, 1761-1767. Cochard H, Herbette S, Barigah T, Badel E, Ennajeh M, Vilagrosa A (2010).Does sample length influence the shape of xylem embolism vulnerability curves? A test with the Cavitron spinning technique. Plant Cell and Environment 33, 1543–1552. Cochard H, Badel E, Herbette S, Delzon S, Choat B, Jansen S (2013). Methods for measuring plant vulnerability to cavitation: a critical review. Journal of Experimental Botany 64, 4779-4791. Eckenwalder JE (1996) Biology of Populus and Its Implications for Management and Conservation. Stettler RF, Bradshaw, HD, Heilmann PE, Hinckley, TM Research Press, Otawa, Ontario, Canada. Energy Roundmap 2050 (2012) Luxembourg: Publications Office of the European Union.ISBN 978-92-79-21798-2 doi:10.2833/10759 . Eppler U & Petersen JE (2007) Short Rotation Forestry, Short Rotation Coppice and energy grasses in the European Union: Agro-environmental aspects, present use and perspectives. Background report on current SRF/SRC cropping patterns in Europe. http://iet.jrc.ec.europa.eu/remea/sites/remea/files/files/documents/events/background_paper_final_draft.pdf. Espino S and Schenk HJ (2010) Mind the bubbles: achieving stable measurements of maximum hydraulic conductivity through woody plant samples. Journal of Experimental Botany 62,3 1119-1132. Feng F, Ding F, Tyree MT (2015) Investigations Concerning Cavitation and Frost Fatigue in Clonal 84K Poplar Using High-Resolution Cavitron Measurements.Plant Physiology 168, 144–155.
Fichot R, Laurans F, Monclus R, Moreau A, Pilate G, Brignolas F.(2009) Xylem anatomy correlates with gas exchange, water-use efficiency and growth performance under contrasting water regimes: evidence from Populus deltoides x Populus nigra hybrids. Tree Physiol. 29, 12, 1537-49.
123
Fichot R, Barigah TS, Chamaillard S, Le Thiec D, Laurans F, Cochard H, Brignolas F (2010) Common trade-offs between xylem resistance to cavitation and other physiological traits do not hold among unrelated Populus deltoides x Populus nigra hybrids. Plant Cell and Environment 33, 1553–1568. Fichot R, Brignolas F, Cochard H, Ceulemanns R(2015)Vulnerability to drought-induced cavitation in poplars: synthesis and future opportunities. Plant, Cell and Environment 2015.38,7, 1233-1251. Gleason SM, Westoby M, Jansen S , Choat B , Hacke UG , Pratt RB , Bhaskar B , Brodribb TJ , Bucci SJ , Cao KF, Cochard H, Delzon S, Domec JC , Fan ZX, Field TS, Jacobsen AL , Johnson DM, Lens F, Maherali H, Martınez-Vilalta J, Mayr S, McCulloh KA, Mencuccini M, Mitchell PJ, Morris H , Nardini A, Pittermann J, Plavcova L, Schreiber SG , Sperry JS, Wright IJ and Zanne AE (2015) Weak tradeoff between xylem safety and xylem-specific hydraulic efficiency across the world’s woody plant species. New Phytologist. doi:10.1111/nph.13646. Hacke UG, Sperry JS, Wheeler JK, Castro L (2006). Scaling of angiosperm xylem structure with safety and efficiency. Tree Physiology 26, 619–701. Hacke U, Venturas MD, MacKinnon ED, Jacobsen AL, Sperry JS, Pratt RB (2015)The standard centrifuge method accurately measures vulnerability curves of long-vesselled olive stems. New Phytologist 1, 205, 116-127. Hajek P, Leuschner C, Halter D, Delzon S and Schuldt B (2014).Trade-offs between xylem hydraulic properties, wood anatomy and yield in PopulusTree Physiology 34, 744-756. Harvey HP, Van der Driessche R (1997) Nutrition, xylem cavitation and drought resistance in hybrid poplar. Tree Physiol 17:647–654. http://www.ats.ucla.edu/stat/sas/library/SASNLin_os.htm Nonlinear Regression in SAS. UCLA: Statistical Consulting Group. Jacobsen AL, Pratt RB , Tobin MF , Hacke UG ,Ewers FW (2012) A global analysis of xylem vessel length in woody plants .American Journal Of Botany 99,10, 1583–1591. Lens F, Sperry JS, Christmann MA, Choat B, Rabaey D, Jansen S (2011) Testing hypotheses that link Wood anatomy to cavitation resistance and hydraulic conductivity in the genus Acer. New Phytologist 190,709-723. Loepfe L, Martinez-Vilalta J, Piñol J, Mencuccini M (2007) The relevance of xylem network structure for plant hydraulic efficiency and safety. Journal of Theoretical Biology 247,788-803.
Lo Gullo MA & Salleo S (1991) Three different methods for measuring xylem cavitation and embolism: a comparison. Annals of Botany 67, 417-424. López Cadenas de Llano F, Mintegui Aguirre JA (1982) Hidráulica. Fundación Conde del Valle de Salazar. ETSI Montes. Luostarinen, K and Möttöneen, V (2010) Radial Variation in the Anatomy of Betula pendula Wood from Different Growing Sites. Baltic Forestry 16 (2):209-216. Maherali H, Pockman W T, Jackson R. (2004) Adaptive variation in the vulnerability of woody plants to xylem cavitation. Ecology, 85, 8, 2184-2199.
124
Manzoni S, Vico G, Katul G, Palmroth ., Jackson RB, Porporato A (2013) Hydraulic limits on maximum plant transpiration and the emergence of the safety-efficience trade-off. New Phytologist198, 169-178. Martínez-Vilalta J Pratt E, Oliveras I, Piñol J (2002) Xylem hydraulic properties of roots and stems of nine Mediterranean Woody species. Oecologia133, 19-29. Melcher P J, Holbrook N M, Burns M J, Zwieniecki M A, Cobb A R, Brodribb T J, Choat B, Sack L (2012) Measurements of stem xylem hydraulic conductivity in the laboratory and field. Review.Methods in Ecology and Evolution 3, 685–694. Pammenter NW & Vander Willigen C. (1998). A mathematical and statistical analysis of the curves illustrating vulnerability of xylem to cavitation. Tree Physiology18, 589-593. Plavcová L, Hacke U.G. & Sperry J.S. (2011) Linking irradiance-induced changes in pit membrane ultrastructure with xylem vulnerability to cavitation. Plant, Cell and Environment34, 501-513. Plavcová L &Hacke UG (2012) Phenotypic and developmental plasticity of xylem in hybrid poplar saplings subjected to experimental drought, nitrogen fertilization, and shading. Journal of Experimental Botany 63, 6481-6491. Plavcová L, Jansen S, Klepsch M, Hacke UG (2013) Nobody’s perfect: can irregularities in pit structure influence vulnerability to cavitation?. Frontiers in plant science http://dx.doi.org/10.3389/fpls.2013.00453. Rockwell FE, Wheeler J K, Holbroodk NM (2014) Cavitation and its discontents: Opportunities for resolving current controversies. Plant physiology 164, 1649-1660. SAS 9.2. STAT. Users guide SAS Institute, Cary, NC. Sixto H., Salvia J., Barrio M., Ciria M.P., Cañellas I. (2010) Genetic variation and genotype-environment interactions in short rotation Populus plantations in southern Europe. DOI 10.1007/s11056-010-9244-6. Sperry, JS, Meinzer, FC and McCulloh, KA (2008) Safety and efficiency conflicts in hydraulic architecture: scaling from tissues to trees. Plant, Cell & Environment, 31: 632–645. doi:10.1111/j.1365-3040.2007.01765.x. Sperry JS, Christmann MA, Torres-Ruiz JM, Taneda H, Smith DD (2012) Vulnerability curves by centrifugation: is there an open vessel artefact, and are ‘r’ shaped curves necessarily invalid? Plant Cell Environ. 35(3):601-10. Tyree MT, Zimmermann MH (2002) Xylem structure and the ascent of sap. Springer Verlag Berlin Heidelberg New York. Tyree, MT, Davis SD and Cochard H. (1994) Biophysical perspectives of xylem evolution—is there a tradeoff of hydraulic efficiency for vulnerability to dysfunction? IAWA J. 15:335. Van Ieperen W, Nijsse J, Keijzer CJ, Van Meeteren U. (2001) Induction of air embolism in xylem conduits of pre-defined diameter. Journal of Experimental Botany 52,981-991.

125
Wheeler JK, Sperry JS, Hacke U, Hoang N (2005) Inter-vessel pitting and cavitation in Woody Rosaceae and other vesselled plants: a basis for a safety versus efficiency trade-off in xylem transport. Plant, Cell and Environment 28, 800-812. Weitz JS, Ogle K, Horn HS (2006) 20, 191-199 Ontogenetically stable hydraulic design in woody plants. Functional Ecology Wu R, Hincley TM (2001) Phenotypic Plasticity of Sylleptic Branching: Genetic Design of Tree Architecture. Critical Reviews In Plant Sciences 20(5):467-485.

126
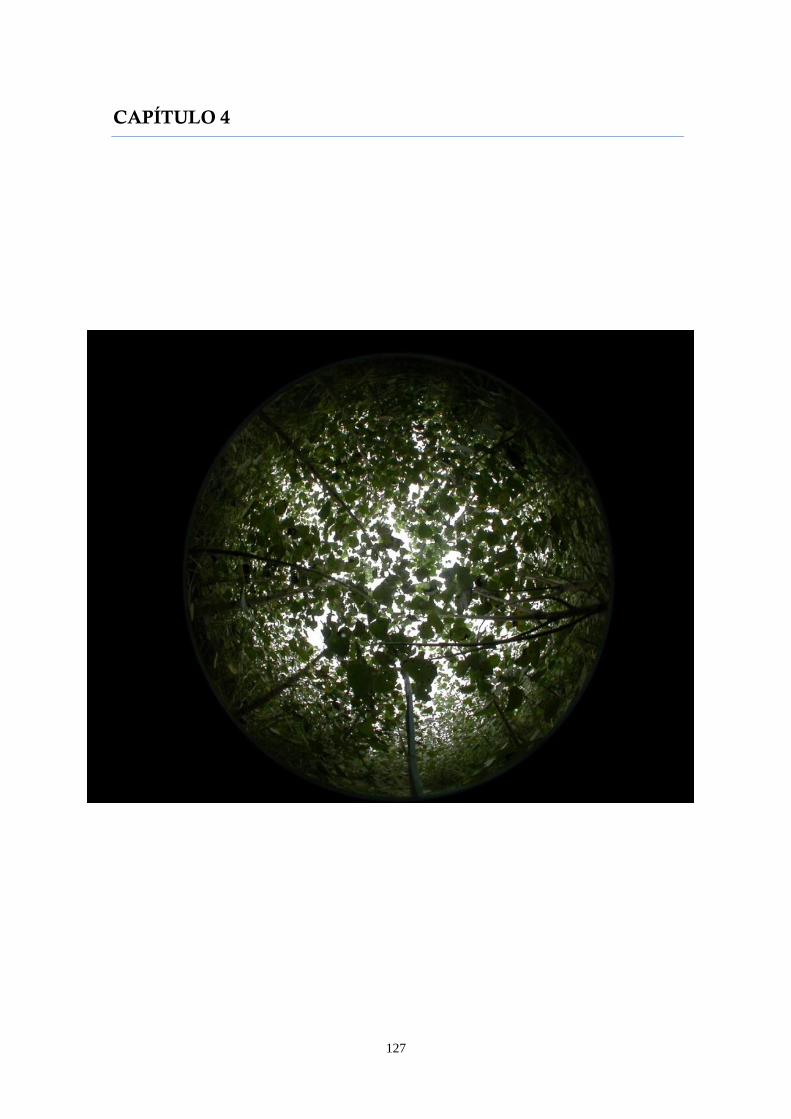
127
CAPÍTULO 4

128
129
CAPÍTULO 4
EVOLUTION OF LEAF AREA INDEX IN TWO POPLAR SHORT ROTATION ENERGY CROPS. COMPARISON BETWEEN DIRECT AND INDIRECT LAI ESTIMATION METHODS
RESUMEN
En dos plantaciones de chopo destinadas a producción de biomasa con fines
energéticos (plantaciones de alta densidad y turno corto), se han medido durante dos años
consecutivos la producción de biomasa seca y el índice de área foliar, este último por dos
métodos: (i) semidirecto, mediante pesada de todas las hojas de una muestra de árboles, e
(ii), indirectamente mediante toma de fotos hemisféricas y aplicación de modelos de ajuste de
la fracción de huecos de la cubierta.
Se han utilizado tres modelos diferentes para estimar el índice de área foliar a partir
de la fracción de huecos obtenida por digitalización de las fotografías hemisféricas. Estos
modelos son el modelo de Poisson y dos modelos más propuestos recientemente para pino
silvestre y que aportan al modelo de Poisson un factor de corrección para el agrupamiento de
las hojas: el primero contempla independientemente el efecto de agrupamiento de las hojas y
el efecto de inclinación de las mismas, y el segundo pondera el efecto de ambos factores en
función del ángulo que forma el rayo de luz incidente con el cénit.
Los resultados muestran una buena correlación entre la producción y el índice de área
foliar ya sea medido de forma semi-directa o indirectamente. El modelo para estimar el índice
de área foliar que mejor se ajusta a la fracción de huecos medida en las fotografías
hemisféricas es el tercer modelo presentado propuesto para pino silvestre. Se propone el
estudio de la evolución del índice de área foliar en estas plantaciones estimándolo
indirectamente a partir de fotografías hemisféricas y utilizando los modelos que aportan
modificaciones al modelo de Poisson así como probar nuevos modelos en las masas plantadas
con diseños más irregulares.
Palabras clave
Índice de área foliar, biomasa, cultivos energéticos, fotografías hemisféricas
130
EVOLUTION OF LEAF AREA INDEX IN TWO POPLAR SHORT ROTATION ENERGY CROPS. COMPARISON BETWEEN DIRECT AND INDIRECT LAI ESTIMATION METHODS
HERNÁNDEZ GARASA, M.J.1, MONTES PITA F.1, PITA ANDREU P.2, VISCASILLAS GÓMEZ, A.1,
SIXTO BLANCO, H1.,CAÑELLAS REY DE VIÑAS, I.1
1 Dpto. Sistemas y Recursos Forestales. CIFOR-INIA. Ctra La Coruña km 7,5. Madrid 28040.
2 Dpto. de Silvopascicultura, Universidad Politécnica de Madrid, Ciudad Universitaria s/n, 28040, Madrid.
ABSTRACT
In 2006 and 2007, biomass production and leaf area index (LAI) were measured at two
short rotation poplar plantations located around 250 Km apart. LAI was measured by means of
both (i) direct measurements, which involved weighing all the leaves of some trees and
measuring their leaf areas, and (ii), indirect measurements, through the application of models
that relate LAI to the skygap distribution recorded in hemispherical photographs.
Three different models were used in order to estimate LAI from the gap fraction
obtained by digitalizing hemispherical photographs. The first model employed was the Poisson
distribution model, and then two other models initially proposed for Pinus sylvestris L., both of
which add a correction factor to the Poisson model for clumping of leaves and branches. The
difference between the two latter models was that one of them includes the clumping effect
of leaves and the foliage inclination effect as independent effects, whereas the second model
considers both effects weighted by the angle formed by the beam direction with the zenith.
The LAI results and biomass production were highly correlated regardless of the LAI
method considered.
The model which considered clumping and foliage inclination effects weighted by the
angle of beam direction and the zenith was the one that provided the best fit to the gap
fraction distribution measured on hemispherical photographs. The use of the two latter
models is proposed for the indirect LAI estimation method in order to assess the evolution of
LAI over time in this type of plantation. Further modifications are recommended in order to
solve the problem of infraestimation of the LAI where planting designs are uneven.
131
INTRODUCTION
Recurrent increases in oil cost, along with the challenges posed by climate change
have led to the rise in investment by governments in the development of renewable energy
sources in order to contribute to a clean, sustainable energy supply and maintain a net neutral
carbon balance.
As part of the current Renewable Energy promotion plan (PANER in Spanish) (2011-
2012) the Spanish government has applied the main European guidelines on renewable
energy (directive 2009/28/CEE) in accordance with the particular circumstances of the country
in an attempt to create the conditions needed to increase the use and development of
biomass as an energy source. The creation of a biomass trade is an important objective in the
push to increase the contribution of renewable energy sources to the gross Energy
consumption in Spain to 20% by 2020.
Among the woody energy crops, poplar is one of the most widespread in the
Mediterranean area because of its high plasticity, high growth and ease of propagation. These
pioneer species trees are competition tolerant, which allows them to become established and
survive safely in crowded plantings and they are also suited to regular harvesting every few
years. These are common silvicultural practices in short rotation woody crops.
The rotation that maximizes volume production (optimum rotation) is unknown at the
beginning of the plantation. Strong & Hansen (1993) hypothesized that the time needed to
reach maximum mean annual biomass productivity (optimum rotation) is linearly related to
the time required for canopy closure. In the field, the moment at which canopy closure is
reached is not evident, and determining the optimum rotation requires the measurement of
current annual biomass increment and the calculation of mean annual increment.
Many studies have reported a highly significant correlation between leaf area index
(LAI) and biomass production (Verlinden M.S. et al. 2014, Pellis et al., 2004, Fang et al. 1999
Linder., 1985, Zavitovski et al., 1976, Ridge et al., 1986, Dunlap & Stettler, 1998). Therefore
the LAI estimation in this type of plantations could provide useful information with regard to
the moment at which canopy closure and optimum rotation length is reached.
Apart from identifying the rotation length that maximizes biomass or volume, it is also
important to determine which genotypes are capable of yielding a greater amount of biomass
and whether any of them yield more biomass with a lower LAI, that is, genotypes with more
efficient foliage. Pellis et al (2004) tested different poplar clones in a short rotation coppice
culture and reported that LAI was the main genetically controlled foliar variable underlying
biomass productivity.
The overall objective of this study is to use indirect approaches to estimate future LAI,
in turn determining the moment of canopy closure, and to compare the LAI of different
genotypes. With this objective in mind we attempt to determine whether LAI estimation from
hemispherical photographs is a sufficiently reliable approach for use in the comparison of
different genotypes, different years and at different sites. The specific objectives are (1) to
compare LAI obtained from direct estimations with LAI obtained using indirect (hemispherical
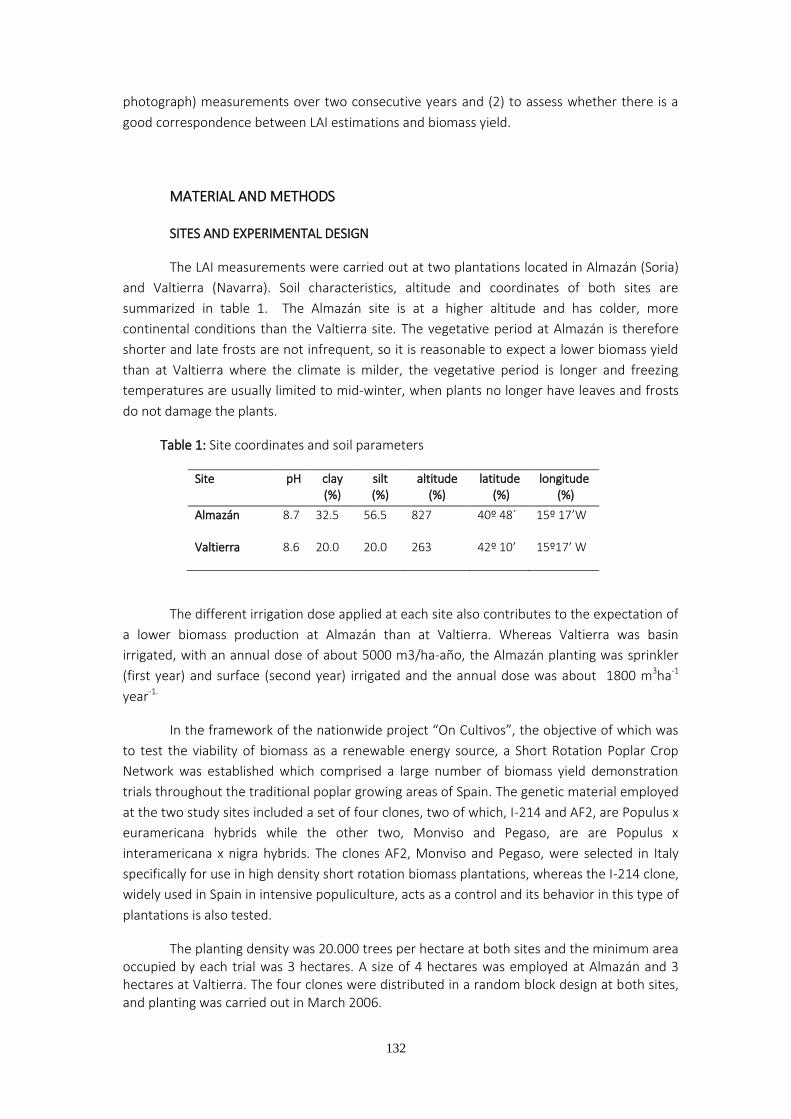
132
photograph) measurements over two consecutive years and (2) to assess whether there is a
good correspondence between LAI estimations and biomass yield.
MATERIAL AND METHODS
SITES AND EXPERIMENTAL DESIGN
The LAI measurements were carried out at two plantations located in Almazán (Soria)
and Valtierra (Navarra). Soil characteristics, altitude and coordinates of both sites are
summarized in table 1. The Almazán site is at a higher altitude and has colder, more
continental conditions than the Valtierra site. The vegetative period at Almazán is therefore
shorter and late frosts are not infrequent, so it is reasonable to expect a lower biomass yield
than at Valtierra where the climate is milder, the vegetative period is longer and freezing
temperatures are usually limited to mid-winter, when plants no longer have leaves and frosts
do not damage the plants.
Table 1: Site coordinates and soil parameters
Site pH clay (%)
silt (%)
altitude (%)
latitude (%)
longitude (%)
Almazán 8.7 32.5 56.5 827 40º 48´ 15º 17’W
Valtierra 8.6 20.0 20.0 263 42º 10’ 15º17’ W
The different irrigation dose applied at each site also contributes to the expectation of
a lower biomass production at Almazán than at Valtierra. Whereas Valtierra was basin
irrigated, with an annual dose of about 5000 m3/ha-año, the Almazán planting was sprinkler
(first year) and surface (second year) irrigated and the annual dose was about 1800 m3ha-1
year-1.
In the framework of the nationwide project “On Cultivos”, the objective of which was
to test the viability of biomass as a renewable energy source, a Short Rotation Poplar Crop
Network was established which comprised a large number of biomass yield demonstration
trials throughout the traditional poplar growing areas of Spain. The genetic material employed
at the two study sites included a set of four clones, two of which, I-214 and AF2, are Populus x
euramericana hybrids while the other two, Monviso and Pegaso, are are Populus x
interamericana x nigra hybrids. The clones AF2, Monviso and Pegaso, were selected in Italy
specifically for use in high density short rotation biomass plantations, whereas the I-214 clone,
widely used in Spain in intensive populiculture, acts as a control and its behavior in this type of
plantations is also tested.
The planting density was 20.000 trees per hectare at both sites and the minimum area occupied by each trial was 3 hectares. A size of 4 hectares was employed at Almazán and 3 hectares at Valtierra. The four clones were distributed in a random block design at both sites, and planting was carried out in March 2006.
133
Planting designs were different at each site. At Valtierra, 20 cm long unrooted cuttings
were planted at 0.5 m spacing in rows 1 m apart, whereas at Almazán planting followed a
double row design with alternate rows spaced 0.5 and 3 meters apart and a spacing of about
33cm between plants in each row.
In 2006, weed control and fertilization were carried out at both sites. Weed control
was done before and after planting by applying herbicides; Oxyfluorfen (4l ha-1) prior to
planting and Glufosinate Ammonium at the same dose after planting. Mechanical weeding
procedures were also used. A basic dressing was applied to the soil at Almazán using 400 Kg
ha-1 of N:P:K 12:22:22 and at Valtierra 1790 Kg ha-1 of 9:23:30 NPK complex was applied.
Fertilization was carried out at Almazán by applying 250Kg ha-1 of Calcium Amonium Nitrate
and at Valtierra by adding 520 Kg ha-1 of the same fertilizer. In the winter of 2006-2007, the
plantations were cut back in order to promote resprouting at both sites.
In 2006 at Almazán, both the Monviso and Pegaso clones suffered high mortality
(more than 20%) and a decision was taken to remove the remaining plants of these two clones
and re-plant them in March 2007. The only exceptions were Monviso plants in block1, where
mortality was not as high so the plants were not removed. Hence, in the 2007 vegetative, the
Monviso and Pegaso plants (except the Monviso block 1) had younger root systems than
plants belonging to the I-214 and AF2 clones.
In the second year of the plantations, top dressing was only carried out in Almazán,
where 600Kg ha-1 of a NPK 12:24:12complex fertilizer was applied.
LAI measurements were taken in September 2006 and 2007 prior to shedding and
after bud closure, once the growing period was over. Biomass measurements were recorded
after shedding in winter 2006 and 2007.
INDIRECT LAI MEASUREMENTS
Every year in September, for each site, clone and block, a representative plot was
selected in order to estimate LAI from hemispherical photographs. Six evenly spaced
photographs were taken on the diagonal of a square with sides of equal length to the repeat
unit of the planting design: e.g. 1m in Valtierra and 3.5 m in the case of Almazán, and
positioned with one of its sides on a plantation row.
Positioning the camera to take photographs right at the center and at the extremes of
the diagonal was avoided so as not to include the most favorable and least favorable cases of
LAI estimation.
A Nikon ® FM camera with a Sigma 8mm fisheye lens was used on a 20 cm high
adjustable level tripod. The LAI was estimated from this height upwards. In the two first years
of these plantations the trees had leaves from the base to the top.
The photographs were analyzed using the Hemiview 2.1, Canopy Analysis Software
(Delta-T Devices Ltd.). This program provides the gap fraction (P0) for each azimuth and zenith
combination selected in all the photographs. Three different models were fitted to the P0 data
obtained from Hemiview in order to obtain LAI.
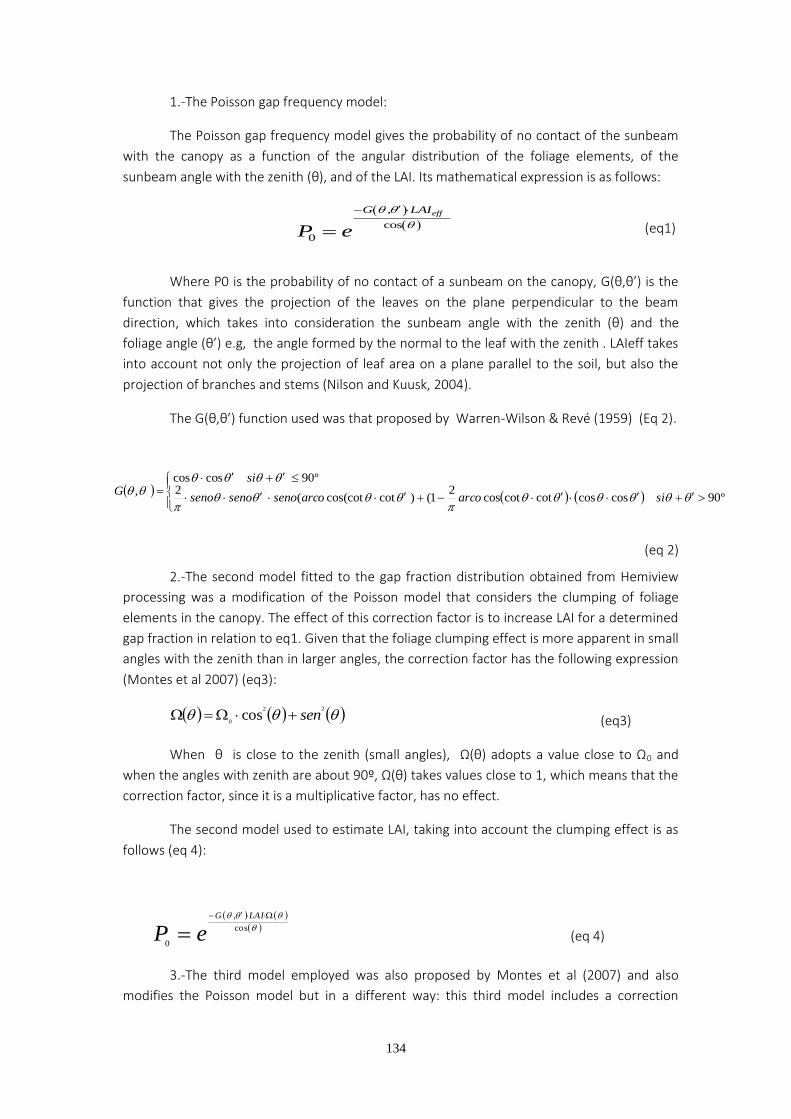
134
1.-The Poisson gap frequency model:
The Poisson gap frequency model gives the probability of no contact of the sunbeam
with the canopy as a function of the angular distribution of the foliage elements, of the
sunbeam angle with the zenith (θ), and of the LAI. Its mathematical expression is as follows:
(eq1)
Where P0 is the probability of no contact of a sunbeam on the canopy, G(θ,θ’) is the
function that gives the projection of the leaves on the plane perpendicular to the beam
direction, which takes into consideration the sunbeam angle with the zenith (θ) and the
foliage angle (θ’) e.g, the angle formed by the normal to the leaf with the zenith . LAIeff takes
into account not only the projection of leaf area on a plane parallel to the soil, but also the
projection of branches and stems (Nilson and Kuusk, 2004).
The G(θ,θ’) function used was that proposed by Warren-Wilson & Revé (1959) (Eq 2).
º90coscoscotcotcos2
1()cotcos(cot(2
º90coscos, ´´
´
'
siarcoarcosenosenoseno
siG
(eq 2)
2.-The second model fitted to the gap fraction distribution obtained from Hemiview
processing was a modification of the Poisson model that considers the clumping of foliage
elements in the canopy. The effect of this correction factor is to increase LAI for a determined
gap fraction in relation to eq1. Given that the foliage clumping effect is more apparent in small
angles with the zenith than in larger angles, the correction factor has the following expression
(Montes et al 2007) (eq3):
22
0cos sen (eq3)
When θ is close to the zenith (small angles), Ω(θ) adopts a value close to Ω0 and
when the angles with zenith are about 90º, Ω(θ) takes values close to 1, which means that the
correction factor, since it is a multiplicative factor, has no effect.
The second model used to estimate LAI, taking into account the clumping effect is as
follows (eq 4):
cos
,
0
LAIG
eP (eq 4)
3.-The third model employed was also proposed by Montes et al (2007) and also
modifies the Poisson model but in a different way: this third model includes a correction
,
cos
0
effG LAI
P e
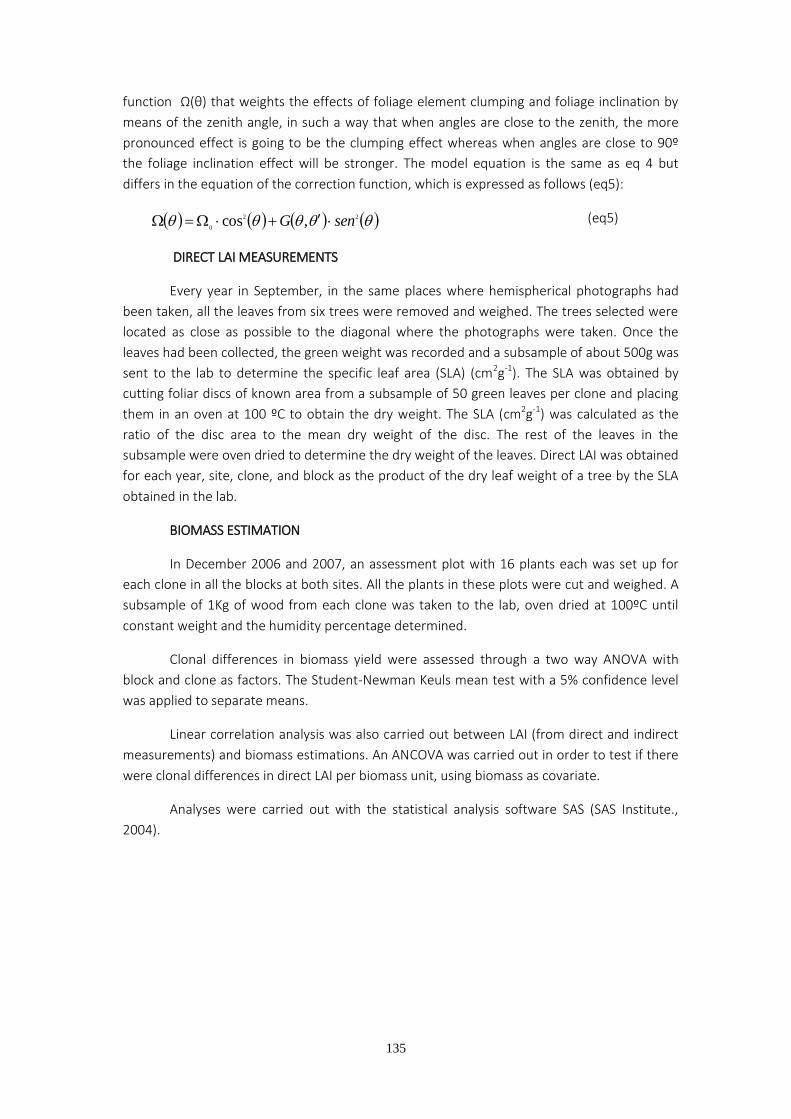
135
function Ω(θ) that weights the effects of foliage element clumping and foliage inclination by
means of the zenith angle, in such a way that when angles are close to the zenith, the more
pronounced effect is going to be the clumping effect whereas when angles are close to 90º
the foliage inclination effect will be stronger. The model equation is the same as eq 4 but
differs in the equation of the correction function, which is expressed as follows (eq5):
22
0,cos senG (eq5)
DIRECT LAI MEASUREMENTS
Every year in September, in the same places where hemispherical photographs had
been taken, all the leaves from six trees were removed and weighed. The trees selected were
located as close as possible to the diagonal where the photographs were taken. Once the
leaves had been collected, the green weight was recorded and a subsample of about 500g was
sent to the lab to determine the specific leaf area (SLA) (cm2g-1). The SLA was obtained by
cutting foliar discs of known area from a subsample of 50 green leaves per clone and placing
them in an oven at 100 ºC to obtain the dry weight. The SLA (cm2g-1) was calculated as the
ratio of the disc area to the mean dry weight of the disc. The rest of the leaves in the
subsample were oven dried to determine the dry weight of the leaves. Direct LAI was obtained
for each year, site, clone, and block as the product of the dry leaf weight of a tree by the SLA
obtained in the lab.
BIOMASS ESTIMATION
In December 2006 and 2007, an assessment plot with 16 plants each was set up for
each clone in all the blocks at both sites. All the plants in these plots were cut and weighed. A
subsample of 1Kg of wood from each clone was taken to the lab, oven dried at 100ºC until
constant weight and the humidity percentage determined.
Clonal differences in biomass yield were assessed through a two way ANOVA with
block and clone as factors. The Student-Newman Keuls mean test with a 5% confidence level
was applied to separate means.
Linear correlation analysis was also carried out between LAI (from direct and indirect
measurements) and biomass estimations. An ANCOVA was carried out in order to test if there
were clonal differences in direct LAI per biomass unit, using biomass as covariate.
Analyses were carried out with the statistical analysis software SAS (SAS Institute.,
2004).
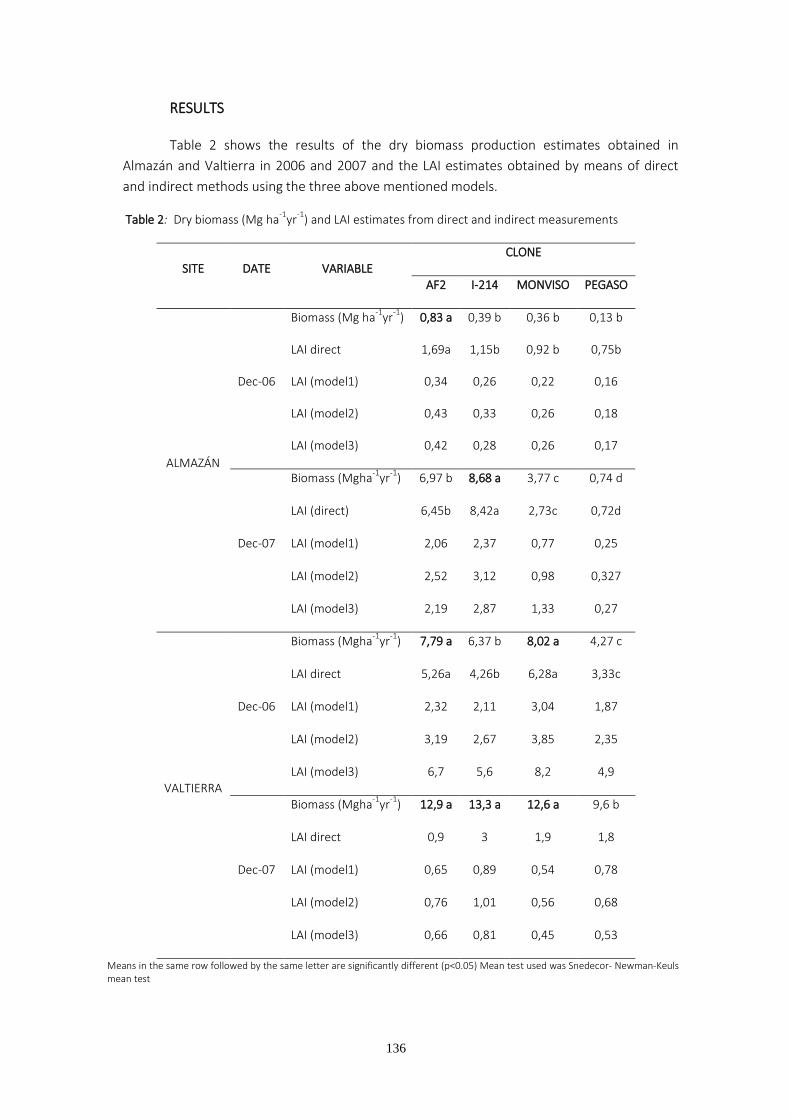
136
RESULTS
Table 2 shows the results of the dry biomass production estimates obtained in
Almazán and Valtierra in 2006 and 2007 and the LAI estimates obtained by means of direct
and indirect methods using the three above mentioned models.
Table 2: Dry biomass (Mg ha-1
yr-1
) and LAI estimates from direct and indirect measurements
SITE DATE VARIABLE CLONE
AF2 I-214 MONVISO PEGASO
ALMAZÁN
Dec-06
Biomass (Mg ha-1
yr-1
) 0,83 a 0,39 b 0,36 b 0,13 b
LAI direct 1,69a 1,15b 0,92 b 0,75b
LAI (model1) 0,34 0,26 0,22 0,16
LAI (model2) 0,43 0,33 0,26 0,18
LAI (model3) 0,42 0,28 0,26 0,17
Dec-07
Biomass (Mgha-1
yr-1
) 6,97 b 8,68 a 3,77 c 0,74 d
LAI (direct) 6,45b 8,42a 2,73c 0,72d
LAI (model1) 2,06 2,37 0,77 0,25
LAI (model2) 2,52 3,12 0,98 0,327
LAI (model3) 2,19 2,87 1,33 0,27
VALTIERRA
Dec-06
Biomass (Mgha-1
yr-1
) 7,79 a 6,37 b 8,02 a 4,27 c
LAI direct 5,26a 4,26b 6,28a 3,33c
LAI (model1) 2,32 2,11 3,04 1,87
LAI (model2) 3,19 2,67 3,85 2,35
LAI (model3) 6,7 5,6 8,2 4,9
Dec-07
Biomass (Mgha-1
yr-1
) 12,9 a 13,3 a 12,6 a 9,6 b
LAI direct 0,9 3 1,9 1,8
LAI (model1) 0,65 0,89 0,54 0,78
LAI (model2) 0,76 1,01 0,56 0,68
LAI (model3) 0,66 0,81 0,45 0,53
Means in the same row followed by the same letter are significantly different (p<0.05) Mean test used was Snedecor- Newman-Keuls mean test
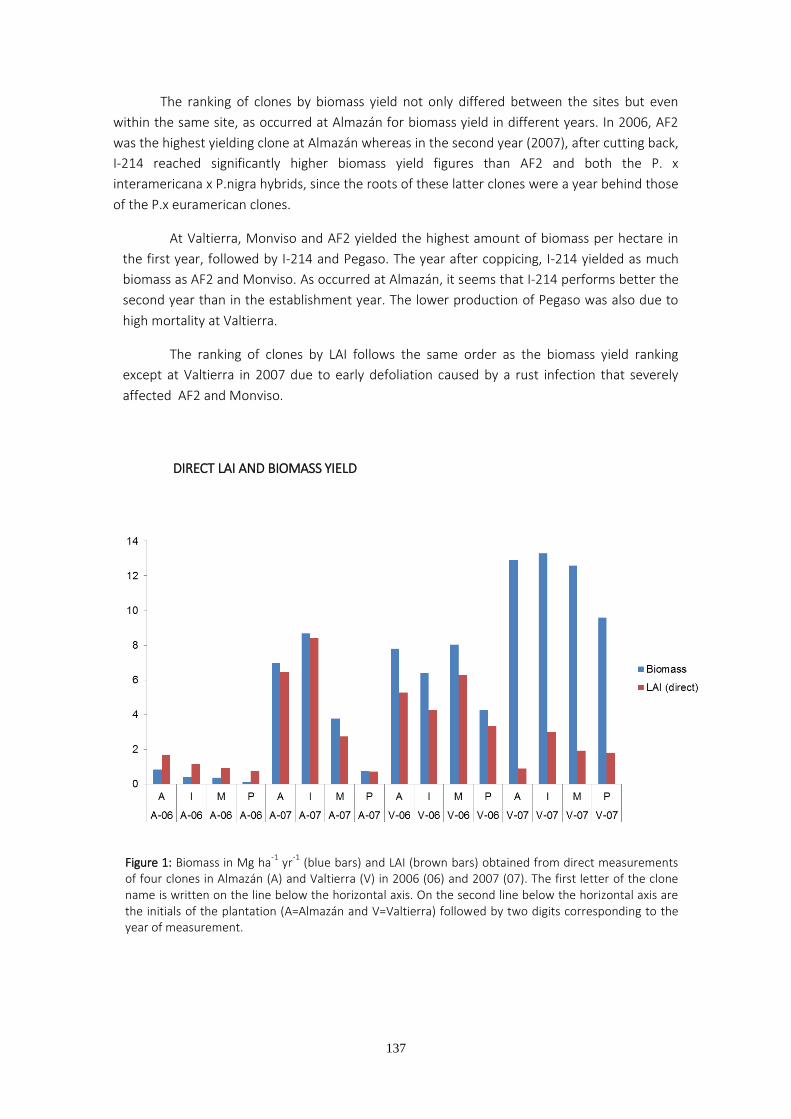
137
The ranking of clones by biomass yield not only differed between the sites but even
within the same site, as occurred at Almazán for biomass yield in different years. In 2006, AF2
was the highest yielding clone at Almazán whereas in the second year (2007), after cutting back,
I-214 reached significantly higher biomass yield figures than AF2 and both the P. x
interamericana x P.nigra hybrids, since the roots of these latter clones were a year behind those
of the P.x euramerican clones.
At Valtierra, Monviso and AF2 yielded the highest amount of biomass per hectare in
the first year, followed by I-214 and Pegaso. The year after coppicing, I-214 yielded as much
biomass as AF2 and Monviso. As occurred at Almazán, it seems that I-214 performs better the
second year than in the establishment year. The lower production of Pegaso was also due to
high mortality at Valtierra.
The ranking of clones by LAI follows the same order as the biomass yield ranking
except at Valtierra in 2007 due to early defoliation caused by a rust infection that severely
affected AF2 and Monviso.
DIRECT LAI AND BIOMASS YIELD
Figure 1: Biomass in Mg ha-1
yr-1
(blue bars) and LAI (brown bars) obtained from direct measurements of four clones in Almazán (A) and Valtierra (V) in 2006 (06) and 2007 (07). The first letter of the clone name is written on the line below the horizontal axis. On the second line below the horizontal axis are the initials of the plantation (A=Almazán and V=Valtierra) followed by two digits corresponding to the year of measurement.
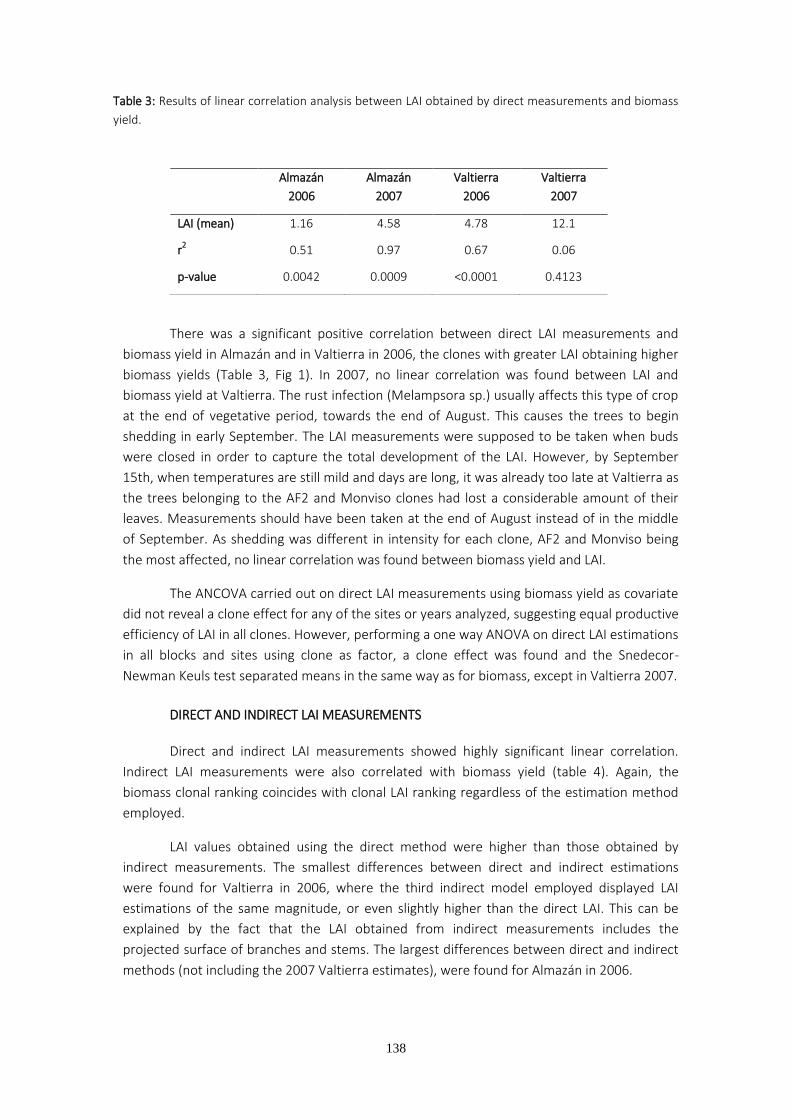
138
Table 3: Results of linear correlation analysis between LAI obtained by direct measurements and biomass
yield.
There was a significant positive correlation between direct LAI measurements and
biomass yield in Almazán and in Valtierra in 2006, the clones with greater LAI obtaining higher
biomass yields (Table 3, Fig 1). In 2007, no linear correlation was found between LAI and
biomass yield at Valtierra. The rust infection (Melampsora sp.) usually affects this type of crop
at the end of vegetative period, towards the end of August. This causes the trees to begin
shedding in early September. The LAI measurements were supposed to be taken when buds
were closed in order to capture the total development of the LAI. However, by September
15th, when temperatures are still mild and days are long, it was already too late at Valtierra as
the trees belonging to the AF2 and Monviso clones had lost a considerable amount of their
leaves. Measurements should have been taken at the end of August instead of in the middle
of September. As shedding was different in intensity for each clone, AF2 and Monviso being
the most affected, no linear correlation was found between biomass yield and LAI.
The ANCOVA carried out on direct LAI measurements using biomass yield as covariate
did not reveal a clone effect for any of the sites or years analyzed, suggesting equal productive
efficiency of LAI in all clones. However, performing a one way ANOVA on direct LAI estimations
in all blocks and sites using clone as factor, a clone effect was found and the Snedecor-
Newman Keuls test separated means in the same way as for biomass, except in Valtierra 2007.
DIRECT AND INDIRECT LAI MEASUREMENTS
Direct and indirect LAI measurements showed highly significant linear correlation.
Indirect LAI measurements were also correlated with biomass yield (table 4). Again, the
biomass clonal ranking coincides with clonal LAI ranking regardless of the estimation method
employed.
LAI values obtained using the direct method were higher than those obtained by
indirect measurements. The smallest differences between direct and indirect estimations
were found for Valtierra in 2006, where the third indirect model employed displayed LAI
estimations of the same magnitude, or even slightly higher than the direct LAI. This can be
explained by the fact that the LAI obtained from indirect measurements includes the
projected surface of branches and stems. The largest differences between direct and indirect
methods (not including the 2007 Valtierra estimates), were found for Almazán in 2006.
Almazán
2006
Almazán
2007
Valtierra
2006
Valtierra
2007
LAI (mean) 1.16 4.58 4.78 12.1
r2 0.51 0.97 0.67 0.06
p-value 0.0042 0.0009 <0.0001 0.4123
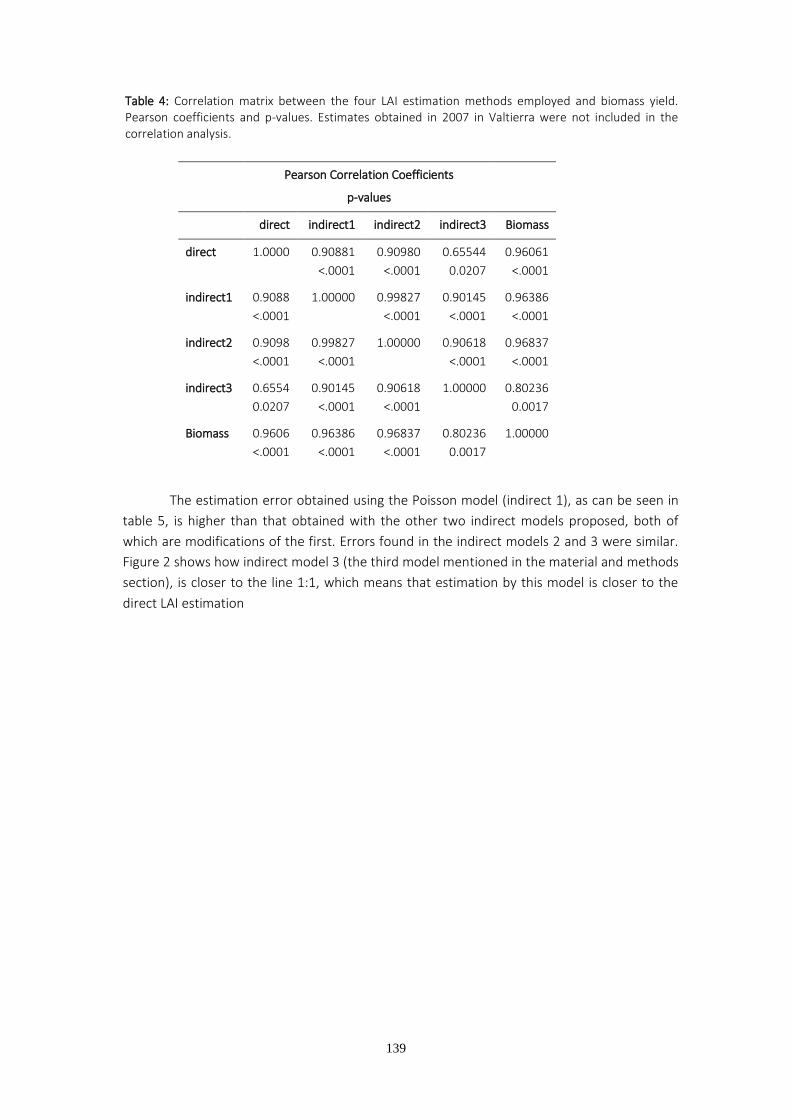
139
Table 4: Correlation matrix between the four LAI estimation methods employed and biomass yield. Pearson coefficients and p-values. Estimates obtained in 2007 in Valtierra were not included in the correlation analysis.
The estimation error obtained using the Poisson model (indirect 1), as can be seen in
table 5, is higher than that obtained with the other two indirect models proposed, both of
which are modifications of the first. Errors found in the indirect models 2 and 3 were similar.
Figure 2 shows how indirect model 3 (the third model mentioned in the material and methods
section), is closer to the line 1:1, which means that estimation by this model is closer to the
direct LAI estimation
Pearson Correlation Coefficients
p-values
direct indirect1 indirect2 indirect3 Biomass
direct
1.0000
0.90881
<.0001
0.90980
<.0001
0.65544
0.0207
0.96061
<.0001
indirect1
0.9088
<.0001
1.00000
0.99827
<.0001
0.90145
<.0001
0.96386
<.0001
indirect2
0.9098
<.0001
0.99827
<.0001
1.00000
0.90618
<.0001
0.96837
<.0001
indirect3
0.6554
0.0207
0.90145
<.0001
0.90618
<.0001
1.00000
0.80236
0.0017
Biomass
0.9606
<.0001
0.96386
<.0001
0.96837
<.0001
0.80236
0.0017
1.00000
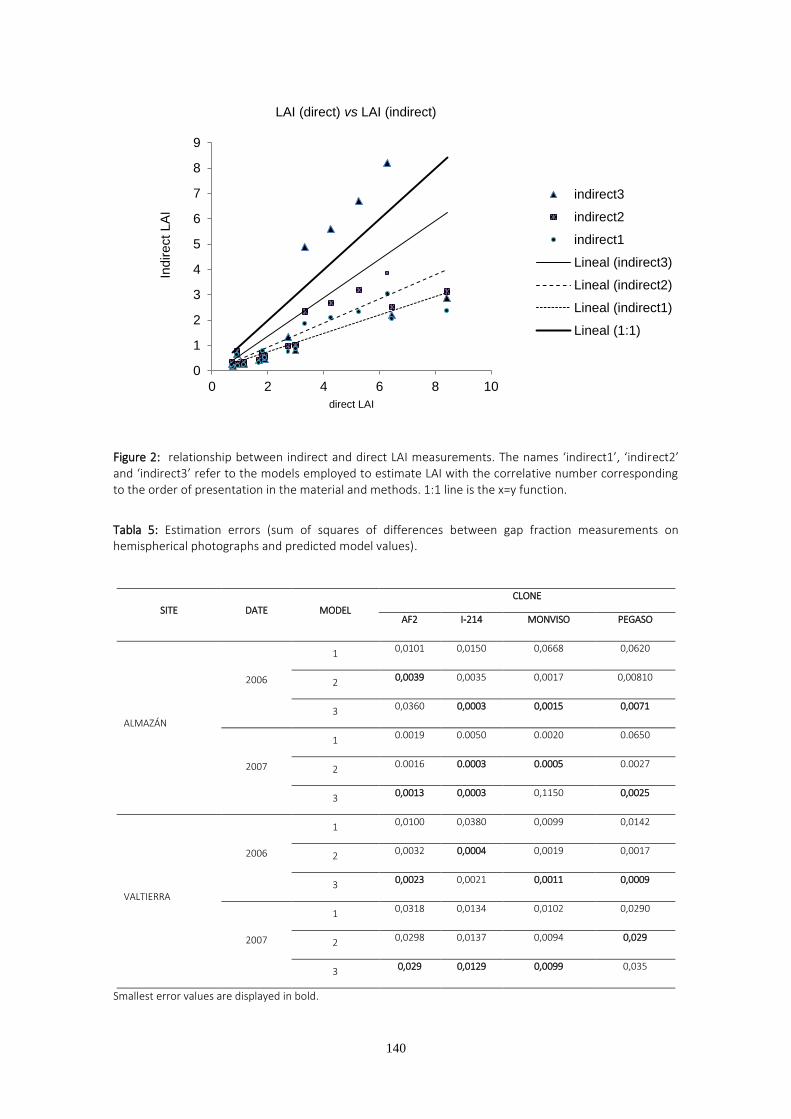
140
Figure 2: relationship between indirect and direct LAI measurements. The names ‘indirect1’, ‘indirect2’ and ‘indirect3’ refer to the models employed to estimate LAI with the correlative number corresponding to the order of presentation in the material and methods. 1:1 line is the x=y function.
Tabla 5: Estimation errors (sum of squares of differences between gap fraction measurements on hemispherical photographs and predicted model values).
SITE DATE MODEL
CLONE
AF2 I-214 MONVISO PEGASO
ALMAZÁN
2006
1 0,0101 0,0150 0,0668 0,0620
2 0,0039 0,0035 0,0017 0,00810
3 0,0360 0,0003 0,0015 0,0071
2007
1 0.0019 0.0050 0.0020 0.0650
2 0.0016 0.0003 0.0005 0.0027
3 0,0013 0,0003 0,1150 0,0025
VALTIERRA
2006
1 0,0100 0,0380 0,0099 0,0142
2 0,0032 0,0004 0,0019 0,0017
3 0,0023 0,0021 0,0011 0,0009
2007
1 0,0318 0,0134 0,0102 0,0290
2 0,0298 0,0137 0,0094 0,029
3 0,029 0,0129 0,0099 0,035
Smallest error values are displayed in bold.
0
1
2
3
4
5
6
7
8
9
0 2 4 6 8 10
Indirect
LA
I
direct LAI
LAI (direct) vs LAI (indirect)
indirect3
indirect2
indirect1
Lineal (indirect3)
Lineal (indirect2)
Lineal (indirect1)
Lineal (1:1)
141
DISCUSSION
The LAI estimation of the probability of no contact of a sunbeam with the canopy is
based on the Beer-Lambert empirical law. This law relates the transmittance of a light beam
that goes through a medium with homogeneous turbidity with the properties of that medium
and with the properties of the light (wavelength).
Monsi & Saeki (1953) adapted the Beer Lambert equation to allow LAI to be estimated
from it by assuming that transmittance is equivalent to gap fraction and that leaves are
randomly distributed and infinitely small compared with the totality of the canopy. In 2006
and 2007 at Almazán, the LAI estimates obtained from the second and third indirect models
underestimated the LAI in relation to direct LAI estimation, whereas in the case of Valtierra in
2006, the LAI estimation provided values which were similar to the direct LAI estimates. The
better behavior of models 2 and 3 in Valtierra may be due to the fact that the initial
hypothesis was fulfilled more precisely. In Valtierra (2006), the trees were larger than in
Almazán (2006) and almost filled the whole hemispherical photograph, from the soil to the
zenith, with the gaps adopting a random distribution. However, at Amazán in the same year,
the trees were much shorter and consequently there was a large central gap without leaves,
corresponding to the space between rows, which violates the hypothesis of randomness of
leaf distribution in the canopy. Breda (2003), in a review of different methods for estimating
LAI, confirmed the fact that indirect LAI estimation methods based on hemispherical
photographs using the Poisson distribution (indirect model 1) always infraestimated LAI due to
the violation of the hypothesis of leaf distribution randomness within the canopy (this is
equivalent to assimilating the canopy to a homogeneously turbid medium). The corrections
proposed for Pinus sylvestris by Montes et al (2007) attempted to mitigate the non-
satisfactioin of that hypothesis. At both sites, models 2 and 3 fitted more accurately than the
Poisson model and yielded higher LAI estimates.
At Almazán in 2007, the trees were as large as in Valtierra (2006) but again the LAI
was infraestimated in comparison to direct LAI estimates. In this case, the plantation design
was not regular, and the spacing between rows was 3m instead of the 1m spacing used in
Valtierra. Hence, at Almazán in 2007 there continued to be a central space without trees so
the hypothesis of randomness was still being violated.
In any case, the LAI ranking by clone was the same, regardless of the estimation
method employed. The same was true of the LAI ranking by year or site, thus allowing
comparison of LAI and biomass yields between clones, years and locations despite the
infraestimations.
Bearing in mind that the end goal of this work is to determine whether indirect LAI
measurements can be reliably used in the future in this type of plantations, and that in the
future trees will be higher and therefore will fill all the hemispherical photograph, the errors
will diminish and the reliability is expected to increase with tree size.
CHASON et al. (1991), using the negative binomial distribution instead the Poisson
distribution, reported an increase of LAI estimates obtained using indirect methods.
142
The negative binomial distribution is less restrictive as regards the fulfillment of initial
conditions. For example, leaves may be considered of negligible size in relation to the canopy.
Clonal differences in biomass and in LAI were found at both Almazán and Valtierra.
Pegaso exhibited the lowest LAI and biomass yield in all cases. AF2 was the highest yielding
clone at both sites along with Monviso. However, AF2, and to a lesser extent Monviso, were
also the most affected by rust infection. Verlinden et al. (2013) in a study including 12 poplar
genotypes reported that rust affection was negatively correlated with biomass growth. This
rust infection could be the reason underlying the changes in the clonal ranking between 2006
and 2007 at both sites. I-214 became the highest yielding clone in 2007 at Almazán, and in
2007 at Valtierra, even surpassing the biomass yield of AF2 and Monviso (although the
differences were not significant). Another factor that could have influenced the changes in
the clonal ranking was the coppicing carried out in winter 2006/2007, which favored the
clones with higher below-ground to above-ground biomass ratio. Scarazzia-Mugnozza et al
(1997), compared the allocation of biomass in different P.trichocarpa x P.deltoides hybrids and
found that the clones which apportioned a higher amount of biomass to the roots exhibited
faster leaf and stem growth early in the following growth season. They also found that the
more branchy clones also had more branchy roots, although the roots did not accumulate
more biomass. This was also reported by Friend et al. (1991). It may be that I-214, the least
branchy clone at both sites in 2006 (data not shown), apportioned more biomass to the roots
than AF2 and Monviso, which displayed greater development of the aerial part, perhaps at the
expense of root development. Thus, the cutting back of the plants, carried out at the end of
the first growing season, could have been particularly advantageous to I-214 and may have
allowed this clone to ‘catch up’ with the Monviso and AF2 clones. In fact, I-214 has hardly ever
been among the highest biomass yielding clones in the Short Rotation Poplar Network, (Sixto
et al 2013), except where the plants have been cut back.
CONCLUSIONS
Indirect methods of LAI estimation are useful for comparing LAI between clones, sites
and years. The modifications to the Poisson distribution proposed by Montes et al (2007)
resulted in less error in the LAI estimation. Biomass was well correlated with LAI regardless of
the method employed. More research is still needed in order to obtain a more accurate LAI
estimation from models which can be applied to all initial conditions.
ACKNOWLEDGEMENTS
This work was carried out in the framework of the On Cultivos (PSE-6-2005) Project,
funded by the Science and Innovation Ministry.
REFERENCES
Breda JJ (2003). Ground-based measurements of leaf area index: a review of methods,
instruments and current controversies. J Expl Bot, 54 2403-2417
Chason JW, Baldocchi D B, Huston MA (1991). A comparison of direct and indirect methods for
estimating forest canopy leaf area. Agric.Forest.Meteor 57 107-128.
143
Dunlap JM, Stettler RF (1998). Genetic variation and productivity of Populus trichocarpa and its
hybrids. X. Trait correlations in young black cottonwood from four river valleys in Washington.
Trees- Struct Funct, 13 28-39.
Fang S, Xu X, Lu S, Tang L (1999) Growth dynamics and biomass production in short-rotation
poplar plantations: 6-year results for three clones at four spacings. Biomass and Bioenergy, 17
(5), 415-425
Friend AL, Scarascia-Mugnozza G, Isebrands JG and Heilman PE (1991). Quantification of two-
year-old hybrid poplar root systems: morphology, biomass, and 14C distribution. Tree Physiology
8. 109-119
Monsi M, Saeki T (2005). On the factor light in plant communities and its importance for matter
production. Ann Botany, 95 549-567.
Montes F, Pita P, Rubio A, Cañellas I (2007). Leaf area index estimation in mountain even-aged
Pinus Silvestris L. stands from hemispherical photographs. Agric.Forest.Meteor, 145 215-228.
Pellis A, Laureysens I, Ceulemans R (2004). Growth and production of a short rotation coppice
culture of poplar I. Clonal differences in leaf characteristics in relation to biomass production.
Biomass Bionergy, 27, 9-19.
Ridge CR, Hinckley TM, Stettler RE, Van Volkenburgh E (1986). Leaf growth characteristics of fast
growing poplar hybrids Populus trichocarpa x P.deltoides. Tree Physiol, 1 209-216.
SAS 9.1 STAT. User´s guide. SAS Institute, Cary, N.C.
Scaracia-Mugnozza G E, R Ceulemans, P E Heilman, J G Isebrands, R F Stettler, T M Hinckley
(1997) Production physiology and morphology of Populus species and their hybrids grown
under short rotation. II. Biomass components and harvest index of hybrid and parental species
clones. Canadian Journal of Forest Research, 1997, 27(3): 285-294, 10.1139/x96-180
Sixto H, Hernández MJ, Barrio M, Carrasco J, Cañellas I (2007). Plantaciones del género Populus
para la producción de biomasa con fines energéticos. Invest. Agrar:Sist Recur For, 16 277- 294.
Sixto H, Hernández MJ, De Miguel J, Cañellas I. (2013) Red de parcelas de cultivos leñosos en
alta densidad y turno corto. Monografías INIA. Serie Forestal nº25. Editor: INIA. ISBN:978-84-
7498-559-7.
Strong T, Hansen E, (1993). Hybrid poplar spacing/productivity relations in short rotation
intensive culture plantations. Biomass Bioenergy, 4 255-261.
Verlinden MS, Broeckx LS, Van den Bulcke J, Van Acker J, Ceulemans R. (2013) Comparative
study of biomass determinants of 12 poplar (Populus) genotypes in a high-density short-
rotation culture. Forest Ecology and Management 307, 101-111.
Warren-Wilson J (1963). Estimation of foliage denseness and foliage angle by inclined point
quadrats. Aust. J. Bot, 11 95-105.
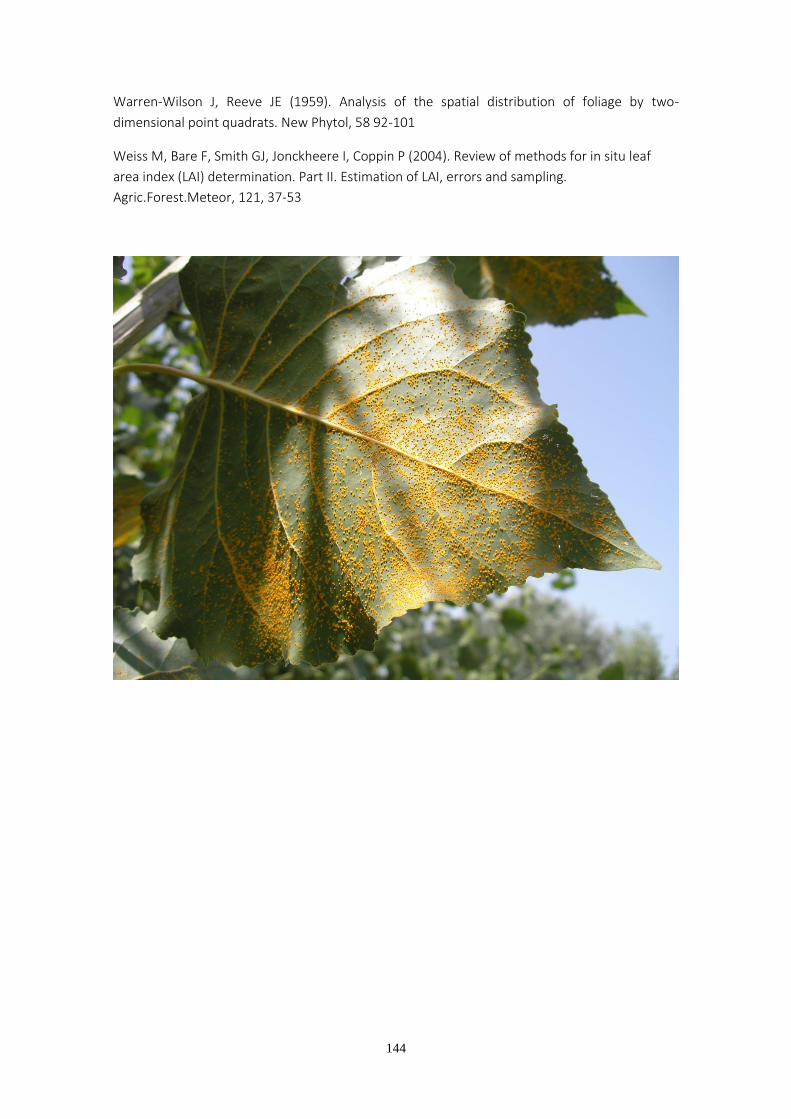
144
Warren-Wilson J, Reeve JE (1959). Analysis of the spatial distribution of foliage by two-
dimensional point quadrats. New Phytol, 58 92-101
Weiss M, Bare F, Smith GJ, Jonckheere I, Coppin P (2004). Review of methods for in situ leaf
area index (LAI) determination. Part II. Estimation of LAI, errors and sampling.
Agric.Forest.Meteor, 121, 37-53…
145
DISCUSIÓN

146
147
DISCUSIÓN
SEÑALIZACIÓN Y “REFILLING”
A pesar de lo profusamente estudiada y modelizada que ha sido la conductancia
estomática (Damour et al. 2010), todavía no se conoce completamente el mecanismo que
desencadena el cierre estomático. Es posible que no suceda del mismo modo para todas las
especies, ya que hay publicados resultados que apuntan hacia una regulación hidráulica
predominante (Salleo et al 2000) mientras otros indican que la regulación química por medio
de la hormona ABA (ácido abscísico) es la que determina el cierre estomático (Xie et al. 2006,
Bauer et al. 2013). También hay trabajos en los que se han encontrado ambos tipos de señales
(Tombesi et al.2013).
En los casos en los que la regulación hídrica del cierre estomático es considerada
predominante, las plantas detectarían el embolismo, y cerrarían los estomas antes de alcanzar
el potencial hídrico que indujera un nivel de embolismo peligroso para la supervivencia de la
planta. Salleo et al. (2000) observaron en plantas de Laurus nobilis L. que se iniciaba un cierre
parcial de estomas cuando los valores de potencial hídrico se acercaban al umbral a partir del
cual se había detectado la generación de embolismo. Este umbral se determinó midiendo
simultáneamente valores de potencial y detectando embolia a partir de ultrasonidos en tallos
y hojas. Estos resultados sugieren que la planta está detectando de algún modo el umbral de
embolia que no se debe rebasar (señal hidraúlica).
Las plantas de eucalipto ensayadas en esta tesis han presentado valores de
conductancia estomática altos (en torno a 0.8 mol m-2 s-1) con niveles de embolia muy
elevados, en torno al 70%. La disminución de la conductancia estomática coincidió en el
tiempo con la convergencia de los valores de LSC en plantas sometidas a distintos regímenes
hídricos, siendo LSC la conductividad hidráulica específica relativa al área foliar. Este resultado
podría indicar la existencia de un umbral mínimo de conductividad hidráulica específica a
partir del cual las hojas ya no recibirían flujo suficiente y se cerrarían los estomas. Vilagrosa et
al. (2003) encontraron cierre estomático en dos especies mediterráneas cuando se igualaron
sus valores de LSC. Estos resultados sugieren que la señal hidráulica desencadenante del cierre
estomático depende de la conductividad hidráulica remanente y no tanto del porcentaje de
conductividad perdida por embolia.
Pero un nivel muy bajo de conductividad hidraúlica tendría que implicar un elevado
porcentaje de pérdida de conductividad hidráulica1 (PLC), si la conductividad hidráulica
máxima fuese un valor de referencia fijo, que como tal se considera cuando se elaboran las
curvas de vulnerabilidad a la cavitación. Sin embargo, nuestros resultados muestran que la
conductividad hidraúlica máxima (kmax) no es un valor estático, y puede variar en cortos
espacios de tiempo. Observamos que kmax disminuía durante el tiempo en que se realizaron
las mediciones (tres semanas), por lo tanto una disminución de conductividad nativa relativa a
una conductividad máxima decreciente, no se traduce en una pérdida de conductividad
1 PLC=max
max
k knativa
k
148
significativa, por lo que es más difícil utilizar los valores de PLC como umbral de señalización.
Tombesi et al. (2013), en dos variedades de Vitis vinifera L. mostraron que el cierre estomático
se produjo inicialmente como consecuencia de un incremento en el porcentaje de pérdida de
conductividad hidráulica. Es posible que en función de lo estática que sea la conductividad
máxima hidráulica, sea más o menos sencillo detectar las señales hidráulicas atendiendo a los
valores de PLC.
Tombesi et al. (2013) no solamente observaron una señal hidráulica desencadenando
el cierre estomático en vid, sino que también encontraron una señal química: midieron un
incremento en la concentración de ácido abscísico (ABA) en la savia que según suponen los
autores tendría el objetivo de mantener cerrados los estomas (aunque las condiciones
ambientales fuesen favorables) para permitir la recuperación de la embolia mediante un
proceso de refilling.
En el segundo capítulo se midió la variación del pH de la savia a lo largo del tiempo
con el objeto de relacionarla con la variación en la conductancia estomática, por su posible
vinculación con la acción del ácido abscísico en respuesta al estrés hídrico (cierre estomático).
Wilkinson & Davies (1997), Wilkinson et al. (1998), o Bahrun et al. (2002) son algunos de los
trabajos en los que se muestra un incremento en el pH de la savia de plantas sometidas a
estrés hídrico. Tombesi (2013) y Mc Adam & Brodribb (2015), entre otros muchos observaron
incrementos en la concentración de ABA en la savia de plantas sometidas a estrés hídrico.
Wilkinson y Davies (1997) justificaron la posible relación entre el incremento en el pH y la
mayor concentración de ABA de la savia del siguiente modo: un pH básico favorece que el
ABA, que es un ácido débil con constante ácida pka=4.7, esté mayoritariamente en su forma
aniónica desprotonada, caracterizada por su lipofobia, por lo tanto no tendría afinidad por las
membranas celulares y llegaría a los estomas circulando por el apoplasto en medio de la
corriente transpiratoria sin quedar atrapado por el simplasto. Una disminución en el pH de la
savia supondría un incremento en la forma protonada lipófila del ABA, que tendría afinidad
por las membranas celulares y una vez atravesadas quedaría confinado en el citoplasma, cuyo
pH es cercano a la neutralidad y donde la mayor parte del ácido quedaría en forma aniónica y
no podría atravesar de nuevo las membranas celulares para llegar a los estomas.
El resultado del seguimiento del pH de la savia reveló una marcada disminución del
mismo (de aproximadamente 0.5 puntos) entre los días 15 y 20 de medición. Esta disminución
se produjo simultáneamente a un cierre estomático casi total en ambos regímenes de riego,
pasando los valores de conductancia estomática de 0.8 a valores inferiores a 0.2 mol m-2 s-1
entre los dos días mencionados. Estos resultados sugieren que no es la diferencia en el
contenido de agua del suelo lo que ha desencadenado el cierre estomático, y por tanto no ha
habido una señal desde la raíz hasta las hojas.
Thomas & Eamus (2002), estudiando en el campo las variaciones estacionales
de pH de la savia, concentración de ácido abscísico y potencial hídrico encontraron que
disminuciones en el potencial hídrico sucedían simultánemanente a incrementos en las
concentraciones de ácido abscísico, y en algunas especies observaron alcalinización del pH y
en otras acidificación (en caducifolias). Sharp & Davies (2009) mostraron que la alcalinización
del pH de la savia como respuesta al estrés hídrico procedente de escasez de agua en el suelo
149
no era un fenómeno universal, ni tampoco la acidificación. Tras someter 22 especies
diferentes a condiciones limitantes de agua en el suelo, con valores de PAR en torno a los 500
µmol m-2 s-1, no observaron cambios en el pH de la savia como respuesta a la falta de agua en
el suelo en la mayor parte de las especies ensayadas. Encontraron alcalinización de la savia en
las cuatro especies más isohídricas de todas, en las que no se observaron valores bajos de
potencial hídrico. Ninguna anisohídrica presentó alcalinización del pH. Los autores
argumentan que es posible que la disminución del pH se deba a otros procesos químicos
gobernando la química de la savia, en particular se mencionan procesos relacionados con la
nutrición de las plantas.
Las especies anisohídricas como el eucalipto antes de cerrar estomas alcanzan
potenciales hídricos más negativos que las isohídricas, y por tanto exponen el xilema a un
mayor riesgo de embolismo. La reparación de ese embolismo (“refilling”) es lo que podría
estar produciendo una disminución del pH de la savia. Diversos estudios utilizando modernas
técnicas de visualización como tomografías computerizadas de rayos X (Brodersen et al 2010)
han demostrado la existencia de refilling, aunque el mecanismo de acción no se conoce por
completo. Los resultados de las investigaciones realizadas al respecto indican que el proceso
consiste en una descarga por parte de las células parenquimáticas de solutos en los vasos
embolizados con el objeto de incrementar el potencial osmótico y atraer agua hacia ellos.
Secchi & Zwienecki (2012) comparando la savia de vasos embolizados con la de vasos sin
embolizar en plantas de Populus trichocarpa (Torr & Gray) observaron que la savia en vasos
embolizados poseía una concentración mucho mayor de azúcares e iones y un potencial
osmótico más elevado que la savia de plantas sin estresar además de un pH claramente más
ácido. El transporte de azúcares y agua a través de las membranas de las células de
parénquima es un proceso energéticamente dependiente en el que están implicadas ATP-asas
cuyos protones pueden estar vinculados a las variaciones de pH de la savia del xilema.
La consideración de esta información conjuntamente nos conduce a interpretar la
acidificación observada en nuestro trabajo como la posible consecuencia de un proceso de
refilling. Analizando la evolución de pH, potencial hídrico, conductancia estomática y déficit de
presión de vapor (DPV) se aprecia que después de un incremento continuado de los valores
máximos diarios de déficit de presión de vapor se produjo un descenso en el pH de la savia
que coincidió con una fuerte disminución de la conductancia estomática en ambos
tratamientos. Tras la disminución de pH, éste se recupera. El día 26 ya se observa en plantas
estresadas una recuperación de la conductancia estomática y de PLC. Los resultados podrían
estar reflejando los ajustes estomáticos e hidráulicos que las plantas están realizando como
respuesta a riegos y cambios atmosféricos para asegurar el suministro hídrico a las hojas: las
bajadas de pH coincidirían con recuperaciones de embolia (refilling), tras las cuales, y una vez
todos o parte de los vasos rellenados, se producen recuperaciones de los valores de pH
(alcalinizaciones) ya con potenciales hídricos medios o altos (poco negativos).
Los valores de pH medidos en el capítulo 2 fueron altos (mayores de 6.2) durante todo
el ensayo. A pH=4.7 las concentraciones de ácido abscísico protonada y aniónica están en
equilibrio. Por encima de ese valor, a medida que se incrementa el pH, aumenta la proporción
de forma ABA-(aniónica) en detrimento de la forma protonada, que puede ser secuestrada en
el simplasto. Dado que los valores de pH medidos a lo largo del ensayo fueron mayores que el
150
pKa del ácido, si se hubiese producido un incremento de ABA en cualquier momento, el pH de
la savia habría sido favorable para enviarlo hasta los estomas sin que fuese atrapado en el
simplasto de las hojas.
Los resultados que hemos obtenido no permiten descartar la existencia de señales
hidráulicas o químicas como reguladoras del cierre estomático. Es posible, que convivan
ambas.
DISMINUCIÓN DE LA CONDUCTIVIDAD MÁXIMA
Hay un punto en el que parece que coinciden varios autores entre los que se
encuentran Secchi & Zwienecki (2012) y Brodersen et al. (2010) y es en que los vasos en los
que se produce refilling han de estar hidráulicamente aislados del xilema en tensión.
En los dos primeros capítulos de eucalipto se ha observado una disminución de la
conductividad máxima durante el lapso de tiempo en el que se realizaron las mediciones.
¿Cómo es posible que esto suceda si el tamaño de los vasos se incrementó y con él la
conductividad máxima potencial, o teórica calculada con la fórmula de Poiseuille? Una posible
explicación al fenómeno observado estaría relacionada con lo mencionado en el párrafo
anterior. Si la planta trata de aislar los vasos embolizados para poder rellenarlos
impermeabilizando transitoriamente las punteaduras , este vaso “impermeabilizado” quedaría
inutilizado y aislado del resto de la red de vasos xilemáticos durante el tiempo que tarda en
rellenarse entorpeciendo la circulación de la savia, lo que se reflejaría tanto en las mediciones
de conductividad nativa como en las de conductividad máxima, pues con la aplicación de agua
a presión realizada en los tallos para eliminar embolia y determinar conductividad máxima no
se eliminarían los efectos del tratamiento impermeabilizante o aislante y los vasos
embolizados sometidos a tratamiento aislante no podrían ser desembolizados. Estudios como
los de Pesacreta et al. (2005) o Lee et al. (2012), sugieren que las microfibrillas de celulosa de
las membranas de las punteaduras están inmersas en una densa capa de hidrogel que les
confiere mayor resistencia debido a que las moléculas del solvente al recibir las tensiones
pueden cambiar de posición, evitando que afecten a la fracción sólida del hidrogel (Hong et
al.2008). La membrana de las punteaduras se forma a partir de la pared primaria con la que
puede compartir componentes, entre los que están presentes las pectinas (Rockwell et al.
2014, Plavcová et al 2011). De hecho, se ha experimentado tratando tallos con pectoliasa y el
efecto conseguido fue incrementar (hacer menos negativo) el potencial al que se emboliza el
50% del xilema, es decir, reducir la resistencia a la cavitación. (Dusotoit Coucaud et al., 2014 in
Rockwell et al. 2014). Además, diferencias en la composición de la savia podrían afectar a las
propiedades del hidrogel y provocar cambios en la permeabilidad de las punteaduras.
En el capítulo 2 se observó una elevada variabilidad en la conductividad hidráulica
máxima y también en la nativa. Entre el primer y el último día de medición, la conductividad
hidráulica nativa en plantas regadas experimentó oscilaciones pero alcanzó de nuevo el valor
de partida, se recuperó y las plantas exhibieron incrementos en biomasa del 278%. En plantas
estresadas, la conductividad hidráulica en el último día de ensayo fue un 11% inferior al valor
registrado el primer día de medición, porcentaje que coincide exactamente con la reducción
del riego en plantas estresadas respecto a regadas. Las plantas estresadas entre la primera y la
última medición de conductividad hidráulica incrementaron la biomasa en un 262%.
151
COMPARACIÓN CLONAL: CRECIMIENTO, CONDUCTANCIA ESTOMÁTICA Y
CONDUCTIVIDAD HIDRÁULICA
El estrés hídrico produjo una disminución del crecimiento. Las diferencias más
significativas entre clones se hallaron en los regímenes hídricos mejor dotados, mientras que
en los regímenes de riego con mayor limitación de agua, generalmente no se encontraron
diferencias estadísticamente significativas.
Se observó que el incremento porcentual de biomasa producido en el tratamiento
más regado respecto al tratamiento con mayor limitación hídrica es igual a la diferencia en
porcentaje entre dosis de riego. Los clones mejor regados en el capítulo uno produjeron un
20% más de biomasa que las plantas de los clones menos regados, y las dosis de riego fueron
un 73% y un 90% de la capacidad de campo en volumen, y en el segundo ensayo la diferencia
de biomasa fue del 12% entre ambos tratamientos (las plantas se regaron por pesada hasta
2600 y 2900 g). Los dos ensayos de eucalipto se realizaron en invernadero en la misma época
del año, pero se utilizaron envases de distinto tamaño: 2 litros y 5 litros. La producción de
biomasa de un ensayo a otro se multiplicó por la relación de peso entre envases, es decir, por
2.5. Estos resultados muestran cuantitativamente cómo afecta la falta de agua a la producción
en condiciones controladas. Sería interesante poder comprobar si esta proporcionalidad se
conserva a lo largo de la vida de la planta por su utilidad en la gestión de plantaciones
comerciales. En las plantaciones experimentales de chopo instaladas en la Red de Parcelas de
Cultivos Leñosos en Corta Rotación, en condiciones de campo no se ha observado esta
proporcionalidad, pues el desarrollo libre de la raíz en campo puede permitir a las plantas
acceder a fuentes de agua no controladas.
Los clones de eucalipto que presentaron mayores crecimientos en superficie foliar,
tasas de evapotranspiración y conductancias estomáticas fueron híbridos F1, que
aprovecharon más eficientemente los recursos que los clones F0. Esto no se cumplió para el
caso del clon H491, un F1 procedente del autocruzamiento de C14, cuyo crecimiento estuvo al
nivel de los clones F0 en el invernadero, y presentó altos niveles de mortalidad y escaso
crecimiento en plantaciones comerciales, poniendo de manifiesto la elevada mortalidad, el
escaso crecimiento y menor resistencia al estrés que normalmente se asocia a especímenes
procedentes de autocruzamiento (Johnsen et al. 1999, 2003, Fox & Reed 2011). Los valores
máximos de conductancia estomática medidos en H491 fueron del orden de una tercera parte
de los medidos en otros cinco clones, lo que implica una menor capacidad de refrigeración de
la hoja y por tanto una menor adaptación al estrés además de un menor crecimiento asociado
a la menor absorción de nutrientes que tiene lugar cuando la tasa de transpiración es menor
(Scholz et al 2007). Estos resultados ayudan a explicar las bajas producciones y elevada
mortalidad obtenidas por H491 en plantaciones comerciales y confirman la importancia de la
selección e hibridación de genotipos como herramienta para la mejora de la producción.
En general los clones que resultaron más productivos en el campo también lo fueron
en el invernadero con algunas variaciones que pueden achacarse a las limitaciones que
impone el crecimiento en una maceta (Poorter et al. 2012); aunque también el hecho de estar
sometidos a las mismas condiciones de suelo permite averiguar qué genotipos pueden
desarrollarse mejor partiendo de las mismas condiciones. La diferencia más notable entre
152
condiciones de campo y controladas se halló en dos clones: en el clon H231 que en el campo
presentó una de las mayores producciones mientras que en invernadero mostró un desarrollo
intermedio, y en el clon H491, que en invernadero no presentó un desarrollo tan reducido
como en el campo.
Se encontraron algunas diferencias interesantes entre clones en variables como la
conductancia estomática y la conductividad hidráulica: se detectaron los clones con un
comportamiento más arriesgado, es decir, que transpiraron más y alcanzaron valores de
conductividad hidráulica más bajos. En particular, el clon T presentó los valores más altos de
conductancia estomática en condiciones de riego más desfavorables. Este clon mantuvo
niveles de transpiración altos en condiciones de estrés hídrico y valores de conductividad
hidráulica significativamente menores que otros clones estudiados, por lo que sería un buen
candidato a sufrir defoliación precoz bajo estrés severo. Es el clon que arrojó los mejores
datos de producción en el campo dada su eficiencia en el uso de los recursos, sin embargo,
ese modus operandi arriesgado en la sequía de 2005, que fue la sequía más acentuada en 40
años, avocó al fracaso a las plantaciones de este clon, que fue retirado de producción.
Los clones que presentaron mayores crecimientos en el invernadero también
alcanzaron los mayores valores de conductancia hidráulica. Sin embargo también fue retirado
de producción el clon H463, uno de los clones con mejores resultados en campo e
invernadero, por proliferación de brotes epicórmicos, indicando que estar en posesión de una
conductividad hidráulica elevada por sí solo no constituye motivo de selección clonal.
ANATOMÍA
Las características anatómicas estudiadas en eucalipto y en chopo han sido de utilidad
para comprender los resultados fisiológicos obtenidos, mostrando la relación existente entre
estructura y función.
Los clones H231 de eucalipto y Pegaso de chopo presentan las menores superficies
conductoras por unidad de sección transversal de tallo comparados con el resto de clones de
sus respectivos ensayos. La presencia de vasos de pequeño diámetro en el xilema impidió a
ambos clones aprovechar eficientemente los recursos del medio cuando las condiciones
fueron más favorables. Pegaso presentó la menor conductancia estomática máxima y H231 la
menor conductividad hidráulica máxima en las mejores condiciones comparadas con las del
resto de clones de sus correspondientes ensayos. Estos resultados muestran la importancia de
seleccionar clones con cualidades como tener valores altos de conductividad hidráulica y
conductancia estomática que les permitan crecer lo máximo posible cuando las condiciones
del medio son favorables, es decir, clones con un xilema eficiente. La cuestión es si un xilema
eficiente puede ser además seguro. Recientes estudios como los de Gleason et al. (2015)
revelan en ensayos testando más de 400 especies que la relación entre eficiencia y seguridad
es débil, y encuentran especies poco eficientes y vulnerables como Pegaso, pero no
encuentran entre el gran número de especies estudiadas ninguna especie eficiente y
resistente, por lo que se concluye al final, que de algún modo, sí debe existir ese compromiso.
El estudio del xilema realizado en el tercer capítulo de la tesis tenía como objetivo
averiguar si los clones que alcanzaban mayores crecimientos poseían alguna característica en
153
el xilema que les atribuyera alguna ventaja competitiva desde el punto de vista productivo. La
plantación de chopo situada en Granada en la que se tomaron las muestras sufrió
restricciones hídricas en verano que condujeron a la defoliación total de la plantación, tras la
cual se aplicó un riego y las plantas rebrotaron. Se partía de la hipótesis de que los clones con
los vasos más grandes serían más vulnerables y habrían producido menos biomasa en
Granada. Y efectivamente, el clon que presentó el menor crecimiento fue el de vasos de
mayor tamaño. Los clones que mostraron los mejores crecimientos en situaciones de estrés
hídrico en la plantación de Granada exhibieron mayor número de vasos y de un tamaño
intermedio. Los clones con características anatómicas que adoptaron valores extremos
ofrecieron peores resultados: el clon que presentó los vasos más grandes pero menor número
de ellos y aquel que presentó los vasos más pequeños fueron los menos productivos. Una
eficiencia hidráulica intermedia resultó el óptimo en condiciones de estrés severo.
Los clones de chopo más productivos en cada uno de los tratamientos figuraron entre
los más resistentes a la cavitación. Aunque la sequía hace disminuir el crecimiento, este
resultado puede indicar que es posible encontrar clones adaptados a las condiciones
ambientales mediterráneas y con un crecimiento aceptable. Si asumimos que existe una débil
relación entre eficiencia y seguridad, nuestros resultados indicarían que en ambientes
mediterráneos el óptimo productivo se encontraría en una eficiencia hidráulica intermedia y
una elevada resistencia a la cavitación.
El análisis de la vulnerabilidad a partir de la construcción de curvas mostró que la
vulnerabilidad a la cavitación es una característica que experimenta aclimatación en chopo.
Nuestros resultados corroboran los obtenidos por Plavcová et al. (2011); las plantas sometidas
a tratamiento de riego fueron más vulnerables que aquellas sometidas a déficit hídrico. No
todos los clones presentaron la misma plasticidad: el que exhibió la mayor plasticidad en lo
relativo a la vulnerabilidad a la cavitación fue I-214. Este clon figuró entre los clones más
resistentes en condiciones de estrés y fue el más vulnerable de todos cuando fue sometido al
tratamiento de riego más favorable. AF2, sin embargo resultó el menos plástico, y no
presentó diferencias en vulnerabilidad cuando se le sometió a diferentes regímenes de riego.
Esta variabilidad fenotípica por un lado es un rasgo que puede ser considerado una ventaja
adaptativa frente a cambios en el medio, y tiene el inconveniente de dificultar la predicción a
priori sobre los fenotipos que se generarán en cada situación.
En dos especies vulnerables a la cavitación como son eucalipto y chopo, no solamente
es importante evitar la generación de embolia en los vasos, sino repararla una vez ha sucedido
(Zwieniecki and Holbrook 1998). Tanto en chopo como en eucalipto se ha documentado el
fenómeno de refilling (Hacke et al 2001, Martorell et al. 2013), si bien puede haber variaciones
entre genotipos. Es probable que en situaciones de déficit hídrico sea más sencillo rellenar un
xilema compuesto por muchos vasos medianos, con mayores posibilidades de interconexión,
que rellenar un xilema de pocos vasos de gran tamaño como el de I-214. De hecho, es un
fenómeno común encontrar en las maderas de ejemplares sometidos a estrés un mayor
número de vasos de menor tamaño que cuando han vegetado en terrenos con mayor
disponibilidad de agua. (Fichot et al. 2009, Cocozza et al 2011).
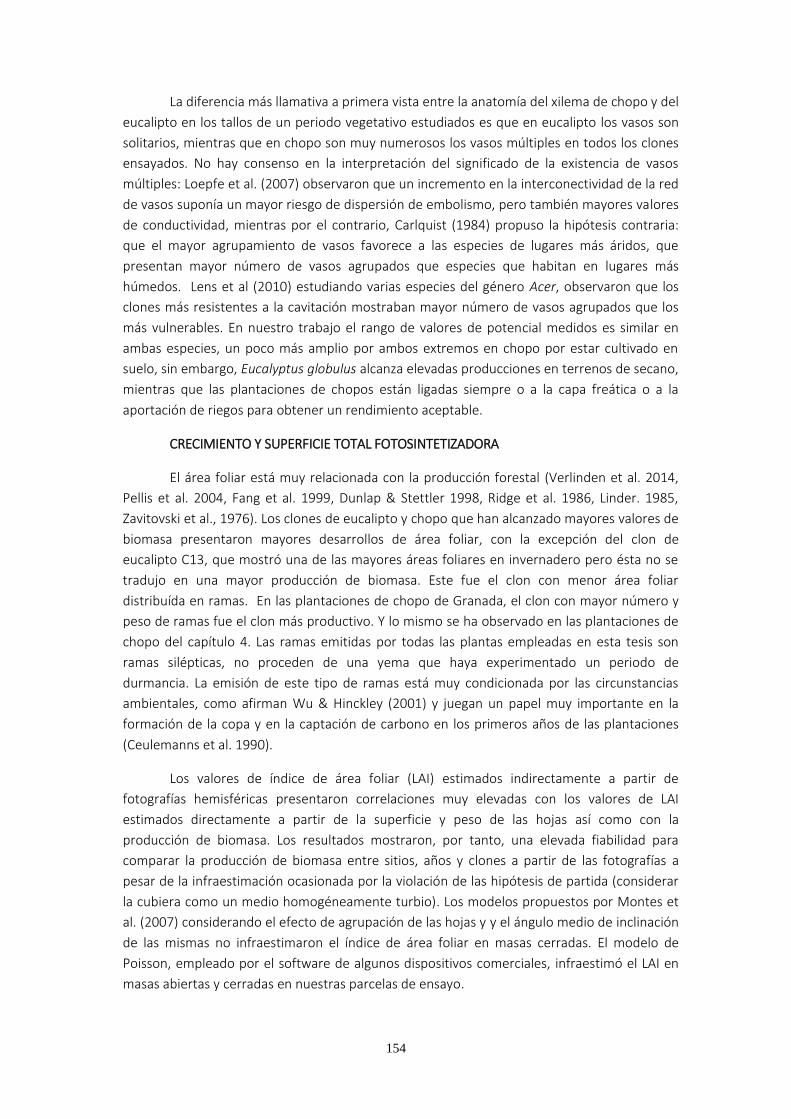
154
La diferencia más llamativa a primera vista entre la anatomía del xilema de chopo y del
eucalipto en los tallos de un periodo vegetativo estudiados es que en eucalipto los vasos son
solitarios, mientras que en chopo son muy numerosos los vasos múltiples en todos los clones
ensayados. No hay consenso en la interpretación del significado de la existencia de vasos
múltiples: Loepfe et al. (2007) observaron que un incremento en la interconectividad de la red
de vasos suponía un mayor riesgo de dispersión de embolismo, pero también mayores valores
de conductividad, mientras por el contrario, Carlquist (1984) propuso la hipótesis contraria:
que el mayor agrupamiento de vasos favorece a las especies de lugares más áridos, que
presentan mayor número de vasos agrupados que especies que habitan en lugares más
húmedos. Lens et al (2010) estudiando varias especies del género Acer, observaron que los
clones más resistentes a la cavitación mostraban mayor número de vasos agrupados que los
más vulnerables. En nuestro trabajo el rango de valores de potencial medidos es similar en
ambas especies, un poco más amplio por ambos extremos en chopo por estar cultivado en
suelo, sin embargo, Eucalyptus globulus alcanza elevadas producciones en terrenos de secano,
mientras que las plantaciones de chopos están ligadas siempre o a la capa freática o a la
aportación de riegos para obtener un rendimiento aceptable.
CRECIMIENTO Y SUPERFICIE TOTAL FOTOSINTETIZADORA
El área foliar está muy relacionada con la producción forestal (Verlinden et al. 2014,
Pellis et al. 2004, Fang et al. 1999, Dunlap & Stettler 1998, Ridge et al. 1986, Linder. 1985,
Zavitovski et al., 1976). Los clones de eucalipto y chopo que han alcanzado mayores valores de
biomasa presentaron mayores desarrollos de área foliar, con la excepción del clon de
eucalipto C13, que mostró una de las mayores áreas foliares en invernadero pero ésta no se
tradujo en una mayor producción de biomasa. Este fue el clon con menor área foliar
distribuída en ramas. En las plantaciones de chopo de Granada, el clon con mayor número y
peso de ramas fue el clon más productivo. Y lo mismo se ha observado en las plantaciones de
chopo del capítulo 4. Las ramas emitidas por todas las plantas empleadas en esta tesis son
ramas silépticas, no proceden de una yema que haya experimentado un periodo de
durmancia. La emisión de este tipo de ramas está muy condicionada por las circunstancias
ambientales, como afirman Wu & Hinckley (2001) y juegan un papel muy importante en la
formación de la copa y en la captación de carbono en los primeros años de las plantaciones
(Ceulemanns et al. 1990).
Los valores de índice de área foliar (LAI) estimados indirectamente a partir de
fotografías hemisféricas presentaron correlaciones muy elevadas con los valores de LAI
estimados directamente a partir de la superficie y peso de las hojas así como con la
producción de biomasa. Los resultados mostraron, por tanto, una elevada fiabilidad para
comparar la producción de biomasa entre sitios, años y clones a partir de las fotografías a
pesar de la infraestimación ocasionada por la violación de las hipótesis de partida (considerar
la cubiera como un medio homogéneamente turbio). Los modelos propuestos por Montes et
al. (2007) considerando el efecto de agrupación de las hojas y y el ángulo medio de inclinación
de las mismas no infraestimaron el índice de área foliar en masas cerradas. El modelo de
Poisson, empleado por el software de algunos dispositivos comerciales, infraestimó el LAI en
masas abiertas y cerradas en nuestras parcelas de ensayo.

155
En conclusión, la información obtenida de las mediciones anatómicas, morfológicas y
fisiológicas realizadas contribuye a explicar la elevada interacción genotipo x ambiente
encontrada en las plantaciones de campo.

156
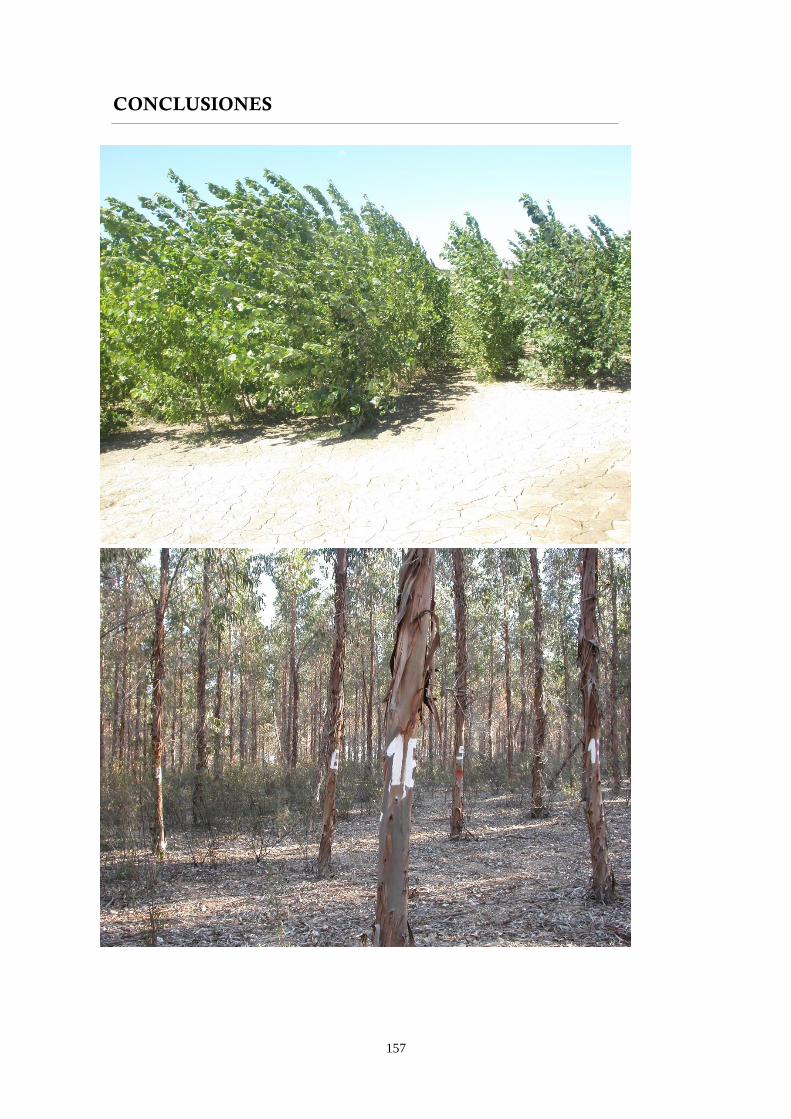
157
CONCLUSIONES

158
159
CONCLUSIONES
1.-El conjunto de variables anatómicas y fisiológicas estudiadas ha sido de gran
utilidad para comprender las diferencias de producción existentes entre diferentes
genotipos en plantaciones tanto comerciales como experimentales en el mismo o en
diferentes sitios de ensayo.
2.-Los valores de conductividad hidráulica y conductancia estomática de los
genotipos más productivos figuraron entre los valores más altos medidos, mientras
que los genotipos menos productivos presentaron los valores más bajos de
conductividad y conductancia.
3.-Estar en posesión de un xilema con una baja superficie conductora
compuesta por vasos pequeños ha sido la característica común de los clones que han
sido retirados de plantaciones comerciales o experimentales por su elevada
mortalidad en condiciones de estrés tanto en eucalipto como en chopo. En los dos
casos encontrados (clones H-231 y Pegaso) la conductancia estomática en condiciones
de estrés fue superior a la del resto de los clones.
4.-Los clones que han presentado producciones más elevadas en condiciones
de estrés exhibieron mayor número de vasos y de tamaño intermedio. Los clones con
valores medios extremos de superficie de lumen de vasos o con un número muy
pequeño de vasos han resultado menos productivos.
5.-No se ha detectado relación entre crecimiento y vulnerabilidad a la
cavitación en los genotipos ensayados. Los clones más productivos figuraron entre los
más resistentes a la cavitación. Este resultado abre la puerta a la búsqueda de
genotipos productivos entre los más resistentes.
6.- Los valores de conductividad hidráulica máxima pueden variar en cortos
espacios de tiempo. Esto se debe tener en cuenta cuando se utiliza el parámetro
pérdida de conductividad hidráulica para evaluar la respuesta a estrés hidrico.
7.-La disminución de la conductividad máxima hidraúlica en eucalipto puede
ser consecuencia de una impermeabilización de las membranas de las punteaduras y
podría formar parte de un mecanismo de refilling del xilema de eucalipto.
8.-El cierre estomático parcial o total detectado en los dos primeros ensayos de
eucalipto ha sucedido simultáneamente a la coincidencia de los valores de
conductividad máxima en las plantas pertenecientes a los dos regímenes hídricos
ensayados. Esto indica una posible señal hidraúlica que marca la necesidad de cierre
160
estomático por haberse alcanzado el umbral mínimo de conductividad necesario para
abastecer de savia a las hojas.
9.-El pH de la savia disminuyó coincidiendo con un incremento en el déficit de
presión de vapor durante varios días consecutivos, justo después de haber coincidido
los valores de conductividad máxima de las plantas correspondientes a diferentes
regímenes de riego. La disminución del pH podría ser consecuencia de un proceso de
refilling.
10.-Los modelos empleados para estimar el LAI a partir de fotografías
hemisféricas que tienen en cuenta el agrupamiento de las hojas y su inclinación han
arrojado resultados muy bien correlacionados con el LAI obtenido a partir de métodos
directos y con la biomasa.
161
BIBLIOGRAFÍA

162
163
BIBLIOGRAFÍA
Aemet (2005) Año hidrometeorológico. Siete meses de extrema sequía. Spanish Meteorological Agency Web. http://www.aemet.es./es/noticias/2005/2005/0905, Accesed April 1, 2015 . AEF (2013) Avance ANUARIO ESTADÍSTICO FORESTAL 2013 http://www.magrama.gob.es/es/ desarrollo-rural /estadisticas/ avance_2013_ef_tcm7-387795. PDF Alder NN, Sperry JS Pockman WT (1996) Root and stem xylem embolism, stomatal conductance and leaf turgor in Acer grandidentatum populations along a soil moisture gradient. Oecologia 105, 293-301 Alder NN, Pockman WT, Sperry JS, Nuismer S (1997) Use of centrifugal force in the study of xylem cavitation. Journal of Experimental Botany 48, 665-674 Alves G, Ameglio T, Guilliot A, Fleurat-Lessard P, Lacointe A, Sakr S, Petel G, Julien JL (2004) Winter variation in xylem sap pH of walnut trees: involvement of plasma membrane H+-ATPase of vessel-associated cells. Tree Physiol 24,99-105 Anderegg WRL, Anderegg LDL, Berry JA, Field CB (2014). Loss of whole-tree hydraulic
conductance during severe drought and multi-year forest die-off. Oecologia
doi:10.1007/s00442-013-2875-5
Anderson M. Introducing groundwater physics. Physics today (2007) www.physicstoday.org. http://geoscience.wisc.edu/~andy/PT_2007.pdf
Atkinson C J, Else M A, Taylor L and Dover C J (2003) Root and stem hydraulic conductivity as determinants of growth potential in grafted trees of apple (Malus pumila Mill.) Journal of Experimental Botany
Aubrey DP, Boyles JG, Krynsky LS, Teskey RO (2011) Spatial and temporal patterns of xylem sap pH derived from stems and twigs of Populus deltoides L. Environ Exp Bot 71, 376-381 Awad H, Barigah T, Badela E, Cochard H Herbette S (2010) Poplar vulnerability to xylem cavitation acclimates to drier soil conditions. Physiologia Plantarum 139,280-288 Bahrun A, Jensen CR, Asch F, Mogensen VO. 2002. Drought induced changes in xylem pH, ionic composition, and ABA concentration act as early signals in field-grown maize (Zea mays L) Journal of Experimental Botany 53, 251–263 Barigah ST, Charrier O, Douris M, Bonhomme M, Herbette S, Ameglio T, Fichot R, Brignolas F, Cochard H (2013) Water stress-induced xylem hydraulic failure is a causal factor of tree mortality in beech and poplar. Annals of Botany 112, 1431-1437 Bauer H, Ache P, Lautner S, Fromm J, Hartung W, Al-Rasheid KA,Sonnewald S, Sonnewald U, Kneitz S, Lachmann N (2013) The stomatal response to reduced relative humidity requires guard cell autonomous ABA synthesis. Curr Biol 23, 53–5 Beikircher B, De Cesare C, Mayr S (2013) Hydraulics of high-yield orchard trees: a case study of three Malus domestica cultivars. Tree Physiology 33, 12, 1296-1307
164
Blackman PG, Davies WJ (1985). Root to shoot communication in maize plants of the effects of soil drying. Journal of Experimental Botany 36, 39–48. Breda JJ; (2003) Ground-based measurements of leaf area index: a review of methods, instruments and current controversies. J Expl Bot, 54 2403-2417
Brodersen CR, McElrone AJ, Choat B, Matthews MA, Shackel KA (2010) The dynamics of embolism repair in xylem: in vivo visualizations using high resolution computed tomography. Plant Physiology 154, 1088-1095. Brodribb TJ, Hill RS (1999) The importance of xylem constraints in the distribution of conifer species. New Phytol. 143, 365-372 Brodribb TJ, Hill RS (2000) Increases in water potential gradient reduce xylem conductivity in whole plants. Evidence from a low-pressure conductivity method. Plant Physiology 123,1021-1028 Brodribb TJ, Holbrook NM (2004) Stomatal protection against hydraulic failure: a comparison of coexisting ferns and angiosperms. New Phytol 162,663-670 Burgess SS, Pittermann J, Dawson TE (2006) Hydraulic efficiency and safety of branch xylem increases with height in Sequoia sempervirens (D. Don) crowns. Plant Cell Environ. 29(2), 229-239.
Cai H, Zhang S, Tyree M. A computational algorithm addressing how vessel length might depend on vessel diameter. Plant, Cell & Environment 33, 1234-1238.
Capron M, Tordjeman P, Charru F, Badel E & Cochard H (2014) Gas flow in plant microfluidic networks controlled by capillary valves. Physical Review 89, 033019. Carlquist, S (1977) Ecological factors in w ood evolution: a floristic approach. Amer.J.Bot.64, 887-896. Carlquist (1984) Vessel grouping in dicotyledon wood: significance and relationship to imperforate tracheary elements. Aliso 10, 505-525. Carlquist S, (2001) Comparative wood anatomy. Systematic ecological and evolutionary aspects of dicotyledonean wood. Springer Verlag Berlin Heidelberg GmbH
Cerasoli S, McGuire MA, Faria J, Mourato M, Schimidt M, Pereira JS, Chaves MM, Teskey RO (2009) CO2 efflux, CO2 concentration and photosynthetic refixation in stems of Eucalyptus globulus (Labill.). J Exp Bot 60,99-105
Ceulemans R, Stettler RF, Hinckley T M Isebrands JG and Heilman P E. (1990) Crown architecture of Populus clones as determined by branch orientation and branch characteristics. Tree Physiol. 7, 157-167. Chason, JW, Baldocchi, DB, Huston, MA, 1991. A comparison of direct and indirect methods for estimating forest canopy leaf area. Agric.Forest.Meteor 57 107-128.
Chaves MM, Oliveira MM (2004) Mechanisms underlying plant resilience to water deficits: prospects for water-saving agriculture. J Exp Bot 55:2365-2384.
165
Christmann MA, Sperry J.S., Adler FR (2009) Testing the ‘rare pit’ hypothesis for xylem cavitation resistance in three species of Acer. New Phytologist 182, 3, 664-674. Cochard H, Coll L, Le Roux X, Ameglio T (2002) Unraveling the effects of plant hydraulics on stomatal closure during water stress in walnut. Plant Physiology 128:282-290 Cochard H, Casella E, Mencuccini M (2007) Xylem vulnerabitity to cavitation varies among poplar and willow clones and correlates with yield. Tree Physiology 27:1761-1767 Cochard H, Herbette S, Barigah T, Badel E, Ennajeh M, Vilagrosa A. (2010).Does sample length influence the shape of xylem embolism vulnerability curves? A test with the Cavitron spinning technique. Plant Cell and Environment 33, 1543–1552. Cochard H, Badel E, Herbette S, Delzon S, Choat B, Jansen S (2013a). Methods for measuring plant vulnerability to cavitation: a critical review. Journal of Experimental Botany 64, 4779-4791. Cochard H, Delzon S (2013b) Hydraulic failure and repair are not routine in trees. Ann For Sci 70:659-661. Cocozza C, Giovannelli A, Traversi ML, Castro G, Cherubini P, Tognetti R (2011) Do tree-ring traits reflect different water deficit responses in young poplar clones (Populus 3 canadensis Mönch ‘I-214’and P. deltoides ‘Dvina’)?. Trees 25:975–985.
Comstock JP (2002). Hydraulic and chemical signalling in the control of stomatal conductance and transpiration. Journal of Experimental Botany. 53(367) 195-200
Damour G., Simonneau T, Cochard H, Urban L. (2010) An overview of models of stomatal conductance at the leaf level. Plant, Cell and Environment 33, 1419-1438 David WP, Millard S, Douglas F B and Rood SB (2005) Stomatal characteristics of riparian poplar species in a semi-arid environment Tree Physiology 26, 211–218
Davies, W. J. & Zhang, J. (1991) Root signals and the regulation of growth and development of plants in drying soil. Ann. Rev. Plant.Physiol. Plant. Mol. Biol. 42, 55–76 De Mico V, Aronne G, Baas P (2008) Wood anatomy and hydraulic architecture of stems and twigs of some Mediterranean trees and shrubs along a mesic-xeric gradient. Trees 22, 643-655 Do FC, Rocheteau A., Diagne AL, Goudiaby V, Granier A, LHomme J-P (2008).Stable annual pattern of water use by Acacia Tortilis in Sahelian Africa. Tree Physiology 28, 95-104. Dixon, H (1924) The transpiration stream. Londres: University of London Press, Ltd. p. 80
Dodd IC, Tan LP, He J (2003) Do increases in xylem sap pH and/or ABA concentration medayte stomatal closure following nitrate deprivation? J Exp Bot 54: 1281-1288 Dodd IC (2005) Root-to-shoot signalling: Assessing the roles of “up” in the up and down world of long-distance signalling in planta. Plant Soil 274,251-270 Domec J-C, Warren JM, Meinzer FC, Brooks JR, Coulombe R (2004) Native root xylem embolism and stomatal closure in stands of Douglas fir and ponderosa pine: mitigation by hydraulic redistribution. Oecologia 141, 7-16
166
Domec J-C, Scholz FG, Bucci SJ, Meinzer FC, Goldstein G, Villalobos-Vega R (2006). Diurnal and seasonal variation in root xylem embolism in neotropical savanna woody species: impact on stomatal control of plant water status. Plant Cell and Environment 29,26-35. Domec J-C, Meinzer FC, Lachenbruch B, Housset J (2007) Dynamic variation in sapwood specific conductivity in six woody species. Tree Physiology 27, 1389-1400 Domec J-C, Noormets A, King JS, Sun G, McNulty SG, Gavazzi MJ, Boggs JL, Treasure EA (2009) Decoupling the influence of leaf and root hydraulic conductances on stomatal conductance and its sensitivity to vapour pressure deficit as soil dries in a loblolly pine plantation. Plant Cell Environment 32,980-991 Dunlap JM; Stettler RF (1998) Genetic variation and productivity of Populus trichocarpa and its hybrids. X. Trait correlations in young black cottonwood from four river valleys in Washington. Trees- Struct Funct, 13 28-39.
Eamus D, O´Grady AP, Hutley L (2000) Dry season conditions determine wet season water use in the wet-dry tropical savannas of northern Australia. Tree Physiol. 20:1219-1226 Eckenwalder JE (1996) Biology of Populus and Its Implications for Management and Conservation. Stettler RF, Bradshaw HD, Heilmann PE, Hinckley TM Research Press, Otawa, Ontario, Canada. Energy Roundmap 2050 (2012) Luxembourg: Publications Office of the European Union.ISBN 978-92-79-21798-2 doi: 10.2833/10759 . Eppler U & Petersen JE (2007) Short Rotation Forestry, Short Rotation Coppice and energy grasses in the European Union: Agro-environmental aspects, present use and perspectives. Background report on current SRF/SRC cropping patterns in Europe. http://iet.jrc.ec.europa.eu/remea/sites/remea/files/files/documents/events/background_paper_final_draft.pdf. Espino S and Schenk HJ (2010) Mind the bubbles: achieving stable measurements of maximum hydraulic conductivity through woody plant samples. Journal of Experimental Botany 62(3)1119-1132. Ewers FW, Ewers JM, Jacobsen AL, López-Portillo J (2007) Vessel redundancy: modelling safety in numbers. IAWA Journal 28:373-388. Ewers FW, Fisher JB (1989). Variation in vessel length and diameter in stems of six tropical and subtropical lianas. American Journal of Botany 76(10) 1452-1459 Fang, S, Xu X, Lu S, Tang L (1999) Growth dynamics and biomass production in short-rotation poplar plantations: 6-year results for three clones at four spacings. Biomass and Bioenergy, 17 (5), 415-425 Feng F, Ding F, Tyree M.T. (2015) Investigations concerning cavitation and frost fatigue in clonal 84K poplar using high-resolution cavitron measurements.Plant Physiology 168, 144–155. Fichot R, Laurans F, Monclus R, Moreau A, Pilate G, Brignolas F.(2009) Xylem anatomy correlates with gas exchange, water-use efficiency and growth performance under contrasting water
167
regimes: evidence from Populus deltoides x Populus nigra hybrids. Tree Physiol. 29, 12, 1537-49.
Fichot R, Barigah TS, Chamaillard S, LE Thiec D, Laurans F, Cochard H, Brignolas F (2010) Common trade-offs between xylem resistance to cavitation and other physiological traits do not hold among unrelated Populus deltoides x Populus nigra hybrids. Plant Cell &. Environment 33 (9), 1553-68
Fichot R, Brignolas F, Cochard H, Ceulemanns R(2015) Vulnerability to drought-induced cavitation in poplars: synthesis and future opportunities. Plant, Cell and Environment 2015.38,7, 1233-1251. Fox CW, Reed DH (2011) Inbreeding depression increases with environmental stress: an experimental study and meta-analysis. Evolution 65(1), 246-58. Friend AL, Scarascia-Mugnozza G, Isebrands JG and Heilmans PE (1991). Quantification of two-year-old hybrid poplar root systems: morphology, biomass, and 14C distribution. Tree Physiology 8. 109-119
Froux F, Huc R, Ducrey M, Dreyer E (2002) Xylem hydraulic efficiency versus vulnerability in seedlings of four contrasting Mediterranean tree species (Cedrus atlantica, Cupressus sempervirens, Pinus halepensis and Pinus nigra). Ann. For. Sci. 59:409-418 Gleason SM, Westoby M, Jansen S, Choat B, Hacke UG, Pratt RB, Bhaskar B, Brodribb TJ, Bucci SJ, Cao KF, Cochard H, Delzon S, Domec JC, Fan ZX, Field TS, Jacobsen AL , Johnson DM, Lens F, Maherali H, Martınez-Vilalta J, Mayr S, McCulloh KA, Mencuccini M, Mitchell PJ, Morris H, Nardini A, Pittermann J, Plavcova L, Schreiber SG, Sperry JS, Wright IJ, and Zanne AE (2015) Weak tradeoff between xylem safety and xylem-specific hydraulic efficiency across the world’s woody plant species. New Phytologist doi:10.1111/nph.13646. Grossnickle SC, Russell JH (2010) Physiological variation among western red cedar (Thuja plicata Donn ex D. Don) populations in response to short-term drought. Ann For Sci 67: 506-517. Grotkopp E, Remanek M, Rost T (2002) Toward a casual explanation of plant invasiveness: seedling growth and life-history strategies of 29 pine (Pinus) species. American Naturalist 159:396-419 Grotkopp E, Rejmanek M (2007) High seedling relative growth rate and specific leaf area are traits of invasive species: phylogenetically independent contrast of woody angiosperms. American Journal of Botany 94(4):526-532 Hacke UG, Sperry JS (2001) Functional and ecological xylem anatomy. Perspectives in Plant Ecology, Evolution and Systematics. Vol. 4/2:97-115 Hacke UG, Stiller V, Sperry JS, Pittermann J, McCulloh KA (2001) Cavitation fatigue. Embolism and refilling cycles can weaken the cavitation resistance of xylem. Plant Physiology 125:779-786 Hacke UG, Sperry JS (2003) Limits to xylem refilling under negative pressure in Laurus nobilis and Acer negundo. Plant Cell and Environment 26:303-311. Hacke UG, Sperry JS, Wheeler JK, Castro L. (2006) Scaling of angiosperm xylem structure with safety and efficiency. Tree Physiology 26, 689–701.
168
Hacke U, Venturas MD, MacKinnon ED, Jacobsen AL, Sperry JS, Pratt RB (2015) The standard centrifuge method accurately measures vulnerability curves of long-vesselled olive stems. New Phytologist 1, 205, 116-127. Hajek P, Leuschner C, Halter D, Delzon S and Schuldt B (2014).Trade-offs between xylem hydraulic properties, wood anatomy and yield in PopulusTree Physiology 34, 744-756. Harvey HP, Van Den Driessche R (1997) Nutrition, xylem cavitation and drought resistance in hybrid poplar. Tree Physiol. 17,647-654. Heilmeier H, Schulze ED, Fan J, Hartung W (2007) General relations of stomatal responses to xylem sap abscisic acid under stress in the rooting zone- A global perspective. Flora 202:624-636 Himrane H, Camarero JJ, Gil-Pelegrin E (2004) Morphological and ecophysiological variation of the hybrid oak Quercus subpyrenaica (Q. faginea x Q. pubescens). Trees 18,566-575 Holbrook NM, Zwieniecki A (1999) Embolism repair and xylem tension: Do we need a miracle? Plant Physiology 120:7-10 Holbrook NM, Ahrens ET, Burns MJ, Zwieniecki A (2001). In vivo observation of cavitation and embolism repair using magnetic resonance imaging. Plant Physiology 126:27-31 Hölttä T, Juurola E, Lindfors L, Porcar-Castell A (2012) Cavitation induced by a surfactant leads to transient release of water stress and subsequent ‘run away’ embolism in Scots pine (Pinus sylvestris) seedlings. J. Exp. Bot 63 (2),1057-1067
http://www.ats.ucla.edu/stat/sas/library/SASNLin_os.htm. Nonlinear Regression in SAS. UCLA: Statistical Consulting Group. Hubbard RM, Ryan MG, Stiller V, Sperry JS (2001) Stomatal conductance and photosynthesis vary linearly with plant hydraulic conductance in ponderosa pine. Plant Cell Environ 24,113-121 Hutley LB, O’Grady AP, Eamus D (2001). Monsoonal influences on evapotranspiration of savanna vegetation of northern Australia. Oecologia 126, 434-443.
Israelsson M, Siegel RS, Young J, Hashimoto M, Iba K, Schroeder JI (2006) Guard cell ABA and CO2 signaling network updates and Ca2+ sensor priming hypothesis. Curr Opin Plant Biol.9(6):654-63
Jacobsen AL, Pratt RB, Tobin MF, Hacke UG, Ewers FW (2012). A global analysis of xylem vessel length in woody plants. American Journal Of Botany 99, 10, 1583–1591 Jones HG, Sutherland RA (1991).Stomatal control of xylem embolism. Plant Cell Environ 14, 607-612 Johnsen KH, Flanagan LB, Huber DA, Major JE (1999) Genetic variation in growth and carbon isotope discrimination in Picea mariana: analyses from a half-diallel mating design using field grown trees. Can. J. For. Res. 29, 1727-1735 Johnsen K, Major JE, Maier CA (2003) Selfing results in inbreeding depression of growth but not of gas exchange or surviving adult black spruce trees. Tree Physiol 23,1005-1008
169
Jacobsen AL, Pratt RB, Tobin MF, Hacke UG, and Ewers FW (2012) A global analysis of xylem vessel length in woody plants American Journal of Botany 99 (10), 1583–1591
Kavanagh et al. (1999) Shoot and root vulnerability to xylem cavitation in four populations of Douglas-fir seedlings. Tree Phys. 19, 31-37. Kramer, P.J. & Boyer, J.S. (1995) Water Relations of Plants and Soils. Academic Press, San Diego Lambers H, Chapin III FS, Pons TL (2008) Plant Physiological Ecology. Springer-Verlag New York Larcher W (1995) Physiological plant ecology. Ecophysiology and stress physiology of functional groups. SpringerVerlag, Berlin-Heidelberg.
Lauri PE, Marceron A, Normand F, Dambreville A, Regnard JL .(2014). Soil water deficit
decreases xylem conductance efficiency relative to leaf area and mass in the apple. Journal of
Plant Hydraulics, INRA, 2014, 1, pp.e0003.
Lemoine D, Cochard H, Granier A (2002) Whithin crown variation in hydraulic architecture in beech (Fagus sylvatica L): evidence for a stomatal control of xylem embolism. Ann. For. Sci. 59, 19-27 Lens F, Sperry JS, Christmann M A, Choat B, Rabaey D, Jansen S, (2011) Testing hypotheses that link wood anatomy to cavitation resistance and hydraulic conductivity in the genus Acer. New Phytologist 190, 709-723 Levitt, J (1980) Responses of plants to environmental stresses. Academic Press, New York
Lovisolo C, and Schubert A (1998) Effect of water stress on vessel size and xylem hydraulic conductivity in Vitis vinifera L. J. Exp. Bot. 49, 693-700
Lombardini L in Ecophysiology of plants in dry environments in Dryland Ecohydrology. Paolo D’Odorico and Amilcare Porporato (Eds) Springer Verlag. ISBN-13 978-1-4020-4261-4
Lens F, Sperry J, Christman MA, Choat B, Rabey D, Jansen S (2010) Testing hypotheses that link wood anatomy to cavitation resistance and hydraulic conductivity in the genus Acer.New Phytologist 190:709-723 Loepfe L, Martinez-Vilalta J, Piñol J, Mencuccini M (2007) The relevance of xylem network structure for plant hydraulic efficiency and safety.Journal of Theoretical Biology 247,788-803. Lo Gullo M.A. & Salleo S, (1991) Three different methods for measuring xylem cavitation and embolism: a comparison. Annals of Botany 67, 417-424 López Cadenas de Llano F, Mintegui Aguirre JA (1982) Hidráulica. Fundación Conde del Valle de Salazar. ETSI Montes Lowenstein NJ & Pallardy SG (1998) Drought tolerance, xylem sap abscisic acid and stomatal conductance during soil drying: a comparison of canopy trees of three temperate deciduous angiosperms. Tree Physiology 18, 421–430 Luostarinen, K and Möttöneen V (2010) Radial Variation in the Anatomy of Betula pendula Wood from Different Growing Sites. Baltic Forestry 16 (2):209-216.
170
Machado J-L, Tyree MT (1994) Patterns of hydraulic architecture and water relations of two tropical canopy trees with contrasting leaf phenologies: Ochroma pyramidale and Pseudobombax septenatum. Tree Physiology 18,219-240 Maherali H, Pockman WT, Jackson RB (2004) Adaptive variation in the vulnerability of woody plants to xylem cavitaiton. Ecology 85 (8),2184-2199 Manzoni S, Vico G, Katul G, Palmroth S, Jackson RB, Porporato A (2013) Hydraulic limits on maximum plant transpiration and the emergence of the safety-efficiency trade-off. New Phytol 198, 169-178 Martínez-Vilalta J. Prat E., Oliveras I., Piñol J. (2002) Xylem hydraulic properties of roots and stems of nine Mediterranean Woody species. Oecologia 133, 19-29
Martorell S, Diaz-Espejo A, Medrano H, Ball MC, Choat B (2014) Rapid hydraulic recovery in Eucalyptus pauciflora after drought: linkages between stem hydraulics and leaf gas exchange Plant, Cell & Environment 37, 3617–626
Matzner SL, Rice KJ, Richards JH (2003) Patterns of stomatal conductance among blue oak (Quercus douglasii) size classes and populations: implications for seedling establishment. Tree Physiol 23,777-784 Mediavilla S, Escudero A (2003) Mature trees versus seedlings: Differences in leaf traits and gas exchange patterns in three co-occurring Mediterranean oaks. Ann For Sci 60,455-460 Medrano H, Escalona JM, Bota J, Gulías J, Flexas J (2002) Regulation of photosynthesis of C3 plants in response to progressive drought: stomatal conductance as a reference parameter. Ann Bot 89,895-905 Mc Adam S.A.M. & Brodribb T.J (2015) 167,833-843: The evolution of mechanisms driving the stomatal response to vapor pressure deficit. Plant Physiology 167, 833–843 McCully ME (1999) Root xylem embolisms and refilling. Relation to water potentials of soil, roots and leaves, and osmotic potentials of root xylem sap. Plant Physiology 119, 1001-1008. Meinzer FC (2002). Co-ordination of vapour and liquid phase water transport properties in plants. Plant, Cell & Environment.25, 265-274. Meinzer FC, Johnson DM, Lachenbruch B, McCulloh KA, Woodruff DR (2009) Xylem hydraulic safety margins in woody plants: coordination of stomatal control of xylem tension with hydraulic capacitance. Funct Ecol 23,922-930 Melcher PJ, Zwieniecki A, Holbrook NM (2003) Vulnerability of xylem vessels to cavitation in sugar maple.Scaling from individual vessels to whole branches. Plant Physiology 131, 1775-1780. Melcher P J, Holbrook N M, Burns M J, Zwieniecki M A, Cobb A R, Brodribb T J, Choat B, Sack L (2012) Measurements of stem xylem hydraulic conductivity in the laboratory and field.Review. Methods in Ecology and Evolution 3, 685–694. Monsi M, Saeki T, (2005). On the factor light in plant communities and its importance for matter production. Ann Botany, 95 549-567.
171
Montes F, Pita P, Rubio A, Cañellas I, (2007) Leaf area index estimation in mountain even-aged Pinus Silvestris L. stands from hemispherical photographs. Agricultural Forest Meteorology, 145 215-228.
Nardini A, Pitt F (1999) Drought resistance of Quercus pubescens as a function of root hydraulic conductance, xylem embolism and hydraulic architecture. New Phytol. 143,485-493. Nardini N, Salleo S (2000) Limitation of stomatal conductance by hydraulic traits: sensing or preventing xylem cavitation? Trees 15:14-24 Nobel PS, (2009) Physicochemical and environmental plant physiology. Elsevier, Oxford. Noblin X, Mahadevan L, Coomaraswamy IA, Wietz DA, Holbrook NM, & Zwienecki MA. Proceedings of the National Academy of Sciences of the Unites States of America (105) 27, 9140-9144. Doi: 10.1073/pnas.0709194105 Nonami H, Boyer JS (1989).Turgor and growth at low water potentials. Plant Physiology 89, 798-804. Ocheltree TW Nippert JB, Prasad PVV (2013) Stomatal response to changes in vapor pressure deficit reflects tissue-specific differences in hydraulic conductance. Plant Cell Environ doi: 10.1111/pce.12137 Pammenter NW & Vander Willigen C, (1998).A mathematical and statistical analysis of the curves illustrating vulnerability of xylem to cavitation.Tree Physiology18, 589-593. Pangle RE, Limousin JM, Plaut JA, Yepez EA Hudson PJ Boutz AL, Gehres N, Pockman WT,
McDowell NG (2015) Prolonged experimental drought reduces plant hydraulic conductance and
transpiration and increases mortality in a piñon–juniper woodland. Ecology and Evolution
5(8),1618-1638. doi:10.1002/ece3.1422.
Pearce DW, Millard S, Bray DF, Rood SB (2005) Stomatal characteristic of riparian poplar species in a semi-arid environment. Tree Phys 26:211-218 Pellis, A., Laureysens, I.,Ceulemans, R. (2004) Growth and production of a short rotation coppice culture of poplar I. Clonal differences in leaf characteristics in relation to biomass production. Biomass Bionergy, 27, 9-19.
Pereira JS (1995). Gas Exchange and Growth. In: Ecophysiology of Photosynthesis (Schulze ED, Caldwell MM eds) Springer Verlag. pp. 147-181. Piñol J, Sala A (2000) Ecological implications of xylem cavitation for several Pinaceae in the Pacific Northern USA. Funtional Ecology 14:538-545. Pita P, Soria F, Cañas I, Toval G, Pardos JA (2001a) Carbon isotope discrimination and its relationship to drought resistance under field conditions in genotypes of Eucalyptus globulus Labill. For. Ecol. Manage. 141,211-221. Pita P, Pardos JA (2001b) Growth, leaf morphology, water use and tissue water relations of Eucalyptus globulus clones in response to water deficit. Tree Phys 21, 599-607
172
Pita P, Gascó A, Pardos JA (2003) Xylem cavitation, leaf growth and leaf water potential in Eucalyptus globulus clones under well-watered and drought condictions. Functional Plant Biology 30, 891-899 Prior LD, Eamus D (2000) Seasonal changes in hydraulic conductance, xylem embolism and leaf area in Eucalyptus tetrodonta and Eucalyptus miniata saplings in a north Australia savanna. Plant, Cell and Environment 23, 955-965 Plavcová L, Hacke UG & Sperry JS (2011) Linking irradiance-induced changes in pit membrane ultrastructure with xylem vulnerability to cavitation. Plant, Cell and Environment 34, 501-513. Plavcová L, Hacke UG (2012) Phenotypic and developmental plasticity of xylem in hybrid poplar saplings subjected to experimental drought, nitrogen fertilization and shading. Journal of experimental Botany, 63(18) 6481-6491
Plavcová L, Jansen S, Klepsch M , Hacke U G (2013) Nobody’s perfect: can irregularities in pit structure influence vulnerability to cavitation?Frontiers in plant science http://dx.doi.org/10.3389/fpls.2013.00453. Poorter H, Bühler J, Van Dusschoten D, Climent J, Postma JA. 2012. Pot size matters: a meta-analysis of the effects of rooting volume on plant growth. Funct Plant Biol, 39: 839-850. Pockman WT, Sperry JS. (2000). Vulnerability to cavitation and the distribution of Sonoran desert vegetation. American Journal of Botany 87, 1287–1299.
Reinhart Ceulemans R, Hinckley T. M., Impens I.( 1989) Stomatal response of hybrid poplar to incident light, sudden darkening and leaf excision Physiologia Plantarum, 75, (2), 174–182. Rice KJ, Matzner SL, Byer W, Brown JR (2004) Patterns of tree dieback in Queensland, Australia: the importance of drought stress and the role of resistance to cavitation. Oecologia 139,190-198 Ridge CR, Hinckley TM, Stettler RE, Van Volkenburgh, E (1986) Leaf growth characteristics of fast growing poplar hybrids Populus trichocarpa x P.deltoides. Tree Physiol, 1 209-216. Ripullone F, Guerrieri MR, Nole A, Magnani F, Borghetti M (2007) Stomatal conductance and leaf water potential responses to hydraulic conductance variation in Pinus pinaster seedlings. Tree Struct Funct. 21:371-378 Rockwell FE, Wheeler J K, Holbroodk N.M. (2014) Cavitation and its discontents: Opportunities for resolving current controversies. Plant physiology 164, 1649-1660. Rockwood DL, Alan W R, Ralph SA, Zhu JY and Winandy JE, (2008) Energy Product Options for Eucalyptus Species Grown as Short Rotation Woody Crops Int. J. Mol. Sci. 9(8), 1361-1378
Salleo S, Nardini A, Pitt F & Lo Gullo M A (2000) Xylem cavitation and hydraulic control of stomatal conductance in laurel (Laurus nobilis L.) Plant Cell Environ 23, 71–79 Rodrigues ML, Santos TP, Rodrigues AP, de Souza CR, Lopes CM, Maroco JP, Pereira JS, Chaves MM, (2008) Hydraulic and chemical signalling in the regulation of stomatal conductance and plant water use in field grapevines growing under deficit irrigation. Funct Plant Biol 35: 565-579 SAS 9.2. STAT. Users guide SAS Institute, Cary, NC
173
Scaracia-Mugnozza, R Ceulemans, P E Heilman, J G Isebrands, R F Stettler, T M Hinckley (1997) Production physiology and morphology of Populus species and their hybrids grown under short rotation. II. Biomass components and harvest index of hybrid and parental species clones. Canadian Journal of Forest Research, 1997, 27(3), 285-294. Scholz FG, Bucci SJ, Goldstein G, Meinzer FC, Granco AC, Miralles WF. (2007). Removal of nutrient limitations by long-term fertilization decreases nocturnal water loss in savanna trees. Tree Physiology 27, 551-559 Schreiber SG, Hacke UG, Hamann A, Thomas BR (2011) Genetic variation of hydraulic and wood anatomical traits in hybrid poplar and trembling aspen. New Phytol. 190(1), 150-60
Schroeder, J.I., Allen, G.J., Hugouvieux, V., Kwak, J.M., and Waner, D. (2001) Guard cell signal transduction. Annu. Rev. Plant Physiol. Plant Mol. Biol. 52, 627-658
Secchi F, Zwieniecki MA.(2010). Patterns of PIP gene expression in Populus trichocarpa during recovery from xylem embolism suggest a major role for the PIP1 aquaporin subfamily as moderators of refilling process. Plant Cell Environ. 33(8):1285-97
Secchi F, Zwieniecki MA (2012) Analysis of xylem sap from functional (non-embolized) and non-functional vessels of Populus nigra- chemistry of refilling. Plant Physiogy doi: 10.1104/pp. 112. 200824 Selling A, Niglas A, Öunapuu-Pikas E, Kupper P (2014) Rapid and long-term effects of water deficit on gas exchange and hydraulic conductance of silver birch trees grown under varying atmospheric humidity. BMC Plant Biol 14:72, doi: 10.1186/1471-2229-14-72
Seltman H. Experimental design and analysis (2015) Chapter 10 http://www.stat.cmu.edu/∼hseltman/309/Book/Book.pdf Sharp RG, Davies WJ (2009) Variability among species in the apoplastic pH signalling response to drying soils. J Exp Bot 60:4363-4370 Shen F, Wang Y, Cheng Y, Zhang L (2012). Three types of cavitation caused by air seeding. Tree Physiology (2012) doi:10.1093/treephys/tps089. Sixto H, Hernández, MJ, Barrio M, Carrasco J, Cañellas I (2007). Plantaciones del género Populus para la producción de biomasa con fines energéticos. Invest. Agrar: Sist Recur For, 16 277- 294.
Sixto H, Salvia J, Barrio M, Ciria MP, Cañellas I (2010) Genetic variation and genotype-environment interactions in short rotation Populus plantations in southern Europe. DOI 10.1007/s11056-010-9244-6. Sixto, H, Hernández, MJ, De Miguel J, Cañellas, I (2013) Red de parcelas de cultivos leñosos en alta densidad y turno corto. Monografías INIA. Serie Forestal nº25.Editor: INIA. ISBN:978-84-7498-559-7.
Sobeih WY, Dodd IC, Bacon MA, Grierson D, Davies WJ (2004) Long-distance signals regulating stomatal conductance and leaf growth in tomato (Lycopersicon esculentum) plants subjected to partial root- zone drying. J Exp Bot 55,2353-2363
174
Sparks JP, Black RA (1999) Regulation of water loss in populations of Populus trichocarpa: the role of stomatal control in preventing xylem cavitation. Tree Physiol. 19,453-459 Sperry JS, Donnelly JR, Tyree MT (1988) A method for measuring hydraulic conductivity and embolism in xylem.Plant, Cell and Environment 11,35-40 Sperry JS (2000) Hydraulic constraints on plant gas exchange. Agricultural and Forest Meteorology 104:13-23. Sperry JS, (2004) Coordinating stomatal and xylem functioning-an evolutionary perspective. New Phytol 162,568-570 Sperry, J. S., Meinzer, F. C. and McCulloh, K. A. (2008) Safety and efficiency conflicts in hydraulic architecture: scaling from tissues to trees. Plant, Cell & Environment, 31, 632–645. Sperry JS, Christmann MA, Torres-Ruiz JM, Taneda H, Smith DD (2012) Vulnerability curves by centrifugation: is there an open vessel artefact, and are ‘r’ shaped curves necessarily invalid? Plant Cell Environ. 35(3), 601-10. Sterck F, Markesteijn L, Schieving F, Poorter L (2011) Functional traits determine trade-offs and niches in a tropical forest community. PNAS 108 (51): 20627-20632 Stiller V, Sperry J S, (2002)Cavitation fatigue and its reversal in sunflower (Helianthus annuus L.) Journal of Experimental Botany 53 (371),1155-1161 Strong T, Hansen E (1993) Hybrid poplar spacing/productivity relations in short rotation intensive culture plantations. Biomass Bioenergy, 4, 255-261.
Tardieu F, Lafarge T, Simonneau T (1996) Stomatal control by fed or endogeneous xylem ABA in sunflower: interpretation of correlation between leaf water potential and stomatal conductance in anisohydric species. Plant, Cell & Environment 19, 75-84
Tardieu F, Simonneau T (1998) Variability among species of stomatal control under fluctuating soil water status and evaporative demand: modelling isohydric and anisohydric behaviours. Journal of Experimental Botany 49, 419–432. Tognetti R, Longobucco A, Raschi A (1998) Vulnerability of xylem to embolism in relation to plant hydraulic resistance in Quercus pubescens and Quercus ilex co-occurring in a Mediterranean coppice stand in central Italy. New Phytol 139, 437-447. Tombesi S., Nardini A., Frioni T, Soccolini M, Zadra C, Farinelli D, Poni S, Palliotti A (2015) Stomatal closure is induced by hydraulic signals and maintained by ABA in drought-stressed grapevine. Scientific Reports 5, Article number:12449. doi:10.1038/srep12449 Trifilò P, Barbera PM, Raimondo F, Nardini A, LoGullo MA (2013) Coping with drought-induced xylem cavitation: coordination of embolism repair and ionic effects in three Mediterranean evergreens. Tree Phys 00:1-14 doi:10.1093/treephys/tpt119
Tyree MT, Sperry SJ (1988) Do woody plants operate near the point of catastrophic xylem dysfunction caused by dynamic water stress? Plant Physiol 88:574-580
175
Tyree MT, Davis SD, Cochard H, (1994) Biophysical perspectives of xylem evolution - is there a tradeoff of hydraulic efficiency for vulnerability to dysfunction? International Association of Wood Anatomists Journal 15, 335–360
Tyree MT, Salleo S, Nardini A, Lo Gullo MA, Mosca R (1999) Refilling of embolized vessels in young stems of laurel. Do we need a new paradigm? Plant Physiol 120:11-21 Tyree MT, Sperry JS (1989). Vulnerability of xylem to cavitation and embolism. Ann. Rev. Plant. Phys. MOl. Bio 40, 19-38 Tyree MT, Zimmermann MH, (2002) Xylem structure and the ascent of sap. Springer Series in Wood Science Springer-Verlag Berlin Heidelberg New York UNFCCC(94) http://unfccc.int/resource/cd_roms/na1/v_and_a/Spanish/v_a_handbook/Capitulo_7_Agricultura.doc.
Urli M, Portè AJ, Cochard H, Guengant Y, Burlett R, Delzon S (2013) Xylem embolism threshold for catastrophic hydraulic failure in angiosperm trees. Tree Phys 33:672-683 doi:10.1093/treephys/tpt030
Vander Willigen C, Pammenter NW (1998)Relationship between growth and xylem hydraulic characteristica of clones of Eucalyptus spp. at contrasting sites. Tree Physiology 18,595-600 Vander Willigen C, Sherwin HW, Pammenter NW (2000)Xylem hydraulic characteristics of subtropical trees from contrasting habitats grown under identical environmental conditions. New Phytol.145, 51-59 Van Ieperen W, van Meeteren U. van Gelder H (2000) Fluid ionic composition influences hydraulic conductance of xylem conduits. Journal of Experimental Botany 51,769-776 Van Ieperen W, Nijsse J, Keijzer CJ, Van Meeteren U. (2001) Induction of air embolism in xylem conduits of pre-defined diameter. Journal of Experimental Botany 52, 981-991. Warren-Wilson J,(1963)Estimation of foliage denseness and foliage angle by inclined point quadrats. Aust.J. Bot, 11, 95-105.
Warren-Wilson J, Reeve JE (1959).Analysis of the spatial distribution of foliage by two-dimensional point quadrats. New Phytol, 58 92-101
Weiss M, Baret F, Smith GJ, Jonckheere I, Coppin P (2004).Review of methods for in situ leaf area index (LAI) determination. Part II.Estimation of LAI, errors and sampling. Agric.Forest.Meteor.121, 37-53
Vergeynst LL, Dierick M, Bogaers J, Cnudde V, Steppe K (2014) Cavitation: a blessing in disguise?New method to establish vulnerability curves and assess hydraulic capacitance of woody tissues. Tree Physiology doi:10.1093/treephys/tpu056 Verlinden, M.S., Broeckx, L.S., Van den Bulcke, J., Van Acker, J., Ceulemans, R. (2013) Comparative study of biomass determinants of 12 poplar (Populus) genotypes in a high-density short-rotation culture.Forest Ecology and Management. 307 101-111.
176
Vilagrosa A, Bellot J, Vallejo VR, Gil-Pelegrín E (2003).Cavitation, stomatal conductance, and leaf dieback in seedlings of two co-occurring Mediterranean shrubs during an intense drought. Journal of Experimental Botany 54 (390):2015-2024 Vilagrosa A, Chirino E, Peguero –Pina JJ, Barigah TS, Cochard H, Gil Pelegrín E. (2012) Xylem cavitation and embolism in plants living in water-limited ecosystems. In: Plant Responses to drought stresss. From Morphological to Molecular Features. Springer Verlag. Editor Ricardo Aroca. ISBN 978-3-642-32652-3 Vinya R, Malhi Y, Joshua BF, Brown N, Brodribb T, Aragao. (2013) Xylem cavitation vulnerability influences tree species’ habitat preferences in miombo woodlands. L.E. Oecologia 173, 711–720
Wang T, Aitken SN, Kavanagh KL (2003) Selection for improved growth and wood quality in lodgepole pine: effects on phenology, hydraulic architecture and growth of seedlings.Trees. 17:269-277 Wan X, Landhäusser SM, Zwiazek JJ, Lieffers VJ (2004) Stomatal conductance and xylem sap properties of aspen (Populus tremuloides) in response to low soil temperature. Physiol Plant 122:79-85 Weiss M, Baret F, Smith GJ, Jonckheere I, Coppin P (2004).Review of methods for in situ leaf area index (LAI) determination. Part II.Estimation of LAI, errors and sampling. Agric.Forest.Meteor,121 37-53……
Weitz JS, Ogle K, Horn HS (2006).Ontogenetically stable hydraulic design in woody plants. Functional Ecology 20, 191-199. Wheeler JK, Sperry JS, Hacke U., Hoang N. (2005) Inter-vessel pitting and cavitation in Woody Rosaceae and other vesselled plants: a basis for a safety versus efficiency trade-off in xylem transport. Plant, Cell and Environment 28, 800-812. Wilkinson S, Davies WJ (1997) Xylem sap pH increase: a drought signalreceived at the apoplastic face of the guard cell that involves the suppression of saturable abscisic acid uptake by the epidermal symplast.Plant Physiol 113: 559–573 Wilkinson S, Corlett JE, Oger L, Davies WJ (1998) Effects of xylepH on transpiration from wild-type and flacca tomato leaves. Plant Physiology 117, 703–709. Wikberg J, Ögren E (2004) Interrelationships between water use and growth traits in biomass-producing willows. Trees 18:70-76 Wikberg J, Ögren E (2007). Variation in drought resistance, drought acclimation and water conservation in four willow cultivars used for biomass production. Tree Physiology 27:1339-1346. Wu R, Hincley TM (2001). Phenotypic Plasticity of Sylleptic Branching: Genetic Design of Tree Architecture. Critical Reviews In Plant Sciences 20(5):467-485. Xie X, Wang Y, Williamson L, Holroyd GH, Tagliavia C, Murchie E, Theobald J, Knight MR, Davies WJ, Leyser HM (2006). The identification of genes involved in the stomatal response to reduced atmospheric relative humidity. Curr Biol 16: 882–887.

177
Zavitkovsi J, Isebrands, JG, Dawson, DH (1976). Productivity and utilization potential of short rotation Populus in the Lake States. In: THIELGES, B.A.; LAND S.B. (eds.): Proceedings of Symposium on Eastern Cottonwood and Related Species 392-401. Baton Rouge. Louisiana State University.
Zimmermann MH, Jeje AA (1981). Vessel-length distribution in stems of some American woody plants. Canadian Journal of Botany 59, 1882-1892
Zwieniecki MA, Holbrook NM (1998) Diurnal variation in xylem hydraulic conductivity in white ash (Fraxinus americana L.), red maple (Acer rubrum L.) and red spruce (Picea rubens Sarg.). Plant, Cell and Environment