1.Índice de Calidad Del Agua de Cuerpos de Agua de Bangladesh
9
GLOB L ENGINEERS & TECHNOLOGISTS REVIEW www.getview.org G.L.O.B.A.L E.N.G.I.N.E.E.R.S. .& .-.T.E.C.H.N.O.L.O.G.I.S.T.S R.E.V.I.E.W 1 RUMMAN MOWLA CHOWDHURY 1 , SARDAR YAFEE MUNTASIR 2 and M. MONOWAR HOSSAIN 3 1, 3 Institute of Water Modelling Dhaka, BANGLADESH 1 [email protected] 2 Department of Civil Engineering Stamford University Bangladesh 51, Siddeswari Road, Dhaka – 1217, BANGLADESH 2 [email protected] 3 Department of Water Resources Engineering Bangladesh University of Engineering and Technology Dhaka-1000, BANGLADESH 3 [email protected] 1.0 INTRODUCTION Water is a unique resource because it is essential for all life and it constantly cycles between the land and the atmosphere. The same water that is used for crop and animal production can also be shared with the public and the aquatic and terrestrial ecosystems (Cooper et al., 1998). Water resources are of great environmental issues and studied by a wide range of specialists including hydrologists, engineers, ecologists, geologists and geo morphologists (Kumar and Dua, 2009). It has become an important issue for them as it affects not only human uses but also plant and animal life. For healthy living, potable safe water is absolutely essential. It is a basic need of all human being to get the adequate supply of safe and fresh drinking water. One of the most effective ways to communicate water quality is Water Quality Index (WQI), where the water quality is assessed on the basis of calculated water quality indices. Quality of water is defined in terms of its physical, chemical, and biological parameters. However, the quality is difficult to evaluate from a large number of samples, each containing concentrations for many parameters (Almeida, 2007). Horto n (1965) proposed the first WQI, a great deal of consideration has been given to the development of index methods. A water quality index provides a single number that expresses overall water quality at a certain location on several water quality parameters and turns complex water quality data into information that is understandable and useable by the general people. WQI is a mathematical instrument used to transform large quantities of water quality data into a single number which represents the water quality level while eliminating the subjective assessments of water quality and biases of individual water quality experts. Basically a WQI attempts to provide a mechanism for presenting a cumulatively derived, numerical expression defining a certain level of water quality (Miller et al., 1986). Comparison can be made through the ABSTRACT Water quality parameters of 34 different water stations along the Faridpur-Barishal road in Bangladesh were collected to determine water quality index (WQI). Six most important parameters - pH, total dissolved solids, dissolves oxygen, biochemical oxygen demand, electrical conductivity and temperature difference were considered for WQI. The WQI was assessed using a weighted arithmetic index method and National Sanitation Foundation method. According to the arithmetic mean method WQI values vary between 19 and 96, wherein NSF Method WQI values vary between 55 and 91. In weighted arithmetic index method highest favourable value gives a low statistical value to the index whereas lowest favourable value gives a low statistical value to the index in NSF method. The values of the WQI showed that the water of the maximum stations are poor and very poor in condition, few of them can be referred to as good, and among all water stations only one of the stations Id(p-7) contains excellent water q uality parameter for human consumption and other uses. The results revealed that although WQI of most of the water bodies are beyond acceptable limit but could be used for domestic and household purpose after purification. Keywords: Water Quality Index, Pre-Monsoon, Dissolved Oxygen, Biochemical Oxygen Demand, Total Dissolved Solids. WATER QUALITY INDEX OF WATER BODIES ALONG F ARIDPUR-BARISAL RO AD IN BANGLADESH
-
Upload
luis-arturo -
Category
Documents
-
view
224 -
download
0
Transcript of 1.Índice de Calidad Del Agua de Cuerpos de Agua de Bangladesh

8/16/2019 1.Índice de Calidad Del Agua de Cuerpos de Agua de Bangladesh
http://slidepdf.com/reader/full/1indice-de-calidad-del-agua-de-cuerpos-de-agua-de-bangladesh 1/8
GLOB L ENGINEERS& TECHNOLOGISTS REVIEW
www.getview.org
G.L.O.B.A.L E.N.G.I.N.E.E.R.S. .& .-.T.E.C.H.N.O.L.O.G.I.S.T.S R.E.V.I.E.W
1
RUMMAN MOWLA CHOWDHURY1, SARDAR YAFEE MUNTASIR2 and M. MONOWAR HOSSAIN3
1, 3Institute of Water ModellingDhaka, BANGLADESH
2 Department of Civil EngineeringStamford University Bangladesh
51, Siddeswari Road, Dhaka – 1217, [email protected]
3Department of Water Resources Engineering
Bangladesh University of Engineering and Technology
Dhaka-1000, [email protected]
1.0 INTRODUCTION Water is a unique resource because it is essential for all life and it constantly cycles between the land and theatmosphere. The same water that is used for crop and animal production can also be shared with the public andthe aquatic and terrestrial ecosystems (Cooper et al., 1998). Water resources are of great environmental issuesand studied by a wide range of specialists including hydrologists, engineers, ecologists, geologists and geomorphologists (Kumar and Dua, 2009). It has become an important issue for them as it affects not only humanuses but also plant and animal life.
For healthy living, potable safe water is absolutely essential. It is a basic need of all human being to get theadequate supply of safe and fresh drinking water. One of the most effective ways to communicate water qualityis Water Quality Index (WQI), where the water quality is assessed on the basis of calculated water qualityindices. Quality of water is defined in terms of its physical, chemical, and biological parameters. However, thequality is difficult to evaluate from a large number of samples, each containing concentrations for manyparameters (Almeida, 2007). Horton (1965) proposed the first WQI, a great deal of consideration has been givento the development of index methods. A water quality index provides a single number that expresses overallwater quality at a certain location on several water quality parameters and turns complex water quality data
into information that is understandable and useable by the general people. WQI is a mathematical instrument
used to transform large quantities of water quality data into a single number which represents the water qualitylevel while eliminating the subjective assessments of water quality and biases of individual water qualityexperts. Basically a WQI attempts to provide a mechanism for presenting a cumulatively derived, numericalexpression defining a certain level of water quality (Miller et al., 1986). Comparison can be made through the
ABSTRACT
Water quality parameters of 34 different water stations along the Faridpur-Barishal road inBangladesh were collected to determine water quality index (WQI). Six most important parameters - pH, total dissolved solids, dissolves oxygen, biochemical oxygen demand, electrical conductivity andtemperature difference were considered for WQI. The WQI was assessed using a weighted arithmeticindex method and National Sanitation Foundation method. According to the arithmetic meanmethod WQI values vary between 19 and 96, wherein NSF Method WQI values vary between 55and 91. In weighted arithmetic index method highest favourable value gives a low statistical value tothe index whereas lowest favourable value gives a low statistical value to the index in NSF method.
The values of the WQI showed that the water of the maximum stations are poor and very poor incondition, few of them can be referred to as good, and among all water stations only one of thestations Id(p-7) contains excellent water quality parameter for human consumption and other uses.The results revealed that although WQI of most of the water bodies are beyond acceptable limit butcould be used for domestic and household purpose after purification.
Keywords: Water Quality Index, Pre-Monsoon, Dissolved Oxygen, Biochemical Oxygen Demand,Total Dissolved Solids.
WATER QUALITY INDEX OF WATER BODIES ALONG
FARIDPUR-BARISAL ROAD IN BANGLADESH

8/16/2019 1.Índice de Calidad Del Agua de Cuerpos de Agua de Bangladesh
http://slidepdf.com/reader/full/1indice-de-calidad-del-agua-de-cuerpos-de-agua-de-bangladesh 2/8
Global Engineers & Technologists Review, Vol.2 No.3 (2012)
© 2012 GETview Limited. All rights reserved
2
WQI among the water bodies and a general analysis of water quality on different levels can be made. A waterquality index is a means to summarize large amounts of water quality data into simple terms (e.g., poor, goodetc.) for reporting to management and the public in a consistent manner.
Importance of water bodies along the roadside is evident in terms of water quality, biodiversityconservation and use for aquaculture, as maximum of the water bodies of Bangladesh are expected to beproductive. So utilization of the existing resources is very much vital. In the way to improving the condition ofthese water resources, its proper management is very much necessary and for doing this all information on the
resources namely physico-graphic, chemical and biological characteristic of these water resources must becollected. The objective of this paper is to determine the WQI of 34 water bodies along Faridpur-Barishal road.Drinking water contamination and variation of drinking water quality in pre-monsoon is the basis of calculatedvalues of WQI as concentrations of different water quality parameters tend to be at its worse condition duringpre-monsoon season. Based on the WQI an assessment was made whether these water bodies are acceptable fordomestic use and even for drinking purpose. Local people living along this road are completely dependent onthese water bodies as there is no proper water supply made to meet their needs. For this reason, this analysis isextremely necessary so that people living in these areas can mark out the best water source available. Also ifthey need more water badly they can also determine which water bodies can used after proper treatment isdone. Similar type of studies have been done in India by Chauhan and Singh, (2010), where WQI values weredetermined in several stations along Ganges River so that quality of water can be seen along the river. Alsoseveral studies have been performed to determine water qualities along streams (Abrahão et al., 2010) where
effluents come from industries. But this study has its individual significance as WQI values of 34 stations weretaken along a road’s length of a specific region in Bangladesh. Although in some places a confined research maybe done like determining WQI of local ponds, but along roadside water bodies this type of study is not available.
2.0 STUDY AREA AND METHODOLOGY The present study was conducted along the priority road which is of 128 km in length, touching 4 districtsnamely - Barishal, Madaripur, Gopalngonj and Faridpur. The parameters - water temperature, pH, dissolvedoxygen, total dissolved solids (TDS) and electrical conductivity (EC) of 34 different locations along Faridpur-Barishal road during pre monsoon (March until April in 2011) was collected and analyzed immediately at thesampling site using standard equipment. The study area is shown on a satellite image with 34 sampling stationsin Figure 1. Sampling stations were numbered arbitrarily for convenience of records. Sampling date, place andtime were recorded on the sampling bottles. For BOD measurement, a 500ml bottle was used for collection of
water samples and the oxygen was fixed at the sampling site before being carried to the laboratory for furtheranalysis.
Figure 1: Index map of study area
The examination and analysis of the water bodies including laboratory analysis was done as per thestandard methods of USEPA, (2004) and (Trivedi and Goel, 1986). The calculation of WQI was made usingweighted arithmetic index method (Brown et al., 1972) and National Sanitation Foundation method. Finallyassessment of surface water quality based on water quality index was done. Table 1 shows the details of analysismethods and necessary equipments used in the study.

8/16/2019 1.Índice de Calidad Del Agua de Cuerpos de Agua de Bangladesh
http://slidepdf.com/reader/full/1indice-de-calidad-del-agua-de-cuerpos-de-agua-de-bangladesh 3/8
Global Engineers & Technologists Review, Vol.2 No.3 (2012)
© 2012 GETview Limited. All rights reserved
3
Table 1: Details of physic-chemical parameters, analysis methods and t he equipments
3.0 WQI COMPUTATION EQUATIONS The calculation of WQI, selection of parameters has great value. The water quality index will widen if too manyparameters are used. Importance of various parameters depends on the intended use of water. Four parameterswhich is pH, TDS, δT, DO were used to calculate WQI by national sanitation foundation method. Five physico-chemical parameters namely pH, TDS, EC, DO, BOD were used to calculate wqi by the weighted arithmetic indexmethod. Several steps of weighted arithmetic index method are given (brown et al., 1972) in the following steps:
3.1 Calculation of Sub Index of Quality Rating (qn)
Let there be n water quality parameters where the quality rating or sub index (qn) corresponding to thenth parameter is a number reflecting the relative value of this parameter in the polluted water withrespect to its standard permissible value. The value of qn is calculated using the following expression.
qn = 100[(Vn - Vio) / (Sn - Vio)] (1)
Where,qn = quality rating for the nth water quality parameter.V n = estimated value of the nth parameter at a given sampling station.S n = standard permissible value of nth parameterV io = ideal value of nth parameter in pure water.
All the ideal values (V io ) are taken as zero for drinking water except for pH = 7.0 and dissolvedoxygen=14.6mg/L. (Tripaty and Sahu, 2005).
3.2 Calculation of Quality Rating for pH
For pH the ideal value is 7.0 (for natural water) and a permissible value is 8.5 (for polluted water).Therefore, the quality rating for pH is calculated from the following relation:
q pH = 100 [(V pH -7.0)/(8.5 -7.0)] (2)
Where,V pH = observed value of pH during the study period.
3.3 Calculation of Quality Rating for Dissolved Oxygen
The ideal value (V DO) for dissolved oxygen is 14.6 mg/L and standard permitted value for drinking wateris 5 mg/L. Therefore, quality rating is calculated from following relation:
qDO = 100 [(V DO - 14.6)/(5 – 14.6)] (3)
Where,V DO = measured value of dissolved oxygen
3.4 Calculation of Unit Weight (Wn)
Calculation of unit weight (W n) for various water quality parameters are inversely proportional to therecommended standards for the corresponding parameters.
W n = K/S n (4)
Where,W n = unit weight for nth parameters
Serial Number Temperature Methodology Equipments
1 Temperature Visible Centigrade Thermometer
2 Salinity Visible Sensaso-CL 410,HACH,USA
3 pH Visible Sensaso-CL 410,HACH,USA
4 Transparency Visible Secchi Disk
5 Dissolved Oxygen Visible Dissolved Oxygen Meter, (Model-YK22 DO ),USA
6 BOD Laboratory Dissolved Oxygen Meter, (Model-YK22 DO),USA
7 Conductivity Visible Conductivity Meter, (Model-CD4302,USA)
8 TDS Visible Sensaso-CL 410,HACH,USA

8/16/2019 1.Índice de Calidad Del Agua de Cuerpos de Agua de Bangladesh
http://slidepdf.com/reader/full/1indice-de-calidad-del-agua-de-cuerpos-de-agua-de-bangladesh 4/8
Global Engineers & Technologists Review, Vol.2 No.3 (2012)
© 2012 GETview Limited. All rights reserved
4
S n = standard value for nth parametersK = constant for proportionality
3.5 Calculation of WQI
WQI is calculated from the following equation:
n n
WQI =∑ qn W n / ∑ W n (5)n=1 n-1
3.6 Calculation of WQI by NSF method
The NSF water quality index was developed by the National Sanitation Foundation (NSF) in 1970. Anequation of NSF water quality index was found by using weighted factor of individual parameter and sub-index of each water quality parameter based on their respective testing values which can be found bywater quality index calculator or water quality index curve of respective parameters. The water qualityindex of individual parameter was calculated from water quality index calculator used by EnvironmentalEngineering and Earth Sciences, Center of Environmental Quality, Wilkes University (Islam et al., 2011).
WQI = 0.17I DO + 0.11I pH + 0.10I ΔT + 0.07I TDS (6)
4.0 RESULTS OF SUB-W ATER QUALITY INDEX Sub water quality index of five parameters for the former method (Brown arithmetic mean method) are given inTable 2 and Sub water quality index of four parameters by the NSF method are given in Table 3.
Table 2: Sub water quality Index of the physico-chemical parameters according to Brown Method.
Station
Sub water quality
Index
(PH)
Sub water quality
Index
(TDS)
Sub water quality
Index
(EC)
Sub water quality
Index
(BOD)
Sub water quality
Index
(DO)
P-1 5.125 0.334 0.087 7.687 36.433
P-2 4.371 0.264 0.070 9.224 38.035
P-3 4.974 0.278 0.073 4.612 26.824
P-4 -25.925 0.122 0.032 18.449 26.024
P-5 16.429 0.116 0.031 3.843 28.025P-6 10.701 0.073 0.020 4.612 46.843
P-7 21.252 0.056 0.015 9.993 29.627
P-8 20.800 0.104 0.028 16.911 27.625
P-9 15.073 0.117 0.031 15.374 40.437
K-1 3.768 0.142 0.038 15.374 45.241
R-1 11.757 0.079 0.020 21.524 32.830
R-2 15.073 0.078 0.021 26.904 30.428
P-10 17.936 0.116 0.031 3.843 41.237
BP-1 8.441 0.118 0.031 3.843 44.440
P-11 22.458 0.098 0.026 18.449 41.638
P-12 33.612 0.124 0.033 23.830 38.035
K-2 20.197 0.132 0.035 4.612 26.024
P-13 4.522 0.171 0.045 3.843 32.429
K-3 0.301 0.148 0.039 29.979 45.641
K-4 5.426 0.137 0.036 20.755 36.433K-5 9.044 0.165 0.044 26.136 42.038
R-3 12.209 0.123 0.031 16.143 34.431
K-6 7.536 0.159 0.042 26.136 50.446
K-7 8.139 0.151 0.040 12.299 46.042
R-4 7.536 0.083 0.022 23.830 41.638
R-5 9.044 0.126 0.033 5.381 52.047
P-14 26.678 0.113 0.030 7.687 34.431
R-6 6.029 0.086 0.022 12.299 45.641
B-1 -3.165 0.589 0.151 5.381 52.047
B-2 1.507 0.410 0.107 6.150 48.444
P-15 4.522 0.115 0.040 9.224 46.042
R-7 20.046 0.229 0.060 17.680 35.232
P-16 0.000 0.361 0.094 9.224 45.641
P-17 18.087 0.119 0.034 9.993 32.830

8/16/2019 1.Índice de Calidad Del Agua de Cuerpos de Agua de Bangladesh
http://slidepdf.com/reader/full/1indice-de-calidad-del-agua-de-cuerpos-de-agua-de-bangladesh 5/8
Global Engineers & Technologists Review, Vol.2 No.3 (2012)
© 2012 GETview Limited. All rights reserved
5
4.1 pH
pH is one of the most important factors that serves as an index for the pollution. The experimental waterbodies were found to be approximately neutral or slightly alkaline. The highest value of pH was 9.23 at P-12 and lowest was 5.28 at P-4. The lowest mean value of pH was 7.67 ± 0.05. A pH between 6.7 and 8.4 issuitable, while pH below 5.0 and above 8.3 is detrimental. In the present investigation pH values werewithin the ICMR standards (7.0 - 8.5) (Tripaty and Sahu, 2005). Maximum Sub water quality index for pHwas found 36 at P-12 station and Minimum was found as -36 at station P-4 according to Brown’s method.
The maximum and minimum values are 35 (P-4) and 95 (P-1) respectively.
Table 3: Sub water quality Index of the physico-chemical parameters according to NSF Method.
4.2 Total Dissolved Solids
The TDS level found to fluctuate from 73.1 mg/l to 766 mg/l within the water bodies. The TDS content
was maximum in B-1 and minimum in P-7 with average of 219.61 ± 1.79 mg/l. The amounts of total solidsare influenced by the activity of the plankton and organic materials. Slightly high value of TDS wererecorded at only one sampling stations and other values were less than the WHO limit. Water containingmore than 500 mg/L of TDS is not considered desirable for drinking water supply. Maximum Sub waterquality index for TDS is found close to 1 (Brown Method) at B-1 station. Minimum Sub water quality indexfor TDS was found almost 0 at rest of the 33 stations (Brown Method). Maximum Sub water quality index
for TDS is found 86 (Station P-7) and minimum Sub water quality index for TDS was found as 20(StationB-1, 2). (NSF method)
4.3 Dissolved Oxygen
The value of DO varied from 1.6 mg/l to 8.1mg/l. The maximum DO value (8.1mg/l) was recorded in K-2and minimum value (1.6mg/l) was recorded in B-1. The mean value of DO was 4.90 ± 0.16mg/l. Concentrations below 5 mg/L may adversely affect the performance and survival of biological
communities and below 2 mg/L may lead to fish mortality. Water without adequate DO may beconsidered wastewater. Maximum Sub water quality index for DO was found 52 at B-1 and minimum subwater quality index for DO was found 26 at P-4 (Brown Method). Maximum Sub water quality index for
StationSub water quality Index
(PH)
Sub water quality Index
(TDS)
Sub water quality Index
(ΔT)
Sub water quality Index
(DO)
P-1 93 42 84 78
P-2 92 54 84 66
P-3 93 52 89 99
P-4 35 78 91 99
P-5 81 79 87 99
P-6 91 84 88 25
P-7 69 86 77 98
P-8 70 80 70 99
P-9 84 79 85 53
K-1 92 75 85 33R-1 90 83 81 84
R-2 84 83 89 93
P-10 77 79 74 53
BP-1 92 79 82 33
P-11 67 81 79 53
P-12 41 77 73 68
K-2 72 76 84 99
P-13 93 70 82 88
K-3 88 74 87 30
K-4 93 75 89 75
K-5 92 71 83 46
R-3 90 78 89 87
K-6 93 72 85 15
K-7 92 73 81 27
R-4 93 83 84 45R-5 92 77 85 11
P-14 57 79 73 87
R-6 93 82 86 30
B-1 83 20 77 11
B-2 90 20 84 20
P-15 93 79 87 30
R-7 72 60 74 87
P-16 88 36 68 30
P-17 77 78 83 88
8/16/2019 1.Índice de Calidad Del Agua de Cuerpos de Agua de Bangladesh
http://slidepdf.com/reader/full/1indice-de-calidad-del-agua-de-cuerpos-de-agua-de-bangladesh 6/8
Global Engineers & Technologists Review, Vol.2 No.3 (2012)
© 2012 GETview Limited. All rights reserved
6
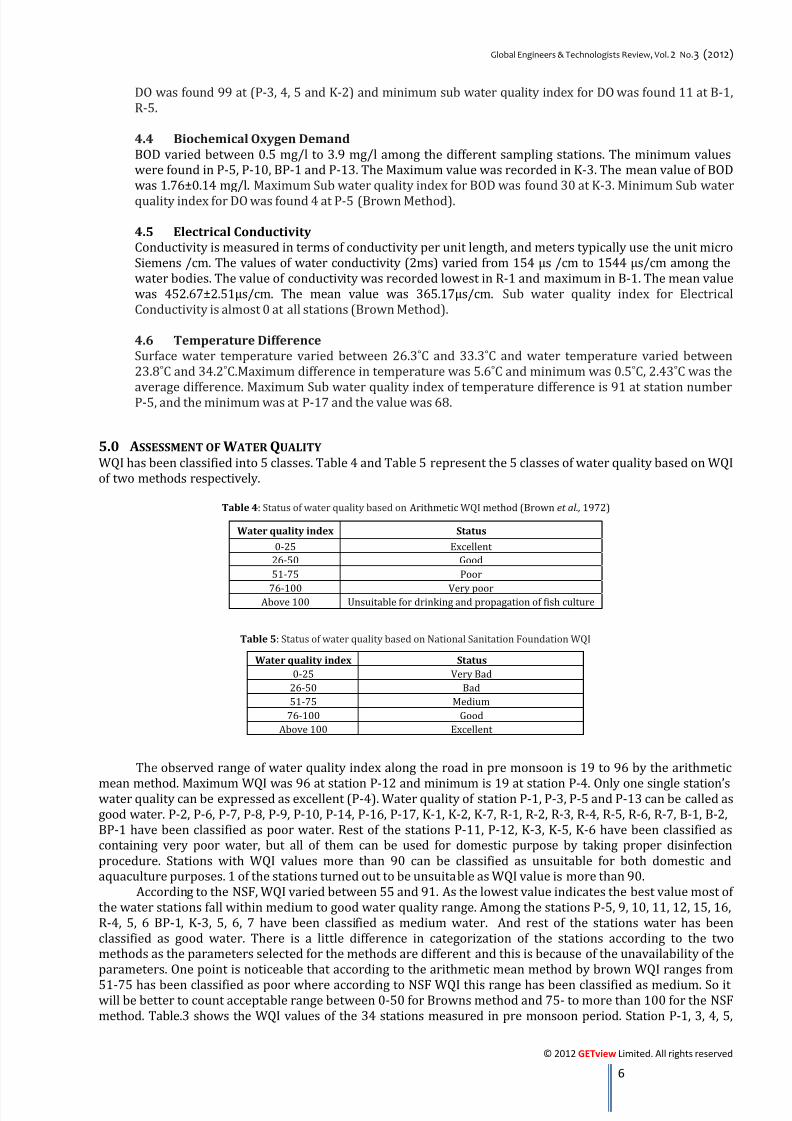
DO was found 99 at (P-3, 4, 5 and K-2) and minimum sub water quality index for DO was found 11 at B-1,R-5.
4.4 Biochemical Oxygen Demand
BOD varied between 0.5 mg/l to 3.9 mg/l among the different sampling stations. The minimum valueswere found in P-5, P-10, BP-1 and P-13. The Maximum value was recorded in K-3. The mean value of BODwas 1.76±0.14 mg/l. Maximum Sub water quality index for BOD was found 30 at K-3. Minimum Sub water
quality index for DO was found 4 at P-5 (Brown Method).
4.5 Electrical Conductivity
Conductivity is measured in terms of conductivity per unit length, and meters typically use the unit microSiemens /cm. The values of water conductivity (2ms) varied from 154 μs /cm to 1544 μs/cm among thewater bodies. The value of conductivity was recorded lowest in R-1 and maximum in B-1. The mean valuewas 452.67±2.51μs/cm. The mean value was 365.17μs/cm. Sub water quality index for ElectricalConductivity is almost 0 at all stations (Brown Method).
4.6 Temperature Difference
Surface water temperature varied between 26.3˚C and 33.3˚C and water temperature varied between23.8˚C and 34.2˚C.Maximum difference in temperature was 5.6˚C and minimum was 0.5˚C, 2.43˚C was the
average difference. Maximum Sub water quality index of temperature difference is 91 at station numberP-5, and the minimum was at P-17 and the value was 68.
5.0 ASSESSMENT OF W ATER QUALITY WQI has been classified into 5 classes. Table 4 and Table 5 represent the 5 classes of water quality based on WQIof two methods respectively.
Table 4: Status of water quality based on Arithmetic WQI method (Brown et al., 1972)
Water quality index Status
0-25 Excellent
26-50 Good
51-75 Poor
76-100 Very poorAbove 100 Unsuitable for drinking and propagation of fish culture
Table 5: Status of water quality based on National Sanitation Foundation WQI
Water quality index Status
0-25 Very Bad
26-50 Bad
51-75 Medium
76-100 Good
Above 100 Excellent
The observed range of water quality index along the road in pre monsoon is 19 to 96 by the arithmetic
mean method. Maximum WQI was 96 at station P-12 and minimum is 19 at station P-4. Only one single station’swater quality can be expressed as excellent (P-4). Water quality of station P-1, P-3, P-5 and P-13 can be called asgood water. P-2, P-6, P-7, P-8, P-9, P-10, P-14, P-16, P-17, K-1, K-2, K-7, R-1, R-2, R-3, R-4, R-5, R-6, R-7, B-1, B-2,BP-1 have been classified as poor water. Rest of the stations P-11, P-12, K-3, K-5, K-6 have been classified ascontaining very poor water, but all of them can be used for domestic purpose by taking proper disinfection
procedure. Stations with WQI values more than 90 can be classified as unsuitable for both domestic andaquaculture purposes. 1 of the stations turned out to be unsuitable as WQI value is more than 90.
According to the NSF, WQI varied between 55 and 91. As the lowest value indicates the best value most ofthe water stations fall within medium to good water quality range. Among the stations P-5, 9, 10, 11, 12, 15, 16,R-4, 5, 6 BP-1, K-3, 5, 6, 7 have been classified as medium water. And rest of the stations water has beenclassified as good water. There is a little difference in categorization of the stations according to the twomethods as the parameters selected for the methods are different and this is because of the unavailability of theparameters. One point is noticeable that according to the arithmetic mean method by brown WQI ranges from
51-75 has been classified as poor where according to NSF WQI this range has been classified as medium. So itwill be better to count acceptable range between 0-50 for Browns method and 75- to more than 100 for the NSFmethod. Table.3 shows the WQI values of the 34 stations measured in pre monsoon period. Station P-1, 3, 4, 5,

8/16/2019 1.Índice de Calidad Del Agua de Cuerpos de Agua de Bangladesh
http://slidepdf.com/reader/full/1indice-de-calidad-del-agua-de-cuerpos-de-agua-de-bangladesh 7/8
Global Engineers & Technologists Review, Vol.2 No.3 (2012)
© 2012 GETview Limited. All rights reserved
7
13 can be classified as the best stations among all. Table 6 represents WQI value of the 34 stations by twomethods. Table 7 represents the maximum, minimum and average value of different parameters. Standard andideal values of different water quality parameters have been shown in Table 8. Guidelines are recommended byWorld Health Organization (WHO) and Indian Council of Medical Research (ICMR).
Table 6: Location wise calculated values of Water Quality Index for pre monsoon period
Table 7: Maximum, minimum and average values of diffrent water quality parameters
Table 8: Drinking water standards and unit weight
Station* Station name
Water quality
index
(weighted
arithmetic
index)
Water quality
index
(National
Sanitation
Foundation WQI)
P-1 Right(Education Board pond1, Barisal) 50 81
P-2 Right(Education Board pond2, Barisal) 52 78
P-3 Left(Roads and Highways pond, Barishal) 37 90
P-4 Right(Forest Office pond) 19 77
P-5 Right(Opposite of Ansar VDP pond) 48 91
P-6 Left(opposite of Madrasha) 62 71
P-7 Right(Tri-road More) 61 87
P-8 Right(pond) 65 84
P-9 Right(Andipur pond, Purbopansha, Babuganj, Barisal 71 73
K-1 Rajguber khal, babuganj, Barisal 65 68
R-1 Duarika (Sugandha) River, Mohiuddin Jahangir bridge, Babuganj, Barisal 66 81
R-2 Shikerpur river, Babuganj, Barisal(M.A. Jalil bridge) 73 84
P-10 Left(Kaler dighi, Dakhin Shikerpur, Ujirpur, Barishal) 63 74
BP-1 Left(Batazor khal), Gournodi, Barisal 57 72
P-11 Right(Shamsul Howlader pond), Batazor, Giurnodi Barishal 83 68
P-12 Left(Mahilara A.N. High School pond), Gournodi, Barishal 96 64
K-2 Ashukathi khal, Gournodi, Barishal 51 88
P-13 Right(Gournodi Busstand pond), Gournodi, Barisal 41 88
K-3 Southern Khal, Koltokshal, Gournodi, Barishal 76 63
K-4 Bhurghata Khal, Kalkini, Maderpur 63 80
K-5 Kornapara khal, Kalkini, Maderipur 77 68
R-3 Mostofapur River, Maderipur 63 85
K-6 Srinerdi khal, Maderipur 84 60
K-7 Kamerer khal, Rajore, Faridpur 67 67
R-4 Kumer nodi(river), Moksudpur, Tekerhat, Gopalgonj 73 70
R-5 Kumer nodi, Dignagar, Moksudpur, Gopalgonj 67 65P-14 Sagor Mollah pond, Dignagar, Moksudpur, Gopalgonj 69 79
R-6 Kumer nodi, Bhanga bazar, Bhanga, Faridpur 64 70
B-1 Bhanga beel, Bhanga,Faridpur 55 77
B-2 Nurpur Beel, opposite to bhanga beel, Bhanga, Faridpur 57 55
P-15 Sagordi river, Bhanga, Faridpur 60 71
R-7 Hasan shaheb pond, Shontoshi, Nagorkanda, Faridpur 73 76
P-16 Kumer nodi, Bakunda, Faridpur 55 61
P-17 Polishfari pond, Goalchamot, Faridpur 61 84
Groups Maximum Minimum Average
pH 9.23 5.28 7.67
DO(mg/l) 8.1 1.6 4.89
BOD(mg/l) 3.9 .5 1.73
Conductivity(2ms) 1544 154 448.22
TDS 766 73.1 215.635
Air Temperature 33.3 26.8 29.5
Water Temperature 34.2 23.8 27.43
Parameter Recommending Agency Standard value (S) Ideal value 1/S Assigned weightage factor
pH ICMR 8.5 7 0.117647 0.226087822
TDS WHO 500 0 0.002 0.003843493
EC WHO 1400 0 0.000714 0.001372676DO WHO 5 14.6 0.2 0.384349297
BOD ICMR 5 0 0.2 0.384349297
K 0.52036 1

8/16/2019 1.Índice de Calidad Del Agua de Cuerpos de Agua de Bangladesh
http://slidepdf.com/reader/full/1indice-de-calidad-del-agua-de-cuerpos-de-agua-de-bangladesh 8/8
Global Engineers & Technologists Review, Vol.2 No.3 (2012)
© 2012 GETview Limited. All rights reserved
8
4.0 CONCLUSION WQI have some margins as it may not carry enough information about the actual situation of the water bodies.Also many other uses of water quality data cannot be met with an index. Despite of having such problem WQIare more recompense than its drawback. WQI of the stations along the Faridpur –Barishal road for the premonsoon season was found fairly high according to the Brown method, as concentration of water qualityparameters are maximum during pre monsoon and due to the same reason according to NSF method the valueswere low. In accordance with Brown method it is found from the calculation that parameter which shows thehighest favorable value gives a low statistical value to the index and compliant with NSF method the favorablevalue has descending order. BOD, DO was found to be the most important parameter as it contributes the mostfor the WQI calculation among the five parameters for the former method. Out of the 34 stations almost 5stations were found suitable for domestic and aquaculture purpose. So if proper treatment is done then all the34 water bodies could become useful and could help people in rural areas during time of crisis. The study resultis expected to provide valuable information in connection with the use of water bodies by the local people of thestudy region.
REFERENCES
[1] Abrahão, R., Carvalho, M., Da Silva Jr., W., Machado, T., Gadelha, C. and Hernandez. M. (2010): Use of IndexAnalysis to Evaluate the Water Quality of a Stream Receiving Industrial Effluents. WaterSA, Vol.33, No.4,
pp.459-466.[2] Almeida, C.A. (2007): Influence of Urbanization and Tourist Activities on the Water Quality of the PotreroDe Los Funes River (San Luis – Argentina). Environmental Monitoring and Assessment, Vol.133, No.1-3,
pp.459-465.[3] Brown, R.M., McCleiland, N.J., Deininger, R.A. and O’Connor, M.F. (1972): A Water Quality Index - Crossing
the Psychological Barrier (Jenkis, S.H., ed.) Proc. Int. Conf. on Water Poll. Res., Jerusalem, Vol.6, pp.787-797.
[4] Chauhan, A. and Singh, S. (2010): Evaluation of Ganga Water for Drinking Purpose by Water Quality Indexat Rishikesh, Uttarakhand, India. Report and Opinion, Vol.2, No.9, pp.53-61.
[5] Cooper, J., Rediske, R., Northup, M., Thogerson, M. and Van Denend, J. (1998): Agricultural Water QualityIndex. Scientific Technical Reports. paper 11.
[6] Horton, R.K. (1965): An Index Number for Rating Water Quality. Journal of Water Pollution
Control
Federation, Vol.37, No.3, pp.300-306.
[7] Islam, S., Rasul, M.T., Alam, M.J.B. and Haque, M.A. (2011): Evaluation of Water Quality of the Titas River
Using NSF Water Quality Index. Journal of Scientific Research, Vol.3, No.1, pp.151-159.[8] Kumar, A. and Dua, A. (2009): Water Quality Index for Assessment of Water Quality of River Ravi at
Madhopur, India. Global Journal of Environmental Sciences, Vol.8, No.1, pp.49-57.[9] Miller, W.W, Young, H.M., Mahannah, C.N. and Garret, J.R. (1986): Identification of Water Quality Differences
in Nevada through Index Application. Journal of Environmental Quality, Vol.15, pp.265-272.
[10] Tripaty, J.K. and Sahu, K.C. (2005): Seasonal Hydrochemistry of Groundwater in the Barrier Spit System ofthe Chilika Lagoon, India. Journal of Environmental Hydrology, Vol.13, pp.1-9.
[11] Trivedi, R.K. and Goel, P.K. (1986): Chemical and biological method for water pollution studies. Environmental Publications, Karad (Maharashtra), India. p.248.
[12] USEPA. (2004): National Wadeable Stream Assessment: Water Chemistry Laboratory Manual. EPA841-B-04-008. U.S. Environmental Protection Agency, Office of Water and Office of Research and Development,Washington, DC.