Análisis del efecto del humedecimiento en la falla de talud en el km ...
Falla de talud en la costa del Paraná, Argentina
Slope failure at the Paraná shoreline, Argentina Alejo O. Sfriso UBA and Verri&Sfriso, member ASCE.
Juan Larrague UBA and Larrague y Asociados, member ASCE.
Resumen En la margen derecha del Paraná de las Palmas se construyó un terraplén de 80000 m
2 y 3.5 m de altura para
una playa de contenedores. Sobre él se colocó un terraplén temporario de 3.5 m de altura para acelerar el
proceso de consolidación de las arcillas blandas y suelos orgánicos subyacentes. La construcción del terraplén
de precarga tomó aproximadamente cuatro meses. La precarga fue demorada en una pequeña superficie de 6000
m2 debido a actividades de operación portuaria. Varios meses más tarde y utilizando los mismos equipos, el
contratista completó el terraplén de precarga de esta pequeña área en diez días. Un día luego de completada la
precarga se produjo una falla masiva de talud. Presentamos los resultados del análisis de esta falla de talud, las
medidas de remediación adoptadas y algunos comentarios acerca del comportamiento de los suelos de la costa
del Paraná.
Abstract A 80000 m
2, 3.5 m high embankment for a container yard was constructed on the right margin of the Paraná de
las Palmas River in Zárate, Argentina. An aditional temporary embankment, 3.5 m high, was put on top of it to
speed up the consolidation process of underlaying soft Postpampeano clays and organic soils. The construction
of the preload embankment took about four months. The preload was delayed in a small area of 6000 m2 because
of harbour activities. Several months later, and using the same equipment, the contractor completed the preload
embankment of this small area within ten days. One day after completion of the preload, a massive slope failure
occurred. In this paper, the results of the analyses of the slope failure, the remediation action undertaken and
some comments on the behavior of the soils at the Paraná shoreline are presented.
1 INTRODUCTION
A container terminal project was constructed on the right margin of Paraná de las Palmas River, in Zárate, 90 km north of Buenos Aires, Argentina. Works included the extension of an existing wharf, the construction of new container yards, and the improvement of ground conditions in an area reserved for future yard expansion. Some of the main characteristics of the project and it’s construction method, along with a description of the soil profile can be found elsewhere (Larrague and Sfriso, 2001). A 80000 m
2, 3.5 m high preload embankment
(PE) was put on top of the permanent fill for ground improvement purposes. Because of operational requirements of the terminal, the PE construction was delayed in a 6000 m
2 area, just
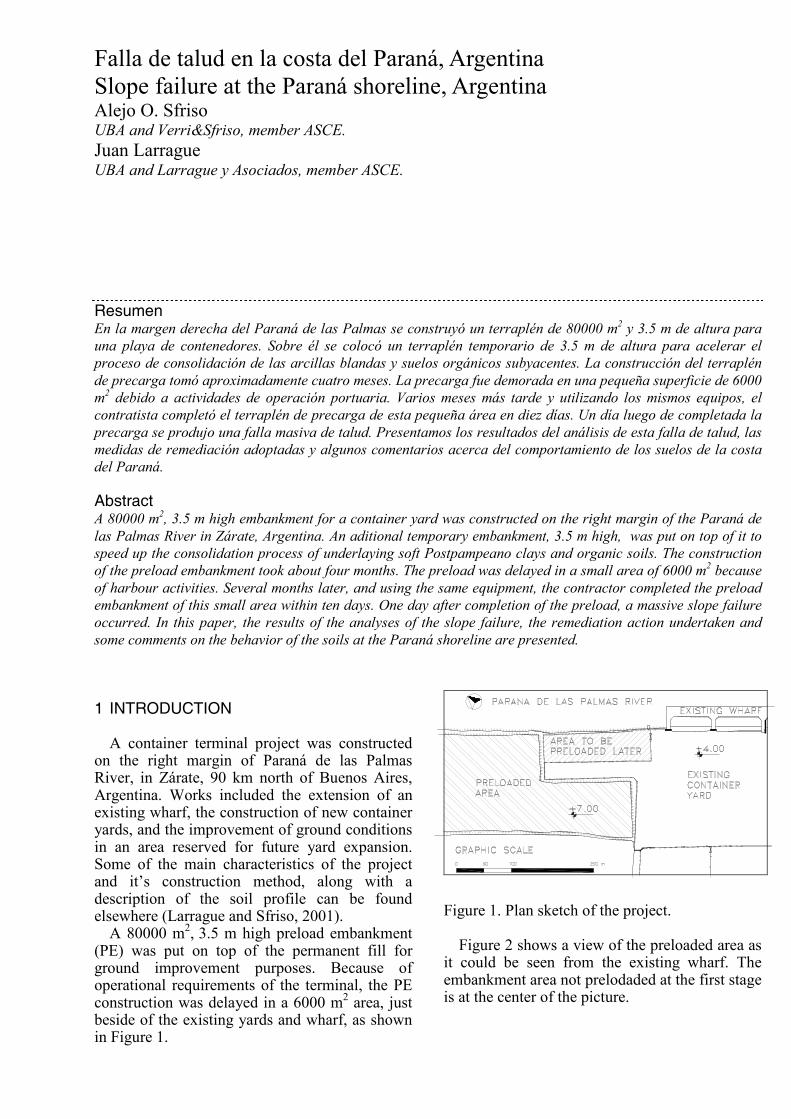
beside of the existing yards and wharf, as shown in Figure 1.
Figure 1. Plan sketch of the project. Figure 2 shows a view of the preloaded area as
it could be seen from the existing wharf. The embankment area not prelodaded at the first stage is at the center of the picture.
PRELOAD EMBANKMENT
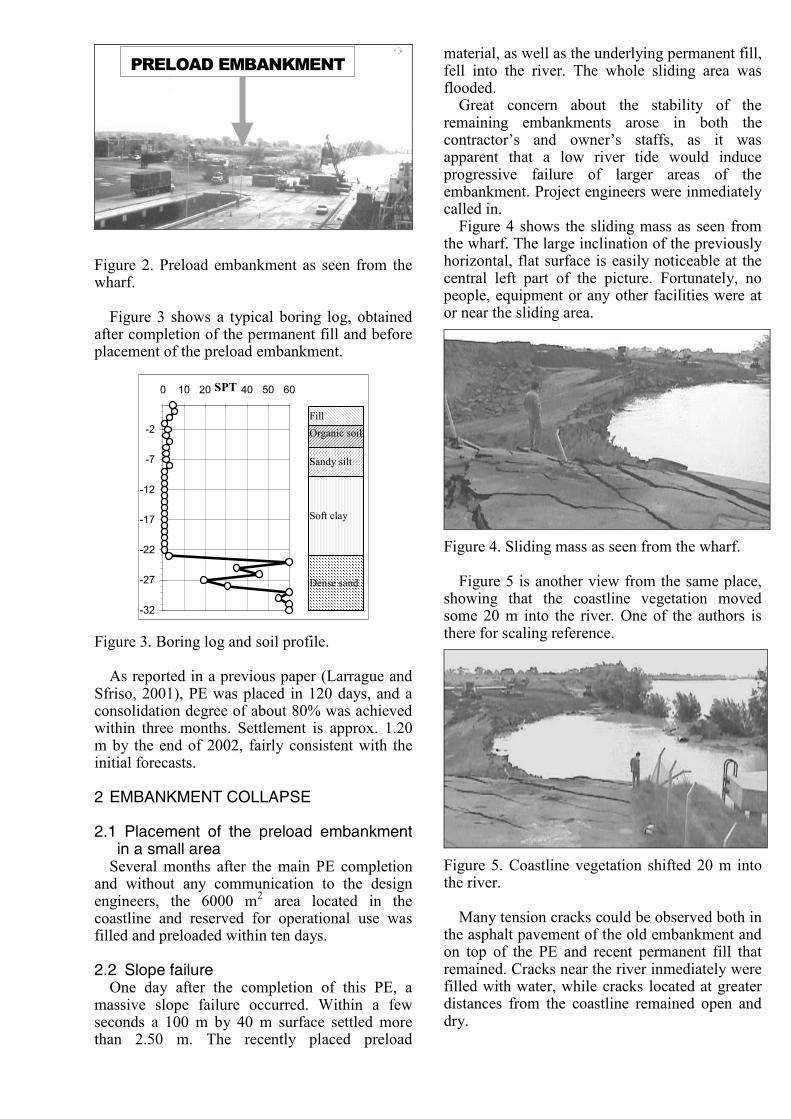
Figure 2. Preload embankment as seen from the wharf. Figure 3 shows a typical boring log, obtained
after completion of the permanent fill and before placement of the preload embankment.
-32
-27
-22
-17
-12
-7
-2
0 10 20 30 40 50 60
Fill
Organic soil
Sandy silt
Soft clay
Dense sand
SPT
Figure 3. Boring log and soil profile. As reported in a previous paper (Larrague and
Sfriso, 2001), PE was placed in 120 days, and a consolidation degree of about 80% was achieved within three months. Settlement is approx. 1.20 m by the end of 2002, fairly consistent with the initial forecasts.
2 EMBANKMENT COLLAPSE
2.1 Placement of the preload embankment in a small area Several months after the main PE completion
and without any communication to the design engineers, the 6000 m
2 area located in the
coastline and reserved for operational use was filled and preloaded within ten days.
2.2 Slope failure One day after the completion of this PE, a
massive slope failure occurred. Within a few seconds a 100 m by 40 m surface settled more than 2.50 m. The recently placed preload
material, as well as the underlying permanent fill, fell into the river. The whole sliding area was flooded. Great concern about the stability of the
remaining embankments arose in both the contractor’s and owner’s staffs, as it was apparent that a low river tide would induce progressive failure of larger areas of the embankment. Project engineers were inmediately called in. Figure 4 shows the sliding mass as seen from
the wharf. The large inclination of the previously horizontal, flat surface is easily noticeable at the central left part of the picture. Fortunately, no people, equipment or any other facilities were at or near the sliding area.
Figure 4. Sliding mass as seen from the wharf. Figure 5 is another view from the same place,
showing that the coastline vegetation moved some 20 m into the river. One of the authors is there for scaling reference.
Figure 5. Coastline vegetation shifted 20 m into the river. Many tension cracks could be observed both in
the asphalt pavement of the old embankment and on top of the PE and recent permanent fill that remained. Cracks near the river inmediately were filled with water, while cracks located at greater distances from the coastline remained open and dry.
2.3 Contingency action A construction team, supervised by the project
engineers, inmediately started works to prevent subsequent damage. The following contingency actions were performed:
• Remaining soils from the PE were removed the same day of the slope failure.
• The embankment surface inmediately behind the failure area was reshaped, and a 1:1 slope surface was cut and sealed.
• Tension cracks behind the sliding mass were excavated and back filled with soil.
• The failure surface was trimmed and reshaped manually. Cracks within the failed area were carefully filled with sand and soil and sealed at surface.
After the first remedial actions were performed, project engineers started a survey and investigation program to determine the causes of the failure and to design proper remedial actions.
3 ANALYSIS OF THE FAILURE
3.1 Preliminary analysis A topographic survey was conducted to
evaluate the magnitude and depth of the failed soil mass. At the same time, some preliminary stability computations were performed, because there was an inmediate need of a reliable undrained shear strength value of the soils at the assumed sliding surface. Figure 6 shows the sketch of the plan view and the failure area.
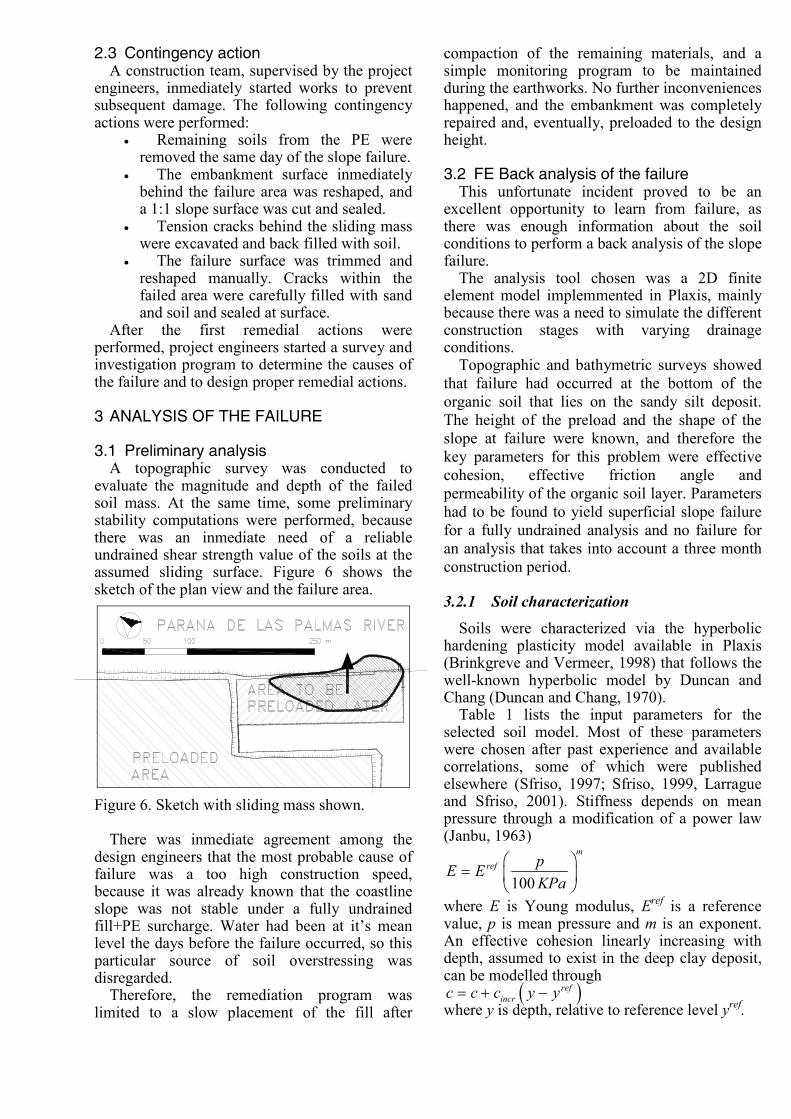
Figure 6. Sketch with sliding mass shown. There was inmediate agreement among the
design engineers that the most probable cause of failure was a too high construction speed, because it was already known that the coastline slope was not stable under a fully undrained fill+PE surcharge. Water had been at it’s mean level the days before the failure occurred, so this particular source of soil overstressing was disregarded. Therefore, the remediation program was
limited to a slow placement of the fill after
compaction of the remaining materials, and a simple monitoring program to be maintained during the earthworks. No further inconveniences happened, and the embankment was completely repaired and, eventually, preloaded to the design height.
3.2 FE Back analysis of the failure This unfortunate incident proved to be an
excellent opportunity to learn from failure, as there was enough information about the soil conditions to perform a back analysis of the slope failure. The analysis tool chosen was a 2D finite
element model implemmented in Plaxis, mainly because there was a need to simulate the different construction stages with varying drainage conditions. Topographic and bathymetric surveys showed
that failure had occurred at the bottom of the
organic soil that lies on the sandy silt deposit.
The height of the preload and the shape of the
slope at failure were known, and therefore the
key parameters for this problem were effective
cohesion, effective friction angle and
permeability of the organic soil layer. Parameters
had to be found to yield superficial slope failure
for a fully undrained analysis and no failure for
an analysis that takes into account a three month
construction period.
3.2.1 Soil characterization
Soils were characterized via the hyperbolic hardening plasticity model available in Plaxis (Brinkgreve and Vermeer, 1998) that follows the well-known hyperbolic model by Duncan and Chang (Duncan and Chang, 1970). Table 1 lists the input parameters for the
selected soil model. Most of these parameters were chosen after past experience and available correlations, some of which were published elsewhere (Sfriso, 1997; Sfriso, 1999, Larrague and Sfriso, 2001). Stiffness depends on mean pressure through a modification of a power law (Janbu, 1963)
100
m
ref pE E
KPa
=
where E is Young modulus, Eref
is a reference value, p is mean pressure and m is an exponent. An effective cohesion linearly increasing with depth, assumed to exist in the deep clay deposit, can be modelled through
( )ref
incrc c c y y= + −
where y is depth, relative to reference level yref
.

Table 1. Soil parameters of the five layers.
Identification Level γ k E50ref
Eoedref
Eurref
c φ ψ ν m K0nc
OCR K0 cincr yref
Rf
m kN/m3 m/day MPa MPa MPa KPa ° ° kN/m
3 m
Preload mat. +7.0 19 2E-01 9.0 12.0 27.0 5 29 0 0.2 0.5 0.52 1.5 0.70 - - 0.9
Permanent fill +4.0 19 1E+00 10.0 12.0 30.0 12 30 2 0.2 0.5 0.56 4.0 0.80 - - 0.9
Organic soil +1.0 15 ? 0.9 0.9 3.3 ? ? 0 0.2 1.0 0.56 1.5 0.72 - - 0.8
Sandy silt -1.0 18 1E-01 5.0 5.0 15.0 1 28 0 0.2 0.8 0.53 1.5 0.67 - - 0.9
Plastic clay -6.0 16 1E-04 1.1 1.0 3.3 1 24 0 0.2 1.0 0.59 1.2 0.66 0.10 20 0.8
In the previous table, γ is total unit weight, k is estimated mean field permeability, E50
ref is
elastoplastic reference stiffness at 50% shear mobilization, Eoed
ref is oedometric reference
stiffness, Eurref is unload-reload elastic reference
stiffness, c is effective cohesion, φ is effective stress friction angle, ψ is dilatancy angle, ν is Poisson ratio, m is Jambu coefficient, K0
nc is at
rest pressure coefficient at normally consolidated soil conditions, K0 is at rest pressure coefficient at actual OCR, cincr is the increment of effective cohesion with depth, y
ref is the reference level for
computation of cincr, and Rf is Duncan-Chang shear ratio at failure.
3.2.2 Mesh and construction stages
A FE mesh with 938, fifteen node triangular elements was used. Figure 7 shows the construction stages considered.
Figure 7. Mesh and construction stages.
The first construction stage is the natural shoreline, so no pore pressure build up was allowed there. Second stage is the placement of the first two meters of compacted fill, which happened long time before this project started, and was also modeled as a drained stage. Third stage is the placement of the permanent fill and the fourth stage is the placement of the preload embankment. Two separate analysis were performed:
1 A fully undrained analysis, simulating the behaviour of the small embankment that failed.
2 A stepped undrained – consolidation analysis, where each construction stage was followed by a consolidation stage equivalent to a 30 day lag in construction time, thus simulating the real construction schedule.
3.2.3 Results
After some trial and error, the final strength and permeability parameters that best matched the observed behaviour of the embankment were 1
26
0.085 /
c KPa
k m day
φ=
= °
=
Cohesion is assumed to be zero, but a small
value is accepted to improve numerical perfomance. The computed effective friction angle is somewhat lower than the forecasted value. Triaxial tests of these organic soils, performed on vertical samples, yielded friction angles in the range 28° - 32°. The partially consolidated model yielded no
failure, whereas the fully undrained model failed at about 40%-60% of the full preload stage. Onset of failure was not a slope stability
problem but the squeeze of a very soft plastic layer, as shown in Figure 8, where only strain increments above mean value were plotted. This plot shows which portions of the model are increasing their velocity without control, and thus suggests where failure starts from.

Figure 8. Strain increments at the onset of failure. Undrained analysis. Figure 9 shows the deformed mesh of the
second model. A 1.20 m max. settlement was achieved but movements eventually ceased, in a similar performance to that of reality.
Figure 9. Settlements in partially drained analysis. Máx settlement is 1.25 m. Figure 10 shows the displacement of the edge
of the preload embankment, marked as “A” in Figure 8. It can be seen that total settlement for the partially drained model is 1.20 m, and that it’s behaviour is stable, whereas the undrained analysis beginned to fail at about 40% of the full PE load.
Displacement of the edge of PE with height
0
1
2
3
4
5
0% 20% 40% 60% 80% 100%% of full PE height
Displ. of PE edge [m]
Partially drained
analysis
Undrained
analysis
Figure 10. Displacement of the edge of PE during placement of the preload.
4 CONCLUSIONS
An embankment and ground improvement program was designed to speed up the construction process of a container yard. This program proved successful, as the construction time was cut off by a factor of three (Larrague and Sfriso, 2001). A small portion of the job remained uncompleted due to an owner’s decision. Some months later, the contractor completed the job by himself. Too high a construction speed triggered a slope failure. In this paper, a back analysis of this failure
was presented. Is was shown that the slope failure started with the displacement of a thin, weak layer of organic soils that squeezed out of the toe embankment. The full process of construction, load and
consolidation was modeled twice: as a simulation of rapid construction in a fully undrained analysis, and at real speed construction in a staged load-consolidation scheme. These two models were calibrated with the same input parameters, yielding a back-analysis value of effective friction angle and field permeability of the organic soil layer. This procedure is not intended to find “true” values for these soil parameters, but to calibrate the available constitutive models for local soils. The combination of judgement, numerical
analysis and interpretation of field data allowed for a safe completion of the project without further inconveniences. Figure 11 shows an aerial view of the wharf and yard today. A dotted arc shows the place where slope failure occurred, with some containers on it.
Figure 11. Aerial view of the site after rehabilitation worls.
A

5 ACKNOWLEDGEMENTS
The authors want to acknowledge University of Buenos Aires, where they lecture, Murchison SA, for the permission to publish the data, and Prof. Eduardo Núñez, for his permanent guidance and support.
6 REFERENCES
Brinkgreve, R. and P. Vermeer (1998). Plaxis manual. Balkema, 425 p.
Duncan, J. and C. Chang (1970) "Nonlinear analysis of stress and strain in soils" Journal of Soil Mechanics Foundation Division, ASCE, 96, SM5, 1629-1653.
Janbu, N. (1963). “Soil compressibility as determined by oedometer and triaxial tests”. Proc. Eur. Conf. Soil Mech. Found. Eng., Wiesbaden, I, 19-25.
Larrague, J. y A. Sfriso. (2001). “Ground improvement in Zárate”. In: Foundations and Ground Improvement, Geo. Sp. Pub 113, ASCE, 514-523.
Núñez, E. (1994). “Propiedades mecánicas de materiales granulares incoherentes”. In: Anales Acad. Nac. Cs. Ex. Fís. Nat., Buenos Aires, 46, 71-89.
Núñez, E (1997) “Interacción suelo – estructura: Predicción, Comportamiento e instrumentación de campo”. In: 1
st Congreso Paraguayo de Ingeniería
Geotécnica, Asunción, 1-19. Sfriso, A. (1997). “Formación Postpampeano.
Predicción de su comportamiento mecánico”. In: 3rd CLIGJ, Caracas, pp. 1-10.
Sfriso, A. (1999). “Tunnels in Buenos Aires: Application of numerical methods to the structural design of linings”. In: XI Panamerican Conference on soil mechanics and geotechnical engineering. 637-642.