Obtenci on de los factores de correcci on de c amaras de ... › tesisugr › 25938150.pdfNo quiero...
92
UNIVERSIDAD DE GRANADA DEPARTAMENTO DE F ´ ISICA AT ´ OMICA, MOLECULAR Y NUCLEAR PROGRAMA DE DOCTORADO BIOINGENIER ´ IA Y F ´ ISICA M ´ EDICA Tesis de Doctorado Obtenci´on de los factores de correcci´on de c´ amaras de ionizaci´on de uso en dosimetr´ ıa f´ ısica Fabi´ an Erazo Caluqu´ ı Noviembre 2015
Transcript of Obtenci on de los factores de correcci on de c amaras de ... › tesisugr › 25938150.pdfNo quiero...
UNIVERSIDAD DE GRANADA
DEPARTAMENTO DE FISICA ATOMICA,MOLECULAR Y NUCLEAR
PROGRAMA DE DOCTORADOBIOINGENIERIA Y FISICA MEDICA
Tesis de Doctorado
Obtencion de los factores de correccionde camaras de ionizacion de uso
en dosimetrıa fısica
Fabian Erazo Caluquı
Noviembre 2015
Editor: Universidad de Granada. Tesis Doctorales Autor: Fabián Gonzalo Erazo CaluquíISBN: 978-84-9125-657-1URI: http://hdl.handle.net/10481/43404

El doctorando, Fabian Erazo Caluquı, autor de la presente tesis doctoral, titulada“Obtencion de los factores de correccion de camaras de ionizacion de uso en dosimetrıafısica”, y Antonio M. Lallena Rojo, director de la misma
GARANTIZAMOS que
1. el trabajo ha sido realizado por el primero bajo la direccion del segundo, y
2. hasta donde nuestro conocimiento alcanza, en la realizacion del trabajo, se hanrespetado los derechos de otros autores a ser citados, cuando se han utilizado susresultados o publicaciones.
Y para que ası conste a los efectos oportunos, firmamos el presente documento enGranada, a 30 de octubre de 2015
El director de la tesis El doctorando
Fdo.: Antonio M. Lallena Rojo Fdo.: Fabian Erazo Caluquı

A Patricia y Paula, mi familia, por su comprension.
A Ivan Andres cuya partida no logro entender.

Agradecimientos
El presente trabajo de investigacion ha sido desarrollado gracias al aporte de muchaspersonas sin las cuales no hubiese sido posible finalizarlo. De manera especial quieroagradecer a Antonio Lallena por su conviccion inquebrantable como docente que ha hechoposible a traves su direccion finalizar esta tesis doctoral. Gracias infinitas Antonio.
Un reconocimiento especial a Marta Anguiano por sus ensenanzas y su trabajo atraves de los sistemas informaticos del departamento que han permitido los calculos deesta investigacion. Tambien a los profesores del programa de doctorado que a lo largo desus clases me han hecho comprender de que se trata la investigacion cientıfica.
A Jose Marıa Fernandez Varea y Josep Sempau un reconocimiento especial por su bon-dad para discutir con una apertura magnıfica los procesos de simulacion, en sus despachos,en Barcelona.
Existen numerosas personas mas que han colaborado de manera desinteresada en miformacion en la Universidad de Granada. Quisiera mencionar a todas y cada una de ellasy si omito a alguien me disculpo anticipadamente pero no ha sido mi intencion evitarmencionarlas.
Al Organismo Internacional de Energıa Atomica mediante los buenos oficios del Dr.Francisco Enrıquez Guerra, coordinador general de esta institucion en la ciudad de Cuen-ca, por su confianza y apoyo economico para los primeros anos de formacion. Al Institutodel Cancer SOLCA Cuenca, de manera especial a su director el Dr. Raul Alvarado Co-rral, quien con su vision me ha apoyado de manera absoluta en realizar este programa dedoctorado sin pedir mas que los conocimientos sean revertidos en su Institucion.
El desarrollo del trabajo cientıfico ha sido posible gracias a personas que han contri-buido de manera altruista. A Brian Hooten de Standard Imaging por proveernos de losblue prints de las camaras de ionizacion para que pudieramos simularlas. A Llorenc Brua-lla que nos ha facilitado las geometrıas de los aceleradores lineales para poder calcular losespacios de fases. Al profesor David Rogers del Ottawa Carleton Institute for Physics queha compartido datos y recomendaciones para nuestro trabajo.
No quiero dejar de mencionar a mis companeros de formacion clınica en mi estanciaen Madrid en el Hospital La Milagrosa: Cristina Mınguez, Alicia Sanchez, Marıa LuisaBrosed, David Sevillano, Elena Sanchez, Jose Miguel Delgado, Raul Matute, Cesar Beltrany Rosa Morera.
Finalmente reconocer en mis companeros del programa de doctorado a seres extraor-dinarios y agradecer su amistad que perdura: Uriel, Paola, Segundo.
A la Granada de Francisco de Icaza: “Dale limosna, mujer, que no hay en la vida nadacomo la pena de ser ciego en Granada”. A Alvaro, Aurora, Joaquina y Jose que hicieronde mi estancia algo maravilloso.

Indice general
Introduccion 7
1. Dosimetrıa en radioterapia 13
1.1. El protocolo TRS-398 . . . . . . . . . . . . . . . . . . . . . . . . . . . . . . 15
1.2. Determinacion experimental de kQ,Q0 . . . . . . . . . . . . . . . . . . . . . 17
1.3. Calculo Monte Carlo de kQ,Q0 . . . . . . . . . . . . . . . . . . . . . . . . . 18
1.3.1. El codigo PENELOPE . . . . . . . . . . . . . . . . . . . . . . . . . 19
1.3.2. Caracterısticas de las simulaciones realizadas . . . . . . . . . . . . . 21
2. Camaras de dedal 25
2.1. Introduction . . . . . . . . . . . . . . . . . . . . . . . . . . . . . . . . . . . 28
2.2. Material and methods . . . . . . . . . . . . . . . . . . . . . . . . . . . . . 29
2.2.1. PENELOPE code . . . . . . . . . . . . . . . . . . . . . . . . . . . . 29
2.2.2. Thimble ionization chambers . . . . . . . . . . . . . . . . . . . . . . 30
2.2.3. Simulation setup . . . . . . . . . . . . . . . . . . . . . . . . . . . . 31
2.2.4. Uncertainties . . . . . . . . . . . . . . . . . . . . . . . . . . . . . . 32
2.2.5. Radiation sources . . . . . . . . . . . . . . . . . . . . . . . . . . . . 33
2.3. Results and discussion . . . . . . . . . . . . . . . . . . . . . . . . . . . . . 33
2.3.1. Values of TPR2010 . . . . . . . . . . . . . . . . . . . . . . . . . . . . 33
2.3.2. Correction factors for the NE2571 ionization chamber . . . . . . . 34
2.3.3. Correction factors for A19 and A12S ionization chambers . . . . . . 36
2.4. Conclusions . . . . . . . . . . . . . . . . . . . . . . . . . . . . . . . . . . . 38
3. Camaras plano-paralelas 43
3.1. Introduction . . . . . . . . . . . . . . . . . . . . . . . . . . . . . . . . . . . 46
3.2. Material and methods . . . . . . . . . . . . . . . . . . . . . . . . . . . . . 48
3.2.1. Ionization chambers . . . . . . . . . . . . . . . . . . . . . . . . . . 48
3.2.2. Monte Carlo code penelope . . . . . . . . . . . . . . . . . . . . . 50
3.2.3. Radiation sources . . . . . . . . . . . . . . . . . . . . . . . . . . . . 50
3.2.4. Simulation geometry . . . . . . . . . . . . . . . . . . . . . . . . . . 52
3.3. Results . . . . . . . . . . . . . . . . . . . . . . . . . . . . . . . . . . . . . . 52
3.4. Conclusions . . . . . . . . . . . . . . . . . . . . . . . . . . . . . . . . . . . 60
5
4. Nuevas camaras de dedal 67
4.1. Introduction . . . . . . . . . . . . . . . . . . . . . . . . . . . . . . . . . . . 70
4.2. Material and methods . . . . . . . . . . . . . . . . . . . . . . . . . . . . . 71
4.3. Results and discussion . . . . . . . . . . . . . . . . . . . . . . . . . . . . . 74
4.4. Conclusions . . . . . . . . . . . . . . . . . . . . . . . . . . . . . . . . . . . 78
5. CONCLUSIONES Y PERSPECTIVAS 81
INFORME 85
Introduccion
7

INTRODUCCION 9
Hoy dıa se acepta que, en media, un 50 % del total de pacientes diagnosticados decancer deberıan recibir radioterapia como parte de su tratamiento, aunque el porcentajeconcreto puede variar mucho en funcion de la patologıa [1]. En radioterapia se pretendeadministrar una dosis de radiacion a los tejidos tumorales evitando al maximo la irradia-cion de los tejidos normales circundantes [2]. Este proceso involucra diferentes etapas yprocedimientos que tienen que ser realizados de acuerdo con los criterios establecidos enalguno de los protocolos reconocidos internacionalmente. A este respecto hay que senalarque son dos los mas usados en los departamentos de fısica medica: el TRS-398 de la Agen-cia Internacional de Energıa Atomica (IAEA) [3] y el TG-51 de la Asociacion Americanade Fısicos en Medicina [4].
En la practica clınica actual se asume que la incertidumbre de los tratamientos deradioterapia debe ser del 5 % como maximo, un requerimiento que viene impuesto desdela practica clınica y esta basado, por tanto, en la evidencia de la relacion entre la dosisprescrita y las probabilidades de control tumoral y de complicacion del tejido normal. Ası,los datos disponibles al respecto indican que un cambio de un 5 % en la dosis prescritaa los pacientes de radioterapia puede producir cambios del orden del 10 al 20 % en laprobabilidad de control tumoral y del 20 al 30 % en la probabilidad de complicacion deltejido normal [5]. Por ello, todos las etapas y procedimientos del proceso de radioterapiaa que antes hemos hecho referencia deben ser evaluados de manera sistematica para quela incertidumbre total no exceda el maximo aceptado.
La dosimetrıa fısica es uno de esos procedimientos. Su objetivo fundamental es lacaracterizacion de los haces de radiacion que se emplean en radioterapia, es decir, elestablecimiento de una coleccion de parametros fısicos que caracterizan las unidades detratamiento, y que posteriormente sirven como referencia para futuras comprobaciones dela estabilidad y la repetibilidad de dichas unidades.
La dosimetrıa fısica de referencia, ası como los posteriores controles dosimetricos, de-ben por tanto llevarse a cabo de acuerdo con protocolos de calibracion de manera que seaposible no solo alcanzar el objetivo global de precision, sino tambien permitir una compa-racion de los resultados dosimetricos obtenidos en diferentes instituciones. En principio elprocedimiento podrıa llevarse a cabo con distintos tipos de detectores de radiacion, comodosımetros termoluminiscentes, dosımetros MOSFET, pelıcula radiocromica, camaras deionizacion, etc. Sin embargo, son estas ultimas las mas ampliamente utilizadas en fısicamedica, dadas su versatilidad, estabilidad y repetibilidad en las medidas, su facil lecturay su relativo bajo coste, debido a su diseno simple, que permite el acceso a ellas de practi-camente cualquier usuario. En los dos protocolos citados la dosimetrıa fısica esta basada

10 INTRODUCCION
en parametros de dosis absorbida en agua y se recomienda utilizar camaras de ionizacionpara su determinacion.
Sin embargo existe un problema importante: este tipo de dosımetros deben estar ca-librados para el haz con el que el usuario realizara las medidas y eso no es posible enla mayorıa de los casos, ya que los laboratorios (primarios o secundarios) encargados dela certificacion de calibracion no disponen de todas y cada una de las calidades de hazutilizadas en las distintas unidades de radioterapia. Por ello, las camaras de ionizacion secalibran por regla general en un haz de referencia, usualmente de 60Co, y es necesario portanto un factor de correccion que permita establecer la correspondiente calibracion parala calidad de haz de interes para el usuario. Ese factor se denomina factor de correccionde calidad de haz y se denota como kQ,Q0
, con Q0 la calidad a la que la camara ha sidocalibrada en el laboratorio de calibracion y Q la calidad del haz utilizado por el usuario.El factor de corrreccion kQ,Q0
esta descrito con detalle en los protocolos [3,4].
Existen dos posibilidades para determinar los factores kQ,Q0 : de forma experimental,usando metodos dosimetricos absolutos, como calorımetros o dosımetros quımicos, o conmetodos numericos, esencialmente usando tecnicas Monte Carlo. En general, los metodosexperimentales se basan en la independencia de la respuesta de los dispositivos de medidautilizados con la energıa de la radiacion considerada, por lo que serıan utiles para cual-quier usuario clınico. Sin embargo, no suelen estar disponibles en los departamentos defısica medica debido a los requerimientos experimentales que conllevan y que solo puedenencontrarse en laboratorios de calibracion. Eso hace que sean los valores obtenidos me-diante simulacion Monte Carlo los que usualmente se consideran en la practica clınica. Encualquier caso los valores de los factores de correccion reportados en la bibliografıa me-diante metodos experimentales estan en buen acuerdo con los obtenidos mediante MonteCarlo [4].
En esta tesis doctoral hemos abordado el calculo de coeficientes de correccion paradistintas camaras y para haces de electrones y fotones de uso clınico con tecnicas Mon-te Carlo, usando para ello el codigo de simulacion PENELOPE [6] y considerando loestablecido en el protocolo TRS-398 [3].
En el capıtulo 1 se introducen los factores de correcion kQ,Q0 de acuerdo a lo establecidoen el protocolo dosimetrico de la IAEA. Ademas se hace una breve revision de los metodosexperimentales utilizados para su determinacion. Finalmente se describen algunas de lascaracterısticas relevantes del codigo PENELOPE y algunos detalles de los calculos que sehan llevado a cabo.
En el capıtulo 2 se estudian varias camaras de tipo dedal (cilındricas). Entre ellasse analiza la NE2571 (QADOS, Sandhurst, Reino Unido), considerada como camara dereferencia en el protocolo TRS-398. Los resultados obtenidos se comparan con los valoresde otros autores para comprobar el metodo de calculo usado y determinar las posiblesdiferencias debidas al codigo con el que se llevan a cabo las simulaciones. Se considerantanto espectros de radiacion de diferentes aceleradores lineales como haces monoenergeti-cos con el fin de estudiar la compatibilidad de los correspondientes resultados. Ademasse calculan los factores de correccion kQ,Q0 para las camaras A19 y A12S, de StandardImaging (Middleton, E.E.U.U.), con los dos tipos de fuentes de radiacion.
INTRODUCCION 11
En el capıtulo 3 se estudian camaras plano-paralelas, calculando en primer lugar losfactores de correccion de una de las camaras de referencia para la dosimetrıa de electronesen radioterapia: la NACP-02 (IBA-Scanditronix, Louvain-la-Neuve, Belgica). Los resul-tados obtenidos son comparados con los valores publicados en la bibliografıa y con losdisponibles en el protocolo TRS-398. A continuacion se hace un estudio de varias camarasplano-paralelas de Standard Imaging que, hasta donde nuestro conocimiento alcanza, noestaban aun caracterizadas. Estas camaras son las siguientes: A10, A11, A11TW, P11,P11TW, T11 y T11TW. El estudio se lleva a cabo utilizando los espacios de fase gene-rados para un acelerador Clinac 2100 C/D de Varian y tambien haces monoenergeticossintonizados para reproducir los mismos valores de R50 que los de los haces realistas.
En el capıtulo 4 se lleva a cabo la caracterizacion de las nuevas camaras de ionizacionNE2571A y NE2581A, ambas de QADOS, que son de tipo dedal. Estas camaras fueronpresentadas por el fabricante como reemplazo de las camaras de referencia NE2571 yNE2581. Los resultados obtenidos para las nuevas camaras se comparan con los corres-pondientes a las anteriores estableciendo las diferencias existentes.
Finalmente en el capıtulo 5 se presentan las conclusiones de este trabajo de investiga-cion y se enuncian las perspectivas del mismo.
Se estima que la dosimetrıa fısica de referencia tiene asociada una incertidumbre deentre el 1 y el 2 %, siempre y cuando sea llevada a cabo con el mayor rigor posible [7]. Estopone de manifiesto la importancia que tendrıa cualquier mejora que pudiera alcanzarseen la precision del propio proceso, mejora que es el objetivo ultimo del tipo de calculosrealizados en esta tesis.
[1] Delaney G, Jacob S, Featherstone C, Barton M. The role of radiotherapy in can-cer treatment: estimating optimal utilization from a review of evidence-based clinicalguidelines. Cancer. 2005; 104:1129-37.
[2] Almond PR. A historical perspective: A brief history of dosimetry, calibration pro-tocols and the need for accuracy in clinical dosimetry measurements in radiotherapy.2009 AAPM Summer School. Colorado Springs: AAPM; 2009.
[3] International Atomic Energy Agency. Absorbed dose determination in external beamradiotherapy, IAEA Technical Reports Series 398. Vienna: IAEA; 2000.
[4] Almond PR, Biggs PJ, Caursey BM, Hanson WF, Saiful HM, Nat R, Rogers DWO.AAPM’s TG-51 protocol for clinical reference dosimetry of high-energy photon andelectron beams. Med Phys 1999; 26: 1847-70.
[5] Bentzen SM. Dose-response relationships in radiotherapy. In ”Basic clinical radiobio-logy”, 3rd edition. Ed. G Gordon Steel. Londres: Arnold, 2002; p 94-104
[6] Salvat F, Fernandez-Varea JM, Sempau J. PENELOPE 2011: A code system for MonteCarlo simulation of electron and photon transport. Issy-les-Moulineaux: OECD Nu-clear Energy Agency; 2011.
12 INTRODUCCION
[7] International Commission on Radiation Units and Measurements. Determination ofabsorbed dose in a patient irradiated by beams of X or gamma rays in radiotherapyprocedures, ICRU Report 24. Bethesda: Oxford University Press; 1976.
Capıtulo 1
Dosimetrıa en radioterapia
13

CAPITULO 1. DOSIMETRIA EN RADIOTERAPIA 15
En este capıtulo se introduce el factor de calidad de haz de acuerdo con lo establecidoen el protocolo TRS-398, del Organismo Internacional de la Energıa Atomica [1], quees el que hemos utilizado en este trabajo. Despues de una breve revision de los metodosexperimentales utilizados para determinar kQ,Q0
, se describen algunas de las caracterısticasdel codigo Monte Carlo PENELOPE que es el que hemos utilizado en nuestros calculos,ası como algunos detalles relativos a los mismos.
1.1. El protocolo TRS-398
El protocolo TRS-398 del IAEA [1] se basa esencialmente en la teorıa de la cavidadde Spencer–Attix para dar solucion al problema de la dosimetrıa fısica cuando se utilizancamaras de ionizacion tanto cilındricas como plano-paralelas. La teorıa se desarrollo ori-ginalmente para medios irradiados con fotones, asumiendo que se verificaba el equilibriode partıculas cargadas en el propio medio en la posicion en la que la cavidad estaba si-tuada, pero tambien se puede aplicar a medios irradiados con neutrones o con partıculascargadas, como electrones y protones.
En concreto, la teorıa de Spencer–Attix permite determinar la energıa que se depositaen una cavidad de Bragg–Gray, que se considera como detector. Una cavidad de Bragg–Gray es una cavidad muy pequena que cumple que (i) la energıa que se deposita en lamisma, debida a los electrones generados dentro de ella por fotones que la alcanzan, esdespreciable frente a la debida a aquellos electrones producidos por fotones en el medioque rodea, y (ii) la fluencia de los electrones que atraviesan la cavidad es la misma que laque existirıa en el medio, en el mismo punto de interes, si la cavidad no estuviera presente.
El protocolo TRS-398 [1] aplica la teorıa de Spencer–Attix considerando una cavidadde aire en el seno de agua por lo que, en el caso de una cavidad de Bragg–Gray ideal, esposible relacionar la dosis absorbida en agua, Dw,Q, para una calidad de haz dada Q, conla dosis absorbida en la cavidad, Dair,Q, mediante la razon de poderes de frenado entreagua y aire, (Sw,air)Q:
Dw,Q = Dair,Q · (Sw,air)Q . (1.1)
Como las camaras de ionizacion reales muestran desviaciones respecto del comporta-miento de una cavidad de Bragg–Gray ideal, la ecuacion anterior se modifica introduciendoun factor de perturbacion, pc,Q, que da cuenta de esas desviaciones:
Dw,Q = Dc,Q · pc,Q · (Sw,air)Q , (1.2)
16 CAPITULO 1. DOSIMETRIA EN RADIOTERAPIA
donde ahora se ha introducido Dc,Q, que es la dosis absorbida en la camara de ionizacion.El factor de perturbacion pc,Q se puede factorizar en cuatro terminos: pwall, que tiene encuanta el hecho de que las paredes de la camara de ionizacion no son equivalentes al agua;pcav, que corrige por las diferencias en la fluencia electronica en la cavidad de aire de lacamara respecto de la que se tendrıa en agua en ausencia de la propia camara; pdis, queconsidera el cambio en el punto efectivo de medida debido a que un cierto volumen de aguaes sustituido por el aire de la cavidad, y pcel, que corrige la respuesta de la camara por elefecto debido al electrodo central de la misma. De acuerdo con el reporte 64 de ICRU [2]se asume que estos factores son independientes y son considerados como perturbacionesde primer orden.
Ademas de la condicion antes indicada acerca de la necesidad de que la fluenciaelectronica en el punto de medida sea la misma tanto si el detector esta presente co-mo si no es ası, la aplicacion de la ecuacion anterior requiere que pc,Q y (Sw,air)Q no estencorrelacionados. Por ello se ha propuesto una expresion alternativa en la que la dosis ab-sorbida en agua, Dw,Q, se relaciona directamente con la dosis absorbida en el detector,Dc,Q [3,4]:
Dw,Q = Dc,Q · fc,Q . (1.3)
La ventaja de este procedimiento es evidente: el factor global, fc,Q, se puede calcularusando una descripcion realista de la geometrıa del detector y, ademas, tiene en cuenta,de manera directa y en su totalidad, el efecto completo debido a la presencia del detectoren el seno del medio.
De acuerdo con el protocolo TRS-398 los usuarios de camaras de ionizacion puedendeterminar directamente la dosis absorbida en agua cuando la irradiacion se realiza con unhaz de referencia, generalmente el obtenido de una fuente de 60Co, mediante la siguienteecuacion:
Dw,Q0= MQ0 ·ND,w,Q0
, (1.4)
donde MQ0 es la lectura que arroja el electrometro al que esta conectada la camara deionizacion, corregida por los efectos de temperatura, presion, calibracion del electrome-tro, polaridad y recombinacion ionica, y ND,w,Q0
es el factor de calibracion en terminos dedosis absorbida en agua para la calidad de referencia Q0. Los laboratorios de calibraciondosimetrica, ya sean primarios o secundarios, calibran las camaras de ionizacion y pro-porcionan el valor de ND,w,Q0
en cGy/nC. Obviamente, lo ideal serıa que el laboratorio decalibracion pudiera realizar esta utilizando la misma calidad de haz Q que posteriormenteutilizara el usuario, estableciendo el factor de calibracion para esa calidad ND,w,Q para elque se tendrıa:
Dw,Q = MQ ·ND,w,Q , (1.5)
Como los laboratorios de calibracion no disponen de todas las calidades utilizadas por losusuarios, esta ultima ecuacion se modifica de manera que se tiene en cuenta la calidad Q0
de referencia:Dw,Q = MQ ·ND,w,Q0
· kQ,Q0, (1.6)
donde kQ,Q0es el factor de correccion de calidad de haz antes mencionado y depende de
la camara de ionizacion concreta que se considere.
CAPITULO 1. DOSIMETRIA EN RADIOTERAPIA 17
Segun la teorıa de la cavidad de Spencer–Attix, este factor de correccion viene dadopor:
kQ,Q0=
(Sw,air)Q(Sw,air)Q0
· pc,Qpc,Q0
, (1.7)
o bien, de acuerdo con los trabajos de Sempau et al. [3] y de Capote et al. [4] antesmencionados,
kQ,Q0=
fc,Qfc,Q0
. (1.8)
Esta es la expresion que utilizamos en este trabajo para calcular el factor de correccionkQ,Q0
.
1.2. Determinacion experimental de kQ,Q0
Si tenemos en cuenta las ecuaciones (1.4) y (1.6) podemos escribir:
kQ,Q0=
Dw,Q
Dw,Q0
· MQ0
MQ
. (1.9)
Una vez medidas las dosis absorbidas en agua experimentalmente, se utiliza esta expresionpara determinar el factor kQ,Q0
de una camara de ionizacion dada.
Existen basicamente dos procedimientos con los que se puede medir la dosis en agua:la calorimetrıa en agua y los metodos quımicos.
En la dosimetrıa basada en calorimetrıa en agua, la tasa de dosis absorbida es medidade forma directa en el agua. Como esa medida es, a la vez, absoluta, el calorımetro nodebe ser calibrado con respecto a un estandar primario de radiacion.
La utilizacion del calorımetro se basa en suponer que toda la energıa absorbida por elmedio irradiado se traduce en un incremento de su temperatura [5]. Bajo esta hipotesisfundamental es posible establecer una relacion entre la tasa de dosis absorbida en agua,Dw, y la tasa de incremento de la temperatura del agua, ∆T :
Dw = (cw)P · ∆T · κ , (1.10)
donde (cw)P es la capacidad calorıfica especıfica del agua, a presion constante y κ esun factor de correccion que tiene en cuenta la transferencia de calor debida a efectos deconduccion y conveccion en el agua, los defectos de calor debidos a posibles reaccionesquımicas en el agua producidas por la presencia de impurezas y las perturbaciones en ladistribucion de dosis debidas a los materiales diferentes al agua presentes en el arregloexperimental [5]. Este metodo es generalmente usado en los laboratorios primarios decalibracion para verificar los patrones de dosis absorbida en agua y no es un metodo alalcance de los servicios de radiofısica hospitalaria.
La dosimetrıa quımica consiste en utilizar cambios quımicos producidos por la radia-cion en los materiales, de forma que se pueda cuantificar de manera directa o indirecta la
18 CAPITULO 1. DOSIMETRIA EN RADIOTERAPIA
energıa depositada en el proceso de irradiacion. Uno de los procedimientos mas utilizadoses la dosimetrıa de Fricke, que se basa en la irradiacion de un vial, situado en un maniquıde agua en la posicion de medida, que contiene una solucion de sulfato ferroso amonicoy cloruro sodico en acido sulfurico y agua bidestilada. Tras la irradiacion, los iones Fe2+
se transforman en iones Fe3+ y el cambio en la concentracion de estos ultimos permitedeterminar la dosis absorbida [6].
Otros dosımetros quımicos muy utilizados son los de alanina que es un aminoacidoque, cuando se irradia, pierde el grupo NH−2 , dando lugar a radicales estables libres cuyaconcentracion es proporcional a la dosis absorbida y puede medirse mediante espectros-copıa por resonancia paramagnetica de electrones. La muestra que se irradia se construyecon pellets, de 5 mm de diametro y ∼ 2.5 mm de espesor, de una mezcla de alanina conun 10 % de parafina, que se introducen en una varilla de PMMA u otro material similar[7].
Si se dispone de una camara calibrada, es decir, de la que se conoce el factor de calibra-cion ND,w,Q0
para la calidad de referencia Q0, es posible determinar el factor de correccionpara otra camara de ionizacion comparando directamente las ionizaciones medidas conambas camaras. De acuerdo con la ecuacion (1.9) podemos escribir que el correspondientefactor de correccion para la camara calibrada viene dado por:
kcalQ,Q0=
Dw,Q
Dw,Q0
· McalQ0
M calQ
. (1.11)
Y teniendo en cuenta las ecuaciones (1.9) y (1.11), podemos obtener el factor de correccionde la camara problema como
kQ,Q0=
MQ0
MQ
· McalQ
M calQ0
· kcalQ,Q0. (1.12)
Por lo tanto lo unico que en teorıa quedarıa por hacer es medir, bajo las mismas condicio-nes de irradiacion, las ionizaciones producidas en ambas camaras para las dos calidadesde haz, Q y Q0 [8].
1.3. Calculo Monte Carlo de kQ,Q0
En general, la determinacion experimental del factor de correccion kQ,Q0 es complicaday por ello se suelen utilizar valores tabulados del mismo obtenidos a partir de calculosMone Carlo. En este trabajo hemos abordado el problema desde este punto de vista yhemos llevado a cabo el calculo de los factores de correccion de calidad de haz, paradistintas camaras de ionizacion y para haces de electrones y fotones de varias energıas,usando el codigo PENELOPE [9].
CAPITULO 1. DOSIMETRIA EN RADIOTERAPIA 19
1.3.1. El codigo PENELOPE
En terminos generales, la simulacion Monte Carlo del transporte de radiacion en me-dios materiales consiste en el seguimiento de las historias de las partıculas que formanel haz de radiacion a su paso por el material en cuestion. La base de ese seguimiento(simulacion) esta en considerar los distintos mecanismos de interaccion puestos en juego,que estan descritos a traves de las correspondientes secciones eficaces de interaccion. Lanaturaleza intrınsecamente aleatoria de esos procesos de interaccion permite su analisismediante tecnicas Monte Carlo de manera natural.
En cada interaccion la partıcula incidente sufre (o puede sufrir) un cambio de direc-cion o una perdida de energıa que puede ser transferida, total o parcialmente, al medio,pudiendo dar lugar a la generacion de nuevas partıculas (partıculas secundarias) cuyasrespectivas historias deberan tambien ser consideradas. Todos estos detalles especıficosestan descritos a traves de las secciones eficaces antes mencionadas.
Existen varios codigos de simulacion Monte Carlo del transporte de radiacion en mediosmateriales disponibles. Los codigos EGS4, desarrollado por Nelson et al. en 1985 [10],ETRAN, publicado por Berger y Seltzer en 1988 [11], ITS3, de Halbleib et al., aparecido en1992 [12], PENELOPE, cuya primera version data de 1996 [9], y EGSnrc, de Kawrakow etal., publicado en 2001 [13], permiten simular el transporte acoplado de electrones, fotonesy positrones. Otros codigos con los que es posible simular, ademas, otras partıculas, comoneutrones, protones, partıculas α o iones pesados, son MCNP (con sus distintas versiones)[14], Geant4 [15] y FLUKA [16].
PENELOPE, acronimo de “PENetration and Energy LOss of Positrons and Electronsin matter” [9], es el codigo utilizado en este trabajo de investigacion. Originalmente, soloincluıa el transporte de electrones y positrones; el de fotones se anadio posteriormente.PENELOPE permite realizar el transporte de las partıculas mencionadas con energıascomprendidas entre unos 50 eV y 1 GeV.
En el caso de fotones, los mecanismos de interaccion que PENELOPE tiene en cuentason el efecto fotoelectrico, la dispersion (coherente) Rayleigh, la dispersion (incoherente)Compton y la produccion de pares electron–positron. Por su parte, electrones y positro-nes pueden sufrir dispersiones elasticas, dispersiones inelasticas, emision Bremsstrahlung.En el caso de los positrones tambien se considera la aniquilacion. En PENELOPE estosprocesos de interaccion se describen mediante las correspondientes secciones eficaces di-ferenciales que estan obtenidas a partir de bases de datos experimentales o calculadas ode modelos teoricos contrastados [9].
La simulacion de las historias de fotones se realiza en PENELOPE, igual que en losrestantes codigos Monte Carlo antes mencionados, de forma detallada, es decir, simulandode forma cronologica todos y cada uno de los eventos de interaccion que cada foton sufrecon el material en el que se esta moviendo. En este caso, la simulacion detallada es viableya que la historia de un foton es corta y se termina generalmente despues de unas cuantasinteracciones.
20 CAPITULO 1. DOSIMETRIA EN RADIOTERAPIA
Sin embargo la simulacion de las historias de electrones o positrones no pueden llevar-se a cabo en forma detallada de manera sencilla, ya que la perdida de energıa que estaspartıculas sufren en cada interaccion es relativamente muy pequena, lo que implica quees necesario un numero considerable de interacciones hasta que los electrones o los posi-trones alcanzan energıas por debajo de las energıas de absorcion que se hayan establecidopreviamente.
Para superar este problema los codigos Monte Carlo recurren a las teorıas de dispersionmultiple en las cuales el efecto global de un cierto numero de eventos de dispersion sedescribe de manera condensada. Estas teorıas de dispersion multiple son, evidentemente,aproximaciones de la realidad y podrıan conducir a errores sistematicos en aquellos casosen los que el numero de interacciones de las partıculas simuladas es pequeno como sucedeen el caso del trasnporte en laminas materiales delgadas como las que, por ejemplo, seencuentran en la simulacion de la respuesta de camaras de ionizacion [9].
PENELOPE simula las trayectorias de los electrones y positrones separando las interac-ciones que sufren en dos grupos: duras y blandas. Las colisiones duras son aquellas en lasque los cambios de direccion de la trayectoria de la partıcula o las perdidas de energıasufridas por ella son mayores que ciertos valores umbral definidos por el usuario; las inter-acciones blandas son las que no cumplen esas condiciones. Mientras que las interaccionesduras son simuladas en forma detallada, el efecto combinado de todas las interaccionesblandas que ocurren entre dos interacciones duras se simula mediante un evento singularartificial caracterizado por el modelo de dispersion multiple correspondiente.
Para llevar a cabo la simulacion, PENELOPE requiere leer la informacion fısica de cadamaterial que interviene en la geometrıa en la que se lleva a cabo. La informacion sobre losmateriales se genera mediante el programa auxiliar material, que requiere informacionespecıfica acerca del material: composicion estequiometrica o fraccion en peso de cadaelemento constituyente del material, densidad masica, energıa media de excitacion, etc.En el caso de los elementos compuestos se utiliza la aproximacion de aditividad paradefinir la seccion eficaz de los materiales. PENELOPE tiene una base de datos de 280elementos precalculados [9].
Evidentemente PENELOPE requiere tambien la geometrıa sobre la cual se realiza eltransporte de radiacion. Para construirla se utilizan superficies cuadricas que delimitanregiones del espacio que son “llenadas” con los materiales concretos. La manipulacion delas geometrıas se lleva a cabo mediante el paquete de subrutinas pengeom, que es partede la distribucion del programa.
En cada instante de la simulacion de una historia de una partıcula se requiere la de-terminacion de la longitud de camino hasta la siguiente interaccion, la determinacion delproceso de interaccion que la partıcula sufrira al final del salto y su estado tras sufrir esainteraccion (posicion, direccion de movimiento y energıa). En cada salto entre interaccio-nes, se deben realizar las operaciones geometricas necesarias, que involucran tareas comoproducir los desplazamientos espaciales y controlar el cruce de interfases entre materialesdiferentes.
En esta ultima situacion, pengeom trabaja de forma sencilla: cuando una partıculaalcanza una interfase su trayectoria se detiene justo despues de entrar en el nuevo material

CAPITULO 1. DOSIMETRIA EN RADIOTERAPIA 21
y es de nuevo lanzada desde ese mismo punto, ya en el nuevo material. Este metodo lograoptimizar la parte geometrica sin perjudicar el proceso fısico del transporte de radiacionen los diferentes medios materiales. Ademas se puede compatibilizar con la aproximacionutilizada en PENELOPE para describir el conjunto de interacciones blandas descritasmediante teorıas de dispersion multiple.
Ademas de generar la geometrıa de simulacion y los materiales que entran en juego enla misma, PENELOPE, que no es mas que un conjunto de subrutinas escritas en FOR-TRAN, requiere un programa principal que controle todos los procedimientos necesariosy, consiguientemente, los correspondientes parametros de simulacion. La distribucion dePENELOPE incluye dos programas principales de caracter generico; pencyl, que permiterealizar simulaciones en estructuras geometricas de simetrıa cilındrica, y penmain, que esun programa de proposito general.
1.3.2. Caracterısticas de las simulaciones realizadas
Ademas de los dos programas principales antes mencionados, hay disponible otro, tam-bien de proposito general, que se denomina penEasy, que fue desarrollado por Sempau etal. [17] y que es el que hemos utilizado en este trabajo para realizar las distintas simu-laciones. El programa permite simular tanto partıculas monoenergeticas como espectros,para los tres tipos de radiacion permitidos (fotones, electrones o positrones). Tambien esposible controlar la direccion de emision desde la fuente, ası como la apertura del “conode emision”. Ademas se puede usar como fuente de partıculas iniciales un espacio de fasespreviamente calculado (tanto en formato estandar del propio codigo como en el de laIAEA).
penEasy controla los parametros de transporte de electrones/positrones para cadamaterial que aparece en la geometrıa. Estos son: C1, que esta relacionado con la de-flexion angular promedio, y C2, que representa la maxima perdida relativa de energıapromedio, ambos calculados entre dos colisiones elasticas duras consecutivas; Wcc y Wcr,que corresponden a las energıas umbral para las colisiones inelasticas duras y de emisionBremsstrahlung dura, respectivamente, y Smax, que define la longitud de paso maximapermitida entre interacciones.
Ademas es necesario fijar los valores de las energıas de absorcion para cada una delas partıculas que pueden simularse, Eabs(e
−), Eabs(γ) y Eabs(e+), que representan las
energıas mınimas para que la simulacion de las correspondientes partıculas continue. Encalculos de dosis absorbidas los valores de Eabs deben elegirse de tal manera que el alcanceresidual de las partıculas con esa energıa sea mas pequeno que el volumen del voxel usadopara registrar la distribucion de dosis [9].
En cada uno de las simulaciones especıficas que se analizan en los capıtulos siguientesse indican los valores concretos de los parametros de transporte utilizados.
Por otro lado, y como se ha indicado anteriormente, el calculo del factor kQ,Q0 se hallevado a cabo usando el cociente dado por la ecuacion (1.8):
kQ,Q0=
fc,Qfc,Q0
,
22 CAPITULO 1. DOSIMETRIA EN RADIOTERAPIA
donde los respectivos factores globales se han determinado de acuerdo con la ecuacion(1.3):
fc,Q =Dw,Q
Dc,Q
, fc,Q0=
Dw,Q0
Dc,Q0
. (1.13)
Con el fin de obtener los valores de dosis necesarios hemos hecho uso del tally de dis-tribucion de dosis cilındrica y del de deposicion de energıa, ambos incluidos en penEasy.Con el primero, que permite determinar los perfiles de dosis en profundidad, hemos cal-culado Dw,Q y Dw,Q0
; el segundo proporciona estimaciones de la energıa depositada encualquiera de los cuerpos materiales incluidos en la geometrıa y, en particular, nos hapermitido obtener los valores de Dc,Q y Dc,Q0
.
El proceso de simulacion Monte Carlo usando PENELOPE con los parametros quese han utilizado en cada caso requiere un tiempo de CPU considerable. Para poder lle-var a cabo las simulaciones en tiempos razonables, hemos hecho uso de la metodologıapropuesta en el trabajo de Badal y Sempau [18], segun la cual cada simulacion se divideen varias partes que se ejecutan en computadores diferentes, utilizandose posteriormenteel programa clonEasy para reunir los resultados obtenidos en un valor unico. En cadauna de las simulaciones individuales, el generador de numeros aleatorios se inicializa consemillas diferentes, pertenecientes a la misma secuencia, garantizandose en todo caso quelos calculos no esten correlacionados. En nuestros calculos hemos utilizado las diferen-tes unidades del cluster del departamento de Fısica Atomica, Molecular y Nuclear de laUniversidad de Granada.
La estimacion de incertidumbres se ha realizado de la siguiente forma. Supongamosque queremos estimar una cierta magnitud Q y que el calculo se subdivide entre Mprocesadores. Cada uno de ellos proporciona como resultado de la simulacion el valor
qi =1
Ni
Ni∑k=1
qk , i = 1, 2, . . . ,M , (1.14)
con una incertidumbre
σqi =
√√√√ 1
Ni
[1
Ni
Ni∑k=1
q2k − q2i
]. (1.15)
En las ecuaciones anteriores Ni es el numero de historias simuladas en el procesadori-esimo, por lo que el numero total de historias de la simulacion completa es
N =M∑i=1
Ni (1.16)
y la estimacion Monte Carlo de la magnitud de interes viene dada por
Q =1
N
N∑k=1
qk =1
N
M∑i=1
Ni · qi . (1.17)
CAPITULO 1. DOSIMETRIA EN RADIOTERAPIA 23
La incertidumbre asociada a esta estimacion es:
σQ =
√√√√ 1
N
[1
N
N∑k=1
q2k − Q2
]=
√√√√ 1
N
[1
N
M∑i=1
Ni∑k=1
q2k − Q2
]
=
√√√√ 1
N
[1
N
M∑i=1
Ni
(1
Ni
Ni∑k=1
q2k
)− Q
2
]
=
√√√√ 1
N
[1
N
M∑i=1
Ni
(Ni · σ2
qi+ q2i
)− Q
2
], (1.18)
donde hemos tenido en cuenta la ecuacion (1.15).
[1] International Atomic Energy Agency. Absorbed dose determination in external beamradiotherapy, IAEA Technical Report Series 398. Vienna: IAEA; 2000.
[2] International Commission on Radiation Units & Measurements. Dosimetry of high-energy photon beams based on standards of absorbed dose to waterm (Report 64). JICRU 2001; 1: 1. Bethesda: ICRU; 2001.
[3] Sempau J, Andreo P, Aldana J, Mazurier J, Salvat F. Electron beam quality correc-tion factors for plane-parallel ionization chambers: Monte Carlo calculations using thepenelope system. Phys Med Biol 2004; 49: 4427-44.
[4] Capote R, Sanchez-Doblado F, Leal A, Lagares JI, Arrans R, Hartmann GH. AnEGSnrc Monte Carlo study of the microionization chamber for reference dosimetry ofnarrow irregular IMRT beamlets. Med Phys 2004; 31: 2416-22.
[5] Sarfehnia A, Kawrakow I, Seuntjens J. Direct measurement of absorbed dose to waterin HDR 192Ir brachytherapy: water calorimetry, ionization chamber, Gafchromic film,and TG-43. Med Phys 2010; 37: 1924-32.
[6] Palm A, Mattsson O. Experimental determination of beam quality conversion factorskQ in clinical photon beams using ferrous sulphate (Fricke) dosimetry. Med Phys 2002;29: 2756-62.
[7] Schauer DA, Iwasaki A, Romanyukha AA, Swartz HM, Onori S. Electron paramag-netic resonance (EPR) in medical dosimetry. Radiat Meas 2007; 41: S117-23.
[8] Gonzalez DM, Hartmann GH, Sanchez Doblado D, Gomez F, Kapsch RP, Pena J,Capote R. The determination of beam quality correction factors: Monte Carlo simu-lations and measurements. Phys Med Biol 2009; 54: 4723-41.
[9] Salvat F, Fernandez-Varea JM, Sempau J. PENELOPE 2011: A code system for MonteCarlo simulation of electron and photon transport. Issy-les-Moulineaux: OECD Nu-clear Energy Agency; 2011.

24 CAPITULO 1. DOSIMETRIA EN RADIOTERAPIA
[10] Nelson WR, Hirayama H, Rogers DWO. The EGS4 code system. Report SLAC-265.Stanford: Stanford Linear Accelerator Center; 1985.
[11] Berger MJ, Seltzer SM. Monte Carlo transport of electrons and photons. Jenkins TM,Nelson WR, Rindi A. eds. New York: Plenum; 1988.
[12] Halbleib JA, Kensek RP, Mehlhorn TA, Valdez GD, Seltzer SM, Berger MJ. ITSversion 3.0: The integrated TIGER series of coupled electron/photon Monte Carlotransport codes. Albuquerque: Sandia National Laboratories; 1992.
[13] Kawrakow I, Rogers DWO. The EGSnrc code system: Monte Carlo simulation ofelectron and photon transport. Otawa: Report PIRS-701 National Research Councilof Canada; 2001.
[14] X-5 Monte Carlo team. MCNP-A general Monte Carlo N-particle transport code,version 5. New Mexico: Los Alamos National Laboratory; 2003.
[15] Agostinelli S. et al. Geant4–a simulation toolkit. Nucl Instrum Meth Phys Res A 2003;506: 250-303.
[16] Ferrari A, Sala PR, Fasso A, Ranft J. FLUKA: a multi-particle transport code (Pro-gram version 2005). CERN-2005-10, INFN/TC-05/11, SLAC-R-773. Geneva: CERN;2005.
[17] Sempau J, Badal A, Brualla L. A PENELOPE based system for the automated MonteCarlo simulation of clinacs and voxelized geometries application to far from axis fields.Med Phys 2011; 38: 5887-95.
[18] Badal A, Sempau J. A package of linux scripts for the parallelizationof Monte Carlosimulations. Computer Physics Communications 2006; 175: 440-50.
Capıtulo 2
Camaras de dedal
25

CAPITULO 2. CAMARAS DE DEDAL 27
Physica Medica: European Journal of Medical Physics 29 (2013) 163-170
Calculation of beam quality correction factors forvarious thimble ionization chambers using
the Monte Carlo code penelope
Fabian Erazo1,2 and Antonio M Lallena1
1 Departamento de Fısica Atomica, Molecular y Nuclear,Universidad de Granada, E-18071 Granada, Spain2 Instituto del Cancer - SOLCA, Cuenca, Ecuador
The beam quality correction factor kQ,Q0and the perturbation factor pQ, commonly
considered in dosimetry with ionization chambers, were calculated for the NE2571 andthe Standard Imaging A19 and A12S chambers, using the Monte Carlo simulation codePENELOPE. For the NE2571 chamber, the values of kQ,Q0
obtained are in very goodagreement with those found in previous works by Wulff et al. and Muir and Rogers withthe code EGSnrc and also with the experimental results summarized in the NCS code ofpractice. For pQ, a difference of ∼ 0.4 % have been found between our results and thoseobtained with EGSnrc for 60Co and this difference increases slightly with TPR20
10 values.These factors have been calculated also for the A19 and A12S chambers of StandardImaging. The values of kQ,Q0
show reasonable agreement with those recently calculatedby Muir and Rogers and the measurements of McEwen.
28 CAPITULO 2. CAMARAS DE DEDAL
2.1. Introduction
TG51 [1] and TRS-398 [2], the common codes of practice for dosimetry in radiotherapy,recommend to determine the absorbed dose on the base of standards of dose to water.Using Spencer-Attix cavity theory, the dose in water, Dw,Q, for a given beam quality Q, isrelated to the dose in an air cavity, Dair,Q, by means of the stopping-power ratio betweenwater and air, (sw,air)Q:
Dw,Q = Dair,Q · (sw,air)Q . (2.1)
However, the detector (usually an ionization chamber) differs from the ideal cavity consi-dered in the theory and an overall perturbation factor, pQ, must be included:
Dw,Q = Dc,Q · pQ · (sw,air)Q , (2.2)
where Dc,Q is the dose measured in the ionization chamber. This perturbation factortakes into account the fact that (i) the fluence in the medium (water) is different fromthat in the air cavity inside the ionization chamber; (ii) the air cavity of the ionizationchamber produces a lower attenuation than the water it displaces and a shift of theeffective measurement point; (iii) the material of the wall of the ionization chamber isdifferent from that of the medium where measurements are performed, water in this case;(iv) a waterproofing sleeve can be eventually present; (v) the central electrode situatedin the air cavity of the ionization chamber produces a perturbation, and (vi) ionizationchambers usually have stems.
Also of interest is the so-called beam quality correction factor which takes into accountthat the quality Q of the final user is different from the quality Q0 at which the ionizationchamber is calibrated in the reference laboratory. This factor is given by [2]
kQ,Q0=
pQpQ0
(sw,air)Q(sw,air)Q0
=
(Dw,Q
Dc,Q
)·(Dw,Q0
Dc,Q0
)−1. (2.3)
Usually, Q0 is the beam quality specifier for a 60Co gamma beam.
The direct measurement of pQ and kQ,Q0is a challenging task. On the other hand,
their calculation via Monte Carlo simulation is easier and more readily available, bydetermining Dw,Q, Dc,Q and (sw,air)Q and using equations (4.1) and (4.2). Of course thiscomputational approach will be feasible only if the ionization chambers can be modeledwith enough accuracy. Alternatively, Sempau et al. [3] suggested to calculate kQ,Q0
as
kQ,Q0=
fc,Qfc,Q0
, (2.4)
where fc,Q is an overall ionization chamber and quality dependent factor that relates theabsorbed dose in the medium with the absorbed dose in the detector:
Dw,Q = Dc,Q · fc,Q . (2.5)
CAPITULO 2. CAMARAS DE DEDAL 29
Comparing this equation with (4.1) one can say that, formally, the factor fc,Q could beidentified with the product pQ · (sw,air)Q. However, the calculation of this last product isbased on various approximations [3]: the electron fluence in the medium is the same as inthe real detector, the various perturbation effects included in pQ are independent and thestopping-power ratios and the perturbation effects are uncorrelated. The direct calculationof fc,Q does not require these assumptions. In fact, this factor could be understood as amodified stopping-power ratio which is calculated using the correct fluences in the mediumand in the detector and taking into account in a realistic way the effect due to the factthat the detector is actually situated in the medium.
In this work we have calculated both pQ and kQ,Q0for three ionization chambers,
using the Monte Carlo simulation code PENELOPE [4]. Specifically we have analyzedthe NE2571 Farmer-type chamber, manufactured by QADOS (Sandhurst, UK) and theA19 and A12S chambers, manufactured by Standard Imaging (Middleton, USA). Theresults obtained have been compared to those quoted in TRS-398 [2], with the resultsobtained in previous simulations done with the EGSnrc Monte Carlo code [5,6] and withmeasurements summarized in [7,8].
2.2. Material and methods
2.2.1. PENELOPE code
Nowadays, different general purpose Monte Carlo codes, such as PENELOPE [4],EGSnrc [9], Geant4 [10] and MCNPX [11], are able to model the geometry of ionizationchambers with enough accuracy to permit a feasible comparison with measurements.
In this work we have used PENELOPE (v. 2008) [4]. This code permits to transportelectrons and positrons within a mixed algorithm in which interaction events are classifiedas hard or soft. Hard events correspond to angular deflections or energy losses larger thanthreshold values defined by the user. These kind of events are simulated in a (detailed)analogue way, interaction by interaction. The combined effect of all soft events that occurbetween two hard collisions is simulated by means of an artificial single event, using amultiple scattering model. Detailed simulation is also used for photons.
In PENELOPE, the geometries of the ionization chambers can be built up by meansof quadric surfaces through the package PENGEOM. Materials can be generated knowingtheir densities and stoichiometric composition or selected from an ample database. PE-NELOPE needs a main program to control the simulation process. In this work we haveused penEasy [12]. This code is capable of solving a wide range of situations in MonteCarlo simulations, including those of interest in this work. In order to reduce the CPU ti-me consumed in the simulations, we adapted clonEasy [13], a code which permits parallelsimulation in various computers. All caculations were done on a LINUX cluster in whichup to 20 CPU’s could be used simultaneously.
30 CAPITULO 2. CAMARAS DE DEDAL
The evaluation of Monte Carlo estimates and the corresponding statistical uncertain-ties was done according to [3,4].
PENELOPE transport parameters determine the average angular deflection betweentwo consecutive hard elastic collisions (C1, which is expressed in terms of the average cosineof the deflection angle), the maximum average fractional energy loss between consecutivehard elastic events (C2) and the threshold energies for hard inelastic interactions (Wcc)and hard bremsstrahlung emission (Wcr) (see [4] for details). In addition, the absorptionenergies at which the track simulation is stopped and the parameter smax, which fixesthe maximum step between interactions, must be defined. All these parameters should beestablished for each material in the geometry. In addition, absorption energies must bechosen for each particle type and each material.
In our simulations we used C1 = C2 = 0.02 in all regions except the water phantomand the air surrounding the geometry where C1 = C2 = 0.1 were fixed. On the other hand,Wcc = 0.01 · Emax and Wcr = 0.001 · Emax, with Emax the maximum energy of the initialparticles. For the absorption energies we used Eabs(e
−, e+) = Wcc and Eabs(γ) = Wcr. Wehave checked that reducing the values of these parameters do not change the results ofour simulations. Finally, smax was set up, as suggested in the code user manual, to onetenth of the characteristic thickness of each material in the geometry.
2.2.2. Thimble ionization chambers
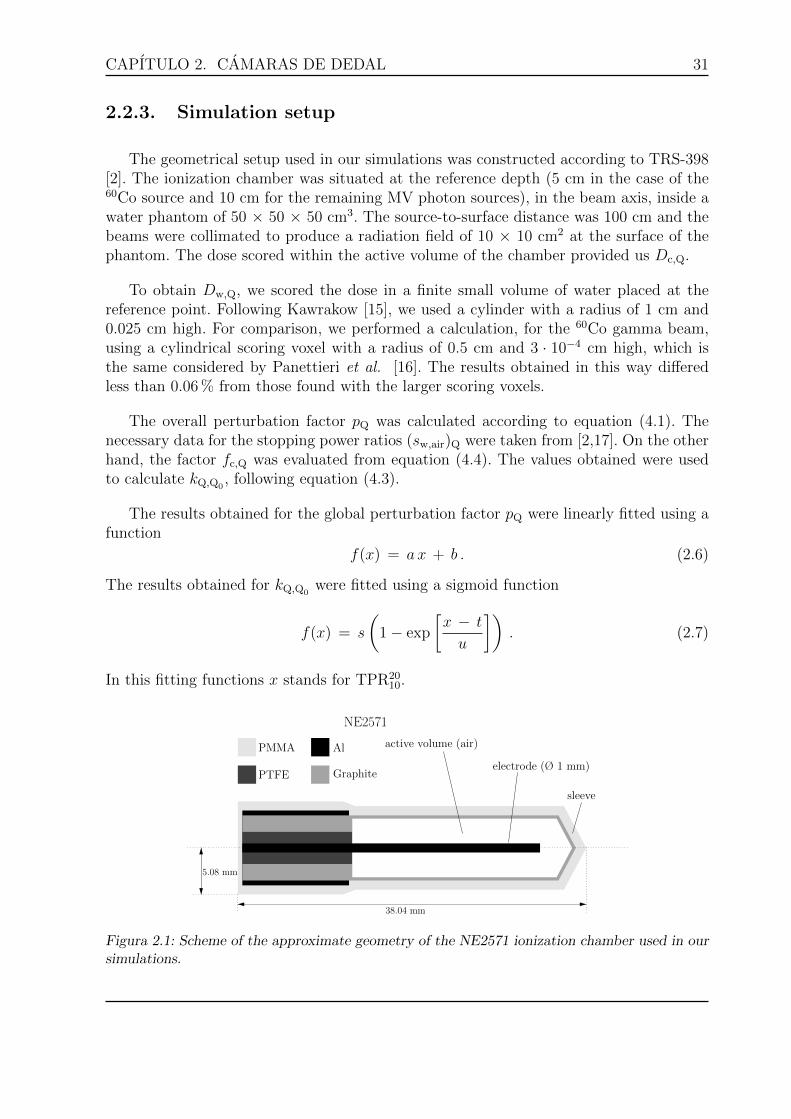
Three thimble type ionization chambers were studied in this work. The first one isthe NE2571 Farmer-type chamber. The geometry details were obtained from the works ofAird and Farmer [14] and Wulff et al. [5]. Figure 2.1 shows a drawing of the approximatedgeometry used in the simulations. The chamber cavity has a diameter of 0.64 cm and alength of 2.40 cm and includes a central electrode made of aluminium and with a diameterof 0.1 cm. The graphite wall has a thickness of 0.04 cm. Additionally, the chamber modelincludes a sleeve of 0.10 cm made of PMMA (polymethyl methacrylate). The nominalchamber volume is 0.6 cm3. An insulator made of PTFE (polytetrafluoroethylene) isbetween the electrode and the wall.
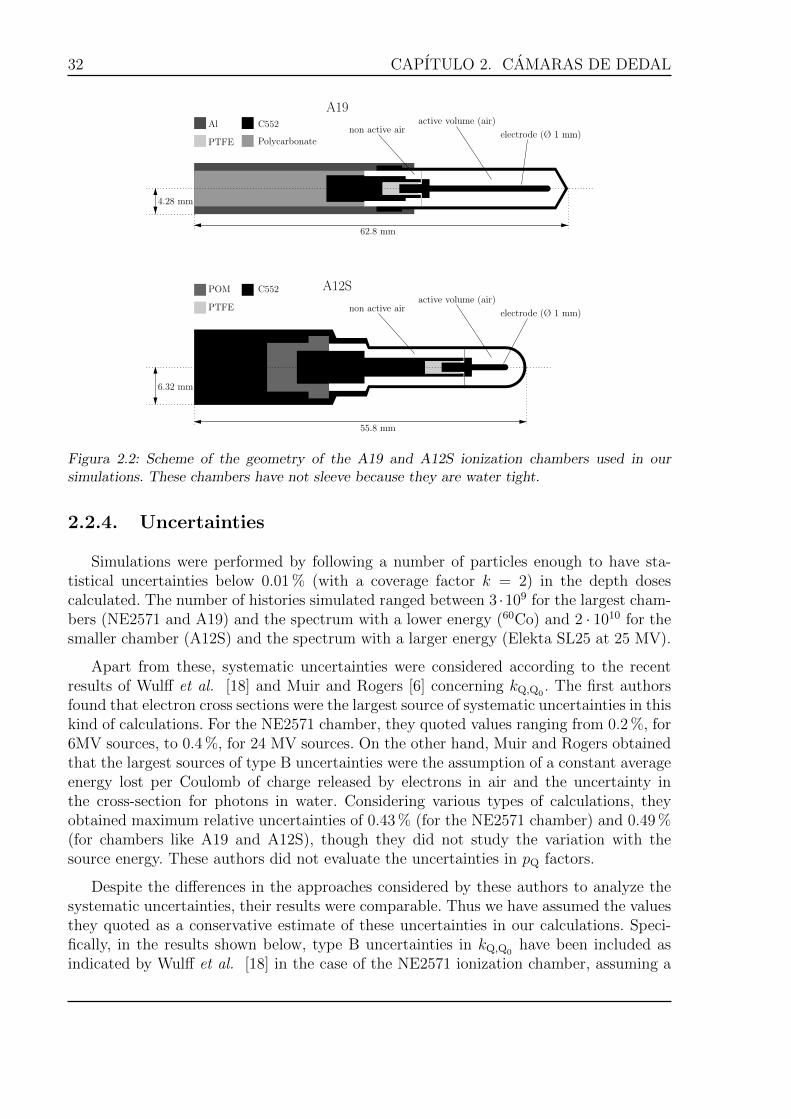
The other two ionization chambers studied are sketched in figure 3.1. These are themodels A19 and A12S from Standard Imaging. The detailed geometries have been obtai-ned from the manufacturer. The A19 has an air cavity with a diameter of 0.60 cm whichincludes a central electrode with a diameter of 0.10 cm. The air cavity volume is about0.62 cm3. The A12S has an air cavity volume of 0.25 cm3 with a diameter of 0.60 cmand a central electrode with a diameter of 0.10 cm. These ionization chambers are madebasically of C552 (an air-equivalent conductive plastic with a nominal density of 1.76 gcm−3). In these geometries also the materials PTFE (polytetrafluoroethylene) and POM(polyoxymethylene) were used.
CAPITULO 2. CAMARAS DE DEDAL 31
2.2.3. Simulation setup
The geometrical setup used in our simulations was constructed according to TRS-398[2]. The ionization chamber was situated at the reference depth (5 cm in the case of the60Co source and 10 cm for the remaining MV photon sources), in the beam axis, inside awater phantom of 50 × 50 × 50 cm3. The source-to-surface distance was 100 cm and thebeams were collimated to produce a radiation field of 10 × 10 cm2 at the surface of thephantom. The dose scored within the active volume of the chamber provided us Dc,Q.
To obtain Dw,Q, we scored the dose in a finite small volume of water placed at thereference point. Following Kawrakow [15], we used a cylinder with a radius of 1 cm and0.025 cm high. For comparison, we performed a calculation, for the 60Co gamma beam,using a cylindrical scoring voxel with a radius of 0.5 cm and 3 · 10−4 cm high, which isthe same considered by Panettieri et al. [16]. The results obtained in this way differedless than 0.06 % from those found with the larger scoring voxels.
The overall perturbation factor pQ was calculated according to equation (4.1). Thenecessary data for the stopping power ratios (sw,air)Q were taken from [2,17]. On the otherhand, the factor fc,Q was evaluated from equation (4.4). The values obtained were usedto calculate kQ,Q0
, following equation (4.3).
The results obtained for the global perturbation factor pQ were linearly fitted using afunction
f(x) = a x + b . (2.6)
The results obtained for kQ,Q0were fitted using a sigmoid function
f(x) = s
(1 − exp
[x − t
u
]). (2.7)
In this fitting functions x stands for TPR2010.
5.08 mm
38.04 mm
electrode (Ø 1 mm)
active volume (air)
sleeve
PMMA
PTFE
Al
Graphite
NE2571
Figura 2.1: Scheme of the approximate geometry of the NE2571 ionization chamber used in oursimulations.
32 CAPITULO 2. CAMARAS DE DEDAL
4.28 mm
62.8 mm
electrode (Ø 1 mm)
active volume (air)non active air
A19Al
PTFE
C552
Polycarbonate
6.32 mm
55.8 mm
POM
PTFE
C552
electrode (Ø 1 mm)
active volume (air)non active air
A12S
Figura 2.2: Scheme of the geometry of the A19 and A12S ionization chambers used in oursimulations. These chambers have not sleeve because they are water tight.
2.2.4. Uncertainties
Simulations were performed by following a number of particles enough to have sta-tistical uncertainties below 0.01 % (with a coverage factor k = 2) in the depth dosescalculated. The number of histories simulated ranged between 3 ·109 for the largest cham-bers (NE2571 and A19) and the spectrum with a lower energy (60Co) and 2 · 1010 for thesmaller chamber (A12S) and the spectrum with a larger energy (Elekta SL25 at 25 MV).
Apart from these, systematic uncertainties were considered according to the recentresults of Wulff et al. [18] and Muir and Rogers [6] concerning kQ,Q0
. The first authorsfound that electron cross sections were the largest source of systematic uncertainties in thiskind of calculations. For the NE2571 chamber, they quoted values ranging from 0.2 %, for6MV sources, to 0.4 %, for 24 MV sources. On the other hand, Muir and Rogers obtainedthat the largest sources of type B uncertainties were the assumption of a constant averageenergy lost per Coulomb of charge released by electrons in air and the uncertainty inthe cross-section for photons in water. Considering various types of calculations, theyobtained maximum relative uncertainties of 0.43 % (for the NE2571 chamber) and 0.49 %(for chambers like A19 and A12S), though they did not study the variation with thesource energy. These authors did not evaluate the uncertainties in pQ factors.
Despite the differences in the approaches considered by these authors to analyze thesystematic uncertainties, their results were comparable. Thus we have assumed the valuesthey quoted as a conservative estimate of these uncertainties in our calculations. Speci-fically, in the results shown below, type B uncertainties in kQ,Q0
have been included asindicated by Wulff et al. [18] in the case of the NE2571 ionization chamber, assuming a
CAPITULO 2. CAMARAS DE DEDAL 33
linear dependence with the energy of the source. On the other hand, and following theresults of Muir and Rogers [6], we have considered a slightly larger range (up to 0.5 %) incase of A19 and A12S chambers.
2.2.5. Radiation sources
In this work we used a 60Co gamma beam, whose spectrum was obtained from thework of Mora and Maio [19], and various photon beams corresponding to different linearaccelerators. In particular we considered a Varian Clinac LE of 4 MV, a Varian ClinacHE of 6, 10, 15 and 18 MV, a Siemens KD of 6 and 18 MV and an Elekta SL25 of 6 and25 MV. The photon spectra of these accelerators were taken from Sheikh-Bagheri andRogers [20].
In all the simulations, sources were assumed to be point sources emitting photonswith the corresponding spectrum. As indicated, particle transport was performed withthe Monte Carlo code PENELOPE [4]. It is worth to mention that Wulff et al. [5]did not find significant differences in the calculated quality indexes when full beam MonteCarlo models of the 6 and 18 MV Siemens KD linacs were used to perform the calculationsinstead a point source with the adequate photon spectrum.
Using the geometrical setup described above, depth doses in the water phantom werecalculated. These calculations were performed using cylindrical scoring voxels centeredin the beam axis, with a radius of 0.5 cm and a height of 0.2 cm, which are the sameas those considered by Muir and Rogers [6]. This permitted us to determine the qualityindex, TPR20
10, for the various beams considered. This index is given by the ratio of thedose absorbed in water at depths of 20 and 10 cm, with a distance between the sourceand the measurement depths of 100 cm and a field at these depths of 10 cm × 10 cm.Instead we calculate TPR20
10 according to [2,21]
TPR2010 = 1.2661 · PDD20
10 − 0.0595 , (2.8)
where PDD2010 is the ratio of the percent depth-doses at 20 cm and 10 cm depths for a field
size of 10 cm x 10 cm defined at the phantom surface with an source-to-surface distanceof 100 cm. According to Followill et al. [21], this approach introduces an uncertainty of±0.01 (with a coverage factor k = 2) in the calculation of TPR20
10.
2.3. Results and discussion
2.3.1. Values of TPR2010
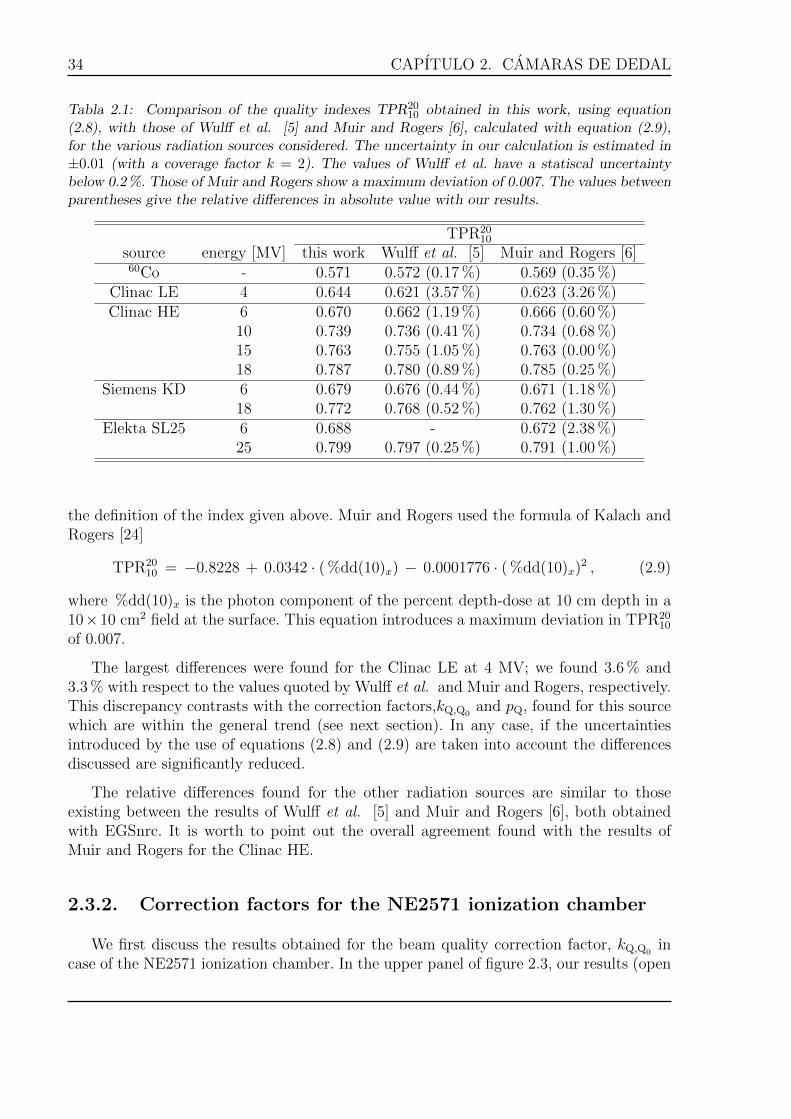
The results obtained for TPR2010 are shown in table 4.2 where they are compared to
the results of Wulff et al. [5] and Muir and Rogers [6]. We calculated TPR2010 values using
equation (2.8). Wulff et al. performed a direct calculation of this quality index, using
34 CAPITULO 2. CAMARAS DE DEDAL
Tabla 2.1: Comparison of the quality indexes TPR2010 obtained in this work, using equation
(2.8), with those of Wulff et al. [5] and Muir and Rogers [6], calculated with equation (2.9),for the various radiation sources considered. The uncertainty in our calculation is estimated in±0.01 (with a coverage factor k = 2). The values of Wulff et al. have a statiscal uncertaintybelow 0.2 %. Those of Muir and Rogers show a maximum deviation of 0.007. The values betweenparentheses give the relative differences in absolute value with our results.
TPR2010
source energy [MV] this work Wulff et al. [5] Muir and Rogers [6]60Co - 0.571 0.572 (0.17 %) 0.569 (0.35 %)
Clinac LE 4 0.644 0.621 (3.57 %) 0.623 (3.26 %)Clinac HE 6 0.670 0.662 (1.19 %) 0.666 (0.60 %)
10 0.739 0.736 (0.41 %) 0.734 (0.68 %)15 0.763 0.755 (1.05 %) 0.763 (0.00 %)18 0.787 0.780 (0.89 %) 0.785 (0.25 %)
Siemens KD 6 0.679 0.676 (0.44 %) 0.671 (1.18 %)18 0.772 0.768 (0.52 %) 0.762 (1.30 %)
Elekta SL25 6 0.688 - 0.672 (2.38 %)25 0.799 0.797 (0.25 %) 0.791 (1.00 %)
the definition of the index given above. Muir and Rogers used the formula of Kalach andRogers [24]
TPR2010 = −0.8228 + 0.0342 · ( %dd(10)x) − 0.0001776 · ( %dd(10)x)2 , (2.9)
where %dd(10)x is the photon component of the percent depth-dose at 10 cm depth in a10×10 cm2 field at the surface. This equation introduces a maximum deviation in TPR20
10
of 0.007.
The largest differences were found for the Clinac LE at 4 MV; we found 3.6 % and3.3 % with respect to the values quoted by Wulff et al. and Muir and Rogers, respectively.This discrepancy contrasts with the correction factors,kQ,Q0
and pQ, found for this sourcewhich are within the general trend (see next section). In any case, if the uncertaintiesintroduced by the use of equations (2.8) and (2.9) are taken into account the differencesdiscussed are significantly reduced.
The relative differences found for the other radiation sources are similar to thoseexisting between the results of Wulff et al. [5] and Muir and Rogers [6], both obtainedwith EGSnrc. It is worth to point out the overall agreement found with the results ofMuir and Rogers for the Clinac HE.
2.3.2. Correction factors for the NE2571 ionization chamber
We first discuss the results obtained for the beam quality correction factor, kQ,Q0in
case of the NE2571 ionization chamber. In the upper panel of figure 2.3, our results (open
CAPITULO 2. CAMARAS DE DEDAL 35
0.94
0.96
0.98
1.00
0.980
0.984
0.988
0.992
0.996
1.000
0.60 0.70 0.80
TPR2010
kQ,Q
0p Q
this work
IAEA [2]
Wulff et al [5]
fit to results of this work
Muir and Rogers [6]
experiment (NCS [7])
this work
fit to results of this work
Wulff et al [5]
Wulff et al [5]
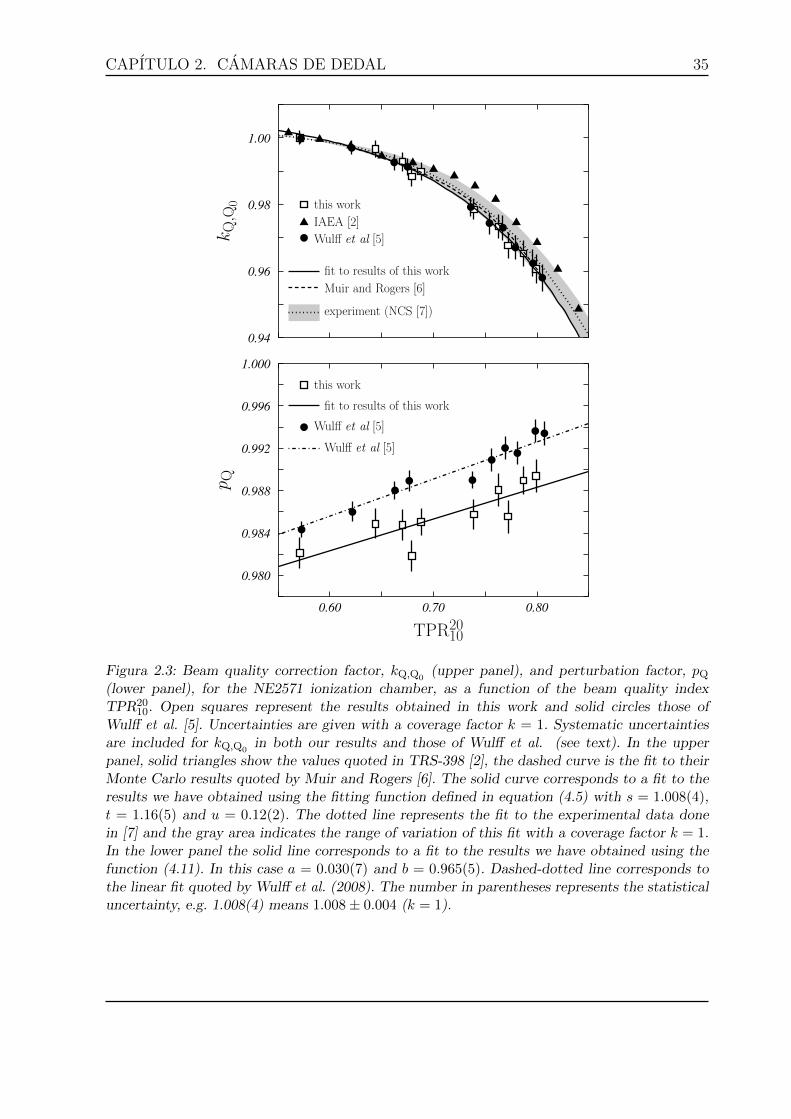
Figura 2.3: Beam quality correction factor, kQ,Q0(upper panel), and perturbation factor, pQ
(lower panel), for the NE2571 ionization chamber, as a function of the beam quality indexTPR20
10. Open squares represent the results obtained in this work and solid circles those ofWulff et al. [5]. Uncertainties are given with a coverage factor k = 1. Systematic uncertaintiesare included for kQ,Q0
in both our results and those of Wulff et al. (see text). In the upperpanel, solid triangles show the values quoted in TRS-398 [2], the dashed curve is the fit to theirMonte Carlo results quoted by Muir and Rogers [6]. The solid curve corresponds to a fit to theresults we have obtained using the fitting function defined in equation (4.5) with s = 1.008(4),t = 1.16(5) and u = 0.12(2). The dotted line represents the fit to the experimental data donein [7] and the gray area indicates the range of variation of this fit with a coverage factor k = 1.In the lower panel the solid line corresponds to a fit to the results we have obtained using thefunction (4.11). In this case a = 0.030(7) and b = 0.965(5). Dashed-dotted line corresponds tothe linear fit quoted by Wulff et al. (2008). The number in parentheses represents the statisticaluncertainty, e.g. 1.008(4) means 1.008± 0.004 (k = 1).
36 CAPITULO 2. CAMARAS DE DEDAL
squares) are compared to those of Wulff et al. [5], which are shown with solid circles, andalso with those quoted in TRS-398 protocol [2], plotted with solid triangles. The solidcurve shows the fit to our results using the function defined in equation (4.5). The dashedcurve represents the fit quoted by Muir and Rogers [6] to their EGSnrc Monte Carloresults. The dotted line represents the fit to the experimental data done in [7] and thegray area shows the range of variation of this fit.
Our results agree rather well with those of Wulff et al. [5]. On the other hand, theydiffer significantly from those of TRS-398. The fit to our data (solid curve) and thatquoted by Muir and Rogers [6] (dahsed curve) also show a good agreement, despite thedifferences discussed above between the respective calculations in the TPR20
10 values (seetable 4.2). There is also an overall agreement with the fit to experimental data of [7].
In the lower panel of figure 2.3, the overall perturbation factors pQ we have obtainedare plotted with open squares. Solid line gives the linear fit of these results. For comparisonwe show, with solid circles, the values quoted by Wulff et al. [5] together with the linearfit given by these authors. The results differ significantly for the reference quality (60Co).Therein a relative difference of ∼ 0.4 % is found and this difference grows slightly as TPR20
10
increases. In fact, both sets of values show an almost parallel behavior: the slope quotedby Wulff et al. is 0.0349 while we have found 0.030 ± 0.007. This discrepancy betweenEGSnrc and PENELOPE calculations is of the same order of that found by Wulff andZink for the NACP-02 chamber in case of 60Co beams [22]. These authors quoted 0.3 %overall deviation for the pQ correction factor. Our results point out a systematic differencebetween both codes in what refers to this factor pQ.
It should be noted that the result obtained for the Siemens KD at 6 MV (TPR2010 =
0.679) is clearly out of the trend defined by the rest of the radiation sources investigated.This does not appear so clearly in the case of kQ,Q0
(upper panel) and did not show upin the results quoted in table 4.2 where differences of 0.44 % with Wulff et al. [5] and1.18 % with Muir and Rogers [6] were found. Recently, Muir et al. [23] have found aoutlier behavior when they calculated differences in the kQ,Q0
factors for the NE2571, thePTW30012 and the IBA FC-65G ionization chambers when the spectrum of the SiemensKD operating at 18 MV was considered. This result together with that we have found for6MV could indicate a problem with the published spectra for the Siemens KD linac. Asimilar situation can be observed in the results of Wulff et al. [5] for the Varian ClinacHE at 10 MV (TPR20
10 = 0.736): in that case the value for pQ lies well below the lineartrend (dashed dotted line).
2.3.3. Correction factors for A19 and A12S ionization chambers
Now we discuss the results obtained for the beam quality correction factor, kQ,Q0, for
the Standard Imaging A19 and A12S thimble ionization chambers. Results are shown infigure 2.4 with open squares. Also we show with solid curves the fits to data using thefunction in equation (4.5). These results are compared to the measurements of McEwen[8] (solid circles) and with the fits to their Monte Carlo results quoted by Muir and Rogers[6] (dashed curve).
CAPITULO 2. CAMARAS DE DEDAL 37
0.94
0.96
0.98
1.00
0.94
0.96
0.98
1.00
0.6 0.7 0.8
TPR2010
kQ,Q
0kQ,Q
0
A19
A12S
this work
McEwen [8]
fit to results of this work
Muir and Rogers [6]
this work
McEwen [8]
fit to results of this work
Muir and Rogers [6]
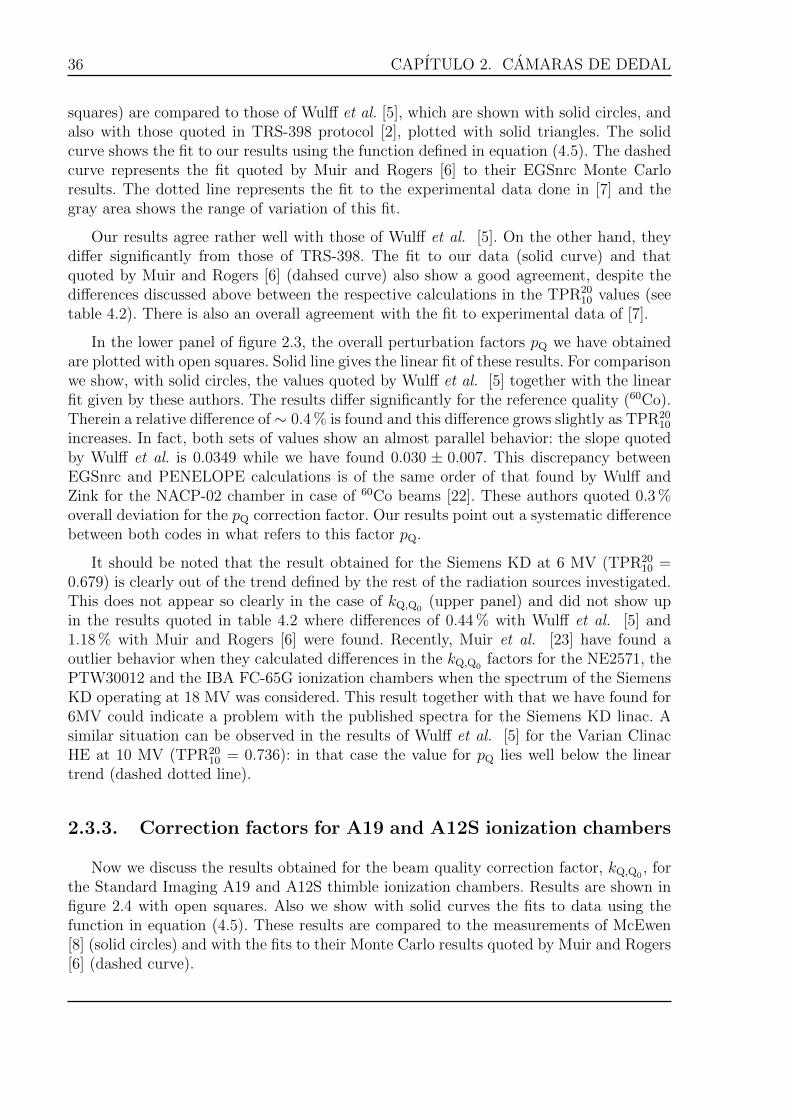
Figura 2.4: Beam quality correction factor, kQ,Q0for A19 (upper panel) and A12S (lower panel)
ionization chambers, as a function of the beam quality index TPR2010. Open squares correspond to
the results we have obtained. Uncertainties are given with a coverage factor k = 1. Systematicuncertainties are included (see text). Solid curves correspond to fits to the results we haveobtained. The fitting function defined in equation (4.5) was used. For the A19 chamber, s =1.007(5), t = 1.17(8) and u = 0.12(3). For the A12S chamber, s = 1.117(6), t = 1.21(9) andu = 0.13(3). Here, the number in parentheses represents the statistical uncertainty, e.g. 1.21(9)means 1.21 ± 0.09 (k = 1). Dashed curves are the fits to their Monte Carlo results quoted byMuir and Rogers [6].
Our results show a reasonable agreement with the fits of Muir and Rogers [6] and withthe experimental measurements of McEwen [8]. PENELOPE results seem to be in betteragreement with experiment than EGSnrc ones at the higher energies. The same occurs forboth chambers. The results shown here, together with those of figure 2.3 (upper panel)indicate that the function (4.5) permits a good description of the kQ,Q0
data. It is worth
38 CAPITULO 2. CAMARAS DE DEDAL
0.976
0.984
0.992
1.000
0.60 0.70 0.80
TPR2010
p Q
this work (A19)
fit to results of A19
this work (A12S)
fit to results of A12S
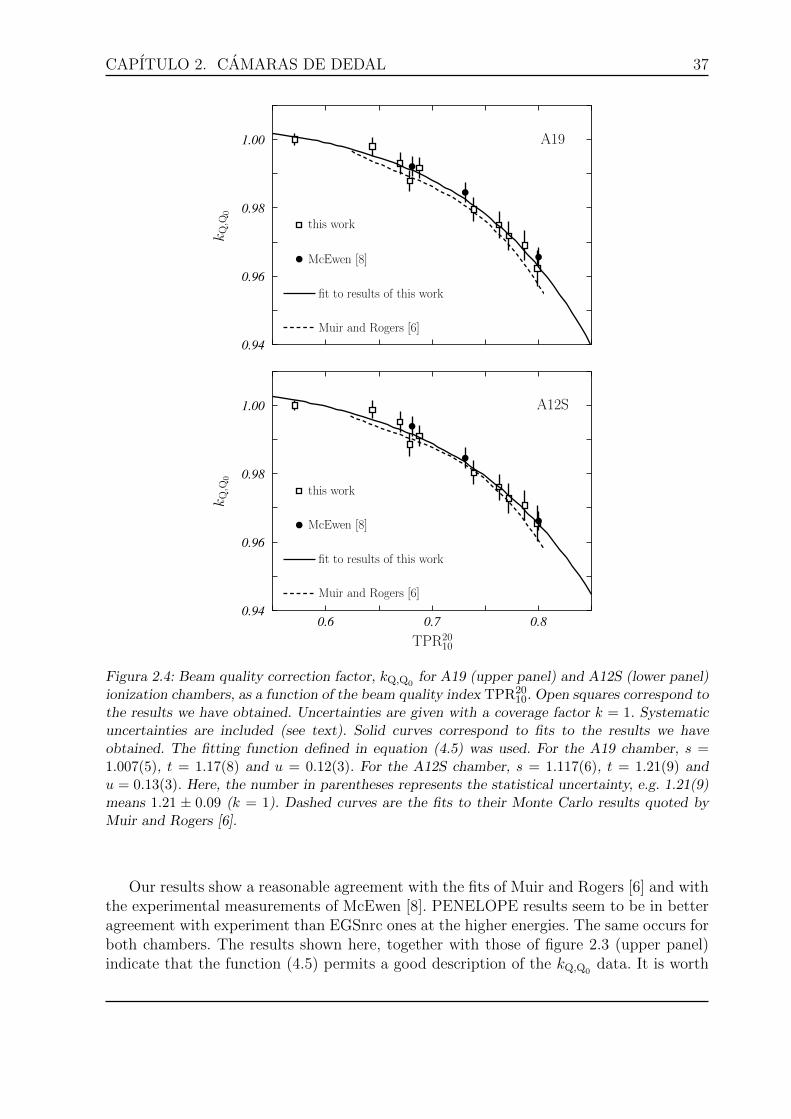
Figura 2.5: Perturbation factor, pQ, for the A19 (open squares) and A12S (solid circles) ionizationchambers, as a function of beam quality index TPR20
10. Uncertainties are given at 2σ level. Thelines are linear fits to the results we have obtained for the two chambers. The function (4.11) hasbeen used. For the A19 chamber the fitting parameters were a = 0.065(7) and b = 0.939(5). Inthe case of the A12S chamber, a = 0.065(7) and b = 0.941(5). Here, the number in parenthesesrepresents the statistical uncertainty at 1σ level, e.g. 0.939(5) means 0.939± 0.005.
to point out that, as indicated in [7], sigmoid fits preserve their smooth shape even whennoisy data are considered. This does not happens in general with polynomial fits.
Figure 2.5 shows the results obtained for the global perturbation factor pQ for the A19(open squares) and A12S (solid circles) chambers, together with the respective linear fits.These linear fits show up as slightly divergent when TPR20
10 increases. The values obtainedfor TPR20
10 = 0.679, which correspond to the Siemens KD at 6 MV (see table 4.2), arethose showing a larger disagreement with the general trend provided by the fits. This wasalso observed in the case of the kQ,Q0
quality correction factor, also in both chambers (seefigure 2.4). And in the case of the NE2571 chamber (see figure 2.3) the value of pQ foundfor this beam is also out of trend, while for kQ,Q0
the behavior is reasonable. This couldindicate that there is some problem with the spectrum of the corresponding beam thatwe have not been able to identify yet.
2.4. Conclusions
In this work, the perturbation factors for the NE2571 ionization chamber, which iswidely used in radioteraphy dosimetry, have been calculated using the Monte Carlo codePENELOPE.
The values of kQ,Q0that we have obtained are in good agreement with those quoted
by Wulff et al. [5] and Muir and Rogers [6], which were obtained with the code EGSnrc
CAPITULO 2. CAMARAS DE DEDAL 39
and differ significantly from those of TRS-398 protocol [2]. Also an overall agreement withthe experimental data summarized in [7] has been found.
The overall perturbation factor pQ obtained by Wulff et al. with EGSnrc [5] differsfrom that we have found with PENELOPE by ∼ 0.4 % for the 60Co beam. With increasingTPR20
10 the results of both calculations behave almost parallel.
The same perturbation factors have been calculated for the Standard Imaging A19 andA12S ionization chambers. A reasonable agreement with the Monte Carlo results foundby Muir and Rogers [6] with EGSnrc and with the measurements of McEwen [8] has beenfound for both ionization chambers.
Acknowledgements
The authors thanks Brian Hooten, from Standard Imaging, for providing us with thegeometries of the ionization chambers studied. This work has been supported in part bythe Junta de Andalucıa (FQM0220) and by the Spanish DGI (FPA2009-14091-C02-02).
[1] Almond PR, Biggs PJ, Caursey BM, Hanson WF, Saiful HM, Nat R, Rogers DWO.AAPM’s TG-51 protocol for clinical reference dosimetry of high-energy photon andelectron beams. Med Phys 1999; 26: 1847-70.
[2] International Atomic Energy Agency. Absorbed dose determination in external beamradiotherapy, IAEA Technical Reports Series 398. Vienna: IAEA; 2000.
[3] Sempau J, Andreo P, Aldana J, Mazurier J, Salvat F. Electron beam quality correctionfactors for plane-parallel ionization chambers in high energy photon beams: MonteCarlo calculations using the PENELOPE system. Phys Med Biol 2004; 49: 4427-44.
[4] Salvat F, Fernandez-Varea JM, Sempau J. PENELOPE: a code system for MonteCarlo simulation of electron and photon transport. Paris: Nuclear Energy Agency;2008.
[5] Wulff J, Heverhagen JT, Zink K. Monte Carlo based perturbation and beam qualitycorrections factors for thimble ionization chambers in high energy photon beams. PhysMed Biol 2008; 53: 2823-36.
[6] Muir BR, Rogers DWO. Monte Carlo calculations of kQ, the beam quality conversionfactor. Med Phys 2010; 37: 5939-50.
[7] Nederlandse Commissie voor Stralingsdosimetrie. Code of practice for the absorbeddose determination in high energy photon and electron beams. NCS Report 18. Delft:NCS; 2008.
[8] McEwen MR. Measurement of ionization chamber absorbed dose kQ factors in mega-voltage photon beams. Med. Phys. 2010; 37: 2179-93.
40 CAPITULO 2. CAMARAS DE DEDAL
[9] Kawrakow I, Rogers DWO. The EGSnrc code system: Monte Carlo simulation of elec-tron and photon transport. NRC Technical Report No. PIRS-701, v4-2-2-5. Ottawa:National Research Council of Canada; 2007;see http://www.irs.inms.nrc.ca/inms/irs/EGSnrc/EGSnrc.html.
[10] Agostinelli S, Allison J, Amako K, Apostolakis J, et al. Geant4–a simulation tool kit.Nucl. Instr. Meth. Phys. Res. A 2003; 506: 250-303.
[11] Pelowitz DB, ed. MCNPX UserOs Manual version 2.5.0, Report LA-UR-02-2607. LosAlamos: Los Alamos National Laboratory; 2005.
[12] Sempau J. penEasy: A modular main program and voxelized geometry package forPENELOPE. www.upc.edu/inte/downloads/penEasy.htm; 2009.
[13] Badal A, Sempau J. clonEasy: A package of linux scripts for the parallelization ofMonte Carlo simulations. Comp Phys Comm 2005; 175: 440-50.
[14] Aird EG, Farmer FT. The design of a thimble chamber for the Farmer dosemeter.Phys Med Biol 1972; 17: 169-74.
[15] Kawrakow I. On the effective point of measurement in megavoltage photon beams.Med Phys 2006; 33: 1829-39
[16] Panettieri V, Sempau J, Andreo P. Chamber-quality factors in 60Co for three planeparallel chambers for the dosimetry of electrons, protons and heavy charged particles:PENELOPE Monte Carlo simulations. Phys Med Biol 2008; 53: 5917-26.
[17] Andreo P. Improved calculations of stopping-power ratios and their correlation withthe quality of therapeutic photon beams. Proceedings Symposium on MeasurementAssurance in Dosimetry. IAEA, Vienna: IAEA; 1994.
[18] Wulff J, Heverhagen JT, Zink K, Kawrakow I. Investigation of systematic uncertaintiesin Monte Carlo-calculated beam quality correction factors. Phys Med Biol 2010; 55:4481-93.
[19] Mora GM, Maio A. Monte Carlo simulation of a typical 60Co therapy source. MedPhys 1999; 26: 1847-70.
[20] Sheikh-Bagheri D, Rogers DWO. Monte Carlo calculation of nine megavoltage photonbeam spectra using BEAM code. Med Phys 2002; 29: 391-402.
[21] Followill DS, Tailor RC, Tello VM, Hanson WF. An empirical relationship for deter-mining photon beam quality in TG-21 from a ratio of percent depth doses. Med Phys1998; 25: 1202-5.
[22] Wulff J, Zink K. Chamber quality factors for the NACP-02 chamber in 60Co beams:Comparison of EGSnrc and PENELOPE Monte Carlo simulations. International Sym-posium on Standards, Applications and Quality Assurance in Medical Radiation Do-simetry. IAEA, Vienna; 2010.
CAPITULO 2. CAMARAS DE DEDAL 41
[23] Muir BR, McEwen MR, Rogers DWO. Measured and Monte Carlo calculated kQfactors: Accuracy and comparison. Med Phys 2011; 38: 4600-9.
[24] Kalach NI, Rogers DWO. Which accelerator photon beams are Oclinic-likeO for refe-rence dosimetry purposes? Med Phys 2003; 30:1546-55.

Capıtulo 3
Camaras plano-paralelas
43


CAPITULO 3. CAMARAS PLANO-PARALELAS 45
Physics in Medicine and Biology 59 (2014) 6673-6691
Electron beam quality kQ,Q0factors
for various ionization chambers:A Monte Carlo investigation with penelope
F. Erazo1,2,3, L. Brualla4 and A.M. Lallena1
1 Departamento de Fısica Atomica, Molecular y Nuclear,Universidad de Granada, E-18071 Granada, Spain2 Instituto del Cancer - SOLCA, Cuenca, Ecuador
3 Escuela de Tecnologıa Medica, Facultad de Medicina,Universidad de Cuenca, Cuenca, Ecuador
4 NCTeam, Strahlenklinik, Universitatsklinikum Essen,Hufelandstraße 55, D-45122 Essen, Germany
In this work we calculate the beam quality correction factor kQ,Q0 for various plane-parallel ionization chambers. A set of Monte Carlo calculations using the code penelo-pe/penEasy have been carried out to calculate the overall correction factor fc,Q for eightelectron beams corresponding to a Varian Clinac 2100 C/D, with nominal energies ran-ging between 6 and 22 MeV, for a 60Co beam, that has been used as the reference qualityQ0, and also for eight monoenergetic electron beams reproducing the quality index R50
of the Clinac beams. Two field sizes, 10 × 10 cm2 and 20 × 20 cm2 have been considered.The kQ,Q0 factors have been calculated as the ratio between fc,Q and fc,Q0
. Values forthe Exradin A10, A11, A11TW, P11, P11TW, T11 and T11TW ionization chambers,manufactured by Standard Imaging, as well as for the NACP-02 have been obtained. Theresults found with the Clinac beams for the two field sizes analyzed show differences below0.6 %, even in the case of the higher energy electron beams. The kQ,Q0 values obtainedwith the Clinac beams are 1 % larger than those found with the monoenergetic beams forthe higher energies, above 12 MeV. This difference can be ascribed to secondary photonsproduced in the linac head and the air path towards the phantom. Contrary to whatwas quoted in a previous work [Phys. Med. Biol. 49 4427-4444 (2004)], the beam qualitycorrection factors obtained with the complete Clinac geometries and with the monoener-getic beams differ significantly for energies above 12 MeV. Material differences existingbetween chambers that have the same geometry produce non-negligible modifications inthe value of these correction factors.
46 CAPITULO 3. CAMARAS PLANO-PARALELAS
3.1. Introduction
Both TG-51 (Almond et al. 1999) and TRS-398 (IAEA 2000) protocols use standardsbased on water to evaluate absorbed doses. According to the Bragg-Gray theory, theabsorbed dose at a point in water, Dw,Q, for a certain beam quality Q, can be related tothe mean absorbed dose in an air cavity, Dair,Q, as
Dw,Q = Dair,Q (Sw,air)Q , (3.1)
where (Sw,air)Q is the stopping power ratio between water and air (Nahum 1978, Sieberset al. 2000, Jang et al. 2007, Fernandez-Varea et al. 2007). In this expression it is assu-med that the presence of the ideal detector does not modify the electron fluence at themeasuring point in the medium. In general, a real detector, e.g. a plane parallel ionizationchamber, shows some deviations from the ideal detector considered in the theory and afactor, pc,Q, must be included to account for these deviations:
Dw,Q = Dair,Q pc,Q (Sw,air)Q . (3.2)
Here pc,Q is named as a “perturbation” factor because it takes into account the fact thatthe electron fluence at the measuring position in the water medium is perturbed by thepresence of the detector. It can be factorized in terms of individual correction factors,assumed to be independent from each other and uncorrelated among them, that take intoaccount the various effects produced by the detector (IAEA 2000): (i) the in-scatteringof electrons that changes the electron fluence inside a cavity with respect to that in thewater medium in absence of the cavity; (ii) the fact that detector wall material, and thatof any waterproof sleeve present, is different from water; (iii) the effect on the chamberresponse of the central electrode during in-phantom measurements in high energy particlebeams, and (iv) the effect due to the replacement of a water volume with the detectorcavity when the reference point is assumed at the chamber center (not required for plane-parallel ionization chambers).
The previous equation imposes a series of requirements that are difficult to fulfill.Apart from the necessary constancy of the electron fluence at the measuring point withand without the detector, it must be assumed that pc,Q and (Sw,air)Q are uncorrelated.Some authors (Sempau et al. 2004, Capote et al. 2004) proposed an alternative expressionin which Dw,Q is related directly to the absorbed dose in the air cavity of the real detectorDc,Q:
Dw,Q = Dc,Q fc,Q . (3.3)
The obvious advantage is that the overall perturbation factor fc,Q can be calculated usinga realistic description of the geometry of the detector. The overall perturbation factortakes care in a direct way of the complete effect produced by the presence of the detectorin the medium.
Ideally, reference laboratories should have the same beam quality Q than the user. Inthat case, the absorbed dose to water, at the reference depth zref in water, and in theabsence of the chamber is given by (IAEA 2000)
Dw,Q = MQND,w,Q , (3.4)
CAPITULO 3. CAMARAS PLANO-PARALELAS 47
where MQ is the reading of the ionization chamber, corrected for the temperature, pres-sure, electrometer calibration, polarity effect and ion recombination, and ND,w,Q is thecalibration factor in terms of absorbed dose to water for the ionization chamber at thequality Q. However, reference laboratories usually calibrate the detector to a given cali-bration quality Q0 and equation (3.4) must be written as
Dw,Q = MQND,w,Q0kQ,Q0
, (3.5)
where ND,w,Q0is the calibration factor at the reference quality Q0 and kQ,Q0
is a chamber-specific factor that takes into account the differences between the beam quality Q0 usedin the chamber calibration and the beam quality Q available for the user. Usually a 60Cogamma beam is considered as the Q0 reference quality.
According to the works of Sempau et al. (2004) and Capote et al. (2004) the beamquality correction factor can be calculated as
kQ,Q0=
fc,Qfc,Q0
, (3.6)
an expression that has been widely used for different chambers and radiation sources(Zink and Wulff 2008, Gonzalez-Castano et al. 2009, Muir and Rogers 2010, Muir andRogers 2013, Erazo and Lallena 2013). The previous equation is based on the assumptionthat (W/e)air, the average energy lost per unit charge released by electrons stopped inair, is independent of the beam energy. According to Svensson and Brahme (1986) it mayvary 0.5 eV (1.5 %) with respect to 60Co, for electron energies ranging between 0 and 40MeV. This introduces an uncertainty in calculated kQ,Q0
of about 0.5 % (Muir and Rogers2013).
The aim of the present work is to calculate the correction factor kQ,Q0for seven Ex-
radin plane-parallel ionization chambers using the Monte Carlo radiation transport codepenelope (Salvat et al. 2011). Eight electron beams, of nominal energies between 6 and22 MeV, corresponding to a Varian Clinac 2100 C/D (Varian Medical Systems, Palo Alto,USA) are considered.
Sempau et al. (2004) found that the perturbation factors fc,Q obtained for the NACP-02, PPC-05 and PPC-40 ionization chambers coincide when they are irradiated with abeam generated with a complete linac head model and with a monoenergetic beam havingthe same R50. We check if this also occurs for the seven Exradin chambers under study.To do that, we consider several monoenergetic electron beams that reproduce the R50 ofthe Clinac beams mentioned. For comparison with the work of Sempau et al. (2004), thecorrection factor is also determined for the NACP-02 ionization chamber and the sameradiation sources. The effect of the irradiation field size is studied by comparing the resultsobtained for fields of 10 × 10 cm2 and 20 × 20 cm2. Finally, and taking advantage of thefact that some of the chambers under study share the same geometry, the effect of thedifferent materials conforming some of the elements of that geometries is also analyzed.
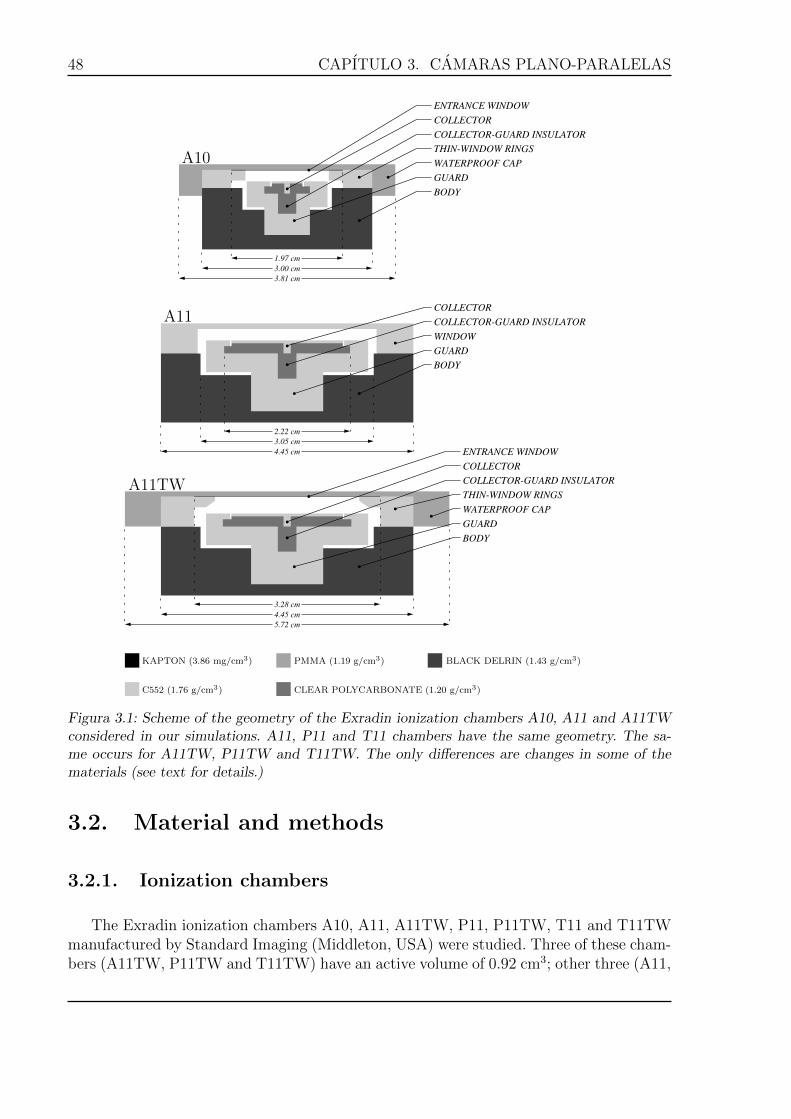
48 CAPITULO 3. CAMARAS PLANO-PARALELAS
ENTRANCE WINDOW
COLLECTOR
COLLECTOR-GUARD INSULATOR
THIN-WINDOW RINGS
WATERPROOF CAP
GUARD
BODY
1.97 cm
3.00 cm
3.81 cm
COLLECTOR
COLLECTOR-GUARD INSULATOR
WINDOW
GUARD
BODY
2.22 cm
3.05 cm
4.45 cm ENTRANCE WINDOW
COLLECTOR
COLLECTOR-GUARD INSULATOR
THIN-WINDOW RINGS
WATERPROOF CAP
GUARD
BODY
3.28 cm
4.45 cm
5.72 cm
A10
A11
A11TW
KAPTON (3.86 mg/cm3)
C552 (1.76 g/cm3)
PMMA (1.19 g/cm3)
CLEAR POLYCARBONATE (1.20 g/cm3)
BLACK DELRIN (1.43 g/cm3)
Figura 3.1: Scheme of the geometry of the Exradin ionization chambers A10, A11 and A11TWconsidered in our simulations. A11, P11 and T11 chambers have the same geometry. The sa-me occurs for A11TW, P11TW and T11TW. The only differences are changes in some of thematerials (see text for details.)
3.2. Material and methods
3.2.1. Ionization chambers
The Exradin ionization chambers A10, A11, A11TW, P11, P11TW, T11 and T11TWmanufactured by Standard Imaging (Middleton, USA) were studied. Three of these cham-bers (A11TW, P11TW and T11TW) have an active volume of 0.92 cm3; other three (A11,
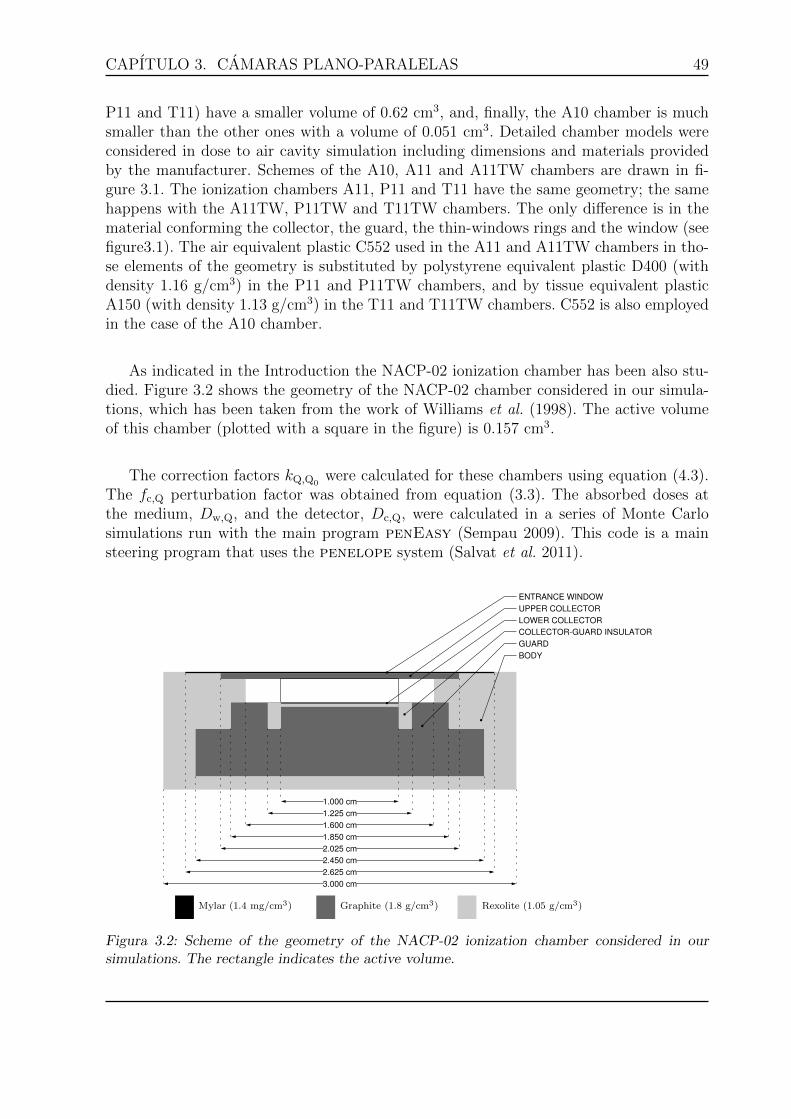
CAPITULO 3. CAMARAS PLANO-PARALELAS 49
P11 and T11) have a smaller volume of 0.62 cm3, and, finally, the A10 chamber is muchsmaller than the other ones with a volume of 0.051 cm3. Detailed chamber models wereconsidered in dose to air cavity simulation including dimensions and materials providedby the manufacturer. Schemes of the A10, A11 and A11TW chambers are drawn in fi-gure 3.1. The ionization chambers A11, P11 and T11 have the same geometry; the samehappens with the A11TW, P11TW and T11TW chambers. The only difference is in thematerial conforming the collector, the guard, the thin-windows rings and the window (seefigure3.1). The air equivalent plastic C552 used in the A11 and A11TW chambers in tho-se elements of the geometry is substituted by polystyrene equivalent plastic D400 (withdensity 1.16 g/cm3) in the P11 and P11TW chambers, and by tissue equivalent plasticA150 (with density 1.13 g/cm3) in the T11 and T11TW chambers. C552 is also employedin the case of the A10 chamber.
As indicated in the Introduction the NACP-02 ionization chamber has been also stu-died. Figure 3.2 shows the geometry of the NACP-02 chamber considered in our simula-tions, which has been taken from the work of Williams et al. (1998). The active volumeof this chamber (plotted with a square in the figure) is 0.157 cm3.
The correction factors kQ,Q0were calculated for these chambers using equation (4.3).
The fc,Q perturbation factor was obtained from equation (3.3). The absorbed doses atthe medium, Dw,Q, and the detector, Dc,Q, were calculated in a series of Monte Carlosimulations run with the main program penEasy (Sempau 2009). This code is a mainsteering program that uses the penelope system (Salvat et al. 2011).
3.000 cm
2.625 cm
2.450 cm
2.025 cm
1.850 cm
1.600 cm
1.225 cm
1.000 cm
ENTRANCE WINDOW
UPPER COLLECTOR
LOWER COLLECTOR
COLLECTOR-GUARD INSULATOR
GUARD
BODY
Mylar (1.4 mg/cm3) Graphite (1.8 g/cm3) Rexolite (1.05 g/cm3)
Figura 3.2: Scheme of the geometry of the NACP-02 ionization chamber considered in oursimulations. The rectangle indicates the active volume.
50 CAPITULO 3. CAMARAS PLANO-PARALELAS
3.2.2. Monte Carlo code penelope
penelope is a Monte Carlo general-purpose code that simulates the coupled transportof photons, electrons and positrons in matter, makes a good description of the particletransport trough the material interfaces and provides very good accuracy at low energies(Sempau et al. 2003, Faddegon et al. 2008, Faddegon et al. 2009, Salvat and Fernandez-Varea 2009, Vilches et al. 2009). The capabilities of the code when simulating ionizationchamber responses have been previously studied (Sempau and Andreo 2006,Yi et al. 2006).
Photons are transported within the conventional detailed method, in which all theinteraction events are described in sequential order. Electrons and positrons are simulatedusing a mixed scheme where collisions are classified into hard and soft. Hard collisions aresimulated, as photons, in a detailed way and are characterized by a polar deflection angle orenergy loss above user-selectable threshold values. All soft interactions occurring betweentwo consecutive hard collisions are described using a multiple scattering approximation.Electron and positron simulation is controlled by eight parameters: C1, C2, WCC, WCR,EABS(γ), EABS(e−), EABS(e+) and smax. C1 is linked to the average angular deflectionproduced by all soft interactions occurred along a path length equal to the mean free pathbetween consecutive hard elastic events. C2 is the maximum average fractional energy lossbetween consecutive hard elastic events. WCC and WCR are cut-off energy values for hardinelastic collisions and bremsstrahlung emission, respectively. When the kinetic energyof a given particle becomes smaller than its corresponding EABS, the simulation of thisparticle is stopped and the energy of the particle is deposited locally. Finally, smax is themaximum length permitted to a simulation step.
In our simulations, we have followed the prescription of Sempau and Andreo (2006)who studied in a very detailed way the optimal values of the penelope tracking pa-rameters to simulate the response of ionization chambers. Specifically we have usedC1 = C2 = 0.02 for all the materials forming the ionization chamber and a water vo-lume extending 2 cm around it. For the rest of the materials in the simulation geo-metry we have fixed C1 = C2 = 0.1. We have used EABS(e−) = EABS(e+) = 0.01Emax,EABS(γ) = 0.001Emax, with Emax the energy of the primary electrons at the source. Thevalues of the parameter smax have been fixed, as recommended in the code user manual(Salvat et al. 2011) to one tenth of the thickness of the corresponding material.
3.2.3. Radiation sources
We simulated the irradiation of the ionization chambers described above with beamsof a Varian Clinac 2100 C/D with nominal electron energies of 6, 9, 12, 15, 16, 18, 20 and22 MeV. The linac geometries were generated with the code penEasyLinac (Bruallaet al. 2009, Sempau et al. 2011). This is a code that generates the necessary input filesfor the simulation with penelope of most Varian linacs according to the Monte Carlopackage distributed by this company. The code requires as input the type of linac used,the irradiation mode (electron or photon), the nominal energy of the beam, the field size,and the type and position of additional collimation devices such as multileaf collimators
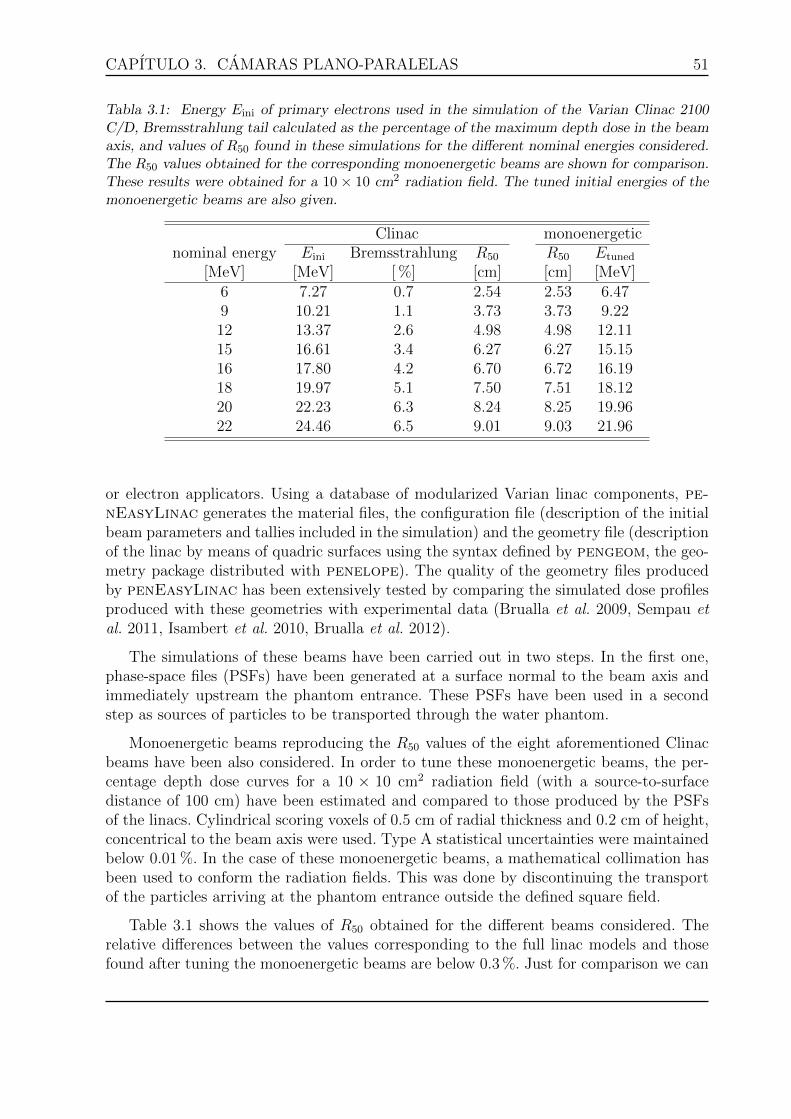
CAPITULO 3. CAMARAS PLANO-PARALELAS 51
Tabla 3.1: Energy Eini of primary electrons used in the simulation of the Varian Clinac 2100C/D, Bremsstrahlung tail calculated as the percentage of the maximum depth dose in the beamaxis, and values of R50 found in these simulations for the different nominal energies considered.The R50 values obtained for the corresponding monoenergetic beams are shown for comparison.These results were obtained for a 10 × 10 cm2 radiation field. The tuned initial energies of themonoenergetic beams are also given.
Clinac monoenergeticnominal energy Eini Bremsstrahlung R50 R50 Etuned
[MeV] [MeV] [ %] [cm] [cm] [MeV]6 7.27 0.7 2.54 2.53 6.479 10.21 1.1 3.73 3.73 9.2212 13.37 2.6 4.98 4.98 12.1115 16.61 3.4 6.27 6.27 15.1516 17.80 4.2 6.70 6.72 16.1918 19.97 5.1 7.50 7.51 18.1220 22.23 6.3 8.24 8.25 19.9622 24.46 6.5 9.01 9.03 21.96
or electron applicators. Using a database of modularized Varian linac components, pe-nEasyLinac generates the material files, the configuration file (description of the initialbeam parameters and tallies included in the simulation) and the geometry file (descriptionof the linac by means of quadric surfaces using the syntax defined by pengeom, the geo-metry package distributed with penelope). The quality of the geometry files producedby penEasyLinac has been extensively tested by comparing the simulated dose profilesproduced with these geometries with experimental data (Brualla et al. 2009, Sempau etal. 2011, Isambert et al. 2010, Brualla et al. 2012).
The simulations of these beams have been carried out in two steps. In the first one,phase-space files (PSFs) have been generated at a surface normal to the beam axis andimmediately upstream the phantom entrance. These PSFs have been used in a secondstep as sources of particles to be transported through the water phantom.
Monoenergetic beams reproducing the R50 values of the eight aforementioned Clinacbeams have been also considered. In order to tune these monoenergetic beams, the per-centage depth dose curves for a 10 × 10 cm2 radiation field (with a source-to-surfacedistance of 100 cm) have been estimated and compared to those produced by the PSFsof the linacs. Cylindrical scoring voxels of 0.5 cm of radial thickness and 0.2 cm of height,concentrical to the beam axis were used. Type A statistical uncertainties were maintainedbelow 0.01 %. In the case of these monoenergetic beams, a mathematical collimation hasbeen used to conform the radiation fields. This was done by discontinuing the transportof the particles arriving at the phantom entrance outside the defined square field.
Table 3.1 shows the values of R50 obtained for the different beams considered. Therelative differences between the values corresponding to the full linac models and thosefound after tuning the monoenergetic beams are below 0.3 %. Just for comparison we can
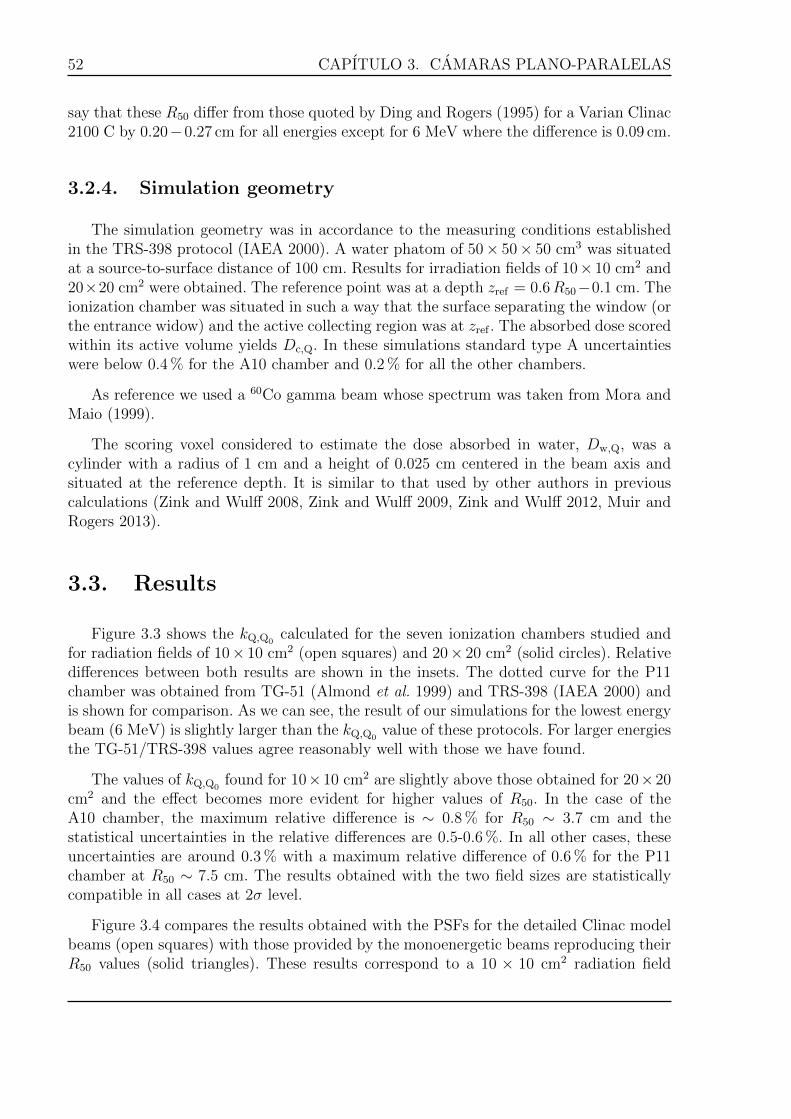
52 CAPITULO 3. CAMARAS PLANO-PARALELAS
say that these R50 differ from those quoted by Ding and Rogers (1995) for a Varian Clinac2100 C by 0.20−0.27 cm for all energies except for 6 MeV where the difference is 0.09 cm.
3.2.4. Simulation geometry
The simulation geometry was in accordance to the measuring conditions establishedin the TRS-398 protocol (IAEA 2000). A water phatom of 50× 50× 50 cm3 was situatedat a source-to-surface distance of 100 cm. Results for irradiation fields of 10× 10 cm2 and20×20 cm2 were obtained. The reference point was at a depth zref = 0.6R50−0.1 cm. Theionization chamber was situated in such a way that the surface separating the window (orthe entrance widow) and the active collecting region was at zref . The absorbed dose scoredwithin its active volume yields Dc,Q. In these simulations standard type A uncertaintieswere below 0.4 % for the A10 chamber and 0.2 % for all the other chambers.
As reference we used a 60Co gamma beam whose spectrum was taken from Mora andMaio (1999).
The scoring voxel considered to estimate the dose absorbed in water, Dw,Q, was acylinder with a radius of 1 cm and a height of 0.025 cm centered in the beam axis andsituated at the reference depth. It is similar to that used by other authors in previouscalculations (Zink and Wulff 2008, Zink and Wulff 2009, Zink and Wulff 2012, Muir andRogers 2013).
3.3. Results
Figure 3.3 shows the kQ,Q0calculated for the seven ionization chambers studied and
for radiation fields of 10× 10 cm2 (open squares) and 20× 20 cm2 (solid circles). Relativedifferences between both results are shown in the insets. The dotted curve for the P11chamber was obtained from TG-51 (Almond et al. 1999) and TRS-398 (IAEA 2000) andis shown for comparison. As we can see, the result of our simulations for the lowest energybeam (6 MeV) is slightly larger than the kQ,Q0
value of these protocols. For larger energiesthe TG-51/TRS-398 values agree reasonably well with those we have found.
The values of kQ,Q0found for 10×10 cm2 are slightly above those obtained for 20×20
cm2 and the effect becomes more evident for higher values of R50. In the case of theA10 chamber, the maximum relative difference is ∼ 0.8 % for R50 ∼ 3.7 cm and thestatistical uncertainties in the relative differences are 0.5-0.6 %. In all other cases, theseuncertainties are around 0.3 % with a maximum relative difference of 0.6 % for the P11chamber at R50 ∼ 7.5 cm. The results obtained with the two field sizes are statisticallycompatible in all cases at 2σ level.
Figure 3.4 compares the results obtained with the PSFs for the detailed Clinac modelbeams (open squares) with those provided by the monoenergetic beams reproducing theirR50 values (solid triangles). These results correspond to a 10 × 10 cm2 radiation field
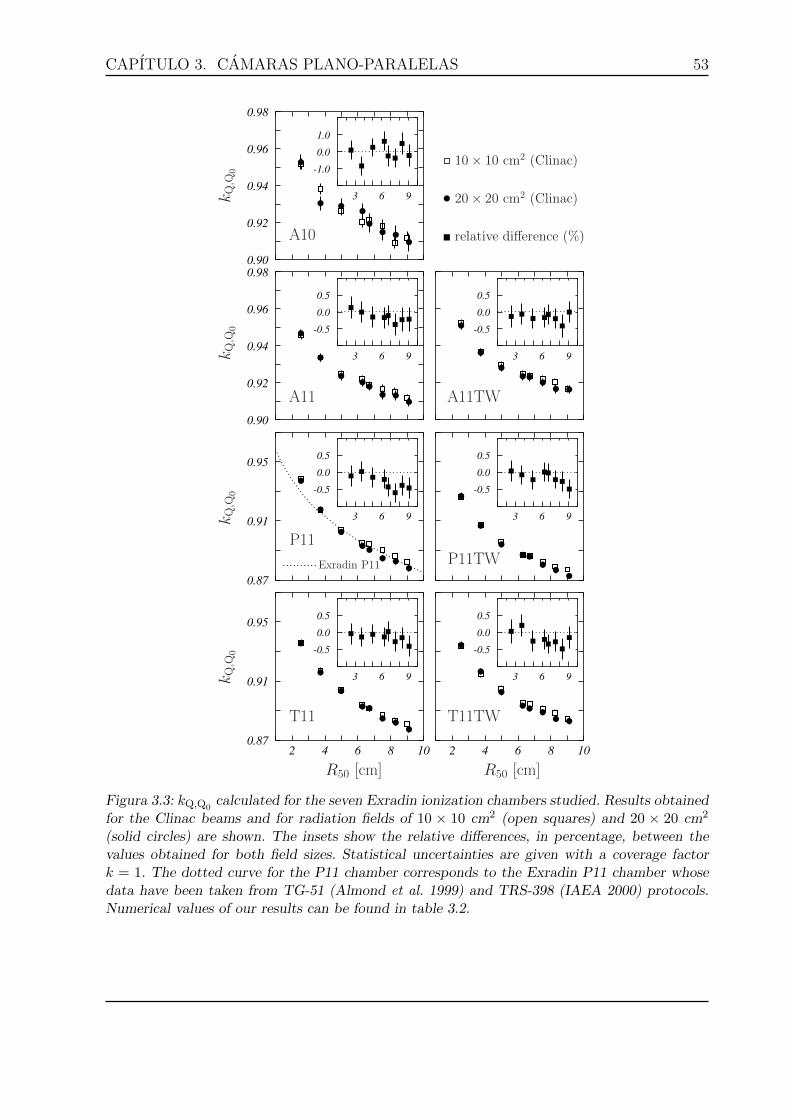
CAPITULO 3. CAMARAS PLANO-PARALELAS 53
0.90
0.92
0.94
0.96
0.98
3 6 9
-1.0
0.0
1.0
0.90
0.92
0.94
0.96
0.98
3 6 9
-0.5
0.0
0.5
3 6 9
-0.5
0.0
0.5
0.87
0.91
0.95
3 6 9
-0.5
0.0
0.5
3 6 9
-0.5
0.0
0.5
2 4 6 8 100.87
0.91
0.95
3 6 9
-0.5
0.0
0.5
2 4 6 8 10
3 6 9
-0.5
0.0
0.5
R50 [cm] R50 [cm]
A10
A11
P11
T11
A11TW
P11TW
T11TW
kQ,Q
0kQ,Q
0kQ,Q
0kQ,Q
0
Exradin P11
10× 10 cm2 (Clinac)
20× 20 cm2 (Clinac)
relative difference (%)
Figura 3.3: kQ,Q0calculated for the seven Exradin ionization chambers studied. Results obtained
for the Clinac beams and for radiation fields of 10 × 10 cm2 (open squares) and 20 × 20 cm2
(solid circles) are shown. The insets show the relative differences, in percentage, between thevalues obtained for both field sizes. Statistical uncertainties are given with a coverage factork = 1. The dotted curve for the P11 chamber corresponds to the Exradin P11 chamber whosedata have been taken from TG-51 (Almond et al. 1999) and TRS-398 (IAEA 2000) protocols.Numerical values of our results can be found in table 3.2.
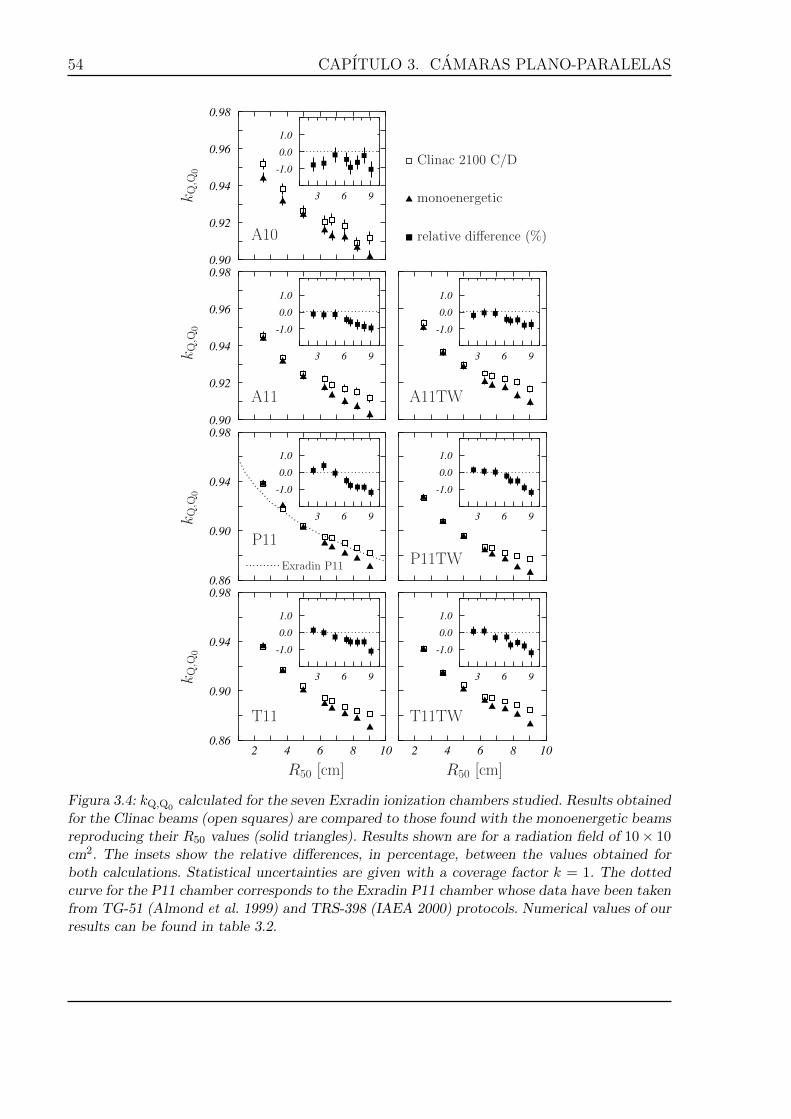
54 CAPITULO 3. CAMARAS PLANO-PARALELAS
0.90
0.92
0.94
0.96
0.98
3 6 9
-1.0
0.0
1.0
0.90
0.92
0.94
0.96
0.98
3 6 9
-1.0
0.0
1.0
3 6 9
-1.0
0.0
1.0
0.86
0.90
0.94
0.98
3 6 9
-1.0
0.0
1.0
3 6 9
-1.0
0.0
1.0
2 4 6 8 100.86
0.90
0.94
0.98
3 6 9
-1.0
0.0
1.0
2 4 6 8 10
3 6 9
-1.0
0.0
1.0
R50 [cm] R50 [cm]
A10
A11
P11
T11
A11TW
P11TW
T11TW
kQ,Q
0kQ,Q
0kQ,Q
0kQ,Q
0
Exradin P11
Clinac 2100 C/D
monoenergetic
relative difference (%)
Figura 3.4: kQ,Q0calculated for the seven Exradin ionization chambers studied. Results obtained
for the Clinac beams (open squares) are compared to those found with the monoenergetic beamsreproducing their R50 values (solid triangles). Results shown are for a radiation field of 10× 10cm2. The insets show the relative differences, in percentage, between the values obtained forboth calculations. Statistical uncertainties are given with a coverage factor k = 1. The dottedcurve for the P11 chamber corresponds to the Exradin P11 chamber whose data have been takenfrom TG-51 (Almond et al. 1999) and TRS-398 (IAEA 2000) protocols. Numerical values of ourresults can be found in table 3.2.
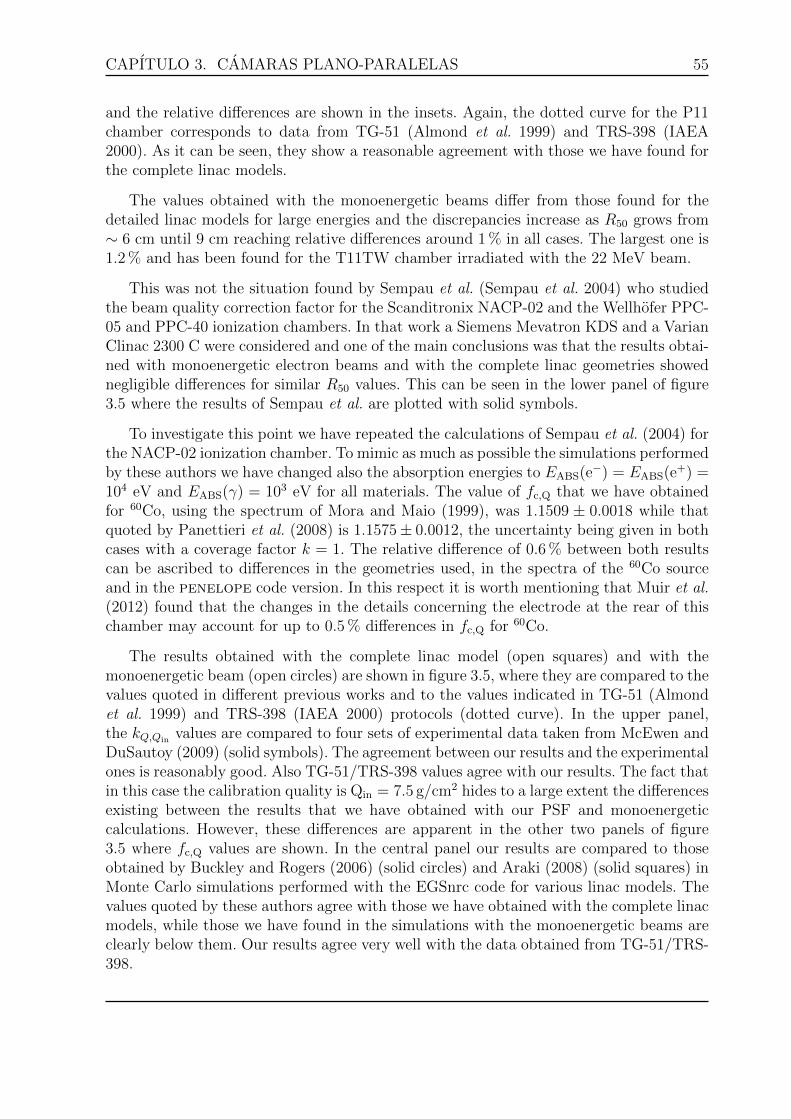
CAPITULO 3. CAMARAS PLANO-PARALELAS 55
and the relative differences are shown in the insets. Again, the dotted curve for the P11chamber corresponds to data from TG-51 (Almond et al. 1999) and TRS-398 (IAEA2000). As it can be seen, they show a reasonable agreement with those we have found forthe complete linac models.
The values obtained with the monoenergetic beams differ from those found for thedetailed linac models for large energies and the discrepancies increase as R50 grows from∼ 6 cm until 9 cm reaching relative differences around 1 % in all cases. The largest one is1.2 % and has been found for the T11TW chamber irradiated with the 22 MeV beam.
This was not the situation found by Sempau et al. (Sempau et al. 2004) who studiedthe beam quality correction factor for the Scanditronix NACP-02 and the Wellhofer PPC-05 and PPC-40 ionization chambers. In that work a Siemens Mevatron KDS and a VarianClinac 2300 C were considered and one of the main conclusions was that the results obtai-ned with monoenergetic electron beams and with the complete linac geometries showednegligible differences for similar R50 values. This can be seen in the lower panel of figure3.5 where the results of Sempau et al. are plotted with solid symbols.
To investigate this point we have repeated the calculations of Sempau et al. (2004) forthe NACP-02 ionization chamber. To mimic as much as possible the simulations performedby these authors we have changed also the absorption energies to EABS(e−) = EABS(e+) =104 eV and EABS(γ) = 103 eV for all materials. The value of fc,Q that we have obtainedfor 60Co, using the spectrum of Mora and Maio (1999), was 1.1509 ± 0.0018 while thatquoted by Panettieri et al. (2008) is 1.1575 ± 0.0012, the uncertainty being given in bothcases with a coverage factor k = 1. The relative difference of 0.6 % between both resultscan be ascribed to differences in the geometries used, in the spectra of the 60Co sourceand in the penelope code version. In this respect it is worth mentioning that Muir et al.(2012) found that the changes in the details concerning the electrode at the rear of thischamber may account for up to 0.5 % differences in fc,Q for 60Co.
The results obtained with the complete linac model (open squares) and with themonoenergetic beam (open circles) are shown in figure 3.5, where they are compared to thevalues quoted in different previous works and to the values indicated in TG-51 (Almondet al. 1999) and TRS-398 (IAEA 2000) protocols (dotted curve). In the upper panel,the kQ,Qin
values are compared to four sets of experimental data taken from McEwen andDuSautoy (2009) (solid symbols). The agreement between our results and the experimentalones is reasonably good. Also TG-51/TRS-398 values agree with our results. The fact thatin this case the calibration quality is Qin = 7.5 g/cm2 hides to a large extent the differencesexisting between the results that we have obtained with our PSF and monoenergeticcalculations. However, these differences are apparent in the other two panels of figure3.5 where fc,Q values are shown. In the central panel our results are compared to thoseobtained by Buckley and Rogers (2006) (solid circles) and Araki (2008) (solid squares) inMonte Carlo simulations performed with the EGSnrc code for various linac models. Thevalues quoted by these authors agree with those we have obtained with the complete linacmodels, while those we have found in the simulations with the monoenergetic beams areclearly below them. Our results agree very well with the data obtained from TG-51/TRS-398.
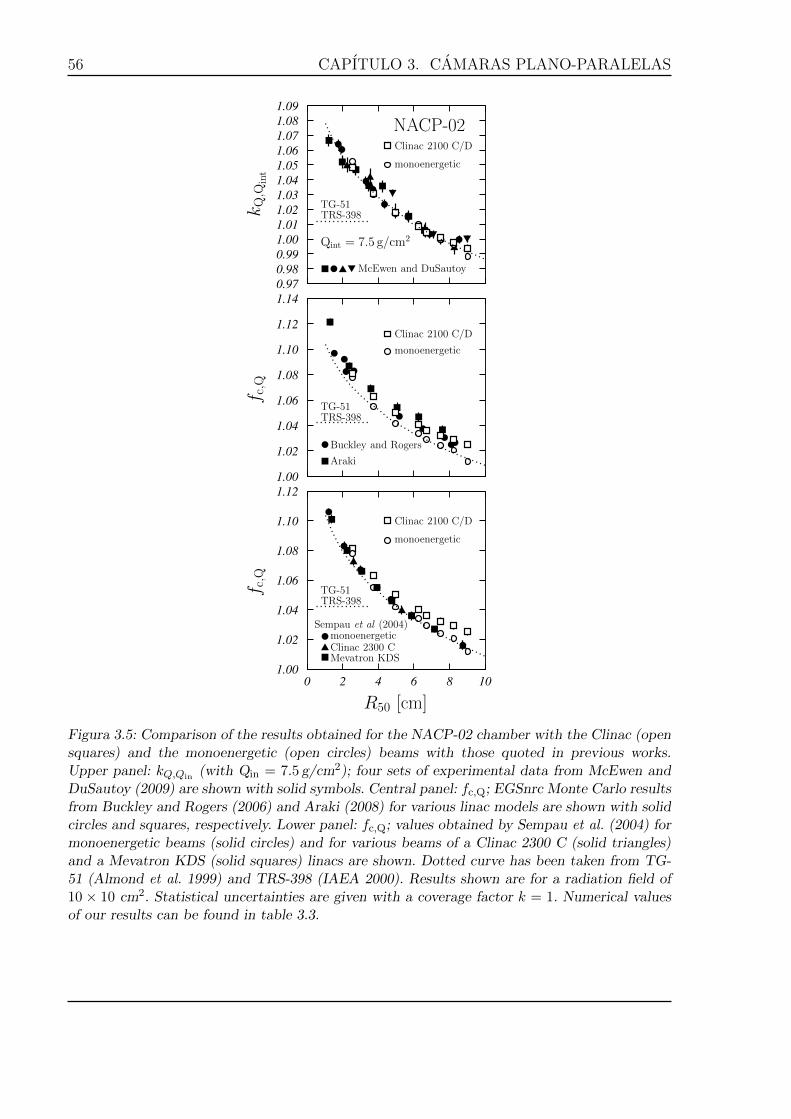
56 CAPITULO 3. CAMARAS PLANO-PARALELAS
0.97
0.98
0.99
1.00
1.01
1.02
1.03
1.04
1.05
1.06
1.07
1.08
1.09
1.00
1.02
1.04
1.06
1.08
1.10
1.12
1.14
0 2 4 6 8 10
1.00
1.02
1.04
1.06
1.08
1.10
1.12
NACP-02
R50 [cm]
f c,Q
f c,Q
kQ,Q
int
Qint = 7.5 g/cm2
McEwen and DuSautoy
TRS-398TG-51
Clinac 2100 C/D
monoenergetic
Araki
Buckley and Rogers
TG-51TRS-398
Clinac 2100 C/D
monoenergetic
monoenergeticClinac 2300 CMevatron KDS
Sempau et al (2004)
TRS-398TG-51
Clinac 2100 C/D
monoenergetic
Figura 3.5: Comparison of the results obtained for the NACP-02 chamber with the Clinac (opensquares) and the monoenergetic (open circles) beams with those quoted in previous works.Upper panel: kQ,Qin (with Qin = 7.5 g/cm2); four sets of experimental data from McEwen andDuSautoy (2009) are shown with solid symbols. Central panel: fc,Q; EGSnrc Monte Carlo resultsfrom Buckley and Rogers (2006) and Araki (2008) for various linac models are shown with solidcircles and squares, respectively. Lower panel: fc,Q; values obtained by Sempau et al. (2004) formonoenergetic beams (solid circles) and for various beams of a Clinac 2300 C (solid triangles)and a Mevatron KDS (solid squares) linacs are shown. Dotted curve has been taken from TG-51 (Almond et al. 1999) and TRS-398 (IAEA 2000). Results shown are for a radiation field of10 × 10 cm2. Statistical uncertainties are given with a coverage factor k = 1. Numerical valuesof our results can be found in table 3.3.
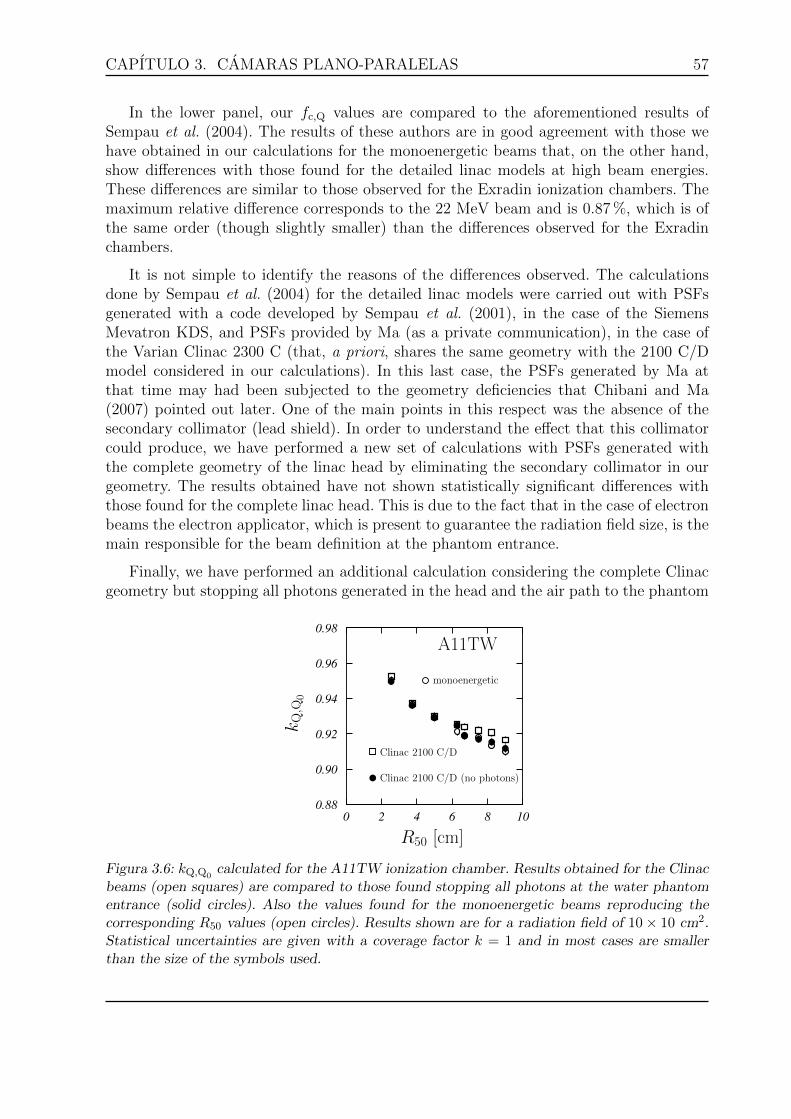
CAPITULO 3. CAMARAS PLANO-PARALELAS 57
In the lower panel, our fc,Q values are compared to the aforementioned results ofSempau et al. (2004). The results of these authors are in good agreement with those wehave obtained in our calculations for the monoenergetic beams that, on the other hand,show differences with those found for the detailed linac models at high beam energies.These differences are similar to those observed for the Exradin ionization chambers. Themaximum relative difference corresponds to the 22 MeV beam and is 0.87 %, which is ofthe same order (though slightly smaller) than the differences observed for the Exradinchambers.
It is not simple to identify the reasons of the differences observed. The calculationsdone by Sempau et al. (2004) for the detailed linac models were carried out with PSFsgenerated with a code developed by Sempau et al. (2001), in the case of the SiemensMevatron KDS, and PSFs provided by Ma (as a private communication), in the case ofthe Varian Clinac 2300 C (that, a priori, shares the same geometry with the 2100 C/Dmodel considered in our calculations). In this last case, the PSFs generated by Ma atthat time may had been subjected to the geometry deficiencies that Chibani and Ma(2007) pointed out later. One of the main points in this respect was the absence of thesecondary collimator (lead shield). In order to understand the effect that this collimatorcould produce, we have performed a new set of calculations with PSFs generated withthe complete geometry of the linac head by eliminating the secondary collimator in ourgeometry. The results obtained have not shown statistically significant differences withthose found for the complete linac head. This is due to the fact that in the case of electronbeams the electron applicator, which is present to guarantee the radiation field size, is themain responsible for the beam definition at the phantom entrance.
Finally, we have performed an additional calculation considering the complete Clinacgeometry but stopping all photons generated in the head and the air path to the phantom
0 2 4 6 8 10
0.88
0.90
0.92
0.94
0.96
0.98
A11TW
R50 [cm]
kQ,Q
0
Clinac 2100 C/D
Clinac 2100 C/D (no photons)
monoenergetic
Figura 3.6: kQ,Q0calculated for the A11TW ionization chamber. Results obtained for the Clinac
beams (open squares) are compared to those found stopping all photons at the water phantomentrance (solid circles). Also the values found for the monoenergetic beams reproducing thecorresponding R50 values (open circles). Results shown are for a radiation field of 10× 10 cm2.Statistical uncertainties are given with a coverage factor k = 1 and in most cases are smallerthan the size of the symbols used.

58 CAPITULO 3. CAMARAS PLANO-PARALELAS
at its entrance. The results obtained in this “incomplete” simulation are shown for theA11TW ionization chamber in figure 3.6 (solid circles). It is observed how these resultsare close to those found for the mononergetic beams (open circles) and differ significantlyat large energies from those found with the complete linac geometries (open squares).This indicates that a large part of the differences observed between the kQ,Q0
obtainedfor the detailed linac models and for the monoenergetic beams are due to the presence ofthe photons produced as secondary particles in the various elements of the linac geometryas well as in the air path between the linac head and the phantom surface. This is notsurprising because, as quoted in table 3.1 the contribution of the Bremsstrahlung tail isnot negligible and grows with the energy of the beam. Muir and Rogers (2013) founda similar effect in the PTW Roos ionization chamber for R50 ≤ 7 cm. The reason forthis behavior may be linked to the increase of the stopping-power ratios (up to ∼ 0.5 %,depending on the particular linac considered) due to contaminant photons (Ding et al.1995). It is worth mentioning that these results disagree with the findings of Sempau etal. (2004) who stated that for the Siemens Mevatron at 18 MeV there was no differencebetween the kQ,Qint
calculated with and without considering the photons present in thePSF.
The fact that some of the chambers studied share the same geometry, with changesin the material conforming some of their constituent elements, has permitted us to studythe effect that these material changes produce in the quality correction factor. In figure3.7 we show the ratios of kQ,Q0
values obtained for couples of chambers, specifically “A”and “P” (upper panel), “A” and “T” (central panel) and “P” and “T” (lower panel).Circles correspond to the “TW” chamber type and squares to the other ones. Finally,open symbols show the results obtained for the various Clinac qualities whereas solidsymbols correspond to the monoenergetic beams.
A first point to note is the overall agreement between the results obtained with theClinac PSFs and the monoenergetic beams. The discrepancies observed at the largerenergies in figure 3.4 disappear, showing that the effect of the change of material is thesame independently of the radiation source considered.
The new materials used in the “P” and “T” chambers instead of the C552 (used inthe “A” chambers), D400 and A150, respectively, have similar densities (1.16 g/cm3 and1.13 g/cm3). However, the material change does not affect in the same way the responseof the “P” and “T” chambers as it can be seen in the two upper panels of figure 3.7. Thecorresponding differences are summarized in the lower panel of this figure. Therein it isseen that the ratio of the kQ,Q0
values obtained for the P11TW and T11TW chambersremains almost constant and close to 1 for all beam qualities considered. The ratio for theP11 and T11 chambers is also approximately constant but ∼ 1 % smaller. Looking at thechamber geometries in figure 3.1, we see that the main difference between A11 (P11 andT11) chambers and the “TW” partners is the presence of the thin-window support ringsthat produces a notable modification of the geometry structure. There is also a differencein the active volume of the chambers (see Sect. 3.2.1). Finally, though the densities aresimilar, the material compositions are different: D100 is CH, A150 has, apart from C andH, a non-negligible quantity of both N and O and a small quantity of F and Ca, and C552is basically H, C and F in similar quantity plus small parts of O and Si. The combined
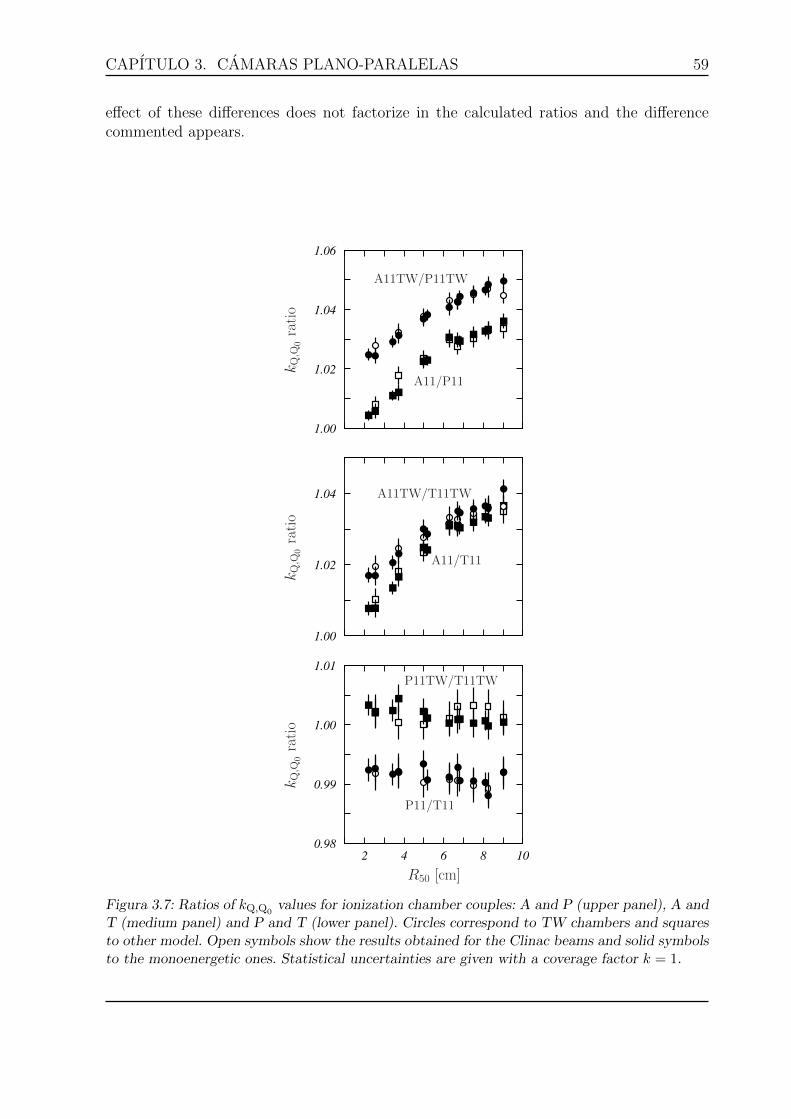
CAPITULO 3. CAMARAS PLANO-PARALELAS 59
effect of these differences does not factorize in the calculated ratios and the differencecommented appears.
1.00
1.02
1.04
1.06
1.00
1.02
1.04
2 4 6 8 10
0.98
0.99
1.00
1.01
R50 [cm]
A11/P11
A11TW/P11TW
A11/T11
A11TW/T11TW
P11/T11
P11TW/T11TW
kQ,Q
0ratio
kQ,Q
0ratio
kQ,Q
0ratio
Figura 3.7: Ratios of kQ,Q0values for ionization chamber couples: A and P (upper panel), A and
T (medium panel) and P and T (lower panel). Circles correspond to TW chambers and squaresto other model. Open symbols show the results obtained for the Clinac beams and solid symbolsto the monoenergetic ones. Statistical uncertainties are given with a coverage factor k = 1.
60 CAPITULO 3. CAMARAS PLANO-PARALELAS
3.4. Conclusions
In this work, the Monte Carlo code penelope/penEasy was used to calculate thebeam quality correction factor, kQ,Q0 for seven Exradin ionization chambers. Electronbeams, with nominal electron energies ranging between 6 and 22 MeV, were simulatedfor a Varian Clinac 2100 C/D using geometries generated with the penEasyLinac code.Those simulations tallied PSFs at the phantom surface. In a second step of the calculation,these PSFs were transported through the phantom to calculate the absorbed dose inwater and in the air cavity of the real detector that permitted to determine the overallperturbation factor fc,Q and the corresponding kQ,Q0
. These factors were also calculatedfor monoenergetic beams that reproduced the R50 quality index of the Varian beams.
No differences in the correction factor were found when a different radiation field sizeis considered. In fact, the results obtained for a 10 × 10 cm2 and a 20 × 20 cm2 werestatistically compatible.
For the lower energy beams, below 12 MeV, the values of kQ,Q0determined for both
the Clinac and the monoenergetic beams were in agreement, as quoted in previous works.However, with increasing energies, the values found for the electron beams producedfrom linacs were ∼ 1 % above those obtained with the monoenergetic beams, somethingthat was not observed in a previous work in which the agreement between both types ofcalculations was excellent. It has been proved that a major part of this discrepancy canbe ascribed to the secondary photons produced in the geometry elements of the linacs aswell as in the air path between the linac head and the phantom.
The use of the D400 and A150 plastics instead of the C552 in some of the chambersanalyzed gives rise to modifications of the quality correction factor that depend on thespecific geometry of the chamber.
Acknowledgements
This work has been supported in part by the Junta de Andalucıa (FQM0220) and bythe Ministerio de Economıa y Competitividad (FPA2012-31993 and FIS2012-38480) andthe European Regional Development Fund (ERDF). LB acknowledges financial supportfrom the Deutsche Forschungsgemeinschaft project BR 4043/1-1.
Appendix
In this appendix we summarize the values of the kQ,Q0factors obtained in our simu-
lations and corresponding to the Standard Imaging Exradin ionization chambers, as wellas those of the NACP-02 chamber.
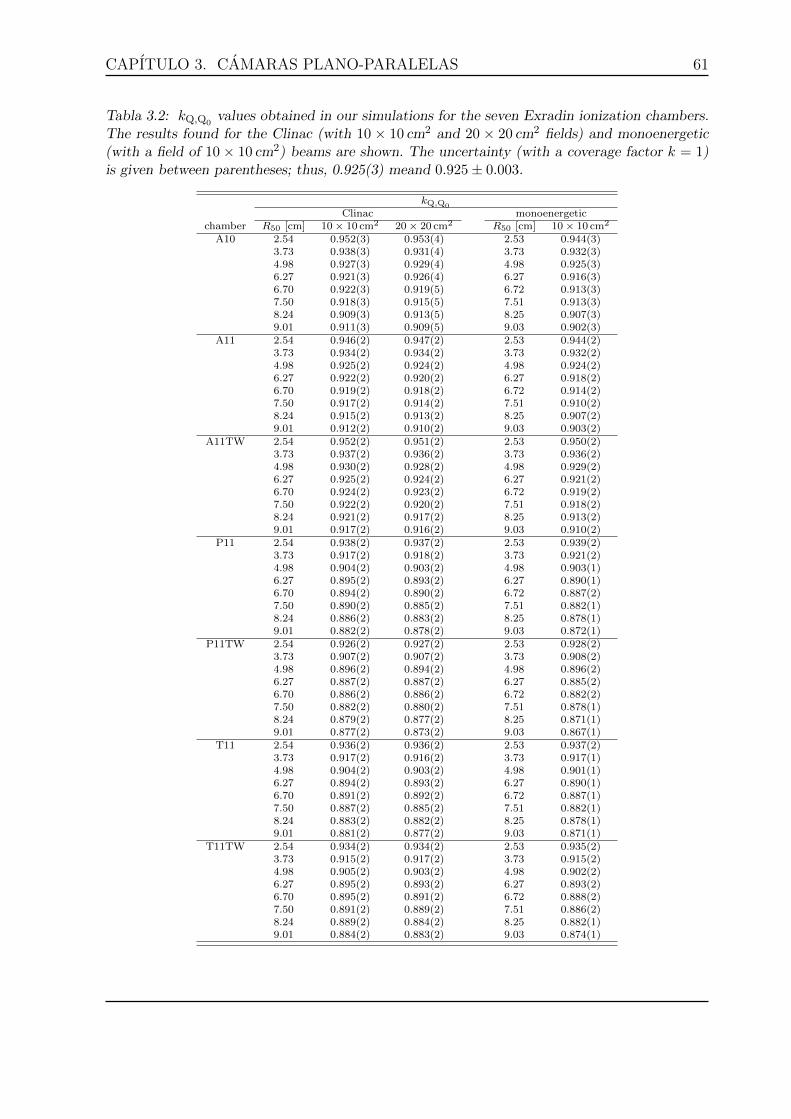
CAPITULO 3. CAMARAS PLANO-PARALELAS 61
Tabla 3.2: kQ,Q0values obtained in our simulations for the seven Exradin ionization chambers.
The results found for the Clinac (with 10 × 10 cm2 and 20 × 20 cm2 fields) and monoenergetic(with a field of 10 × 10 cm2) beams are shown. The uncertainty (with a coverage factor k = 1)is given between parentheses; thus, 0.925(3) meand 0.925± 0.003.
kQ,Q0
Clinac monoenergeticchamber R50 [cm] 10× 10 cm2 20× 20 cm2 R50 [cm] 10× 10 cm2
A10 2.54 0.952(3) 0.953(4) 2.53 0.944(3)3.73 0.938(3) 0.931(4) 3.73 0.932(3)4.98 0.927(3) 0.929(4) 4.98 0.925(3)6.27 0.921(3) 0.926(4) 6.27 0.916(3)6.70 0.922(3) 0.919(5) 6.72 0.913(3)7.50 0.918(3) 0.915(5) 7.51 0.913(3)8.24 0.909(3) 0.913(5) 8.25 0.907(3)9.01 0.911(3) 0.909(5) 9.03 0.902(3)
A11 2.54 0.946(2) 0.947(2) 2.53 0.944(2)3.73 0.934(2) 0.934(2) 3.73 0.932(2)4.98 0.925(2) 0.924(2) 4.98 0.924(2)6.27 0.922(2) 0.920(2) 6.27 0.918(2)6.70 0.919(2) 0.918(2) 6.72 0.914(2)7.50 0.917(2) 0.914(2) 7.51 0.910(2)8.24 0.915(2) 0.913(2) 8.25 0.907(2)9.01 0.912(2) 0.910(2) 9.03 0.903(2)
A11TW 2.54 0.952(2) 0.951(2) 2.53 0.950(2)3.73 0.937(2) 0.936(2) 3.73 0.936(2)4.98 0.930(2) 0.928(2) 4.98 0.929(2)6.27 0.925(2) 0.924(2) 6.27 0.921(2)6.70 0.924(2) 0.923(2) 6.72 0.919(2)7.50 0.922(2) 0.920(2) 7.51 0.918(2)8.24 0.921(2) 0.917(2) 8.25 0.913(2)9.01 0.917(2) 0.916(2) 9.03 0.910(2)
P11 2.54 0.938(2) 0.937(2) 2.53 0.939(2)3.73 0.917(2) 0.918(2) 3.73 0.921(2)4.98 0.904(2) 0.903(2) 4.98 0.903(1)6.27 0.895(2) 0.893(2) 6.27 0.890(1)6.70 0.894(2) 0.890(2) 6.72 0.887(2)7.50 0.890(2) 0.885(2) 7.51 0.882(1)8.24 0.886(2) 0.883(2) 8.25 0.878(1)9.01 0.882(2) 0.878(2) 9.03 0.872(1)
P11TW 2.54 0.926(2) 0.927(2) 2.53 0.928(2)3.73 0.907(2) 0.907(2) 3.73 0.908(2)4.98 0.896(2) 0.894(2) 4.98 0.896(2)6.27 0.887(2) 0.887(2) 6.27 0.885(2)6.70 0.886(2) 0.886(2) 6.72 0.882(2)7.50 0.882(2) 0.880(2) 7.51 0.878(1)8.24 0.879(2) 0.877(2) 8.25 0.871(1)9.01 0.877(2) 0.873(2) 9.03 0.867(1)
T11 2.54 0.936(2) 0.936(2) 2.53 0.937(2)3.73 0.917(2) 0.916(2) 3.73 0.917(1)4.98 0.904(2) 0.903(2) 4.98 0.901(1)6.27 0.894(2) 0.893(2) 6.27 0.890(1)6.70 0.891(2) 0.892(2) 6.72 0.887(1)7.50 0.887(2) 0.885(2) 7.51 0.882(1)8.24 0.883(2) 0.882(2) 8.25 0.878(1)9.01 0.881(2) 0.877(2) 9.03 0.871(1)
T11TW 2.54 0.934(2) 0.934(2) 2.53 0.935(2)3.73 0.915(2) 0.917(2) 3.73 0.915(2)4.98 0.905(2) 0.903(2) 4.98 0.902(2)6.27 0.895(2) 0.893(2) 6.27 0.893(2)6.70 0.895(2) 0.891(2) 6.72 0.888(2)7.50 0.891(2) 0.889(2) 7.51 0.886(2)8.24 0.889(2) 0.884(2) 8.25 0.882(1)9.01 0.884(2) 0.883(2) 9.03 0.874(1)
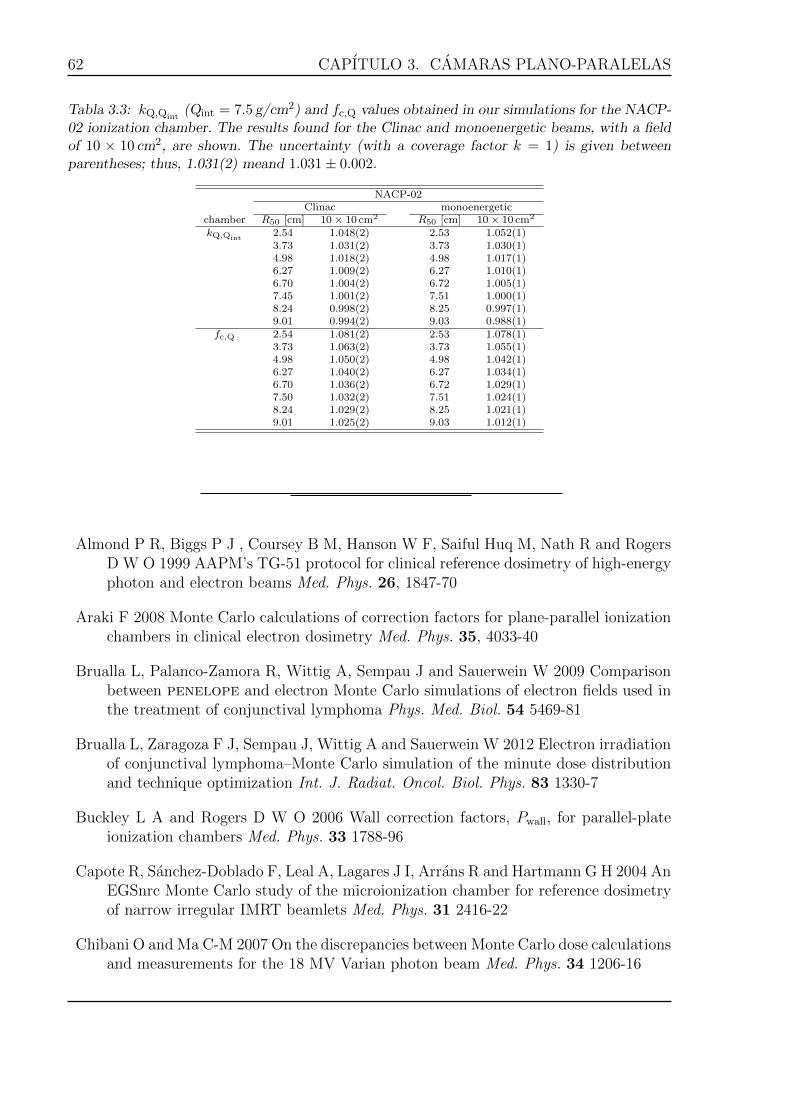
62 CAPITULO 3. CAMARAS PLANO-PARALELAS
Tabla 3.3: kQ,Qint(Qint = 7.5 g/cm2) and fc,Q values obtained in our simulations for the NACP-
02 ionization chamber. The results found for the Clinac and monoenergetic beams, with a fieldof 10 × 10 cm2, are shown. The uncertainty (with a coverage factor k = 1) is given betweenparentheses; thus, 1.031(2) meand 1.031± 0.002.
NACP-02Clinac monoenergetic
chamber R50 [cm] 10× 10 cm2 R50 [cm] 10× 10 cm2
kQ,Qint2.54 1.048(2) 2.53 1.052(1)3.73 1.031(2) 3.73 1.030(1)4.98 1.018(2) 4.98 1.017(1)6.27 1.009(2) 6.27 1.010(1)6.70 1.004(2) 6.72 1.005(1)7.45 1.001(2) 7.51 1.000(1)8.24 0.998(2) 8.25 0.997(1)9.01 0.994(2) 9.03 0.988(1)
fc,Q 2.54 1.081(2) 2.53 1.078(1)3.73 1.063(2) 3.73 1.055(1)4.98 1.050(2) 4.98 1.042(1)6.27 1.040(2) 6.27 1.034(1)6.70 1.036(2) 6.72 1.029(1)7.50 1.032(2) 7.51 1.024(1)8.24 1.029(2) 8.25 1.021(1)9.01 1.025(2) 9.03 1.012(1)
Almond P R, Biggs P J , Coursey B M, Hanson W F, Saiful Huq M, Nath R and RogersD W O 1999 AAPM’s TG-51 protocol for clinical reference dosimetry of high-energyphoton and electron beams Med. Phys. 26, 1847-70
Araki F 2008 Monte Carlo calculations of correction factors for plane-parallel ionizationchambers in clinical electron dosimetry Med. Phys. 35, 4033-40
Brualla L, Palanco-Zamora R, Wittig A, Sempau J and Sauerwein W 2009 Comparisonbetween penelope and electron Monte Carlo simulations of electron fields used inthe treatment of conjunctival lymphoma Phys. Med. Biol. 54 5469-81
Brualla L, Zaragoza F J, Sempau J, Wittig A and Sauerwein W 2012 Electron irradiationof conjunctival lymphoma–Monte Carlo simulation of the minute dose distributionand technique optimization Int. J. Radiat. Oncol. Biol. Phys. 83 1330-7
Buckley L A and Rogers D W O 2006 Wall correction factors, Pwall, for parallel-plateionization chambers Med. Phys. 33 1788-96
Capote R, Sanchez-Doblado F, Leal A, Lagares J I, Arrans R and Hartmann G H 2004 AnEGSnrc Monte Carlo study of the microionization chamber for reference dosimetryof narrow irregular IMRT beamlets Med. Phys. 31 2416-22
Chibani O and Ma C-M 2007 On the discrepancies between Monte Carlo dose calculationsand measurements for the 18 MV Varian photon beam Med. Phys. 34 1206-16
CAPITULO 3. CAMARAS PLANO-PARALELAS 63
Ding G X and Rogers D W O 1995 Energy spectra, angular spread, and dose distributionsof electron beams from various accelerators used in radiotherapy, NRC Report PIRS0439 (Ottawa:NRC)
Ding G X, Rogers D W O and Mackie T R 1995 Calculation of stopping-power ratiosusing realistic clinical electron beams Med. Phys. 22 489-501
Erazo F and Lallena A M 2013 Calculation of beam quality correction factors for va-rious thimble ionization chambers using the Monte Carlo code PENELOPE PhysicaMedica: Eur. J. Med. Phys. 29, 163-70
Faddegon B A, Asai M, Perl J, Ross C, Sempau J, Tinslay J and Salvat F 2008 Benchmar-king of Monte Carlo simulation of bremsstrahlung from thick targets at radiotherapyenergies Med. Phys. 35 4308-17
Faddegon B A, Kawrakow I, Kubyshin Y, Perl J, Sempau J and Urban L 2009 Theaccuracy of EGSnrc, Geant4 and penelope Monte Carlo systems for the simulationof electron scatter in external beam radiotherapy Phys. Med. Biol. 54 6151-63
Fernandez-Varea J M, Carrasco P, Panettieri V and Brualla L 2007 Monte Carlo basedwater/medium stopping-power ratios for various ICRP and ICRU tissues Phys. Med.Biol. 52 6475-83
Gonzalez-Castano D M, Hartmann G H, Sanchez-Doblado F, Gomez F, Kapsch R-P,Pena J and Capote R 2009 The determination of beam quality correction factors:Monte Carlo simulations and measurements Phys. Med. Biol. 54, 4723-41
International Atomic Energy Agency 2000 Absorbed dose determination in externalbeam radiotherapy: an International Code of Practice for dosimetry based on stan-dards of absorbed dose to water IAEA Technical Report Series 398 (Vienna:IAEA)
Isambert A, Brualla L, Benkebil M and Lefkopoulos D 2010 Determination of the op-timal statistical uncertainty to perform electron-beam Monte Carlo absorbed doseestimation in the target volume Cancer Radiother. 14 89-95
Jang S Y, Liu H H, Mohan R and Siebers J V 2007 Variations in energy spectraand water-to-material stopping-power ratios in three-dimensional conformal andintensity-modulated photon fields Med. Phys. 34 1388-97
McEwen M R and DuSautoy A R 2009 Primary standards of absorbed dose for electronbeams Metrologia 46 S59-S79
Mora G M and Maio A 1999 Monte Carlo simulation of a typical Co60 therapy sourceMed. Phys. 26 1847-70
Muir B R and Rogers D W O 2010 Monte Carlo calculations of kQ, the beam qualityconversion factor Med. Phys. 37 5939-50
Muir B R, McEwen M R and Rogers D W O 2012 Beam quality conversion factors forparallel-plate ionization chambers in MV photon beams Med. Phys. 39, 1618-31
64 CAPITULO 3. CAMARAS PLANO-PARALELAS
Muir B R and Rogers D W O 2013 Monte Carlo calculations for reference dosimetryof electron beams with the PTW Roos and NE2571 ion chambers Med. Phys. 40121722
Nahum A E 1978 Water/air mass stopping power ratios for megavoltage photon andelectron beams Phys. Med. Biol. 23 24-38
Panettieri V, Sempau J and Andreo P 2008 Chamber-quality factors in Co-60 for threeplane-parallel chambers for the dosimetry of electrons, protons and heavy chargedparticles: penelope Monte Carlo simulations Phys. Med. Biol. 53 5917-26
Salvat F and Fernandez-Varea J M 2009 Overview of physical interaction models forphoton and electron transport used in Monte Carlo codes Metrologia 46 S112-38
Salvat F, Fernandez-Varea J M and Sempau J 2011 PENELOPE - A Code System forMonte Carlo simulation of electron and photon transport (Issy-les-Moulineaux:OECDNuclear Energy Agency)
Sempau J, Sanchez-Reyes A, Salvat F, Oulad Ben Tahar H, Jiang S B and Fernandez-Varea J M 2001 Monte Carlo simulation of electron beams from an accelerator headusing penelope Phys. Med. Biol. 46 1163-86
Sempau J, Fernandez-Varea J M, Acosta E and Salvat F 2003 Experimental benchmarksof the Monte Carlo code penelope Nucl. Instrum. Meth. Phys. Res. B 207 107-23
Sempau J, Andreo P, Aldana J, Mazurier J and Salvat F 2004 Electron beam qualitycorrection factors for plane-parallel ionization chambers: Monte Carlo calculationsusing the penelope system Phys. Med. Biol. 49 4427-44
Sempau J and Andreo P 2006 Configuration of the electron transport algorithm of PE-NELOPE to simulate ion chambers Phys. Med. Biol. 51 3533-48
Sempau J 2009 penEasy: A modular main program and voxelized geometry package forpenelope Available at www.upc.edu/inte/downloads/penEasy.htm (accessed 23rdMay 2014).
Sempau J, Badal A and Brualla L 2011 A penelope-based system for the automatedMonte Carlo simulation of clinacs and voxelized geometries–application to far-from-axis fields Med. Phys. 38 5887-95
Siebers J V, Keall P J, Nahum A E and Mohan R 2000 Converting absorbed doseto medium to absorbed dose to water for Monte Carlo based photon beam dosecalculations Phys. Med. Biol. 45 983-95
Svensson H and Brahme A 1986 Recent advances in electron and photon dosimetry, inRadiation Dosimetry, edited by C. G. Orton (New York:Plenum)
Vilches M, Garcıa-Pareja S, Guerrero R, Anguiano M and Lallena A M 2009 Multiplescattering of 13 and 20 MeV electrons by thin foils: A Monte Carlo study withGEANT, Geant4 and penelope Med. Phys. 36 3964-70
CAPITULO 3. CAMARAS PLANO-PARALELAS 65
Williams A J, McEwen M R and DuSautoy A R 1998 A calculation of the water tographite perturbation factor ratios for the NACP type 02 ionisation chamber usingMonte Carlo techniques, NPL Report CIRM 13 (Teddington:National Physical La-boratory)
Yi C, Hah S and Yeom M S 2006 Monte Carlo calculation of the ionization chamberresponse to 60Co beam using PENELOPE Med. Phys. 33, 1213-21
Zink K and Wulff J 2008 Monte Carlo calculations of beam quality correction factorskQ for electron dosimetry with a parallel-plate Roos chamber Phys. Med. Biol. 531595-607
Zink K and Wulff J 2009 Positioning of a plane-parallel ionization chamber in clinicalelectron beams and the impact on perturbation factors Phys. Med. Biol. 54 2421-35
Zink K and Wulff J 2012 Beam quality corrections for parallel-plate ion chambers inelectron reference dosimetry Phys. Med. Biol. 57 1831-54

Capıtulo 4
Nuevas camaras de dedal
67

CAPITULO 4. NUEVAS CAMARAS DE DEDAL 69
Physica Medica: European Journal of Medical Physics (2015) [en prensa]
Photon beam quality correction factorsfor the NE2571A and NE2581A thimble
ionization chambers using penelope
Fabian Erazo1,2 and Antonio M Lallena1
1 Departamento de Fısica Atomica, Molecular y Nuclear,Universidad de Granada, E-18071 Granada, Spain2 Instituto del Cancer - SOLCA, Cuenca, Ecuador
The beam quality correction factor kQ,Q0and the perturbation factor pQ for photon
beams were calculated for the NE2571A and NE2581A ionization chambers, using theMonte Carlo simulation code PENELOPE. Results are compared to those quoted forthe NE2571 and NE2581 chambers in previous works. Both kQ,Q0
and pQ obtained forNE2571A and NE2581A chambers agree with those of their predecessors NE2571 andNE2581 ones.
70 CAPITULO 4. NUEVAS CAMARAS DE DEDAL
4.1. Introduction
According to the codes of practice for dosimetry in radiotherapy (see e.g., TG51 [1]and TRS-398 [2]), the dose to water in a given point and for a given photon beam qualityQ, Dw,Q, is related to the dose measured by an ionization chamber situated at the samepoint, Dc,Q, as:
Dw,Q = Dc,Q · (sw,air)Q · pQ , (4.1)
where (sw,air)Q is the stopping-power ratio between water and air and pQ is an overallperturbation factor that takes into account all the effects due to the fact that the materialsof the ionization chamber are not equivalent to the water conforming the medium wheremeasurements are performed.
In practice, it is also of interest the factor [2]
kQ,Q0=
pQpQ0
(sw,air)Q(sw,air)Q0
=
(Dw,Q
Dc,Q
)·(Dw,Q0
Dc,Q0
)−1, (4.2)
which is usually known as the beam quality correction factor and accounts for the diffe-rences between the beam quality Q available to the final user and the quality Q0 (usuallythat of a 60Co gamma beam) at which the reference laboratory calibrates the ionizationchamber. The measurement of either pQ or kQ,Q0
is difficult and in TRS-398 [2] values ofkQ,Q0
where adapted from calculations by Andreo [3]. More recently, other authors [4,5]have proposed to calculate the beam quality correction factor via Monte Carlo simulation,using the ratio
kQ,Q0=
fc,Qfc,Q0
. (4.3)
Here fc,Q indicates an overall factor that depends on both the particular ionization cham-ber used and the beam quality, and relates directly the absorbed dose in the water withthe absorbed dose in the chamber according to
Dw,Q = Dc,Q · fc,Q . (4.4)
By comparing this expression with equation (4.1), one may consider fc,Q as an effectivestopping-power ratio which is calculated taking into account, in the appropriate way, allthe effects due to the actual presence of the chamber inside the water. The Monte Carloprocedure follows by obtaining both Dw,Q and Dc,Q for various beam qualities, includingQ0, and calculating kQ,Q0
using equations (4.3) and (4.4). Of course this computationalapproach will be trustworthy only if the accurate geometries of the ionization chambersare available.
In this work we have analyzed the NE2571A and NE2581A Farmer-type chambers,manufactured by QADOS (Sandhurst, UK). To the best of our knowledge, no informationabout the beam quality correction factors and overall perturbation factors of these cham-bers has been previously published. The results obtained have been compared to thosefound for the predecessor NE2571 and NE2581 chambers in [6,7]. All simulations havebeen performed with the Monte Carlo code PENELOPE [8].
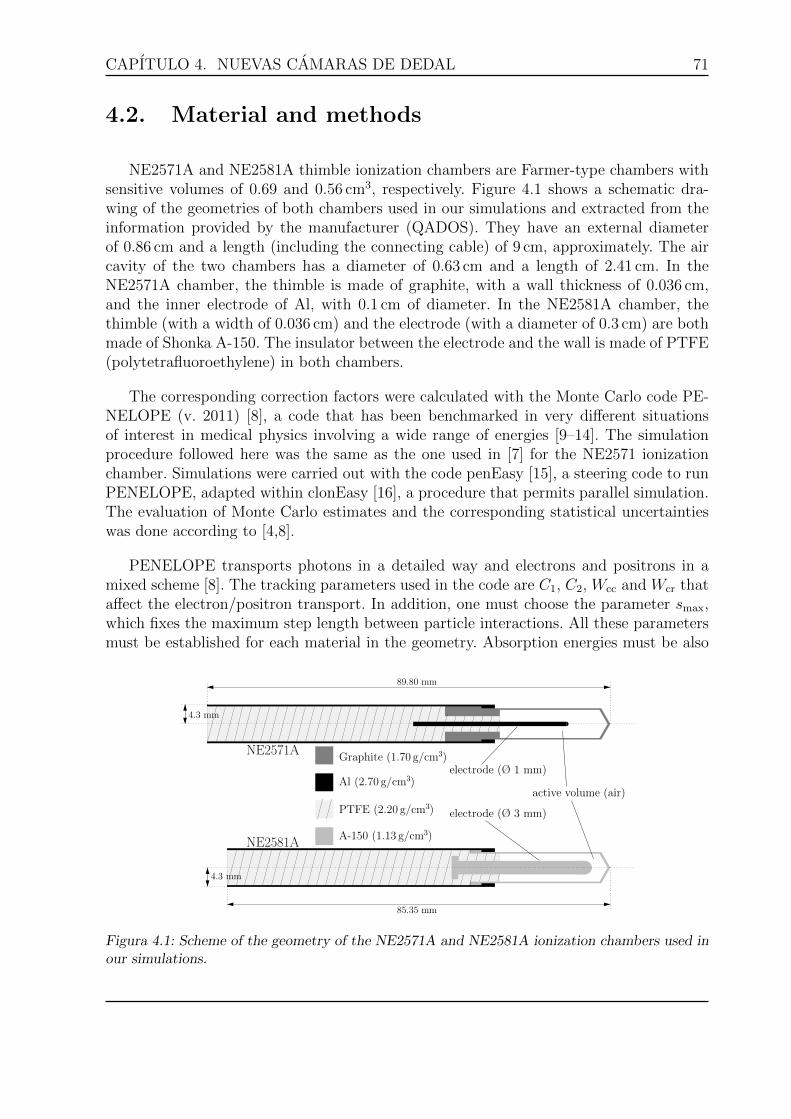
CAPITULO 4. NUEVAS CAMARAS DE DEDAL 71
4.2. Material and methods
NE2571A and NE2581A thimble ionization chambers are Farmer-type chambers withsensitive volumes of 0.69 and 0.56 cm3, respectively. Figure 4.1 shows a schematic dra-wing of the geometries of both chambers used in our simulations and extracted from theinformation provided by the manufacturer (QADOS). They have an external diameterof 0.86 cm and a length (including the connecting cable) of 9 cm, approximately. The aircavity of the two chambers has a diameter of 0.63 cm and a length of 2.41 cm. In theNE2571A chamber, the thimble is made of graphite, with a wall thickness of 0.036 cm,and the inner electrode of Al, with 0.1 cm of diameter. In the NE2581A chamber, thethimble (with a width of 0.036 cm) and the electrode (with a diameter of 0.3 cm) are bothmade of Shonka A-150. The insulator between the electrode and the wall is made of PTFE(polytetrafluoroethylene) in both chambers.
The corresponding correction factors were calculated with the Monte Carlo code PE-NELOPE (v. 2011) [8], a code that has been benchmarked in very different situationsof interest in medical physics involving a wide range of energies [9–14]. The simulationprocedure followed here was the same as the one used in [7] for the NE2571 ionizationchamber. Simulations were carried out with the code penEasy [15], a steering code to runPENELOPE, adapted within clonEasy [16], a procedure that permits parallel simulation.The evaluation of Monte Carlo estimates and the corresponding statistical uncertaintieswas done according to [4,8].
PENELOPE transports photons in a detailed way and electrons and positrons in amixed scheme [8]. The tracking parameters used in the code are C1, C2, Wcc and Wcr thataffect the electron/positron transport. In addition, one must choose the parameter smax,which fixes the maximum step length between particle interactions. All these parametersmust be established for each material in the geometry. Absorption energies must be also
4.3 mm
89.80 mm
4.3 mm
85.35 mm
active volume (air)
electrode (Ø 1 mm)
electrode (Ø 3 mm)
A-150 (1.13 g/cm3)
PTFE (2.20 g/cm3)
Al (2.70 g/cm3)
Graphite (1.70 g/cm3)NE2571A
NE2581A
Figura 4.1: Scheme of the geometry of the NE2571A and NE2581A ionization chambers used inour simulations.
72 CAPITULO 4. NUEVAS CAMARAS DE DEDAL
fixed; they determine the end of the track simulation and must be chosen for each particletype and each material.
In our simulations we used the same values for the transport parameters as thoseconsidered in reference [7] because we compared the results of the present simulations forthe new chamber NE2571A to those we found for the NE2571 in that work. Specifically wetook C1 = C2 = 0.02 for all the materials forming the ionization chambers (graphite, Aland PTFE, for the NE2571A; Al, PTFE and A-150, for the NE2581A, and the respectiveair-cavities) and for the water volume that surrounds it, up to 2 cm. The remaining waterof the phantom and the air volume involving the whole geometry were simulated withC1 = C2 = 0.1. The threshold parameters were Wcc = 0.01 ·Emax and Wcr = 0.001 ·Emax,Emax being the maximum energy of the initial particles. The absorption energies werechosen to be Eabs(e
−, e+) = Wcc and Eabs(γ) = Wcr. Reducing these values does notchange the results of the simulations while increases the CPU calculation time. Finally,for smax we used one tenth of the thickness of each material in the geometry, as it issuggested in the code manual [8].
The radiation sources considered in this work were the same as those used in [7]: a60Co gamma beam with the spectrum quoted in [17] (that we considered as our referencequality Q0) and photon beams generated by different linear accelerators (a Varian ClinacLE of 4 MV, a Varian Clinac HE of 6, 10, 15 and 18 MV, a Siemens KD of 6 and 18 MVand an Elekta SL25 of 6 and 25 MV) with the spectra calculated in [18].
Simulations were done using the geometrical source-to-surface setup proposed in TRS-398 [2]. We assumed point sources emitting photons with the corresponding spectra,whereas the ionization chamber was situated in the beam axis, inside a water phantomof 50 × 50 × 50 cm3, at the reference depth (5 cm for 60Co and 10 cm for the MV photonsources). A source-to-surface distance of 100 cm and a radiation field of 10×10 cm2 at thesurface of the phantom were chosen. With this setup Dc,Q was calculated as the dose in theactive volume of the chamber. On the other hand, Dw,Q was estimated, following reference[19], as the dose in a cylinder with a radius of 1 cm and a height of 0.025 cm situated atthe reference point. In both cases, the energy lost by the transported particles in thecorresponding regions of interest was scored and, once the simulation was completed, thedoses were calculated by dividing the total accumulated energies by the masses of therespective scoring regions.
TPR2010(Q) values were calculated for the various beam qualities in separate Monte
Carlo simulations as the ratios of the dose absorbed in water at depths of 20 and 10 cm,with a distance between the source and the measurement depths of 100 cm and a field atthese depths of 10 × 10 cm2. Depending on the energy and the specific linac considered,the total number of initial particles simulated ranged between 2 and 5 ·109. The statisticaluncertainties of the depth doses in the water phantom calculated in the simulations werebelow 0.01 % (with a coverage factor k = 2).
The factors fc,Q were calculated using equation (4.4) for the various beam qualitiesand, using them, the kQ,Q0
values were determined with equation (4.3). A sigmoid functionof x ≡ TPR20
10(Q),
f(x) = s
(1 − exp
[x − t
u
]), (4.5)
CAPITULO 4. NUEVAS CAMARAS DE DEDAL 73
was fitted to the results obtained for kQ,Q0. Here s was chosen to be
s =
(1 − exp
[x0 − t
u
])−1(4.6)
where x0 ≡ TPR2010(Q0); this guaranteed that f(x0) = 1.
Systematic uncertainties were also considered. We followed the analysis of Muir andRogers [6] and Wulff et al. [20]. Muir and Rogers investigated the sources of type Buncertainties in different ionization chambers and found that the largest ones occurreddue to (i) the assumption of a constant average energy lost per charge unit released byelectrons in air and (ii) the uncertainty in the cross-section for photons in water. Theyquoted maximum relative uncertainties of 0.43 % for the NE2571 chamber, but they didnot study the variation with the beam quality. On the other hand, Wulff et al. indicatedthat systematic uncertainties were mainly due to the electron cross sections involved inthe calculations and for the NE2571 chamber they found 0.2 %, for 6MV sources, up to0.4 %, for 24 MV sources. The results obtained in both papers were comparable and in ourcalculations we considered their findings as a conservative estimate of type B uncertainties.Specifically we assumed a linear dependence with the energy of the source following theprescription of Wulff et al. [20] for the NE2571 ionization chamber. Uncertainties of thevarious quantities calculated and of the fitting parameters are given as numbers betweenparentheses that affect the last significant figure, e. g., 0.16(2) means 0.16 ± 0.02 with acoverage factor k = 1.
As the two chambers analyzed here may be considered as an evolution of the NE2571and NE2581 models, we compared the results obtained in the present investigation tothose found for those chambers in previous works. Thus, for all x ≡ TPR20
10(Q) values, wecalculated the ratio
R7(x) =k(NE2571A)Q,Q0
k(NE2571)Q,Q0
, (4.7)
that permits us to compare the results we have obtained for the NE2571A chamber withthose quoted in [7] for the NE2571 one that were calculated in identical simulation condi-tions and showed a good agreement with those found by Muir and Rogers [6] and Wulffet al. [21] (calculated with the EGSnrc) and with the available experimental data [22].
It is worth pointing out here the main differences between the geometry of the NE2571Achamber analyzed in the present work and that of the NE2571 chamber studied in [7].Table 4.1 summarizes these differences. The NE2571 geometry used in [7] was approxi-mately reconstructed from the details found in the works by Aird and Farmer [23] andWulff et al. [21]. The active volume is slightly smaller in the NE2571A chamber (0.69 cm3)than in the NE2571 one (0.72 cm3). In addition, the simulated NE2571 chamber includeda PMMA sleeve with a width of 0.1 cm.
Also, our results for the NE2571A and NE2581A chambers were compared to thosefound for the NE2571 and NE2581 by Muir and Rogers [6] who fitted their kQ,Q0
valuesby using polynomials of third degree,
P3(x) = a′ + b′ x + c′ x2 + d′ x3 . (4.8)
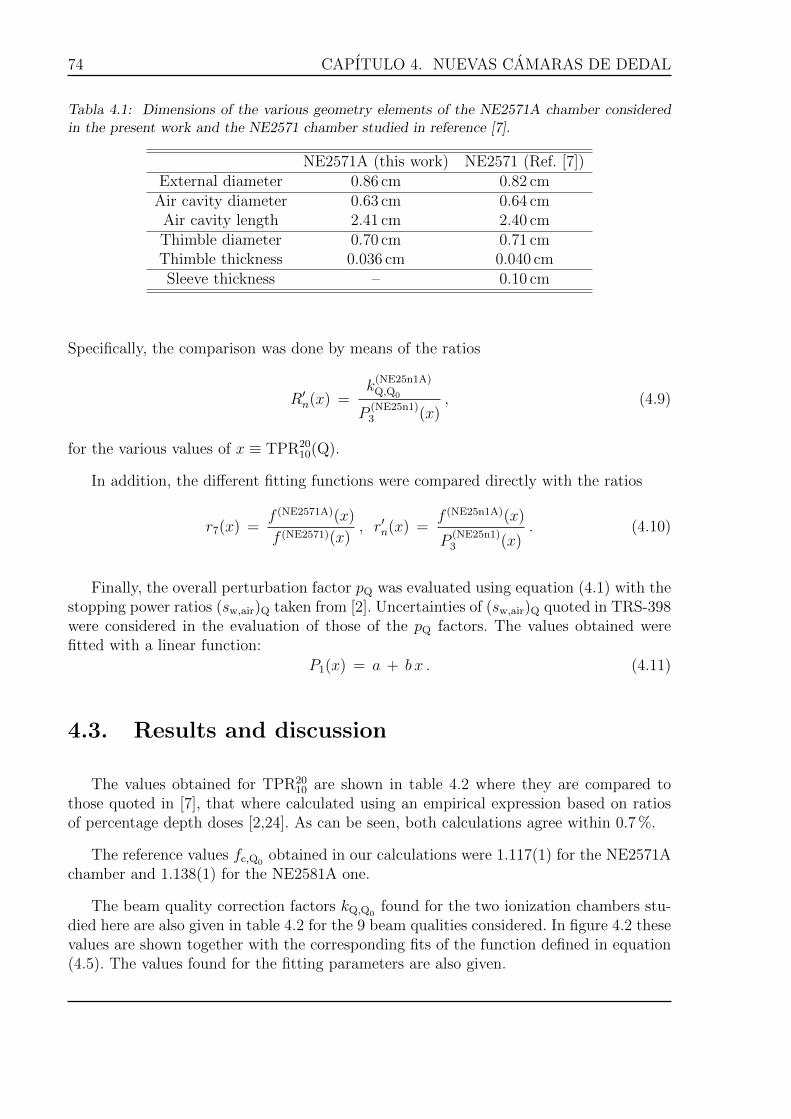
74 CAPITULO 4. NUEVAS CAMARAS DE DEDAL
Tabla 4.1: Dimensions of the various geometry elements of the NE2571A chamber consideredin the present work and the NE2571 chamber studied in reference [7].
NE2571A (this work) NE2571 (Ref. [7])External diameter 0.86 cm 0.82 cm
Air cavity diameter 0.63 cm 0.64 cmAir cavity length 2.41 cm 2.40 cmThimble diameter 0.70 cm 0.71 cmThimble thickness 0.036 cm 0.040 cmSleeve thickness – 0.10 cm
Specifically, the comparison was done by means of the ratios
R′n(x) =k(NE25n1A)Q,Q0
P(NE25n1)3 (x)
, (4.9)
for the various values of x ≡ TPR2010(Q).
In addition, the different fitting functions were compared directly with the ratios
r7(x) =f (NE2571A)(x)
f (NE2571)(x), r′n(x) =
f (NE25n1A)(x)
P(NE25n1)3 (x)
. (4.10)
Finally, the overall perturbation factor pQ was evaluated using equation (4.1) with thestopping power ratios (sw,air)Q taken from [2]. Uncertainties of (sw,air)Q quoted in TRS-398were considered in the evaluation of those of the pQ factors. The values obtained werefitted with a linear function:
P1(x) = a + b x . (4.11)
4.3. Results and discussion
The values obtained for TPR2010 are shown in table 4.2 where they are compared to
those quoted in [7], that where calculated using an empirical expression based on ratiosof percentage depth doses [2,24]. As can be seen, both calculations agree within 0.7 %.
The reference values fc,Q0obtained in our calculations were 1.117(1) for the NE2571A
chamber and 1.138(1) for the NE2581A one.
The beam quality correction factors kQ,Q0found for the two ionization chambers stu-
died here are also given in table 4.2 for the 9 beam qualities considered. In figure 4.2 thesevalues are shown together with the corresponding fits of the function defined in equation(4.5). The values found for the fitting parameters are also given.
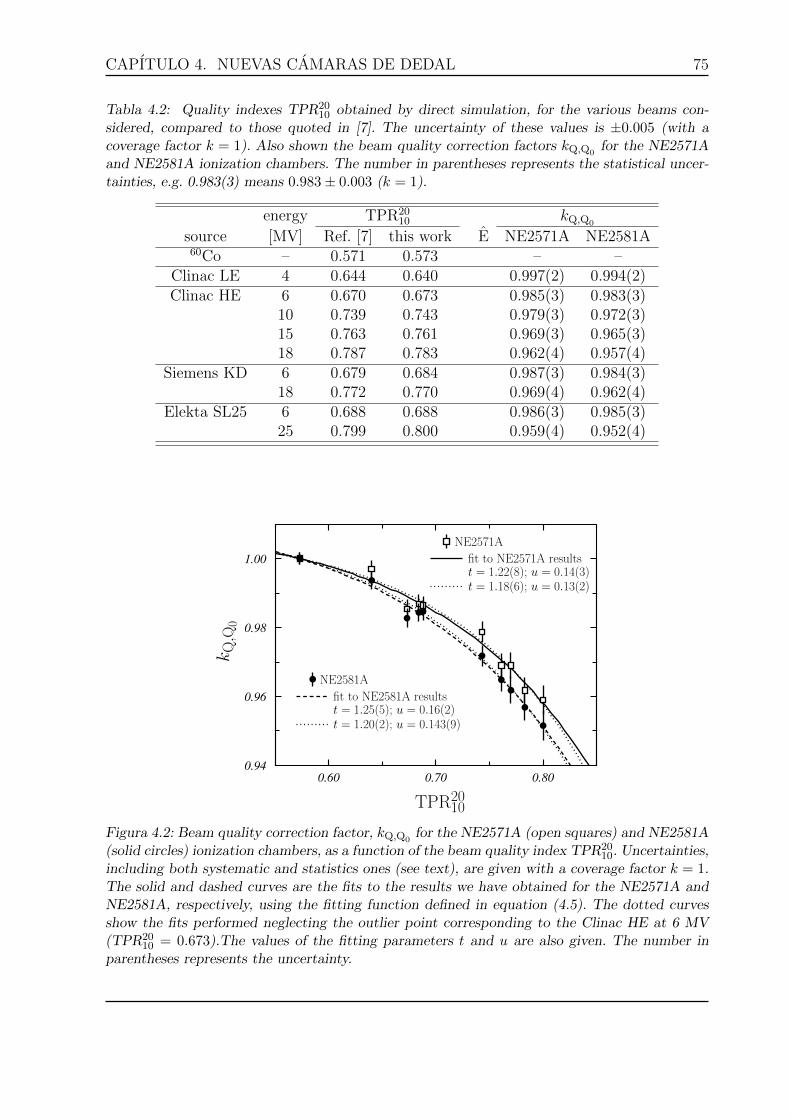
CAPITULO 4. NUEVAS CAMARAS DE DEDAL 75
Tabla 4.2: Quality indexes TPR2010 obtained by direct simulation, for the various beams con-
sidered, compared to those quoted in [7]. The uncertainty of these values is ±0.005 (with acoverage factor k = 1). Also shown the beam quality correction factors kQ,Q0
for the NE2571Aand NE2581A ionization chambers. The number in parentheses represents the statistical uncer-tainties, e.g. 0.983(3) means 0.983± 0.003 (k = 1).
energy TPR2010 kQ,Q0
source [MV] Ref. [7] this work E NE2571A NE2581A60Co – 0.571 0.573 – –
Clinac LE 4 0.644 0.640 0.997(2) 0.994(2)Clinac HE 6 0.670 0.673 0.985(3) 0.983(3)
10 0.739 0.743 0.979(3) 0.972(3)15 0.763 0.761 0.969(3) 0.965(3)18 0.787 0.783 0.962(4) 0.957(4)
Siemens KD 6 0.679 0.684 0.987(3) 0.984(3)18 0.772 0.770 0.969(4) 0.962(4)
Elekta SL25 6 0.688 0.688 0.986(3) 0.985(3)25 0.799 0.800 0.959(4) 0.952(4)
0.94
0.96
0.98
1.00
0.60 0.70 0.80
TPR2010
kQ,Q
0
NE2571A
fit to NE2571A resultst = 1.22(8); u = 0.14(3)t = 1.18(6); u = 0.13(2)
NE2581A
fit to NE2581A resultst = 1.25(5); u = 0.16(2)t = 1.20(2); u = 0.143(9)
Figura 4.2: Beam quality correction factor, kQ,Q0for the NE2571A (open squares) and NE2581A
(solid circles) ionization chambers, as a function of the beam quality index TPR2010. Uncertainties,
including both systematic and statistics ones (see text), are given with a coverage factor k = 1.The solid and dashed curves are the fits to the results we have obtained for the NE2571A andNE2581A, respectively, using the fitting function defined in equation (4.5). The dotted curvesshow the fits performed neglecting the outlier point corresponding to the Clinac HE at 6 MV(TPR20
10 = 0.673).The values of the fitting parameters t and u are also given. The number inparentheses represents the uncertainty.
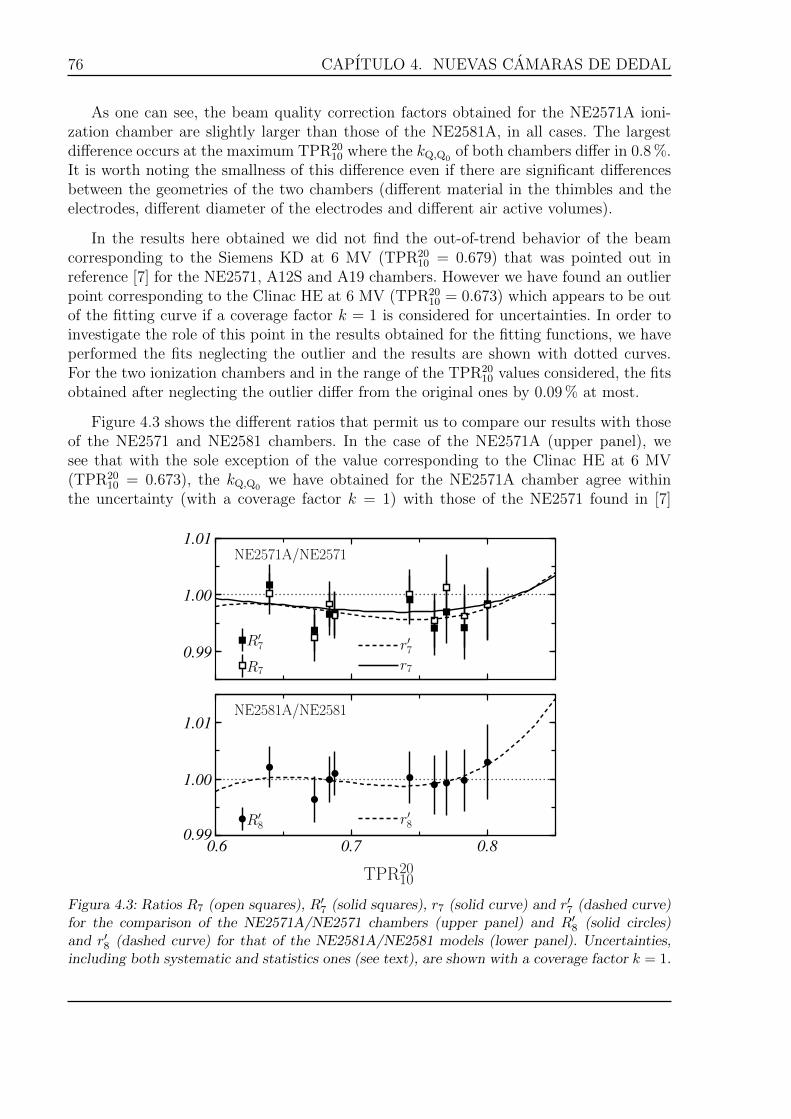
76 CAPITULO 4. NUEVAS CAMARAS DE DEDAL
As one can see, the beam quality correction factors obtained for the NE2571A ioni-zation chamber are slightly larger than those of the NE2581A, in all cases. The largestdifference occurs at the maximum TPR20
10 where the kQ,Q0of both chambers differ in 0.8 %.
It is worth noting the smallness of this difference even if there are significant differencesbetween the geometries of the two chambers (different material in the thimbles and theelectrodes, different diameter of the electrodes and different air active volumes).
In the results here obtained we did not find the out-of-trend behavior of the beamcorresponding to the Siemens KD at 6 MV (TPR20
10 = 0.679) that was pointed out inreference [7] for the NE2571, A12S and A19 chambers. However we have found an outlierpoint corresponding to the Clinac HE at 6 MV (TPR20
10 = 0.673) which appears to be outof the fitting curve if a coverage factor k = 1 is considered for uncertainties. In order toinvestigate the role of this point in the results obtained for the fitting functions, we haveperformed the fits neglecting the outlier and the results are shown with dotted curves.For the two ionization chambers and in the range of the TPR20
10 values considered, the fitsobtained after neglecting the outlier differ from the original ones by 0.09 % at most.
Figure 4.3 shows the different ratios that permit us to compare our results with thoseof the NE2571 and NE2581 chambers. In the case of the NE2571A (upper panel), wesee that with the sole exception of the value corresponding to the Clinac HE at 6 MV(TPR20
10 = 0.673), the kQ,Q0we have obtained for the NE2571A chamber agree within
the uncertainty (with a coverage factor k = 1) with those of the NE2571 found in [7]
0.99
1.00
1.01
0.99
1.00
1.01
0.6 0.7 0.8
TPR2010
R′7
R7
R′8
r′7r7
r′8
NE2571A/NE2571
NE2581A/NE2581
Figura 4.3: Ratios R7 (open squares), R′7 (solid squares), r7 (solid curve) and r′7 (dashed curve)for the comparison of the NE2571A/NE2571 chambers (upper panel) and R′8 (solid circles)and r′8 (dashed curve) for that of the NE2581A/NE2581 models (lower panel). Uncertainties,including both systematic and statistics ones (see text), are shown with a coverage factor k = 1.
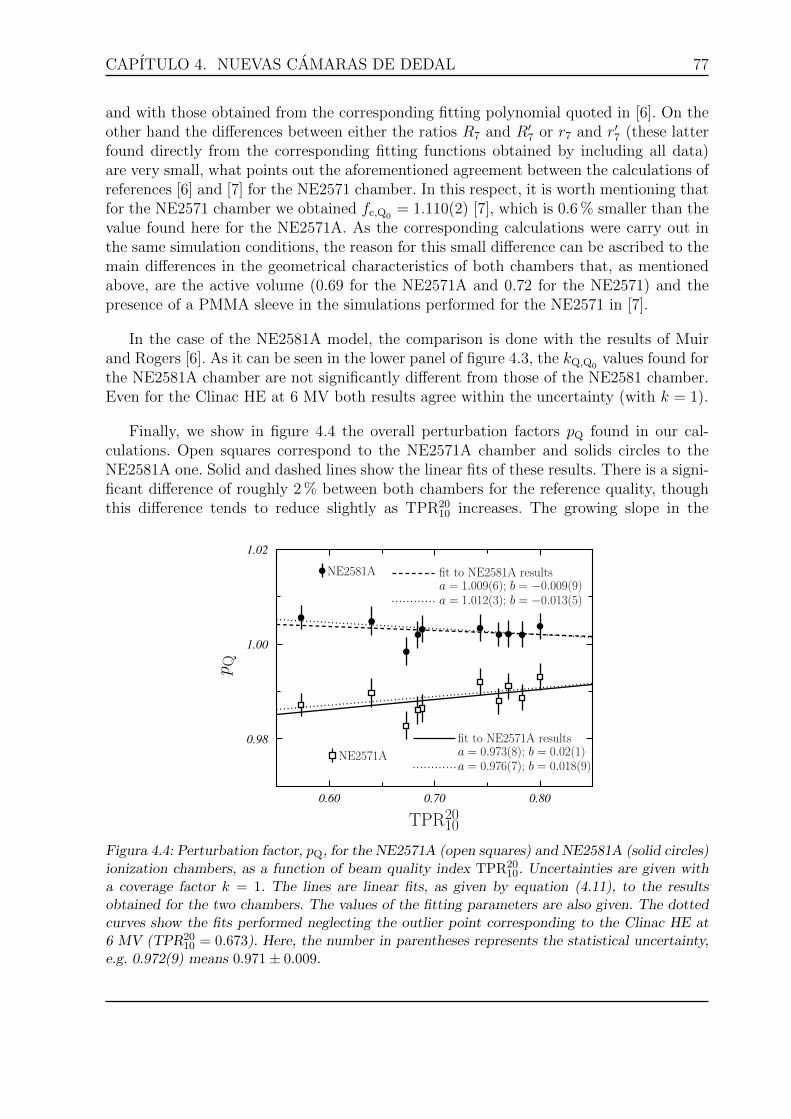
CAPITULO 4. NUEVAS CAMARAS DE DEDAL 77
and with those obtained from the corresponding fitting polynomial quoted in [6]. On theother hand the differences between either the ratios R7 and R′7 or r7 and r′7 (these latterfound directly from the corresponding fitting functions obtained by including all data)are very small, what points out the aforementioned agreement between the calculations ofreferences [6] and [7] for the NE2571 chamber. In this respect, it is worth mentioning thatfor the NE2571 chamber we obtained fc,Q0
= 1.110(2) [7], which is 0.6 % smaller than thevalue found here for the NE2571A. As the corresponding calculations were carry out inthe same simulation conditions, the reason for this small difference can be ascribed to themain differences in the geometrical characteristics of both chambers that, as mentionedabove, are the active volume (0.69 for the NE2571A and 0.72 for the NE2571) and thepresence of a PMMA sleeve in the simulations performed for the NE2571 in [7].
In the case of the NE2581A model, the comparison is done with the results of Muirand Rogers [6]. As it can be seen in the lower panel of figure 4.3, the kQ,Q0
values found forthe NE2581A chamber are not significantly different from those of the NE2581 chamber.Even for the Clinac HE at 6 MV both results agree within the uncertainty (with k = 1).
Finally, we show in figure 4.4 the overall perturbation factors pQ found in our cal-culations. Open squares correspond to the NE2571A chamber and solids circles to theNE2581A one. Solid and dashed lines show the linear fits of these results. There is a signi-ficant difference of roughly 2 % between both chambers for the reference quality, thoughthis difference tends to reduce slightly as TPR20
10 increases. The growing slope in the
0.98
1.00
1.02
0.60 0.70 0.80
TPR2010
p Q
NE2581A fit to NE2581A resultsa = 1.009(6); b = −0.009(9)a = 1.012(3); b = −0.013(5)
NE2571A
fit to NE2571A resultsa = 0.973(8); b = 0.02(1)a = 0.976(7); b = 0.018(9)
Figura 4.4: Perturbation factor, pQ, for the NE2571A (open squares) and NE2581A (solid circles)ionization chambers, as a function of beam quality index TPR20
10. Uncertainties are given witha coverage factor k = 1. The lines are linear fits, as given by equation (4.11), to the resultsobtained for the two chambers. The values of the fitting parameters are also given. The dottedcurves show the fits performed neglecting the outlier point corresponding to the Clinac HE at6 MV (TPR20
10 = 0.673). Here, the number in parentheses represents the statistical uncertainty,e.g. 0.972(9) means 0.971± 0.009.
78 CAPITULO 4. NUEVAS CAMARAS DE DEDAL
NE2571A chamber (b = 0.02(1)) is close to the value we found for the NE2571 chamberin [7] (b = 0.030(7)). On the other hand, the values found for the NE2581A chamber showup rather independent of the beam quality. Again we found the out-of-tendency behaviorof the value corresponding to the Clinac HE at 6 MV that also appeared for kQ,Q0
(seefigure 4.3). As in that case, we have done the fits of the pQ values neglecting this outlierpoint and the results have been plotted with dotted lines. The maximum difference bet-ween the two fits for each chamber is 0.09 % and occurs for the 60Co Q0 beam quality(TPR20
10 = 0.573).
4.4. Conclusions
In this work, the beam quality correction factor has been calculated for the NE2571Aand NE2581A ionization chambers with the Monte Carlo code PENELOPE for a TPR20
10
range from 0.64 to 0.80, that corresponds to linac photon beams between 4 and 25 MV.
The values of kQ,Q0obtained for the NE2571A chamber are, at most, 0.8 % larger than
those found for the NE2581A. In general, the results we have found for the NE2571A andNE2581A chambers agree within uncertainties with those quoted in previous works fortheir predecessors NE2571 and NE2581 chambers, respectively.
Acknowledgements
This work has been supported in part by the Junta de Andalucıa (FQM0220), theSpanish Ministerio de Economıa y Competitividad (FPA2012-31993) and the EuropeanRegional Development Fund (ERDF).
[1] Almond PR, Biggs PJ, Caursey BM, Hanson WF, Saiful HM, Nat R, Rogers DWO.AAPM’s TG-51 protocol for clinical reference dosimetry of high-energy photon andelectron beams. Med Phys 1999; 26: 1847-70.
[2] International Atomic Energy Agency. Absorbed dose determination in external beamradiotherapy, IAEA Technical Reports Series 398. Vienna: IAEA; 2000.
[3] Andreo P. Absorbed dose beam quality factors for the dosimetry of high-energy photonbeams. Phys Med Biol 1992; 37: 2189-211.
[4] Sempau J, Andreo P, Aldana J, Mazurier J, Salvat F. Electron beam quality correctionfactors for plane-parallel ionization chambers in high energy photon beams: MonteCarlo calculations using the PENELOPE system. Phys Med Biol 2004; 49: 4427-44.
[5] Capote R, Sanchez-Doblado F, Leal A, Lagares JI, Arrans R, Hartmann GH. AnEGSnrc Monte Carlo study of the microionization chamber for reference dosimetry ofnarrow irregular IMRT beamlets. Med. Phys. 2004; 31: 2416-22.
CAPITULO 4. NUEVAS CAMARAS DE DEDAL 79
[6] Muir BR, Rogers DWO. Monte Carlo calculations of kQ, the beam quality conversionfactor. Med Phys 2010; 37: 5939-50.
[7] F Erazo, AM Lallena. Calculation of beam quality correction factors for various thim-ble ionization chambers using the Monte Carlo code PENELOPE. Physica Medica:Eur. J. Med. Phys. 2013; 29: 163-70.
[8] Salvat F, Fernandez-Varea JM, Sempau J. PENELOPE: a code system for MonteCarlo simulation of electron and photon transport. Paris: Nuclear Energy Agency;2011.
[9] Chica U, Anguiano M, Lallena AM. Benchmark of PENELOPE for low and mediumenergy x-rays. Physica Medica: Eur. J. Med. Phys. 2009; 25: 51-7.
[10] Chica U, Florez G, Anguiano M, Lallena AM. A simple analytical expression to calcu-late the backscatter factor for low energy X-ray beams. Physica Medica: Eur. J. Med.Phys. 2011; 27: 75-80.
[11] Miras H, Terron JA, Lallena AM. Monte Carlo simulation of COMS ophthalmic ap-plicators loaded with Bebig I25.S16 seeds and comparison with planning system pre-dictions. Physica Medica: Eur. J. Med. Phys. 2013; 29: 670-6.
[12] Juan-Senabre XJ, Porras I, Lallena AM. A simple modification of TG-43 based brachyt-herapy dosimetry with improved fitting functions: Application to the selectSeed source.Physica Medica: Eur. J. Med. Phys. 2013; 29: 403-11.
[13] Guerrero R, Almansa JF, Torres J, Lallena AM. Dosimetric characterization of the60Co BEBIG Co0.A86 high dose rate brachytherapy source using penelope. PhysicaMedica: Eur. J. Med. Phys. 2014; 30: 960-67.
[14] Erazo F, Brualla L, Lallena AM. Electron beam quality kQ,Q0factors for various
ionization chambers: A Monte Carlo investigation with penelope. Phys. Med. Biol.2014; 59: 6673-91.
[15] Sempau J, Badal A, Brualla L. A PENELOPE-based system for the automated MonteCarlo simulation of clinacs and voxelized geometries-application to far-from-axis fields.Med. Phys. 2011; 38: 5887-95.
[16] Badal A, Sempau J. clonEasy: A package of linux scripts for the parallelization ofMonte Carlo simulations. Comp Phys Comm 2005; 175: 440-50.
[17] Mora GM, Maio A. Monte Carlo simulation of a typical 60Co therapy source. MedPhys 1999; 26: 1847-70.
[18] Sheikh-Bagheri D, Rogers DWO. Monte Carlo calculation of nine megavoltage photonbeam spectra using BEAM code. Med Phys 2002; 29: 391-402.
[19] Kawrakow I. On the effective point of measurement in megavoltage photon beams.Med Phys 2006; 33: 1829-39
80 CAPITULO 4. NUEVAS CAMARAS DE DEDAL
[20] Wulff J, Heverhagen JT, Zink K, Kawrakow I. Investigation of systematic uncertaintiesin Monte Carlo-calculated beam quality correction factors. Phys Med Biol 2010; 55:4481-93.
[21] Wulff J, Heverhagen JT, Zink K. Monte Carlo based perturbation and beam qualitycorrections factors for thimble ionization chambers in high energy photon beams. PhysMed Biol 2008; 53: 2823-36.
[22] Nederlandse Commissie voor Stralingsdosimetrie. Code of practice for the absorbeddose determination in high energy photon and electron beams. NCS Report 18. Delft:NCS; 2008.
[23] Aird EG, Farmer FT. The design of a thimble chamber for the Farmer dosemeter.Phys Med Biol 1972;17:169-74.
[24] Followill DS, Tailor RC, Tello VM, Hanson WF. An empirical relationship for deter-mining photon beam quality in TG-21 from a ratio of percent depth doses. Med Phys1998; 25: 1202-5.
Capıtulo 5
CONCLUSIONES YPERSPECTIVAS
81

CAPITULO 5. CONCLUSIONES Y PERSPECTIVAS 83
En este trabajo se han evaluado mediante simulacion Monte Carlo con el codigo PE-NELOPE los factores de correccion de calidad de haz, kQ,Q0 , para varias camaras de dedaly plano-paralelas y para haces de fotones y electrones.
En el caso de la camara de ionizacion tipo dedal NE2571, que es considerada de refe-rencia en la dosimetrıa fısica, los valores de kQ,Q0 para haces de fotones estan en excelenteconcordancia con los valores reportados en la bibliografıa calculados usando el codigoEGSnrc y tambien con los obtenidos experimentalmente. Todos estos valores difieren demanera significativa de los factores establecidos en el protocolo TRS-398, diferencia quese incrementa con el aumento de la energıa nominal de los haces. Esto sugiere que losvalores del protocolo del Organismo Internacional de Energıa Atomica, que son usados enla practica clınica, deben ser revisados.
Los factores globales de perturbacion pQ para esta misma camara NE2571 presentandiferencias significativas con los valores obtenidos con EGSnrc por otros autores. Estadiferencia es de alrededor del 0.4 % para el 60Co y se mantiene casi constante (solo conun ligero incremento) conforme aumenta el valor de la energıa del haz.
Los valores de kQ,Q0 para las camaras de Standard Imaging A19 y A12S, usadas en ladosimetrıa de radioterapia convencional y estereotaxica, respectivamente, estan de acuer-do con los valores reportados en la bibliografıa obtenidos con EGSnrc o determinadosexperimentalmente. Los factores kQ,Q0 para estas dos camaras de ionizacion no estan re-portados en el TRS-398. Los valores de los factores de perturbacion pQ para estas doscamaras de ionizacion se diferencian de los obtenidos con EGSnrc de forma similar a laya discutida para la camara NE2571.
Se han calculado los factores de correccion kQ,Q0 en el caso de haces de electrones y pa-ra siete camaras plano-paralelas de Standard Imaging: A10, A11, A11TW, P11, P11TW,T11 y T11TW. Se han considerado varios haces de electrones realistas obtenidos para unacelerador Varian Clinac 2100 C/D y los haces monoenergeticos sintonizados para repro-ducir los valores de R50 de los mismos. Para todas las camaras de ionizacion analizadasse han calculado los factores de correccion para dos tamanos de campo de referencia:10 × 10 cm2 y 20 × 20 cm2. Los valores obtenidos para el primero son ligeramente masaltos que los del campo de 20 × 20 cm2; la mayor diferencia (alrededor del 0.8 %) se haencontrado para la camara de ionizacion A10 (la de menor volumen activo de recoleccionde carga) y para electrones con una energıa nominal de 9 MeV. En cualquier caso, losresultados encontrados para los dos tamanos de campo son estadısticamente compatiblesen todos los casos para un factor de cobertura de k = 2.
84 CAPITULO 5. CONCLUSIONES Y PERSPECTIVAS
Para energıas nominales inferiores a 12 MeV, los valores de kQ,Q0 obtenidos para loshaces provenientes de la simulacion detallada de los aceleradores lineales y los de los hacesmonoenergeticos sintonizados estan en buen acuerdo. Sin embargo, para energıas mayores,los factores correspondientes a los haces realistas son alrededor del 1 % superiores a losde los monoenergeticos. Este resultado contradice el de un trabajo previo en el que no seencontraron diferencias entre ambos tipos de calculos en el caso de las camaras PPC-05 yPPC-40, de Wellhofer, y NACP02. Especıficamente se han realizado los calculos para estaultima camara encontrando las mismas diferencias que para las otras camaras, diferenciasque han podido ser asignadas, al menos en una parte importante, a los fotones secundariosproducidos en los distintos elementos del acelerador ası como en el aire existente ente elcabezal del mismo y el maniquı de agua donde se acumula la dosis.
Para las camaras Standard Imaging se ha puesto de manifiesto la importancia de losmateriales de construccion que pueden dar lugar a factores de correccion que muestrandiferencias significativas.
Por ultimo se han evaluado los factores de correccion kQ,Q0 para las camara NE2571Ay NE2581A para los haces de fotones ya considerados en el caso de las otras camaras dededal analizadas. Los valores obtenidos para la primera son ligeramente superiores a losde la segunda, si bien estan respectivamente de acuerdo con los factores encontrados parasus camaras predecesoras (NE2571 y NE2581) en trabajos previos.
El trabajo desarrollado en esta tesis ha permitido establecer una metodologıa de calculode factores de correccion de calidad de haz que permite evaluar dichos factores de mane-ra fiable, tanto para haces de fotones como de electrones y para camaras de ionizacioncilındricas y plano-paralelas. Las diferencias que hemos encontrado entre los resultadosobtenidos con PENELOPE y con EGSnrc pone de manifiesto la necesidad de completarlos calculos para otras camaras a fin de establecer de forma unıvoca los valores de losfactores que deben ser utilizados en la practica clınica.
Por otro lado, una de las cuestiones pendientes para facilitar los calculos es la deincorporar en los mismos tecnicas de reduccion de varianza. Este aspecto es fundamentalpara poder abordar los calculos sobre todos en el caso de camaras de volumen pequenopara las que las simulaciones requieren un tiempo de CPU mas que considerable.

INFORME
85

CAPITULO 5. CONCLUSIONES Y PERSPECTIVAS 87
Esta tesis doctoral se basa en los artıculos que a continuacion se relacionan y sobrelos cuales se proporcionan los indicios de calidad correspondientes.
1. F. Erazo and A.M. LallenaCalculation of beam quality correction factors for various thimble ionization cham-bers using the Monte Carlo code penelopePhysica Medica: European Journal of Medical Physics 29 (2013) 163-170Factor de impacto: 2.403Posicion: 44 de 125Categorıa: RADIOLOGY, NUCLEAR MEDICINE & MEDICAL IMAGING
2. F. Erazo, L. Brualla and A.M. LallenaElectron beam quality kQ,Q0
factors for various ionization chambers: A Monte Carloinvestigation with penelopePhysics in Medicine and Biology 59 (2014) 6673-6691Factor de impacto: 2.761Posicion: 34 de 125Categorıa: RADIOLOGY, NUCLEAR MEDICINE & MEDICAL IMAGINGPosicion: 21 de 76Categorıa: ENGINEERING, BIOMEDICAL
3. F. Erazo and A.M. LallenaPhoton beam quality correction factors for the NE2571A and NE2581A thimbleionization chambers using penelopePhysica Medica: European Journal of Medical Physics (2015) [en prensa]Factor de impacto: 2.403Posicion: 44 de 125Categorıa: RADIOLOGY, NUCLEAR MEDICINE & MEDICAL IMAGING
Algunos de los resultados de esta tesis doctoral se han presentado en el congreso quea continuacion se indica
1. F. Erazo, L. Brualla and A.M. LallenaElectron beam quality correction factor for ionization chambers: monoenergetic elec-trons versus linac phase-spaces20 Jahrestagung der Deutschen Gesellschaft fur Radioonkologie. Dusseldorf (Ale-mania) 2014Strahlentherapie und Onkologie 190 Suppl. 1 (2014) 145.