TESIS Salgado-Negret
116
I EFECTOS DE LA FRAGMENTACIÓN SOBRE LA DISTRIBUCIÓN DE ESPECIES ARBÓREAS EN EL PARQUE NACIONAL FRAY JORGE: IMPORTANCIA DE LOS ATRIBUTOS ECOFISIOLÓGICOS
Transcript of TESIS Salgado-Negret
I
EFECTOS DE LA FRAGMENTACIÓN SOBRE LA
DISTRIBUCIÓN DE ESPECIES ARBÓREAS EN EL PARQUE
NACIONAL FRAY JORGE: IMPORTANCIA DE LOS
ATRIBUTOS ECOFISIOLÓGICOS

II
PONTIFICIA UNIVERSIDAD CATÓLICA DE CHILE FACULTAD DE CIENCIAS BIOLÓGICAS PROGRAMA DOCTORADO EN CIENCIAS BIOLÓGICAS MENCIÓN ECOLOGÍA
EFECTOS DE LA FRAGMENTACIÓN SOBRE LA DISTRIBUCIÓN DE ESPECIES ARBÓREAS EN EL PARQUE
NACIONAL FRAY JORGE: IMPORTANCIA DE LOS ATRIBUTOS ECOFISIOLÓGICOS
Por
BEATRIZ EUGENIA SALGADO NEGRET
Tesis presentada a la Facultad de Ciencias Biológicas de la Pontificia Universidad Católica de Chile para optar al grado académico de Doctor en Ciencias Biológicas mención
Ecología
Dirigida por: Dr. Juan José Armesto Dra. Fernanda Pérez
Noviembre, 2013 Santiago, Chile

III
Agradecimientos
Quiero comenzar agradeciendo a la Comisión Nacional de Investigación Científica y
Tecnológica (CONICYT, Chile) y al Instituto de Ecología y Biodiversidad (IEB) por el
apoyo financiero para realizar este doctorado y el trabajo de investigación.
Quiero agradecer a mi tutor principal Juan Armesto, por apostar a ciegas y
permitirme ser parte de su equipo, por sus invaluables enseñanzas y apoyo incondicional.
A todos los miembros de su Laboratorio por todas las tertulias e increíbles discusiones.
A Fernanda Pérez por ser una excelente guía, por las eternas discusiones teóricas,
por todas las salidas de campo, pero sobretodo por convertirse en una gran amiga y
confidente. Fefita, eres de los grandes regalos que me llevo de Chile…gracias por todo!
A Fernando Valladares y su equipo por adoptarme por meses en su laboratorio y
acogerme como un miembro más del equipo. Gracias por todos los análisis y discusiones
que mejoraron este documento.
A Pablo Marquet, Javier Figueroa y Martín Carmona por sus aportes y comentarios
que mejoraron esta propuesta desde sus inicios.
A Mylthon Jimenez-Castillo y su equipo por enseñarme el mundo de la hidráulica.
Gracias especiales a Paulina Lobos.
A Juan Monardez, por su fiel compañía, por las deliciosas cenas y discusiones en
compañía del mejor vino. Juan mil gracias por presentarme un ecosistema maravilloso.
A Aurora Gaxiola y Daniel Stanton por las múltiples charlas planteando hipótesis y
discutiendo resultados…. sus comentarios mejoraron enormemente los manuscritos y su
compañía fue un gran apoyo.
A Felipe Albornoz, Rafaella Canessa, Carmen Ossa, Daniel Salinas, Patricio
Valenzuela e Isabel Mujica por su invaluable apoyo en campo y laboratorio y por hacer de
las salidas de campo paseos repletos de risas y complicidad. A Mariela Aguilera y Ximena
Alvarez por todas las reuniones, discusiones y tertulias alrededor de la fisiología de las
plantas…hubo momentos brillantes…gracias queridas!
A mis compañeras de batalla y familia en Chile: Lidia Mansur, Sabrina Clavijo,
Daniela Rivera y Carmencha Ossa…. no habría sido lo mismo sin ustedes. A Leo por todo
su apoyo durante tantos años.

IV
A Carolina Alcázar, Olga Caro y Carolina Useche por ser mis terapeutas en la
distancia…gracias por todo el apoyo.
A mi familia en Colombia….por darme la libertad de soñar y por estar al pie del
cañón….mil gracias por estar siempre tan cerca a pesar de la distancia.
A todas aquellas personas que no he nombrado pero que hicieron parte de este
logro. Muchas gracias.

V
Tabla de contenidos
Lista de abreviaturas ............................................................VIII
Resumen .................................................................................IX
Introducción General……………….………………………..………1
Estructura de la tesis………………………….................................. 6
Área de estudio............................................................................ 7
Visión general….......................................................................... 9
Referencias.................................................................................. 11
Capítulo I
Estrategias divergentes de tolerancia a la sequía explican la
distribución de especies arbóreas a través de un gradiente de humedad
dependiente de neblina en un bosque lluvioso templado
Abstract......................................................................................... 17
Introduction.................................................................................. 18
Materials and Methods................................................................. 20
Results.......................................................................................... 25
Discussion.................................................................................... 27
Acknowledgements………………………………………………31
References.................................................................................... 32
Tables........................................................................................... 38
Figures......................................................................................... 41

VI
Capítulo II
Variación en rasgos funcionales explica la distribución de Aextoxicon
punctatum a través de un fuerte gradiente de humedad en un bosque
fragmentado dependiente de neblina
Abstract........................................................................................ 47
Introduction.................................................................................. 48
Materials and Methods................................................................. 51
Results........................................................................................... 54
Discussion..................................................................................... 56
Acknowledgements…………………………………………………….. 59
References..................................................................................... 60
Tables............................................................................................ 67
Figures.......................................................................................... 70
Online supplemental materials……………………………………74
Conclusiones Generales
Conclusiones................................................................................ 78
Anexo I
Simetría de los parches de bosque depende de la dirección de los
recursos limitantes
Abstract........................................................................................ 84
Introduction.................................................................................. 85
Materials and Methods................................................................. 88
Results........................................................................................... 90
Discussion..................................................................................... 91
Acknowledgements……………………..……………………………….95

VII
References..................................................................................... 96
Tables........................................................................................100
Figures.................................................................................... 102

VIII
Lista de abreviaturas
AMAX = Photosynthetic rate; Tasa fotosíntesis
gs = Stomatal conductance; Conductancia estomática
Hv = Huber value; Valor Huber
Ks = Sapwood-specific hydraulic conductivity
LA = Leaf area; Área foliar
LMA = Leaf mass area; Relación masa: área de la hoja
PLC = Percentage of loss conductivity; Porcentaje de pérdida de conductividad
RWCtlp = Relative water content at turgor loss point; Contenido relativo de agua al punto
de pérdida de turgor
SD = Stomatal density; Densidad estomática
TD = Trichome density; Densidad de tricomas
VD = Vessel density; Densidad de vasos
VDi = Vessel diameter, Diámetro de vasos
π0 = Solute potential at full turgor; Potencial de solutes a full turgor
πtlp = Water potential at turgor loss; Potencial hídrico al punto de pérdida de turgor
ɛ = Bulk modulus of elasticity; Modulo de elasticidad
ψPD = Leaf water potentials predawn; Potencial hídrico al amanecer
ψMD = Leaf water potentials at midday; Potencial hídrico al medio día

IX
Resumen
El estudio de los rasgos funcionales y mecanismos fisiológicos que determinan la
tolerancia de las especies a la sequía y su habilidad para competir por agua es fundamental
para entender su distribución a través de gradientes de humedad y predecir su respuesta al
cambio global, donde la fragmentación del hábitat y el cambio de uso del suelo son los
principales motores de cambio. En este sentido, los bosques dependientes de neblina en las
regiones semiáridas del mundo son un buen modelo de estudio para entender las respuestas
de las especies al incremento en la aridez y la fragmentación del hábitat.
En esta tesis se estudiaron los mecanismos fisiológicos que explican los patrones
contrastantes de distribución observados a través de gradientes de humedad generados por
la neblina costera en las tres principales especies arbóreas Aextoxicon punctatum, Drimys
winteri y Myrceugenia correifolia que coexisten en los fragmentos de bosque del Parque
Nacional Fray Jorge, en la región semiárida en Chile.
Se identificó un continuo de estrategias en el uso de agua explicando la distribución
de las especies a través del gradiente de humedad a pequeña escala. Drimys winteri, una
especie restringida al núcleo húmedo, mostró rasgos que permiten un eficiente transporte
de agua y ganancia de carbono; en contraste, Myrceugenia correifolia, especie que domina
los bordes secos de sotavento, presentó rasgos que promueven la conservación del agua y
menores tasas de intercambio de gases, así como menor potencial hídrico al punto de
pérdida de turgor. La especie con amplia distribución Aextoxicon punctatum, mostró
valores de rasgos intermedios, pero se observó variación de las medias, magnitud e
integración fenotípica a través de las zonas dentro de los fragmentos. Así, árboles
creciendo en los bordes secos presentaron mayor LMA, densidad de estomas y tricomas
que los árboles del núcleo húmedo y el borde barlovento. En contraste, rasgos de la
anatomía del xilema no variaron produciendo pérdida de la conductividad hidráulica en los
bordes más secos. También se detectaron mayores niveles de integración fenotípica y
variabilidad en los bordes secos.
Los resultados mostraron que el particionamiento del pronunciado gradiente de
humedad a pequeña escala entre las especies arbóreas está determinado por las tolerancias
diferenciales de las especies a la sequía, y esas diferencias indican que las especies tienen
habilidades contrastantes para lidiar con futuros cambios climáticos.

I. Introducción General

2
La disponibilidad de agua es el principal factor que determina la distribución de las
especies arbóreas a través de gradientes de lluvia a gran escala así como en gradientes
topográficos a pequeña escala (Gentry 1988, Wright 1992, Condit 1998, Bongers et al.
1999, Pyke et al. 2001, Condit et al. 2002, Engelbrecht et al. 2007). El estudio de los
rasgos funcionales asociados al comportamiento de las especies bajo condiciones
particulares de humedad del suelo ayuda a explicar la distribución de las especies
(Poorter 2007, Markesteijn et al. 2011, Sterck et al. 2011), donde el éxito en el
establecimiento y sobrevivencia en ambientes o épocas secas estará determinado
por su habilidad para competir por agua y tolerar la sequía (Markesteijn et al.
2011).
La capacidad de respuesta de las especies a la sequía y a cualquier variable
ambiental está determinada por sus rasgos funcionales, los cuales son todas las
características morfológicas, fisiológicas o fenológicas medidas a nivel individual
(Viollé et al. 2007). Es bien conocido el trade off entre la adquisición y conservación
de recursos que le permite a las especies especializarse a lo largo de esos gradientes
ambientales (Reich et al. 2003, Diaz et al. 2004, Wright et al. 2004). Así, plantas que
crecen en ambientes secos generalmente tienen hojas pequeñas, baja conductancia
estomática, alta área foliar específica (e.j. Fahn 1986, Baldini et al. 1997, Niinemets
2001), pero presentan bajas tasas fotosintéticas y tasas de crecimiento (Reich et al.
2003). A nivel hidráulico también existen ciertos rasgos que determinan el
establecimiento de las especies en determinados ambientes. Por ejemplo, especies que
crecen en ambientes secos generalmente tienen vasos conductores más pequeños y
densos con pequeños poros en las membranas que les permiten conducir agua bajo
condiciones de baja disponibilidad hídrica disminuyendo el riesgo de embolismo. Estos
rasgos incrementan la resistencia al flujo de agua y reducen la eficiencia hidráulica de
las especies, afectando el suministro de agua a las hojas (Hacke et al. 2001, Choat et al.
2005, Markesteijn et al. 2011a,b). Según la combinación de rasgos funcionales, las
plantas pueden estar ubicadas a través de un gradiente de estrategias (Reich et al. 2003,
Díaz et al. 2004): en un extremo especies con rasgos que favorecen la conservación de
los recursos (conservativas) a especies con rasgos que promueven la rápida captura de
recursos (adquisitivas). Entender las estrategias y mecanismos que tienen las especies
para sobrevivir a la sequía es crítico para predecir las consecuencias ecológicas de
futuras alteraciones en la humedad del suelo debido a motores del cambio global como
la fragmentación, el cambio de uso del suelo o el cambio climático.

3
La mayoría de los estudios relacionados con distribución de especies a través de
gradientes de humedad, han examinado la variación de rasgos funcionales a nivel
interespecifico (Pockman y Sperry 2000, Cornwell y Ackerly 2009, Engelbrecht et al.
2007, Choat et al. 2012, Salgado-Negret et al. 2013), considerando únicamente los
valores promedio de los rasgos para cada especie, ignorado la importancia de la
variabilidad intraespecífica. Esto puede responder a que las tendencias en comunidades
diversas son principalmente el resultado del recambio de especies más que de la
variación a nivel de especie (Cornwell y Ackerly 2009; Albert et al. 2010a,b; Hulshof y
Swenson 2010). En ambientes con limitaciones hídricas, se ha propuesto una
disminución de la variabilidad (coeficiente de variación) de los rasgos funcionales a
nivel intraespecífico, debido a que solo individuos con un rango restringido de valores
de rasgos es capaz de sobrevivir bajo esas condiciones ambientales (Cornwell y Ackerly
2009). A través de los gradientes de humedad del suelo también pueden variar las
respuestas de los rasgos individuales (media y coeficiente de variación) y por lo tanto
los patrones de correlación entre ellos (Pigliucci y Kolodynska 2002; Sardans, Penuelas
y Roda 2006), y aunque en la literatura son bien conocidas las correlaciones entre
rasgos foliares (Wright et al. 2004), rasgos hidráulicos (Chavé et al. 2009, Zanne et al.
2010) y entre ambos módulos vegetativos (Brodribb y Field 2000; Brodribb et al. 2002;
Santiago et al. 2004; Wright et al. 2006; Meinzer et al. 2008; Baraloto et al. 2010),
existe poca información acerca de cómo el ambiente puede alterar los patrones de
correlación fenotípica entre rasgos de foliares y de madera (Nicotra et al. 1997, Wright
et al. 2006).
Uno de los ecosistemas con mayores limitaciones hídricas son los bosques
dependientes de neblina encontrados en las regiones semiáridas del mundo (Hildebrandt
y Eltahir 2006, del-Val et al. 2006, Katata et al. 2010). Estos bosques son relictos de
periodos pasados cuando las condiciones fueron más húmedas, por lo cual son
ecosistemas especialmente sensibles a los cambios actuales en la producción y
distribución de la neblina. Se predice que alteraciones en la frecuencia e intensidad de la
niebla ocurrirán debido a cambios en la temperatura superficial del mar y la altura de la
capa de inversión térmica (Cereceda et al. 2002), pérdida de áreas de bosque y
fragmentación o cambios en la estructura de los bosques afectando la captura de niebla
(Hildebrandt y Eltahir 2006). En esos fragmentos de bosque, la intercepción de la niebla
por las plantas es la principal o incluso la única fuente de agua durante la mayor parte
del año (Dawson 1998, del-Val et al. 2006, Ewing et al. 2009). La intercepción por parte
4
de la vegetación crea pronunciados gradientes de agua y nutrientes desde el borde
barlovento (entrada de niebla) al borde sotavento de los parches (Weathers et al. 2000,
del-Val et al. 2006, Ewing et al. 2009), con fuertes contrastes en cortas distancias
(Ewing et al. 2009). Estudiar la respuesta de las especies a la variación en la humedad
del suelo a cortas escalas espaciales generadas por gradientes topográficos o de
fragmentación en estos ecosistemas, nos permite direccionar preguntas acerca las
condiciones críticas para el mantenimiento de especies arbóreas bajo estrés por sequía
debido a cambio climático.
Un interesante ejemplo de bosques dependientes de neblina se encuentra en la
región semiárida en Chile (30°S), donde un mosaico de más de 180 parches de bosque
persiste en las montañas costeras rodeado por una matriz de vegetación xerofítica
(Barbosa et al. 2010). Este bosque tuvo una distribución continua, pero el incremento en
la aridez en el Terciario tardío dividió su distribución (Villagrán et al. 2004). Como
consecuencia, este tipo de bosque quedó restringido al rango montañoso costero de la
región Mediterránea en Chile inundado por niebla (Villagrán et al. 2004), la cual
duplica la precipitación efectiva de esta zona (del-Val et al. 2006).
Los fuertes gradientes de humedad generados por la intercepción de la neblina
afectan la distribución y dinámica de las especies. Las especies arbóreas dominantes en
esos parches son: Aextoxicon punctatum (Aextoxicaceae), que ocurre en todos los
bosques pero prefiere el borde barlovento que recibe directamente la entrada de la
neblina; Drimys winteri (Winteraceae) que tiende a estar agregada en el núcleo de los
grandes parches de bosque; y Myrceugenia correifolia (Myrtaceae) que es más común
en los parches pequeños y está normalmente confinada en los bordes sotavento más
secos (del-Val et al. 2006; Gutiérrez et al. 2008). Estas distribuciones están
determinadas por contrastantes patrones de regeneración y mortalidad dentro de los
parches. El reclutamiento está concentrado en los bordes húmedos en barlovento y es
tres veces mayor que en sotavento, mientras que la mortalidad es mayor en el borde
sotavento opuesto al ingreso de la neblina costera (del-Val et al. 2006). Los
contrastantes patrones de distribución de estas especies arbóreas ofrecen una gran
oportunidad para valorar los mecanismos subyacentes a su habilidad para tolerar las
condiciones secas y la variación en esos mecanismos a lo largo de gradientes de
humedad espacial determinados por la entrada de la niebla.
Las preguntas e hipótesis que se abordarán en esta tesis son las siguientes:
5
1) ¿La variación de los rasgos foliares e hidráulicos relacionados con la
tolerancia a la sequía explican los patrones de distribución contrastantes de tres especies
arbóreas dominantes a través de gradientes de humedad a pequeña escala en los
fragmentos de bosque del Parque Nacional Fray Jorge?
Se espera que especies que crecen en sotavento bajo condiciones de déficit
hídrico presenten un grupo de rasgos que favorezcan la conservación del agua (menor
conductancia estomática) y que reduzcan el riesgo de cavitación (vasos angostos) con el
costo de una menor efi ciencia hidráulica y fotosintética.
2) ¿Qué adaptaciones o mecanismos le permiten a los individuos de A.
punctatum y M. correifolia crecer en los fragmentos pequeños o en los bordes secos de
sotavento para lidiar con el déficit hídrico en comparación con individuos
conespecíficos que creen en los núcleos húmedos de los fragmentos?
Se espera que individuos que crecen en el borde seco en sotavento presenten
rasgos fisiológicos que favorezcan la tolerancia a la sequía como menor πtlp y π0, en
comparación con individuos conespecíficos que crecen en los núcleos húmedos de los
fragmentos.
Se espera que los individuos que crecen en fragmentos pequeños y en los bordes
secos de sotavento tengan rasgos que favorezcan la conservación del agua como mayor
densidad de tricomas y LMA y que reduzcan el riesgo de cavitación disminuyendo el
diámetro de sus vasos conductores.
3) ¿La variabilidad e integración fenotípica incrementan en sotavento con mayor
variabilidad ambiental y menor disponibilidad de agua?
Se espera que la variabilidad e integración fenotípicas incrementen en los bordes
de sotavento debido a la mayor variabilidad ambiental e incremento en el déficit hídrico.
Las especies arbóreas que viven en los bosques de neblina del Parque Nacional
Fray Jorge han estado expuestas a un incremento en la aridez debido a cambios
climáticos ocurridos por periodos extendidos de tiempo (Villagrán et al. 2004; Gutiérrez
et al. 2008), y han enfrentado cambios estacionales en la producción de la neblina que
generan pronunciados gradientes de humedad dentro de los fragmentos (del-Val et al.
2006). Este estudio revela algunos de los mecanismos clave que explican el éxito de
esas especies para coexistir dadas las variaciones pasadas y actuales en la disponibilidad
de humedad del suelo. Los resultados se discuten a la luz de las posibles consecuencias
de futuros cambios climáticos y sus efectos sobre la distribución y coexistencia de
especies.

6
Estructura de la tesis
En consideración a lo expuesto, en este proyecto de tesis se plantea como
objetivo central estudiar los mecanismos fisiológicos que ayudan a explicar los patrones
contrastantes de distribución y abundancia observados en las tres especies arbóreas
dominantes en los fragmentos de bosque del Parque Nacional Fray Jorge: Aextoxicon
punctatum, Drimys winteri y Myrceugenia correifolia.
La intercepción de la niebla por parte de la vegetación en los bosques del Parque
Nacional Fray Jorge genera fuertes gradientes de humedad del suelo, donde las zonas
sotavento son más secas que los otros dos microhábitats, mientras que la humedad del
suelo en las zonas barlovento (ingreso de la neblina) es comparable con los núcleos de
los fragmentos (véase capitulo 1). Las especies arbóreas dominantes están distribuidas
diferencialmente a través de este gradiente de humedad del suelo. Así, Aextoxicon
punctatum (Aextoxicaceae), ocurre en todas las zonas de los parches pero prefiere el
borde barlovento que recibe directamente la entrada de la neblina, Drimys winteri
(Winteraceae) tiende a estar agregada en el núcleo de los grandes parches de bosque y
Myrceugenia correifolia (Myrtaceae) es más común en los parches pequeños y está
normalmente confinada en los bordes sotavento más secos (del-Val et al. 2006;
Gutiérrez et al. 2008). Primero se estudiaron los rasgos foliares (área foliar, área foliar
específica, tasa fotosintética, conductancia estomática) e hidráulicos (diámetro y
densidad de vasos conductores, conductividad hidráulica específica de la madera y valor
Huber) relacionados con la tolerancia a la sequía en las tres especies arbóreas (véase
capitulo 1). Adicionalmente, se realizaron curvas presión-volumen para los individuos
que crecen en el borde seco sotavento y en el núcleo húmedo, con el objetivo de
entender cuáles eran los mecanismos de las especies para lidiar con el déficit hídrico
(ajuste osmótico o incremento en la elasticidad celular) en sotavento en comparación
con individuos conespecíficos que creen en los núcleos húmedos de los fragmentos
(véase capitulo 1).
Para entender la habilidad de Aextoxicon punctatum para sobrevivir a través del
gradiente de humedad del suelo, primero se estudió la magnitud y variabilidad de los
rasgos foliares (área foliar específica, densidad de estomas y de tricomas) e hidráulicos
(diámetro y densidad de vasos conductores y conductividad hidráulica específica de la
madera) relacionados con la tolerancia a la sequía a través de las tres zonas en los
parches (ver capítulo 2); y segundo se estudió la integración fenotípica entre los rasgos
7
funcionales evaluados en cada una de las zonas de humedad del suelo de los parches
(ver capítulo 2).
Esta tesis revela mecanismos fisiológicos clave que ayudan a explicar la
distribución contrastante de las especies arbóreas a través de zonas y parches en el
Parque Nacional Fray Jorge, y aporta información útil para intentar predecir la respuesta
de estas especies a futuros cambios globales como la fragmentación y el cambio
climático.
Área de estudio
El área de estudio está ubicada en el Parque Nacional Fray Jorge, localizado en la región
de Coquimbo (Chile) (30°40´S, 71°35´W) (Figura 1). El clima es Mediterráneo árido
caracterizado por veranos cálidos y secos e inviernos húmedos y fríos (Di Castri y
Hajek 1976). La temperatura promedio es de 13.6°C y la precipitación promedio es de
147 mm concentradas en los meses de Junio a Agosto (López-Cortez y López 2004).
Durante los meses de Octubre a Enero hay mayor incidencia de la niebla costera, la cual
puede aportar anualmente alrededor de 250 mm adicionales a las precipitaciones (del
Val et al. 2006). Esta neblina está asociada con el agua fría generada por la corriente de
Humboldt e inversión producidos por la subsidencia Anticiclón Pacífico Sur (Cereceda
et al. 2002).
Los fragmentos de bosque de neblina varían entre 0,1 y 36 ha (Barbosa et al.
2010) y se encuentran rodeados por una matriz de vegetación xerofítica y cactáceas.
Están localizados entre los 400 y 600 m de altitud, representando el límite norte de
distribución del bosque templado dominado por Aextoxicon punctatum, el cual tiene una
distribución continua cerca de 1000 km hacia el sur del país (37°-43°S) (Smith-Ramírez
et al. 2005). Florísticamente los fragmentos de bosque están dominados en su estrato
arbóreo por Aextoxicon punctatum, género monotípico de una familia endémica de los
bosques templados de Sudamérica (Aextoxicaceae), y otras especies como Myrceugenia
correifolia (Myrtaceae), Rhaphithamnus spinosus (Verbenaceae), Drymis winteri
(Winteraceae) y Azara microphylla (Flacourtiaceae) (Villagrán et al. 2004). Tienen
importantes trepadoras y epífitas leñosas y herbáceas como Griselinia scandens
(Griseliniaceae), Sarmienta repens (Gesneriaceae) y Mitraria coccinea (Gesneriaceae)
(Villagrán et al. 2004), incluyendo helechos como Polypodium e Hymenophyllum.
8
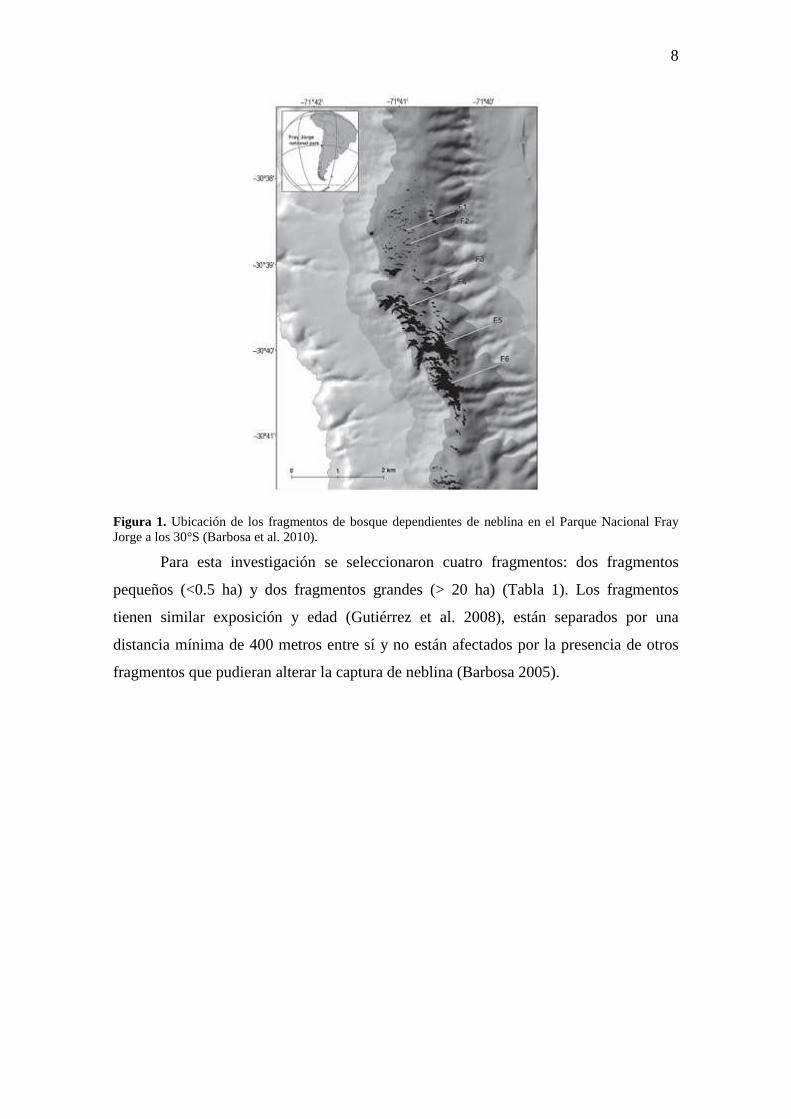
Figura 1. Ubicación de los fragmentos de bosque dependientes de neblina en el Parque Nacional Fray Jorge a los 30°S (Barbosa et al. 2010).
Para esta investigación se seleccionaron cuatro fragmentos: dos fragmentos
pequeños (<0.5 ha) y dos fragmentos grandes (> 20 ha) (Tabla 1). Los fragmentos
tienen similar exposición y edad (Gutiérrez et al. 2008), están separados por una
distancia mínima de 400 metros entre sí y no están afectados por la presencia de otros
fragmentos que pudieran alterar la captura de neblina (Barbosa 2005).
9
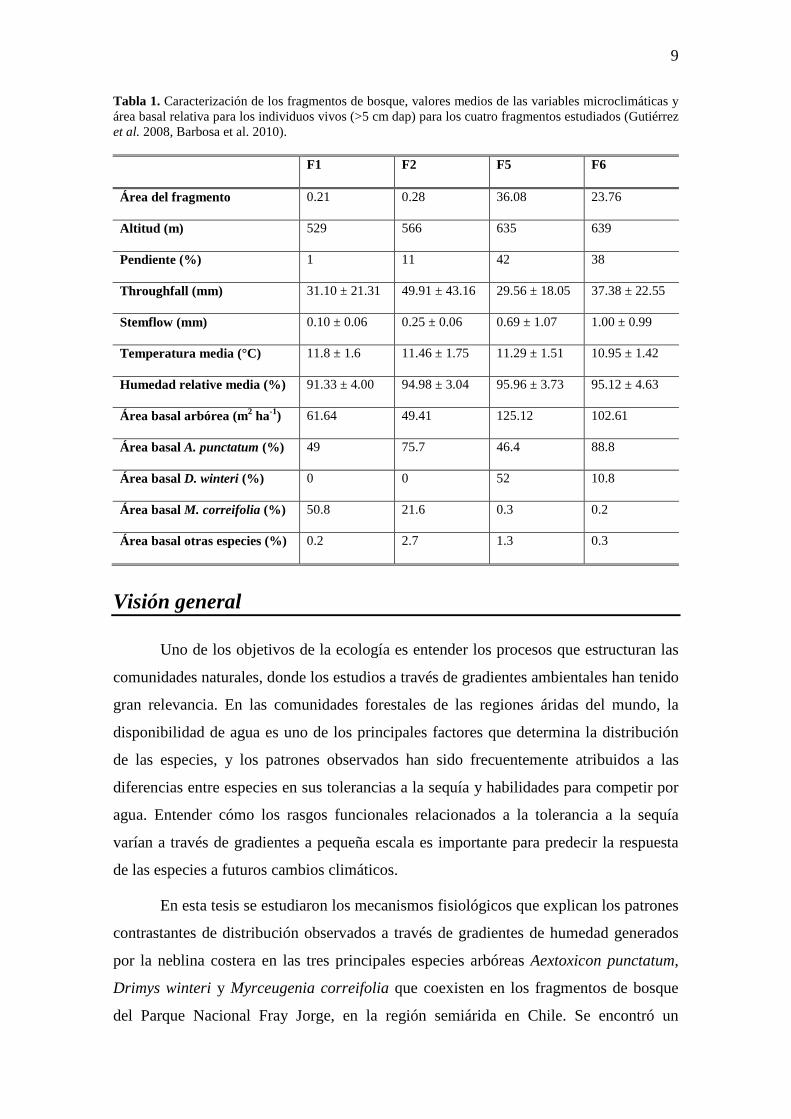
Tabla 1. Caracterización de los fragmentos de bosque, valores medios de las variables microclimáticas y área basal relativa para los individuos vivos (>5 cm dap) para los cuatro fragmentos estudiados (Gutiérrez et al. 2008, Barbosa et al. 2010). F1 F2 F5 F6
Área del fragmento 0.21 0.28 36.08 23.76
Altitud (m) 529 566 635 639
Pendiente (%) 1 11 42 38
Throughfall (mm) 31.10 ± 21.31 49.91 ± 43.16 29.56 ± 18.05 37.38 ± 22.55
Stemflow (mm) 0.10 ± 0.06 0.25 ± 0.06 0.69 ± 1.07 1.00 ± 0.99
Temperatura media (°C) 11.8 ± 1.6 11.46 ± 1.75 11.29 ± 1.51 10.95 ± 1.42
Humedad relative media (%) 91.33 ± 4.00 94.98 ± 3.04 95.96 ± 3.73 95.12 ± 4.63
Área basal arbórea (m2 ha-1) 61.64 49.41 125.12 102.61
Área basal A. punctatum (%) 49 75.7 46.4 88.8
Área basal D. winteri (%) 0 0 52 10.8
Área basal M. correifolia (%) 50.8 21.6 0.3 0.2
Área basal otras especies (%) 0.2 2.7 1.3 0.3
Visión general
Uno de los objetivos de la ecología es entender los procesos que estructuran las
comunidades naturales, donde los estudios a través de gradientes ambientales han tenido
gran relevancia. En las comunidades forestales de las regiones áridas del mundo, la
disponibilidad de agua es uno de los principales factores que determina la distribución
de las especies, y los patrones observados han sido frecuentemente atribuidos a las
diferencias entre especies en sus tolerancias a la sequía y habilidades para competir por
agua. Entender cómo los rasgos funcionales relacionados a la tolerancia a la sequía
varían a través de gradientes a pequeña escala es importante para predecir la respuesta
de las especies a futuros cambios climáticos.
En esta tesis se estudiaron los mecanismos fisiológicos que explican los patrones
contrastantes de distribución observados a través de gradientes de humedad generados
por la neblina costera en las tres principales especies arbóreas Aextoxicon punctatum,
Drimys winteri y Myrceugenia correifolia que coexisten en los fragmentos de bosque
del Parque Nacional Fray Jorge, en la región semiárida en Chile. Se encontró un

10
continuo de estrategias en el uso de agua que permitieron explicar la distribución de las
especies a través del gradiente de humedad: en un extremo la especie Drimys winteri,
con rasgos favoreciendo la eficiencia hidráulica y fotosintética; mientras que en el
extremo opuesto la especie Myrceugenia correifolia, con rasgos favoreciendo la
conservación del agua y reduciendo el riesgo a la cavitación. La especie con amplia
distribución Aextoxicon punctatum, mostró valores de rasgos intermedios, con variación
en los rasgos foliares y ausencia de variación en la anatomía del xilema a través de las
zonas dentro de los fragmentos. En Aextoxicon punctatum se detectaron mayores niveles
de integración fenotípica y variabilidad en los bordes secos.
11
Referencias
Ackerly DD, Cornwell WK. 2007. A trait-based approach to community assembly: partitioning of species trait values into within- and among-community components. Ecology Letters 10: 135-145.
Albert CH, Thuiller W, Yoccoz NG, Soudant A, Boucher F, Saccone P, Lavorel S. 2010a. Intraspecific functional variability: extent, structure and sources of variation. Journal of Ecology 98: 604-613.
Albert CH, Thuiller W, Yoccoz NG, Douzet R, Aubert S, Lavorel S. 2010b A multi-trait approach reveals the structure and the relative importance of intra- vs. interspecific variability in plant traits. Functional Ecology 24: 1192-1201.
Baldini E, Facini O, Nerozzi F, Rossi F, Rotondi A. 1997. Leaf characteristics and optical properties of different woody species. - Trees 12: 73-81.
Baraloto C, Paine CET, Poorter L, Beauchene J, Bonal D, Domenach AM, Herault B, Patiño S, Roggy JC, Chave J. 2010. Decoupled leaf and stem economics in rain forest trees. Ecology Letters 13: 1338-1347.
Barbosa O, Marquet PA, Bacigalupe LD, Christie DA, del-Val E, Gutiérrez AG, Jones CG, Weathers KC, Armesto JJ. 2010. Interactions among patch area, forest structure and water fluxes in a fog-inundated forest ecosystem in semi-arid Chile. Functional Ecology 24: 909-917.
Bongers F, Poorter L, Van Rompaey RSAR, Parren MPE (1999) Distribution of twelve moist forest canopy tree species in Liberia and Cote d’Ivoire: response curves to a climatic gradient. Journal of Vegetation Science 10: 371–382
Brodribb TJ, Feild TS. 2000. Stem hydraulic supply is linked to leaf photosynthetic capacity: evidence from New Caledonian and Tasmanian rainforests. Plant, Cell and Environment 23: 1381-1388.
Brodribb TJ, Holbrook NM, Gutiérrez MV. 2002. Hydraulic and photosynthetic co-ordination in seasonally dry tropical forest trees. Plant, Cell and Environment 25: 1435–1444.
Cereceda P, Osses P, Larraín H, Farías M, Lagos M, Pinto R, Schemenauer RS (2002) Advective, orographic and radiation fog in the Tarapacá region, Chile. Atmosphere Research 64: 261–271.
Chave J, Coomes D, Jansen S, Lewis SL, Swenson NG, Zanne AE. 2009. Towards a worldwide wood economics spectrum. Ecology Letters 12: 351–366.
Choat B, Marilyn CB, Luly JG, Holtum JAM. 2005. Hydraulic architecture of deciduous and evergreen dry rainforest tree species from north-eastern Australia. Trees-Struct Funct 19:305-311.
Choat B, Jansen S, Brodribb TJ, Cochard H, Delzon S, Bhaskar R, Bucci SJ, Field TS, Gleason SM, Hacke UG, Jacobsen AL, Lens F, Maherali H, Martínez-Vilalta J, Mayr S, Mencuccini M, Mitchell PJ, Nardini A, Pittermann J, Pratt RB, Sperry JS, Westoby M, Wright IJ, Zanne AE. 2012. Global convergence in the vulnerability of forests to drought. Science 491: 752-756.
Condit R. 1998. Ecological implications of changes in drought patterns: shift in forest composition in Panama. Climate Change 39: 413–427.
12
Condit R, Pitman N, Leigh EG Jr, Chave J, Terborgh J, Foster RB, Nuñez-V P, Aguilar S, Valencia R, Villa G, Muller-Landau HC, Losos E, Hubbell SP. 2002. Beta-diversity in tropical forest trees. Science 295: 666–669.
Cornwell WK, Ackerly DD. 2009. Community assembly and shifts in plant trait distributions across an environmental gradient in coastal California. Ecological Monographs 79: 109-126.
Dawson TE. 1998. Fog in the California redwood forest: ecosystem inputs and use by plants. Oecologia 117: 476–485.
Díaz S, Hodgson JG, Thompson K, Cabido M, Cornelissen JHC, Jalili A, Montserrat-Martí G, Grime JP, Zarrinkamar F, Asri Y, Band SR, BasconceloS1, Castro-Díez P, Funes G, Hamzehee B, Khoshnevi M, Pérez-Harguindeguy N, Pérez-Rontomé MC, Shirvany FA, Vendramini F, Yazdani S, Abbas-Azimi R, Bogaard A, Boustani S, Charles M, Dehghan M, de Torres-Espuny L, FalczukV, Guerrero-Campo J, Hynd A, Jones G, Kowsary E, Kazemi-Saeed F, Maestro-Martínez M, Romo-Díez A, Shaw S, Siavash B, Villar-Salvador P, Zak MR. 2004. The plant traits that drive ecosystems: Evidence from three continents. Journal of Vegetation Science 15: 295-304.
del-Val E, Armesto JJ, Barbosa O, Christie DA, Gutie´rrez AG, Jones CG, Marquet PA, Weathers KC. 2006. Rain forest islands in the Chilean semiarid region: fog-dependency, ecosystem persistence and tree regeneration. Ecosystems 9: 598–608.
Di Castri F, Hajek E. 1976. Bioclimatología de Chile. Universidad Católica de Chile, Santiago
Engelbrecht BMJ, Comita LS, Condit R, Kursar TA, Tyree MT, Turner BL, Hubbell SP. 2007. Drought sensitivity shapes species distribution patterns in tropical forests. Nature 447: 80–83.
Ewing HA, Weathers KC, Templer PH, Dawson TE, Firestone MK, Elliott AM, Boukili VKS. 2009. Fog water and ecosystem function: heterogeneity in a California redwood forest. Ecosystems 12: 417–433.
Fahn, A. 1986. Structural and functional properties of trichomes of xeromorphic leaves. Annals of Botany 57: 631-637
Gentry AH. 1988. Changes in plant community diversity and floristic composition on environmental and geographic gradients. Annals of Missouri Botanical Garden 75:1–34.
Gutiérrez AG, Barbosa O, Christie DA, del-Val E, Ewing HA, Jones CG, Marquet PA, Weathers KC, Armesto JJ. 2008. Regeneration patterns and persistence of the fog dependent Fray Jorge forest in semiarid Chile during the past two centuries. Global Change Biology 14: 161–176.
Hacke UG, Sperry JS, Pockman WT, Davis SD, McCulloh K. 2001. Trends in wood density and structure are linked to prevention of xylem implosion by negative pressure. Oecologia 126: 457-461.
Hildebrandt A, Eltahir EAB. 2006. Forest on the edge: seasonal cloud forest in Oman creates its own ecological niche. Geophysical Research Letter 33: L11401.
13
Hulshof CM, Swenson NG. 2010. Variation in leaf functional trait values within and across individuals and species: an example from a Costa Rican dry forest. Functional Ecology 24: 217–223.
Katata G, Nagai H, Kajino M, Ueda H, Hozumi Y. 2010. Numerical study of fog deposition on vegetation for atmosphere–land interactions in semi-arid and arid regions. Agricicultural Forest Meteoroly 150: 340–353
López-Cortés F, López D. 2004. Antecedentes bioclimáticos del Parque Nacional Bosque Fray Jorge. In: Squeo FA, Gutiérrez JR, Hernández IR (eds) Historia natural del parque nacional bosque Fray Jorge. Ediciones Universidad de La Serena, Chile, pp 45–60.
Markesteijn L, Poorter L, Bongers F, Paz H, Sack L. 2011a. Hydraulics and life history of tropical dry forest tree species: coordination of species’ drought and shade tolerance. New Phytology 191:480-495.
Markesteijn L, Poorter L, Paz H, Sack L, Bongers F. 2011b. Ecological differentiation in xylem cavitation resistance is associated with stem and leaf structural traits. Plant Cell Environ 34:137-148.
Meinzer FC, Woodruff DR, Domec JC, Goldstein G, Campanello PI, Gatti MG, Villalobos-Vega R. 2008. Coordination of leaf and stem water transport properties in tropical forest trees. Oecologia 156: 31–41.
Nicotra AB, Chazdon RL, Schlichting DS. 1997. Patterns of genotypic variation and phenotypic plasticity of light response in two tropical Piper (Piperaceae) species. American Journal of Botany 84: 1542-1552.
Niinemets, U. 2001. Global-scale climatic controls of leaf dry mass per area, density and thickness in trees and shrub. Ecology 82: 453-469.
Pigliucci M, Kolodynska A. 2003. Phenotypic plasticity and integration in resonse to flooded conditions in natural accessions of Arabidopsis thaliana (L.) Heynh (Brassicaceae). Annals of Botany 90: 199-207.
Poockman WT, Sperry JS. 2000. Vulnerability to xylem cavitation and the distribution of Sonoran Desert. American Journal of Botany 87: 1287-1299.
Poorter L. 2007. Are species adapted to their regeneration niche, adult niche, or both? Am Nat 169: 433–442
Pyke CR, Condit R, Aguilar S, Lao S. 2001. Floristic composition across a climatic gradient in a neotropical lowland forest. Journal of Vegetation Science 12: 553–566.
Reich PB, Wright IJ, Cavender-Bares J, Craine JM, Oleksyn J, Westoby M, Walters MB. 2003. The evolution of plant functional variation: traits, spectra, and strategies. International Journal of Plant Sciences 164: S143–S164.
Salgado-Negret B, Pérez F, Markesteijn L, Jiménez-Castillo M, Armesto JJ. 2013. Diverging drought-tolerance strategies explain tree species distribution along a fog-dependent moisture gradient in a temperate rain forest. Oecologia. DOI 10.1007/s00442-013-2650-7
Santiago LS, Goldstein G, Meinzer FC, Fisher JB, Machado K, Woodruff D, Jones T. 2004. Leaf photosynthetic traits scale with hydraulic conductivity and wood density in Panamanian forest canopy trees. Oecologia 140: 543-550.
14
Sardans J, Peñuelas J, Rodá F. 2006. Plasticity of leaf morphological traits, leaf nutrient content, and water capture in the Mediterranean evergreen oak Quercus ilex subsp. ballota in response to fertilization and changes in competitive conditions. Ecoscience 13: 258-270.
Smith-Ramírez C, Rovere AE, Núñez-Avila MC, Armesto JJ. 2007. Habitat fragmentation and reproductive ecology of Embothirum coccineum, Eucryphia cordifolia and Aextoxicon punctatum in southern temperate rainforests. In: (A.C. Newton, ed), “ Biodiversity Loss and Conservation in Fragmented Forest Landscapes: The Forests of Montane Mexico and Temperate South America" , pp. 102-119.
Sterck F, Markesteijn L, Schieving F, Poorter L. 2011. Functional traits determine trade-offs and niches in a tropical forest community. Proceedings of the National Academy of Scienes 108: 20627-20632.
Villagrán C, Armesto JJ, Hinojosa LF, Cuvertino J, Pérez C, Medina C. 2004. El enigmático origen del bosque relicto de Fray Jorge. In ‘Historia natural del parque nacional bosque Fray Jorge’. (Eds FA Squeo, JR Gutiérrez, IR Hernández) pp. 3–43.
Weathers KC, Lovett GM, Likens GE, Caraco NFM. 2000. Cloud-water inputs of nitrogen to forest ecosystems in southern Chile: forms, fluxes and sources. Ecosystems 3: 590–595.
Wright SJ. 1992. Seasonal drought, soil fertility and the species density of tropical forest plant communities. Trends in Ecology and Evolution 7: 260–263.
Wright IJ, Reich PB, Westoby M, Ackerly DD, Baruch Z, Bongers F, Cavender-Bares J, Chapin T, Cornelissen JH, Diemer M, Flexas J, Garnier E, Groom PK, Gulias J, Hikosaka K, Lamont BB, Lee T, Lee W, Lusk C, Midgley JJ, Navas ML, Niinemets U, Oleksyn J, Osada N, Poorter H, Poot P, Prior L, Pyankov VI, Roumet C, Thomas SC, Tjoelklaas MG, Veneklaas EJ, Villar R. 2004. The worldwide leaf economics spectrum. Nature 428: 821-827.
Wright IJ, Falster DS, Pickup M, Westoby M. 2006. Cross-species patterns in the coordination between leaf and stem traits, and their implications for plants hydraulics. Physiologia Plantarum 127: 445-456.
Zanne AE, Westoby M, Falster DS, Ackerly DD, Loarie SR, Arnold SEJ, Coomes DA. 2010. Angiosperm wood structure: global patterns in vessel anatomy and their relation to wood density and potential conductivity. American Journal of Botany 97: 207-215.

15
CAPÍTULO I
II. Estrategias divergentes de tolerancia a la
sequía explican la distribución de especies
arbóreas a través de un gradiente de humedad
dependiente de neblina en un bosque lluvioso
templado
Salgado-Negret B, Pérez F, Markesteijn L, Jimenez-Castillo M, Armesto JJ. 2013.
Diverging drought tolerance strategies explain tree species distribution along a fog-
dependent moisture gradient in a temperate rain forest. Oecologia DOI 10.1007/s00442-
013-2650-7
16
Diverging drought tolerance strategies explain tree species distribution along a fog-
dependent moisture gradient in a temperate rain forest
Beatriz Salgado Negret1,2,*, Fernanda Pérez1,2, Lars Markesteijn3, Mylthon Jiménez
Castillo4,5, Juan J. Armesto1,2
1Departamento de Ecología, Pontificia Universidad Católica de Chile, Casilla 114-D,
Santiago, Chile; 2Instituto de Ecología y Biodiversidad, Casilla 653, Santiago, Chile; 3Departamento de Biogeografía y Cambio Global, Museo Nacional de Ciencias Naturales,
Consejo Superior de Investigaciones Científicas (CSIC), Serrano 115 dpdo, E-28006,
Madrid, Spain; 4Instituto de Ciencias Ambientales y Evolutivas, Universidad Austral de
Chile, Casilla 567, Valdivia-Chile; 5Jardín Botánico Universidad Austral de Chile, Facultad
de Ciencias, Universidad Austral de Chile, Casilla 567, Valdivia-Chile.
*Author for correspondence:
Beatriz Salgado Negret
56-2-3542637

17
Abstract
The study of functional traits and physiological mechanisms determining species´ drought
tolerance is important to predict their responses to climatic change. Fog-dependent forest
patches in semiarid regions are a good study system to understand species responses to
increasing aridity and patch fragmentation.
Here we measured leaf and hydraulic traits for three dominant species with
contrasting distributions within patches in relict, fog-dependent forests in semiarid Chile. In
addition, we assessed pressure-volume curve parameters in trees growing at dry leeward
edge and wet patch core.
We predicted species would display contrasting suites of traits according to local
water availability: from one end favoring water conservation and reducing cavitation risk,
to opposite end favoring photosynthetic and hydraulic efficiency. Consistent with our
hypothesis, we identified a continuum of water use strategies explaining species
distribution along small-scale moisture gradient. Drimys winteri, a tree restricted to the
humid core, showed traits allowing efficient water transport and high carbon gain; in
contrast, Myrceugenia correifolia, a tree that occurs in the drier patch edges, exhibited traits
promoting water conservation and lower gas exchange rates, as well low water potential at
turgor loss point. The most widespread species, Aextoxicon punctatum, showed
intermediate trait values. Osmotic compensatory mechanism was detected in M. correifolia,
but not in A. punctatum.
We show that partitioning of the pronounced soil moisture gradients from patch
cores to leeward edges among tree species is driven by differential drought tolerance. Such
differences indicate that trees have contrasting abilities to cope with future reductions in
soil moisture.
Keywords
Climate change, fog-dependent forest, local water gradient, species distribution, plant
hydraulic traits.

18
Introduction
Water availability is a major factor influencing species distribution in forest communities
across large-scale rainfall gradients as well as small-scale topographic gradients (Gentry
1988; Wright 1992; Condit 1998; Bongers et al. 1999; Pyke et al. 2001; Condit et al. 2002;
Engelbrecht et al. 2007). Species’ distribution may be explained by functional trait
divergence associated with performance under particular conditions of soil humidity
(Poorter 2007; Markesteijn et al. 2011a; Sterck et al. 2011). Understanding the bases of
such differentiation among forest trees may be critical for predicting the ecological
consequences of future alteration of soil moisture gradients due to climate change.
Fog-dependent forests, found in semiarid regions of the world (Hildebrandt and
Eltahir 2006; del-Val et al. 2006; Katata et al. 2010), are thought to be relicts from past
periods when conditions were more humid, and thus these ecosystems might be especially
sensitive to current changes in fog water supply. Alterations in fog frequency and intensity
are predicted to occur due to changes in sea-surface temperature and the height of the
temperature inversion layer (Cereceda et al. 2002), loss of forest patch area and
fragmentation, or changes in forest structure affecting fog capture (Hildebrandt and Eltahir
2006). In these patchy forests, fog interception by plants is the primary or even the only
source of water during most of the year (Dawson 1998; del-Val et al. 2006; Ewing et al.
2009). The fog interception by trees creates pronounced water and nutrient gradients from
windward to leeward edges in forest patches (Weathers et al. 2000; del-Val et al. 2006;
Ewing et al. 2009), with strong contrasts over short distances, depending on wind direction
(Ewing et al. 2009). Studying tree species responses to soil moisture variation at short
spatial scales, due to topographic and/or patch fragmentation gradients in these fog-
dependent ecosystems, allows us to address questions about the critical conditions for
sustaining tree species under increasing drought stress due to changing climate.
Our study site, the Fray Jorge forest in central Chile, is a striking example of such a
fog dependent ecosystem, where the strong water (and possibly nutrient) gradients inside
the isolated forest patches affect the distribution and regeneration dynamics of tree species
(del-Val et al. 2006). The patches are dominated by species characteristic of temperate and
Mediterranean forests in Chile: Aextoxicon punctatum (in the monotypic family

19
Aextoxicaceae) is found in all-size patches but it is more frequent in humid windward
edges, directly facing the incoming fog; Drimys winteri (Winteraceae) tends to be
aggregated in the interior of the largest forest patches and is not found in small patches;
finally, Myrceugenia correifolia (Myrtaceae) is more common along the edges of small
patches, including the drier leeward edge (del-Val et al. 2006; Gutiérrez et al. 2008). Such
contrasting distribution patterns, and the pronounced short-distance, environmental
gradients related to moisture supply by fog, offer a great opportunity to investigate the
physiological mechanisms that explain tree species ability to respond to abrupt and
pronounced changes in climate due global warming.
Convergence in leaf traits reducing water loss by transpiration, as well as hydraulic
traits favouring safety at the expense of hydraulic efficiency, has been reported for plants
that are periodically exposed to severe water deficit (Mitchell et al. 2008; Markesteijn et al.
2011a,b). Such plants usually show narrower and shorter vessels with small pit pores,
which are more resistant to drought-induced cavitation, but at the same time have an
increased flow resistance and a lower hydraulic efficiency (Hacke et al. 2001; Choat et al.
2005; Mitchell et al. 2008; Markesteijn et al. 2011a,b), affecting leaf water supply. The
capacity to maintain leaf turgor in response to decreasing soil moisture availability is also
an important mechanism that favours drought tolerance (Kozlowski and Pallardy 2002;
Baltzer et al. 2008; Kursar et al. 2009; Bartlett et al. 2012). Water potential at loss turgor
point (πtlp) is a critical physiological determinant of a plant’s tolerance to water stress
(Bartlett et al. 2012). Plants can reduce πtlp by accumulating osmotically active compounds
in the cells (osmotic adjustment) or by increased cell wall flexibility (elasticity, ε).
However, recently Bartlett et al. (2012) showed no direct role for ɛ in driving differences in
πtlp across species, instead, elastic adjustments acted to maintain relative water content at
turgor loss point (RWCtlp) despite very negative water potentials at full turgor (π0) and πtlp.
Here, we measured leaf and hydraulic traits of the three main tree species occurring
in fog-inundated rain forest patches of Fray Jorge (semiarid Chile), which show contrasting
distribution patterns along the soil moisture gradient produced by fog influx. We also
compared pressure-volume curves traits of individuals growing at windward and leeward
edges of forest patches.
20
Specifically, we addressed the following questions: 1) How does the variation in
functional traits related to drought tolerance explain species distribution along small-scale
moisture gradients? 2) What mechanisms allow individuals growing along the drier leeward
edges to cope with reduced water availability (such as osmotic adjustment or increased cell
elasticity) in comparison with conspecific individuals growing in wetter patch core
habitats? We expect that species growing in small patches and leeward patch edges would
display a suite of leaf traits favoring water conservation (such a reduced stomatal
conductance) and a suite of hydraulic traits reducing cavitation risk (such as narrow
vessels), at the expense of photosynthesis and hydraulic efficiency. We also predict that
individuals growing at leeward patch edge would have pressure-volume traits values
favoring drought tolerance (such as lower πtlp and π0) in comparison with conspecific
individuals growing in wetter patch core.
Tree species occurring in the fog forest of Fray Jorge are exposed to increased
aridity due to climatic changes over an extended period of time (Villagrán et al. 2004;
Gutiérrez et al. 2008), facing seasonal changes in fog influx that drive pronounced moisture
gradients within patches (del-Val et al. 2006). This study aims to reveal some of the basic
mechanisms underlying the relative success of these species to coexist given past and
current variations in moisture availability. Here, we will further discuss results in the light
of the possible consequences of future climate change and its effects on species’
distribution and coexistence.
Materials and methods
Study site and species
Fray Jorge National Park (30°40´S. 71°30´W) comprises the northernmost patches of
Chilean temperate rainforests, dominated by broad-leaved evergreen tree species, which
exhibit remarkable floristic affinities with temperate forests located some 1000 km to the
south (Villagrán et al. 2004). The area contains a mosaic of about 180 forest patches
ranging in size from 0.1 to 36 ha, located on the summits of coastal mountains at an
elevation of 450 to 660 m, surrounded by a matrix of semiarid scrub vegetation (Barbosa et

21
al. 2010). The regional climate is Mediterranean-arid with a mean annual rainfall of 147
mm concentrated during the cool winter months from May to August and a mean annual
temperature of 13.6°C (López-Cortés and López 2004). Fog is a prominent and constant
feature of the landscape above 400 m elevation especially during spring and summer
months, when fragments can receive an additional input of at least 200 mm of cloud water
annually via throughfall and stemflow (del-Val et al. 2006).
A large 36 ha patch was selected for this study because it was the only one where all
three focal tree species coexist. Additional details on the structure and physical gradients of
patches are given by Barbosa et al. (2010). The forest patch studied was located at an
altitude of 635 m, with average air temperatures inside the patch varying from 9.2°C in
spring (October to December) to 13.3°C in winter (July to September) and relative air
humidity varying between 83.6% in winter and 99.6% in spring-summer.
The forest canopy is dominated by A. punctatum (Aextoxicaceae), with juveniles
occurring more frequently along the edge directly receiving fog influx (windward), but
adults found throughout patch, and co-dominated by D. winteri (Winteraceae), which tends
to be aggregated inside the patch. M. correifolia (Myrtaceae) is occasionally represented in
the canopy of the forest patch (0.3% basal area) but it is confined to the drier leeward edge
(Gutiérrez et al. 2008). Volumetric soil moisture varies substantially in both small and large
patches. Leeward edges are drier than the other two microhabitats, while soil moisture at
the windward edges is comparable with patch core (25 measurements per zone in A.
punctatum individuals): small patches; windward: 10.43% ± 1.01; core: 12.13% ± 1.12;
leeward: 5.02% ± 0.49 and large patches; windward: 9.25% ± 0.62; core: 14.59% ± 0.72;
leeward: 4.72% ± 0.30) (Salgado-Negret unpublished data). Volumetric soil moisture for
our species measured at 20 cm depth, varied accordingly across sites occupied by the
different tree species (30 measurements per species): D. winteri (22.9% ± 2.66), A.
punctatum (13.4% ± 1.7) and M. correifolia (5.3% ± 0.53) (p<0.0001; F=23.01; d.f.=2)
(Salgado-Negret unpublished data).
The three species have a different phytoclimatic distribution in Chile: A. punctatum
is a tree species endemic of western South America and it is broadly distributed in coastal
forests from 30 - 43°S; D. winteri is distributed from Fray Jorge and central Chile to Sub-

22
Antarctic forest in Tierra del Fuego at 55°S (Villagrán et al. 2004). Finally, M. correifolia
is restricted to central Chile with a Mediterranean climate subjected to a cool rainy winter
and a summer drought period of 2– 3 months (Di Castri and Hajek 1976).
Leaf traits
We measured leaf traits for six individuals (dbh >10 cm) of each tree species using mature,
fully expanded leaves without herbivore damage. All measurements were done on the same
six individuals. CO2 assimilation curves were constructed using the CO2 reference
concentration of 380 ppm, 50% relative humidity, and a temperature of 25° C.
Photosynthesis (AMAX ) and stomatal conductance (gs) were measured in M. correfolia, A.
punctatum and D. winteri at 700, 500 and 700 umol m-2 s-1 respectively, with an open
portable photosynthesis system (CIRAS-2 CRS068, PP Systems, Amesbury, USA)
equipped with a LED light. Measurements were conducted between 10:00 and 13:00 h.
After measurements of gas exchange, leaves were cut and leaf water potentials at midday
were measured (ψMD, MPa) using a pressure chamber (Scholander-type, Model 1000 PMS).
We also measured predawn leaf water potentials (ψPD, MPa) between 5:00 and 7:00 h for
the same six individuals per species.
After measurement, leaves were scanned (EPSON Stylus TX200) and analysed
using ImageJ software (http://imagej.nih.gov/ij/) to determine leaf area (LA). Finally,
leaves were dried for 48h at 65°C to obtain leaf dry mass (g) and calculate leaf mass per
area (LMA; g cm-2) (Cornelissen et al. 2003).
Pressure-volume curves
Pressure-volume curves were constructed for six individuals per species. One shoot was cut
from each individual and the shoots were hydrated with distilled water in plastic bags to
bring leaves to full turgor. Tissue rehydration is necessary to ensure that all samples are
near saturation thus allowing for construction of the entire moisture release curve (Baltzer
et al. 2008). After 24h of rehydration, we constructed pressure-volume curves following the
Sack and Pasquet-Kok protocol (www.prometheuswiki.com). Water potentials of the leaves
23
were measured with a Scholander-type pressure chamber (PMS, Model 1000) and the tissue
was weighed immediately after measurement. The tissue was dehydrated slightly at room
temperature, before re-weighing the leaf mass and re-measuring the water potential. This
process was repeated until the tissue reached constant mass. When there was no further
decrease in mass, leaves were dried for 48h at 80° C to determine dry mass. The following
traits were estimated from the pressure-volume curves: solute potential at full turgor (π0;
MPa), solute potential at turgor loss point (πtlp; MPa), relative water content at turgor loss
point (RWCtlp; %), and the bulk modulus of elasticity (ɛ; MPa).
Hydraulic traits
Maximum vessel length - One branch (2.5 – 10 mm diameter) was cut from the outer crown
of each of six individuals per species and transported to the field station. Here, maximum
vessel lengths were estimated cutting branches approximately 1 m from the distal apex and
applying air pressure (approx. 60 Kpa) (cf. Ewers and Fisher 1989) to the cut end of the
branch. The distal end of the branch was then trimmed back approximately 1 cm at a time
until air bubbles were seen emerging from vessel ends (Brodribb and Feild 2000). The
remaining branch length at this point was then measured as an estimate of Maximum vessel
length (MVL; cm).
Sapwood-specific hydraulic conductivity - A second collection of branches was made from
the same six individuals per species to measure hydraulic conductivity (water flux through
a unit length of stem over a pressure gradient; Kh, in kg m-1 s-1 MPa-1) following Sperry et
al. (1988). In the field station, branches were recut under water to avoid the induction of
new embolisms. Distal ends were trimmed with a razor blade to clear any accidentally
blocked vessels and about 1 cm of the bark at each side of the branch was removed. While
submerged, the shaved end of the branch was wrapped in Parafilm. All branches used for
hydraulic conductivity measurements were cut to the same length (approx. 30 cm). The
branch was connected to a fluid column fed by a reservoir elevated to a height of 1 m,
providing a constant pressure of 9.8 KPa. An electronic balance registered KCl solution
flux as an increase in sample mass each 30 seconds. Measurements were taken when an

24
approximately constant flow was observed for at least 3 min. Afterwards, the stems were
flushed with KCl solution at a pressure of ≈170 KPa for 10-15 minutes to remove emboli
(Sperry et al. 1987) and hydraulic conductivity was measured again at its maximum
capacity. We divided Kh by the cross-sectional area of the conductive xylem (see methods
Hydraulic anatomy below), to standardise the flow of water per unit sapwood area and
obtain sapwood specific hydraulic conductivity (Ks; kg MPa-1 m-1 s-1). As such, hydraulic
conductivity was made comparable among segments of different diameters.
Hydraulic anatomy. The same stems were then perfused with safranin dye to visualize the
conductive wood area. A cross-sectional area of the upper distal end of the stem was
photographed with a digital camera mounted on a microscope, at 10x magnificacion and the
image was processed using the imaging software SigmaScan Pro 5 (SPSS Inc.) to
determine vessel diameter (VD; µm) and density (VDi; vessels mm-2). For each branch, we
calculated the Huber value (Hv; cm2 cm-2) as the cross-sectional sapwood area of the upper
distal end of the stem divided by the total supported leaf area. Finally, for each species,
vessel diameters were divided into 5 µm size classes to construct frequency histograms. In
line with the Hagan-Poiseuille law, the vessel ratios in each size class were raised to the
fourth power and summed to determine the relative contribution of each vessel size class to
overall hydraulic conductance (Choat et al. 2005).
Data analysis
Differences in leaf traits (LMA, LA, gs and AMAX ), hydraulic traits (vessel diameter and
density, Ks and Hv), and traits derived from pressure-volume curves (π0, πtlp, RWCtlp and ɛ)
were contrasted among three tree species using a multivariate analysis of variance
(MANOVA). Because MANOVA showed significant species effects, we conducted a series
of univariate ANOVAs followed by post-hoc Tukey´s tests to identify individual responses
of each trait. Overall multivariate relations and trait differences among species were further
explored using a principal components analysis (PCA). Differences in traits derived from
pressure-volume curves between leeward and core zones from A. punctatum and M.
25
correifolia individuals were analysed with independent-samples t-tests. Statistical analyses
were performed using InfoStat (Di Rienzo et al. 2011).
Results
Species differences in leaf and hydraulic traits
Leaf and hydraulic traits, as well pressure-volume curve related traits, differed substantially
among the three coexisting tree species in Fray Jorge forest (MANOVA; Willk´s = 9.9 x E-
05; F = 33.11; p < 0.0001). Trait differentiation among species is best described by
principal component analysis. The first component, which explained 53% of trait variation,
showed an even contribution of variables with a magnitude of 0.3, and it clearly separated
M. correifolia from D. winteri, placing A. punctatum at an intermediate position (Fig. 1).
This component was negatively correlated with leaf traits that increased water transpiration
and carbon gain (LA, gs, Amax), as well as with the solute potential at full turgor (π0) and
the potential at turgor loss point (πtlp) (Table 1). Then, higher values along the first PCA
component reflect stronger ability to conserve water and tolerate to drought, but lower gas
exchange rates. PCA component 1 was also positively correlated with vessel diameter
(VDi) and negatively correlated with vessel density (VD) (Table 1). The second component
explained an additional 25.3% of the total variance and it separated A. punctatum from the
other two species. This component was dominated by higher values of RWCtlp and lower
values of Hv (Table 1).
Significant differences in leaf traits among species were additionally detected using
separate ANOVAs (Table 2). Accordingly, we found that D. winteri, a tree restricted to the
moist cores of large patches, exhibited a higher stomatal conductance and photosynthetic
rates than the other two species, although its average LMA did not differ from that of A.
punctatum. In turn, we found that M. correifolia, a tree that occurs primarily in the drier
leeward edges, had the smallest leaf area and lower stomatal conductance and
photosynthetic rates. Finally, the most widespread tree species in these patches, A.
punctatum, did not differ in stomatal conductance and photosynthetic rates from M.
correifolia (Table 2, Fig. 2).

26
Clear differences among the three species in traits derived from pressure-volume
curves were also found (Table 2). The two species with more sclerophyllous leaves, A.
punctatum and M. correifolia, showed the lowest πtlp and π0 values, and A. punctatum had
the lowest RWCtlp (Table 2). The latter species also had the lowest ɛ, while values between
the other two tree species did not differ.
Predawn and midday leaf water potentials varied strongly among species (Table 2).
In the summer season, presumably the warmer and drier period of the year, predawn leaf
water potentials (ψPD) ranged from -0.075 MPa to -0.144 MPa, while midday water
potential (ψMD) ranged from -0.28 to -0.35 MPa across the three species. Midday leaf water
potentials never dropped below the turgor loss point, suggesting that species did not suffer
from drought stress during the period of study.
We found significant differences in hydraulic traits among tree species (Table 2).
Hydraulic conductivity and vessel densities were higher and vessel diameters were smaller
for D. winteri than for the other two species (Table 2, Fig 2). Contrary to our predictions,
M. correifolia, the species that is most restricted to the semiarid Mediterranean-climate
region, and presumably better adapted to summer drought, had larger vessel diameters than
the other two species. A. punctatum, a predominantly coastal tree species, with a broad
latitudinal distribution in Chilean forests and in the Fray Jorge forest patch mosaic, showed
the lowest hydraulic conductivity, with intermediate vessel diameters and densities (Table
2, Fig. 2). According to the Hagan-Poiseuille law which states that in theory a vessel’s
hydraulic conductance is proportional to the fourth power of its radius, D. winteri and
A. punctatum hydraulic conductivity depended strongly on the lower vessel size classes (10
to 20 µm), 92.7% and 56.6% respectively (Fig. 3), while M. correifolia showed greater
range of diameter classes and had 52% of its hydraulic conductivity accounted for by the
wider vessel size class (20 to 30 µm) (Fig. 3).
Trait differences between patch core and leeward edge individuals
We compared traits derived from pressure-volume curves between individuals growing in
the patch core (away from edges) and in the leeward edge of the same patches; this
comparison was only possible for A. punctatum and M. correifolia as these species co-

27
occur in these two microhabitats. We did not have comparative data for D. winteri, because
it was never found in patch edges. Most physiological traits obtained from the pressure-
volume curves did not differ between A. punctatum trees in the core and leeward trees
(Table 3), except for parameter ɛ. In the latter case, trees on the leeward edge of patches
had a lower bulk modulus of elasticity than patch core trees. In contrast, M. correifolia
showed clear differences in several attributes between trees sampled in the patch core and
in the drier leeward edge. For this species, πtlp and RWCtlp values were lower at the leeward
edge than at the patch core (Table 3). In the case of M. correifolia, ɛ did not vary between
trees in the core and leeward edge of patches. Significant differences in ψPD and ψMD
between trees in patch core and those in the leeward edge were found for both species, with
the lowest values found for trees at the leeward edge (Table 3). In contrast to M.
correifolia, for A. punctatum trees found at the leeward edge, ψMD dropped below πtlp.
Discussion
Our results indicate that evergreen tree species were able to partition small-scale, but strong
soil moisture gradients, fog-dependent forest patches, due to their differential ability to use
soil water and tolerate drought-related habitat differences. For the three species dominating
the canopy of fog-inundated patches in this semiarid region, we identified a continuous
gradient of water-use strategies. Ecophysiological strategies varied between a set of plant
traits that allows efficient water transport and high carbon gain, at the one end, to traits that
enhance water conservation at the cost of lower gas exchange rates, at the opposite end. At
one end of the continuum we find D. winteri, a tree species restricted to wet microhabitats
in the core of large forest patches, which has high Ks, leaf area, photosynthetic rates and
stomatal conductance. The opposite end of this gradient is occupied by M. correifolia, a
species that is typically found in drier microhabitats of the leeward edges and in small
forest patches, showing traits that imply increased drought tolerance, such as a small leaf
area, reduced stomatal conductance and hydraulic conductivity, and low water potentials at
turgor loss point. Finally, A. punctatum, the most abundant and widespread species in
different microhabitats of Fray Jorge forest patches, displays intermediate values for the
drought-tolerance traits investigated. The morphological and physiological differences
28
detected among tree species in this ecosystem are likely to be important in shaping species-
specific responses to future reductions in water availability as produced by reductions in
fog frequency and rainfall, that are predicted for this and other semiarid regions in the
coming decades (Johnstone and Dawson 2010).
In this forest, D. winteri showed the broadest leaf area, highest photosynthetic rates
and greatest stomatal conductance, which are associated with the highest KS. High
conductivity contributes to a more efficient water supply to the leaves, supporting greater
carbon assimilation (Meinzer et al. 1995; Sperry 2000; Brodribb and Feild 2000; Santiago
et al. 2004). Still, in contrast with the former suite of traits, D. winteri had the smallest
vessel diameters and the highest vessel density among species. D. winteri is an angiosperm,
but belongs to the very primitive family Winteraceae, which does not have true vessels, but
instead tissues that are very similar to the tracheids of coniferous species. Species with such
vesselless wood are known to have up to 21 times lower inter-element pit resistance than
eudicot vessels, and therefore their wood is highly conductive despite the short length and
narrow diameter of tracheids (Hacke et al. 2006, 2007; Sperry et al. 2007). Despite its high
Ks, large leaf area, and high stomatal conductance, D. winteri has a reduced ability to
regulate water loss (Feild et al. 1998). Low stomatal control in D. winteri is probably
associated with its hydrophobic granular plug, which consists of a porous, granular material
that fills the stomatal cavity above the guard cells preventing them from fully closing (Feild
et al. 1998; Feild and Holbrook 2000). This seems to be an adaptation to humid
environments, where it precludes the formation of a permanent water film on the leaf
surface that would obstruct CO2 diffusion into the leaf (Feild et al. 1998). Consequently, a
reduced ability to regulate water loss in D. winteri implies a greater hydraulic demand that
cannot be satisfied under the drier conditions that characterize small forest patches or patch
edges in Fray Jorge. Species, such as D. winteri, will be more vulnerable to increased
moisture stress at patch edges, as created by fragmentation. This will be further accentuated
by the regional reductions in rainfall or fog inputs and will likely reduce the possibility that
this species are able to maintain a viable population in the future.
By contrast, M. correifolia, which is typically found in drier microhabitats in Fray
Jorge, showed an opposite suite of traits compared to D. winteri, including smaller leaf
areas, higher LMA, and a reduced stomatal and hydraulic conductance. The combination of
29
these traits will enhance water conservation under water stress, but have a cost on gas
exchange rates. AMAX measured in the field in M. correifolia was two times lower than in
the less-stress tolerant D. winteri. M. correifolia also showed a greater range of vessel
diameter classes than the other two species, implying greater functional diversity for this
trait. Wider vessels are more efficient in water transport and could be useful in wetter
habitats and wetter periods of the year, while in the drier season or drier habitats, when
wider vessels are more prone to cavitation, M. correifolia can use its narrower vessels to
maintain water transport. The wider range of vessel sizes exhibited by M. correifolia likely
explains the ability of this species to cope with the strong fluctuations in water availability
that characterize small patches and leeward edges (Barbosa et al. 2010), where it is found.
Accordingly, among the three species studied, M. correifolia is the most capable of
tolerating a substantial increment of climatic variability and more extreme droughts as
expected from global climate change in this region. M. correifolia is thus most likely to
profit from the altered climate conditions as expected for this region.
Finally, A. punctatum, the most abundant and widespread species in Fray Jorge
forest patches had similar levels of stomatal and hydraulic conductance and photosynthetic
rates as M. correifolia, even though A. punctatum is a temperate tree species with
sclerophyllous leaves that generally occurs in areas of higher rainfall at higher latitudes in
south-central Chile. We suggest that the unexpectedly low values of πtlp recorded in this
species could be a response to the strong effects of oceanic salt spray over most of its
coastal distribution (Pérez and Villagrán 1985), which is intercepted by the crown foliage
and branches, and conducted to the soil via throughfall and stemflow (Ponette-González et
al. 2009). The high salt content of marine spray and rain water in Chilean coastal forests
(Hedin et al. 1995) can reduce soil osmotic potential and thus soil water potential, forcing
tree species to limit leaf water potential as a mechanism to sustain soil water absorption and
transport. Individuals of A. punctatum growing in the forest patch core have lower ψPD
values than the more drought tolerant M. correifolia, which may have deeper root systems,
which allows a better access to deeper soil water reserves. This could also explain why this
species showed a greater capacity to rehydrate overnight than the other two evergreen tree
species in Fray Jorge.
30
Despite interspecific differences in ψPD and ψMD, all three species showed ψMD
values higher than πtlp when growing in the forest patch core, confirming that frequent
summer fog in Fray Jorge represents an effective physical buffer against diurnal
temperature fluctuations and desiccation that characterize the semiarid surrounding
vegetation (del-Val et al. 2006; Ewing et al. 2009). Trees of M. correifolia and A.
punctatum occurring at the leeward edge of Fray Jorge forest patches had lower ψPD values
than those trees occurring in the patch core, showing that trees along edges have more
limited access to soil moisture and lower capacity to rehydrate and recover leaf water status
overnight. For the more drought resistant M. correifolia, ψMD values were higher than πtlp
values, but in the case of A. punctatum they were lower. These results indicate that in
leeward patch edges, A. punctatum, but not M. correifolia, experiences more water stress,
and therefore it might be unable to recover its leaf water status overnight, after losing
substantial water by transpiration during the day. Interspecific differences can be best
explained by pressure-volume curves. Trees of M. correifolia in the leeward edge had the
most negative osmotic potentials at full turgor and at turgor loss point, and lower cell water
content at turgor loss point than trees of the same species in the patch core. In turn, the
modulus of elasticity did not vary between habitats. According to these results, M.
correifolia appears to be able to tolerate (rather than avoid) drought (Bartlett et al. 2012) by
adjusting its osmotic potential at cell level, as reflected in a reduced π0. Such compensatory
osmotic mechanisms have been described in south-central Chile for the trees Kageneckia
oblonga (Cabrera 2002) and Eucryphia cordifolia (Figueroa et al. 2010). In contrast to M.
correifolia, A. punctatum did not show much variation in pressure-volume parameters
between trees in patch core habitats and leeward edges, except for ɛ, resulting in ψMD values
lower than πtlp values, and therefore, significant water stress at leeward edges. This suggests
that over longer time periods, increased water stress can result in a negative water balance
for A. punctatum trees that occur in the leeward edge of patches. This might also explain
the increased mortality rates and lower regeneration of A. punctatum observed in leeward
edges compared to windward edges and patch cores (del-Val et al. 2006). Considering that
global change scenarios for this region of the world predict increased patch fragmentation
(Sala et al. 2000), and therefore enhanced edge effects in forested landscapes, A. punctatum
trees will be at increased risk of mortality due to drought conditions along patch edges. In
31
Fray Jorge, the disruption of the canopy of A. punctatum in forest patches, due to enhanced
drought or lower fog inputs, may substantially reduce the fog interception capacity of
patches. In turn, this could modify the hydrological balance of the forest and affect the
regeneration and persistence of other tree species that dependent on the fog capture by the
A. punctatum canopy (Gutiérrez et al. 2008).
Overall, our findings support the broader concept that along pronounced soil
moisture gradients driven by fog interception in forest patches, tree functional diversity is
strongly linked to interspecific differences in drought tolerance and/or efficiency of water
use. We emphasize that plant hydraulic traits play a fundamental role in explaining niche
differentiation among species in patch center-to-edge habitats and their quantitative
understanding is key to predict how forests will respond to future scenarios of land use and
climate change.
Acknowledgements
We would like to express our gratitude to Leonardo Ramirez, Felipe Albornoz, Rafaella
Canessa, Aurora Gaxiola, Paulina Lobos, Juan Monardez, Carmen Ossa, Daniel Salinas,
Daniel Stanton and Patricio Valenzuela for their invaluable assistance in the field and
useful discussions and comments on the manuscript. This work was supported by
CONICYT fellowship 24110074 to B.S-N., and grants Fondecyt 1110929 to F.P., ICM
P05-002 and PFB-23 from CONICYT to the Institute of Ecology and Biodiversity. This is a
contribution to the LINC-Global and Research Program of the Chilean LTSER network
at Fray Jorge National Park.
32
References
Baltzer JL, Davies SJ, Bunyavejchewin S, Noor NSM (2008) The role of desiccation
tolerance in determining tree species distributions along the Malay–Thai Peninsula.
Funct Ecol 22:221-231. doi: 10.1111/j.1365-2435.2007.01374.x
Barbosa O, Marquet PA, Bacigalupe LD, Christie DA, del-Val E, Gutiérrez AG, Jones CG,
Weathers KC, Armesto JJ (2010) Interactions among patch area, forest structure and
water fluxes in a fog-inundated forest ecosystem in semi-arid Chile. Funct Ecol
24:909-917. doi: 10.1111/j.1365-2435.2010.01697.x
Bartlett M, Scoffoni C, Sack L. (2012) The determinants of leaf turgor loss point and
prediction of drought tolerance of species and biomes: a global meta-analysis. Ecol
Lett 15:393-405. doi: 10.1111/j.1461-0248.2012.01751.x
Bongers F, Poorter L, Van Rompaey RSAR, Parren MPE (1999) Distribution of twelve
moist forest canopy tree species in Liberia and Cote d’Ivoire: response curves to a
climatic gradient. J Veg Sci 10:371-382. doi: 10.2307/3237066
Brodribb TJ, Feild TS (2000) Stem hydraulic supply is linked to leaf photosynthetic
capacity: evidence from New Caledonian and Tasmanian rainforests. Plant Cell
Environ 23:1381-1388. doi: 10.1046/j.1365-3040.2000.00647.x
Cabrera HM (2002) Ecophysiological responses of plants in ecosystems with
Mediterranean-like climate and high mountain environments. Rev Chil Hist Nat
75:625-637
Cereceda P,Osses P, Larraín H, Farías M, Lagos M, Pinto R, Schemenauer RS (2002)
Advective, orographic and radiation fog in the Tarapacá region, Chile. Atmos Res
64:261-271
Choat B, Marilyn CB, Luly JG, Holtum JAM (2005) Hydraulic architecture of deciduous
and evergreen dry rainforest tree species from north-eastern Australia. Trees-Struct
Funct 19:305-311. doi: 10.1007/s00468-004-0392-1
Condit R (1998) Ecological implications of changes in drought patterns: shift in forest
composition in Panama. Climatic Change 39:413-427.
doi: 10.1023/A:1005395806800
33
Condit R, Pitman N, Leigh Jr EG, Chave J, Terborgh J, Foster RB, Nuñez-V P, Aguilar S,
Valencia R, Villa G, Muller-Landau HC, Losos E, Hubbell SP (2002) Beta-diversity
in tropical forest trees. Science 295:666-669. doi: 10.1126/science.1066854
Cornelissen JHC, Lavorel S, Garnier E, Díaz S, Buchmann N, Gurvich DE, Reich PB, ter
Steege H, Morgan HD, van der Heijden MGA, Pausas JG, Poorter H (2003) A
handbook of protocols for standardised and easy measurement of plant functional
traits worldwide. Aust J Bot 51:335-380. doi: 10.1071/BT02124
Dawson TE (1998) Fog in the California redwood forest: ecosystem inputs and use by
plants. Oecologia 117:476-485. doi: 10.1007/s004420050683
del-Val E, Armesto JJ, Barbosa O, Christie DA, Gutiérrez AG, Jones CG, Marquet PA,
Weathers KC (2006) Rain forest islands in the Chilean semiarid region: fog-
dependency, ecosystem persistence and tree regeneration. Ecosystems 9:598-608.
doi: 10.1007/s10021-006-0065-6
Di Castri F, Hajek E (1976) Bioclimatología de Chile. Universidad Católica de Chile,
Santiago, Chile
Di Rienzo JA, Casanoves F, Balzarini MG, Gonzalez L, Tablada M, Robledo CW. InfoStat
versión 2011. Grupo InfoStat, FCA, Universidad Nacional de Córdoba, Argentina.
URL http://www.infostat.com.ar
Engelbrecht BMJ, Comita LS, Condit R, Kursar TA, Tyree MT, Turner BL, Hubbell SP
(2007) Drought sensitivity shapes species distribution patterns in tropical forests.
Nature 447:80-83. doi:10.1038/nature05747
Ewers FW, Fisher JB (1989) Techniques for measuring vessel lengths and diameters in 17
stems of woody plants. Am J Bot 76:645-656
Ewing HA, Weathers KC, Templer PH, Dawson TE, Firestone MK, Elliott AM, Boukili
VKS (2009) Fog water and ecosystem function: heterogeneity in a California
Redwood forest. Ecosystems 12:417-433. doi: 10.1007/s10021-009-9232-x
Feild TS, Zwieniecki MA, Donoghue MJ, Holbrook NM (1998) Stomatal plugs of
Drimys winteri (Winteraceae) project leaves from mist but not drought. Proc Natl
Acad Sci USA 95:14256-14259. doi: 10.1073/pnas.95.24.14256
34
Feild TS, Holbrook NM (2000) Xylem sap flow and stem hydraulics of the vesselless
angiosperm Drimys granadensis (Winteraceae) in a Costa Rican elfin forest. Plant
Cell Environ 23: 1067-1077. doi: 10.1046/j.1365-3040.2000.00626.x
Figueroa JA, Cabrera HM, Queirolo C, Hinojosa LF (2010) Variability of water relations
and photosynthesis in Eucryphia cordifolia Cav. (Cunoniaceae) over the range of its
latitudinal and altitudinal distribution in Chile. Tree Physiol 30:574-585. doi:
10.1093/treephys/tpq016
Gentry AH (1988) Changes in plant community diversity and floristic composition on
environmental and geographic gradients. Ann Mo Bot Gard 75:1-34
Gutiérrez AG, Barbosa O, Christie DA, del-Val E, Ewing HA, Jones CG, Marquet PA,
Weathers KC, Armesto JJ (2008) Regeneration patterns and persistence of the fog
dependent Fray Jorge forest in semiarid Chile during the past two centuries. Glob
Change Biol 14:161-176. doi: 10.1111/j.1365-2486.2007.01482.x
Hacke UG, Sperry JS, Pockman WT, Davis SD, McCulloh K (2001) Trends in wood
density and structure are linked to prevention of xylem implosion by negative
pressure. Oecologia 126:457-461. doi: 10.1007/s004420100628
Hacke UG, Sperry JS, Wheeler JK, Castro L (2006) Scaling of angiosperm xylem structure
with safety and efficiency. Tree Physiol 26:689-701. doi: 10.1093/treephys/26.6.689
Hacke UG, Sperry JS, Feild TS, Sano Y, Sikkema EH, Pittermann J (2007) Water transport
in vesselless angiosperms: conducting efficiency and cavitation safety. Int J Plant
Sci 168:1113-1126. doi: 10.1086/520724
Hedin LO, Armesto JJ, Johnson AH (1995) Patterns of nutrient loss from unpolluted, old-
growth temperate forests: evaluation of biogeochemical theory. Ecology 76:493-509
Hildebrandt A, Eltahir EAB (2006) Forest on the edge: seasonal cloud forest in Oman
creates its own ecological niche. Geophys Res Lett 33:L11401. doi:
10.1029/2006GL026022
Johnstone JA, Dawson TE (2010) Climatic context and ecological implications of summer
fog decline in the coast redwood region. Proc Natl Acad Sci USA 107:4533–4538.
doi: 10.1073/pnas.0915062107

35
Katata G, Nagai H, Kajino M, Ueda H, Hozumi Y (2010) Numerical study of fog
deposition on vegetation for atmosphere–land interactions in semi-arid and arid
regions. Agric For Meteorol 150:340-353
Kozlowski TT, Pallardy SG (2002) Acclimation and adaptive responses of woody plants to
environmental stresses. The Botanical Review 68:270-334. doi: 10.1663/0006-8101
Kursar TA, Engelbrecht BMJ, Burke A, Tyree MT, Omari BE, Giraldo JP (2009) Tolerance
to low leaf water status of tropical tree seedlings is related to drought performance
and distribution. Funct Ecol 23:93-102. doi: 10.1111/j.1365-2435.2008.01483.x
López-Cortés F, López D (2004) Antecedentes bioclimáticos del Parque Nacional Bosque
Fray Jorge. In: Squeo FA, Gutiérrez JR, Hernández IR (eds). Historia natural del
parque nacional bosque Fray Jorge. Ediciones Universidad de La Serena, Chile, pp
45-60
Markesteijn L, Poorter L, Bongers F, Paz H, Sack L (2011a) Hydraulics and life history of
tropical dry forest tree species: coordination of species’ drought and shade
tolerance. New Phytol 191:480-495. doi: 10.1111/j.1469-8137.2011.03708.x
Markesteijn L, Poorter L, Paz H, Sack L, Bongers F (2011b) Ecological differentiation in
xylem cavitation resistance is associated with stem and leaf structural traits. Plant
Cell Environ 34:137-148. doi: 10.1111/j.1365-3040.2010.02231.x
Meinzer FC, Goldstein G, Jackson P, Holbrook NM, Gutiérrez MV, Cavelier J (1995)
Environmental and physiological regulation of transpiration in tropical forest gap
species: the influence of boundary layer and hydraulic properties. Oecologia
101:514-522. doi: 10.1007/BF00329432
Mitchell PJ, Veneklaas EJ, Lambers H, Burguess SSO (2008) Using multiple trait
associations to define hydraulic functional types in plant communities of south-
western Australia. Oecologia 158:385-397. doi: 10.1007/s00442-008-1152-5
Pérez C, Villagrán C (1985) Distribution of species abundances in relict forests of the
Mediterranean zone of Chile. Rev Chil Hist Nat 58:157-170
Ponette-González A, Weathers KC, Curran LM (2009) Water inputs across a tropical
montane landscape in Veracruz, Mexico: synergistic effects of land cover, rain and
fog seasonality, and interannual precipitation variability. Glob Change Biol 16:46-
49. doi: 10.1111/j.1365-2486.2009.01985.x

36
Poorter L (2007) Are species adapted to their regeneration niche, adult niche, or both? Am
Nat 169:433-442
Pyke CR, Condit R, Aguilar S, Lao S (2001) Floristic composition across a climatic
gradient in a neotropical lowland forest. J Veg Sci 12:553-566. doi:
10.2307/3237007
Sala OE, Chapin FS III, Armesto JJ, Berlow E, Bloomfield J, Dirzo R, Huber-Sanwald E,
Huenneke LF, Jackson RB, Kinzig A, Leemans R, Lodge DM, Mooney HA,
Oesterheld M, Poff NL, Sykes MT, Walker BH, Walker M, Wall DH (2000) Global
biodiversity scenarios for the year 2100. Science 287:1770-1774.
doi: 10.1126/science.287.5459.1770
Santiago LS, Goldstein G, Meinzer FC, Fisher JB, Machado K, Woodruff D, Jones T
(2004) Leaf photosynthetic traits scale with hydraulic conductivity and wood
density in Panamanian forest canopy trees. Oecologia 140:543-550.
doi: 10.1007/s00442-004-1624-1
Sperry JS, Holbrook MN, Zimmermann M, Tyree MT (1987) Spring filling of xylem
vessels in wild grapevine. Plant Physiol 83:414-417
Sperry JS, Donnelly JR, Tyree MT (1988) A method for measuring hydraulic conductivity
and embolism in xylem. Plant Cell Environ 11:35-40. doi: 10.1111/j.1365-
3040.1988.tb01774.x
Sperry JS (2000) Hydraulic constraints on plant gas exchange. Agric For Meteorol 104:13-
23
Sperry JS, Hacke UG, Feild TS, Sano Y, Sikkema EH (2007) Hydraulic consequences of
vessel evolution in angiosperms. Int J Plant Sci 168:1127-1139. doi:
10.1086/520726
Sterck F, Markesteijn L, Schieving F, Poorter L (2011) Functional traits determine trade-
offs and niches in a tropical forest community. Proc Natl Acad Sci USA 108:20627-
20632. doi: 10.1073/pnas.1106950108
Villagrán C, Armesto JJ, Hinojosa LF, Cuvertino J, Pérez C, Medina C (2004) El
enigmático origen del bosque relicto de Fray Jorge. In: Squeo FA, Gutiérrez JR,
Hernández IR (eds). Historia natural del parque nacional bosque Fray Jorge.
Ediciones Universidad de La Serena, Chile, pp 3-43

37
Weathers KC, Lovett GM, Likens GE, Caraco NFM (2000) Cloudwater inputs of nitrogen
to forest ecosystems in southern Chile: Forms, fluxes and sources. Ecosystems
3:590-595. doi: 10.1007/s100210000051
Wright SJ (1992) Seasonal drought, soil fertility and the species density of tropical forest
plant communities. Trends Ecol Evol 7:260-263
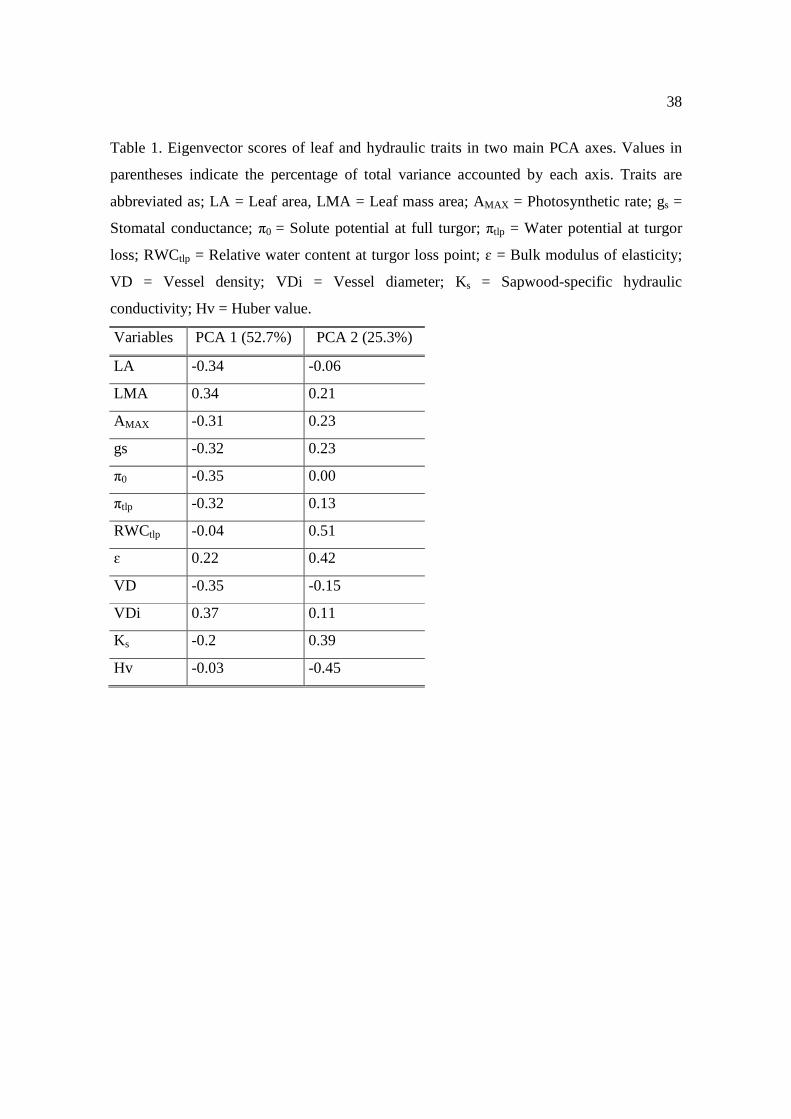
38
Table 1. Eigenvector scores of leaf and hydraulic traits in two main PCA axes. Values in
parentheses indicate the percentage of total variance accounted by each axis. Traits are
abbreviated as; LA = Leaf area, LMA = Leaf mass area; AMAX = Photosynthetic rate; gs =
Stomatal conductance; π0 = Solute potential at full turgor; πtlp = Water potential at turgor
loss; RWCtlp = Relative water content at turgor loss point; ɛ = Bulk modulus of elasticity;
VD = Vessel density; VDi = Vessel diameter; Ks = Sapwood-specific hydraulic
conductivity; Hv = Huber value.
Variables PCA 1 (52.7%) PCA 2 (25.3%)
LA -0.34 -0.06
LMA 0.34 0.21
AMAX -0.31 0.23
gs -0.32 0.23
π0 -0.35 0.00
πtlp -0.32 0.13
RWCtlp -0.04 0.51
ɛ 0.22 0.42
VD -0.35 -0.15
VDi 0.37 0.11
Ks -0.2 0.39
Hv -0.03 -0.45

39
Table 2. Among-species variation in leaf and hydraulic traits. Values indicate the mean ±
SE for each trait per species (n=6). F(2,15) and p values come from univariate ANOVA.
Letters represent statistical differences between species for each trait according to a post-
hoc Tukey test (α = 0.05). For trait abbreviations, see Table 1.
M. correifolia A. punctatum D. winteri F p
Leaf traits
LA 6.12 ± 0.38 (a) 30.04 ± 3.07 (b) 40.20 ± 4.48 (b) 30.93 <0.0001
LMA 0.02 ± 0.0006 (b) 0.0098 ± 0.0005 (a) 0.0094 ± 0.0003 (a) 256.20 <0.0001
AMAX 3.48 ± 0.12 (a) 4.34 ± 0.45 (a) 7.58 ± 0.47 (b) 31.59 <0.0001
gs 44.08 ± 3.98 (a) 47.83 ± 5.41 (a) 77.42 ± 3.69 (b) 17.03 0.0001
Traits derived from pressure-volume curve
π0 -0.89 ± 0.05 (a) -0.69 ± 0.07 (b) -0.57 ± 0.03 (b) 11.63 0.0009
πtlp -1.18 ± 0.05 (a) -1.05 ± 0.10 (a) -0.81 ± 0.02 (b) 8.61 0.0032
RWCtlp 96.51 ± 0.23 (b) 95.26 ± 0.23 (a) 96.98 ± 0.23 (b) 15.02 0.0003
ɛ 24.66 ± 1.87 (b) 12.13 ± 1.13 (a) 18.81 ± 1.83 (b) 14.48 0.0003
ψPD -0.075 ± 0.01 (a) -0.144 ± 0.01 (b) -0.138 ± 0.012 (b) 25.6 <0.0001
ψMD -0.35 ± 0.05 (a) -0.32 ± 0.04 (a) -0.28 ± 0.01 (a) 0.94 0.4127
Hydraulic traits
VD 158.57 ± 10.41 (a) 294.46 ± 14.69 (b) 310.92 ± 9.58 (b) 50.43 <0.0001
VDi 21.42 ± 0.42 (c) 16.55± 0.55 (b) 15.01 ± 0.11 (a) 67.98 <0.0001
Ks 0.44 ± 0.04 (a) 0.38 ± 0.03 (a) 0.59 ± 0.02 (b) 11.12 0.0011
Hv 5 x 10⁻⁶ ± 1 x 10⁻⁶ (a) 1.5 x 10⁻⁵ ± 3 x 10⁻⁶ (b) 4 x 10⁻⁶ ± 2.42 x 10⁻⁷(a) 10.33 0.0015

40
Table 3. Differences in pressure-volume curve traits between individual trees growing in
the patch cores (core) and leeward edge (edge) for two dominant tree species; Aextoxicon
punctatum and Myrceugenia correifolia. T(10) and p values result from t-test. For trait
abbreviations, see Table 1.
Species Traits Core Edge t-test p
A. punctatum
π0 -0.69 ± 0.07 -0.84 ± 0.05 1.85 0.0939
πtlp -1.05 ± 0.10 -1.18 ± 0.05 1.14 0.2805
RWCtlp 95.26 ± 0.23 95.18 ± 0.58 0.13 0.8992
ɛ 12.13 ± 1.13 17.94 ± 1.17 -3.57 0.0051
ψPD -0.144 ± 0.01 -0.77 ± 0.05 -8.42 <0.0001
ψMD -0.32 ± 0.04 -1.39 ± 0.04 -10.82 <0.0001
M. correifolia
π0 -0.89 ± 0.05 -1.15 ± 0.16 1.58 0.1658
πtlp -1.18 ± 0.05 -1.58 ± 0.15 2.47 0.0487
RWCtlp 96.51 ± 0.23 95.51 ± 0.23 3.12 0.0108
ɛ 24.66 ± 1.87 24.51 ± 3.05 0.04 0.9673
ψPD -0.075 ± 0.01 -0.32 ± 0.02 -14.44 <0.0001
ψMD -0.35 ± 0.05 -0.97 ± 0.05 -5.39 0.0007

41
Figure caption
Figure 1. Principal Component Analysis (PCA) of hydraulic and leaf traits of tree
individuals of three species in Fray Jorge forest patches. Eigenvector scores of all traits
along PCA axes are given in Table 1. Species are abbreviated as: Ap = Aextoxicon
punctatum; Dw = Drimys winteri; Mc = Myrceugenia correifolia.
Figure 2. Differences in leaf and hydraulic traits for three tree species in the Fray Jorge
forest patches in semiarid Chile. a) Leaf area, b) Leaf mass area, c) Photosynthetic rate, d)
Stomatal conductance, e) Vessel/tracheid density, f) Vessel/tracheid diameter, g) Sapwood-
specific hydraulic conductivity, and h) Huber value. Bars represent means ± SE. Letters
above the bars represent statistical differences between species for each trait resulting from
univariate ANOVA with a post-hoc Tukey tests (see table 2 for statistics).
Figure 3. Frequency distributions of xylem vessel diameters in cross sections of branches of
three tree species in Fray Jorge forest patches: a) A. puncatum; b) M. correifolia; c) D.
winteri. Plots show the number of vessels in 5 µm size classes as percentages of the total
number of vessels in a given cross sectional area (black bars) and the contribution of each
size class to the theoretical hydraulic conductance (Ʃd4) of the branch (following the
Hagan-Poiseuille Law) (grey bars). Bars represent mean values ± SE (n=6).
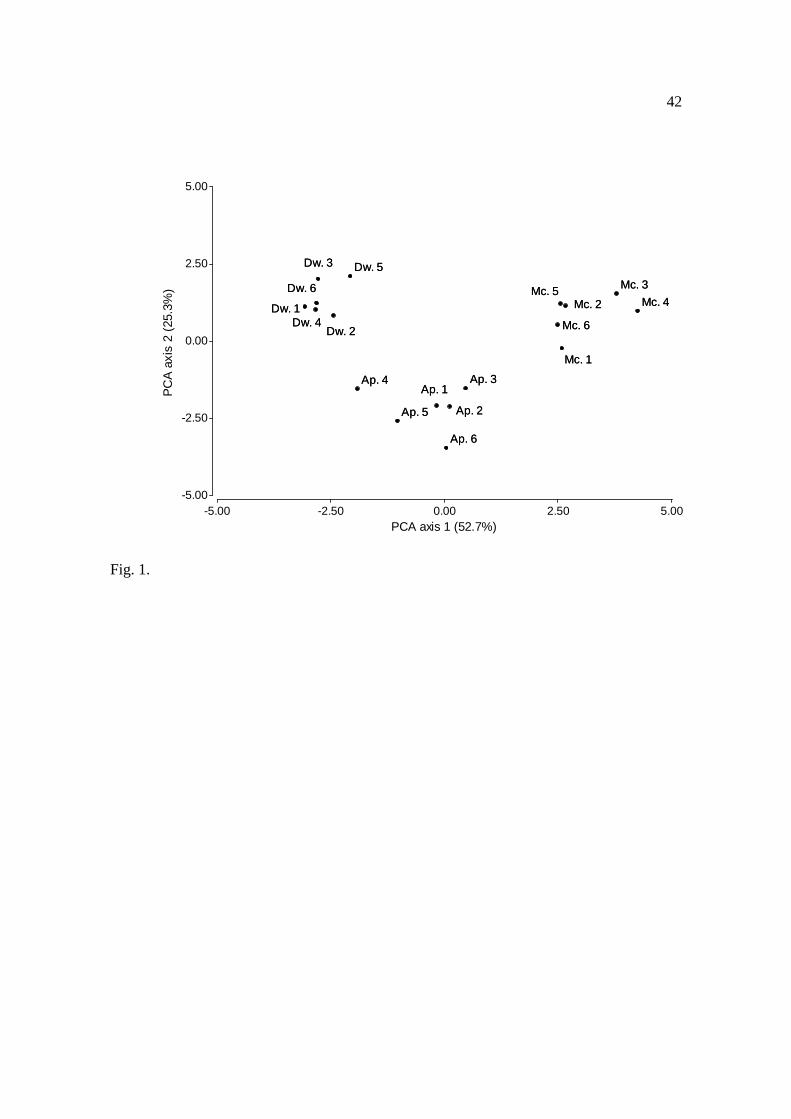
42
Fig. 1.
-5.00 -2.50 0.00 2.50 5.00PCA axis 1 (52.7%)
-5.00
-2.50
0.00
2.50
5.00
PC
A a
xis
2 (2
5.3%
)
Ap. 1
Ap. 2
Ap. 3Ap. 4
Ap. 5
Ap. 6
Dw. 1
Dw. 2
Dw. 3
Dw. 4
Dw. 5
Dw. 6
Mc. 1
Mc. 2
Mc. 3
Mc. 4Mc. 5
Mc. 6
Ap. 1
Ap. 2
Ap. 3Ap. 4
Ap. 5
Ap. 6
Dw. 1
Dw. 2
Dw. 3
Dw. 4
Dw. 5
Dw. 6
Mc. 1
Mc. 2
Mc. 3
Mc. 4Mc. 5
Mc. 6

43
Ks
(Kg
MP
a-1m
-1s-1
)
0.0
0.1
0.2
0.3
0.4
0.5
0.6
0.7V
esse
l/tra
chei
d di
amet
er (
µ m)
0
5
10
15
20
25
Species
M. c
orre
ifolia
A. pun
ctatu
m
D. wint
eri
Hub
er v
alue
(cm
2 cm
-2)
0
5e-6
1e-5
2e-5
2e-5
p = 0.0011
p < 0.0011
p < 0.0011
p = 0.0015
Ves
sel/t
rach
eid
dens
ity (
mm
-2)
0
50
100
150
200
250
300
350
p < 0.0011A
max
(µ m
ol C
O2
m-2
s-1
)
0
2
4
6
8
10
Leaf
are
a (c
m2 )
0
10
20
30
40
50
Leaf
mas
s ar
ea (
g cm
-1)
0.000
0.005
0.010
0.015
0.020
0.025
0.030
p < 0.0001
p < 0.0001
p < 0.0001
SpeciesM
. cor
reifo
lia
A. pun
ctatu
m
D. wint
eri
gs (
µ mol
H2O
m-2
s-1
)
0
20
40
60
80
100
p = 0.0001
a
b
b
b
a a
a
a
b
a a
b
a
b b
ba
c
aa
b
aa
b
a)
b)
c)
d)
e)
f)
g)
h)
Fig. 2.

44
(%)
0
10
20
30
40
50
60
70
(%)
0
10
20
30
40
50
60
70
Diameter class (µm)
10 -
15
15 -
20
20 -
25
25 -
30
30 -
35
35 -
40
40 -
45
45 -
50
(%)
0
10
20
30
40
50
60
70
a)
b)
c)
Fig. 3.
45
CAPÍTULO II
III. Variación en rasgos funcionales explica la
distribución de Aextoxicon punctatum a través
de un fuerte gradiente de humedad en un
bosque fragmentado dependiente de neblina
Salgado-Negret B, Pérez F, Canessa R, Valladares F, Armesto JJ. Variation in functional traits explains the distribution of Aextoxicon punctatum across a strong moisture gradient in a fragmented fog dependent forest. American Journal of Botany (Submitted)
46
Variation in functional traits explains the distribution of Aextoxicon punctatum
across a strong moisture gradient in a fragmented fog dependent forest
Beatriz Salgado Negret1,2*, Fernanda Pérez1,2,3, Rafaella Canessa1, Fernando
Valladares3 and Juan J. Armesto1,2,3
1Departamento de Ecología, Pontificia Universidad Católica de Chile, Casilla
114-D, Santiago, Chile.
2Instituto de Ecología y Biodiversidad, Casilla 653, Santiago, Chile.
3LINCGlobal, Museo Nacional de Ciencias Naturales, CSIC, Serrano 115 dpdo,
E-28006 Madrid, Spain.
*Corresponding author:
Beatriz Salgado Negret
56-2-3542637
47
Abstract
- Premise of the study: Climate change and fragmentation are major threats to world
forests. Understanding how functional traits related to drought tolerance change across
small-scale, pronounced moisture gradients in fragmented forests is important to predict
species’ responses to these threats.
- Methods: In the case of Aextoxicon punctatum, a dominant canopy tree in fog-
dependent rain forest patches in semiarid Chile, we explored how the magnitude,
variability and correlation patterns of leaf and hydraulic traits varied across pronounced
soil moisture gradients established within and among forest patches of different size,
which are associated the differences in tree establishment and mortality patterns.
- Key results: Leaf traits varied across soil-moisture gradients produced by fog
interception from windward to leeward edges of patches. At drier leeward edges trees
showed higher LMA, trichome and stomatal densities than trees from the wetter patch
core and windward zones. In contrast, xylem anatomy traits did not vary causing loss of
hydraulic conductivity at drier leeward edges. We also detected higher phenotypic
integration and variability at the drier leeward edges.
- Conclusions: The ability of A. punctatum to modify leaf traits in response to
differences in soil moisture availability established over short distances (<500 m)
facilitates its persistence in contrasting microhabitats within forest patches. However,
xylem anatomy showed limited plasticity, which increases cavitation risk at leeward
edges. Greater patch fragmentation, together with fluctuations in irradiance and soil
moisture in small patches, could result in higher risk of drought-related tree mortality,
with profound impacts on hydrological balances at the ecosystem scale. Intensification
of drought due to increasing fragmentation and enhanced edge effects can seriously
threaten the future persistence of many tree species in a warming world.
Key-words
Climate change; fog-dependent forest; fragmentation; hydraulic traits; intraspecific
phenotypic variability; leaf traits; moisture gradient; phenotypic integration.
48
Introduction
Reductions in precipitation expected under climate change and increasing forest
fragmentation are major threats to temperate forests worldwide (Breshears et al., 2005;
Echeverría et al., 2006; Choat et al., 2012). Particularly sensitive are forests located in
the boundary with drier formations, where drought intensification may be
fundamentally important for the persistence of forest communities (Pockman and
Sperry, 2000; Engelbrecht et al., 2007; Choat et al., 2012; Salgado-Negret et al., 2013).
As a consequence, improved understanding functional trait variation in relation to
drought tolerance becomes critical for modeling and predicting tree species responses to
future climate change (Anderegg et al., 2013).
Variation in functional traits can derive from phenotypic plasticity, genetic
variation, developmental instability, and direct effects of stress on plant performance, or
a combination of these mechanisms (Matesanz et al., 2010; Valladares et al., 2007;
Gianoli and Valladares, 2012). In recent years, interest in drought-resistance trait
variation at the intraspecific level has increased (Choat et al., 2007; Cornwell and
Ackerly, 2009; Figueroa et al., 2010; Fajardo and Piper, 2012), because of its relevance
to understanding plant species responses to drought stress and the maintenance of
biodiversity (Violle et al., 2012). Studies have often focused on species distributions
across broad geographic ranges and stress conditions (Choat et al., 2007; Figueroa et al.,
2010; Fajardo and Piper, 2012). However, intraspecific variation of functional plant
traits across pronounced environmental gradients at small spatial scales can also provide
clues to identifying species responses to key environmental factors, such as water
availability, and their interactions with widespread global change threats such as
fragmentation (Matesanz et al., 2009).
In semiarid regions, forests that depend on coastal fogs for water supply
(Hildebrandt and Eltahir, 2006; del-Val et al., 2006; Katata et al., 2010) represent an
interesting case with respect to acute moisture gradients. In such forests, fog
interception by trees is the primary or even the only source of moisture during
prolonged dry periods (Dawson 1998; del-Val et al., 2006; Ewing et al., 2009). Fog
influx creates pronounced asymmetries between windward to leeward edges of forest
patches (Weathers et al., 2000; del-Val et al., 2006; Ewing et al., 2009; Stanton et al.
2013), as well as among different-size patches with contrasting edge effects.
Fragmentation enhances sensitivity to current and future changes in fog water supply
49
(Gutierrez et al., 2008; Hildebrandt and Eltahir, 2008; Johnstone and Dawson, 2010).
Changes in fog frequency and intensity are predicted to occur in these areas due to
changes in sea-surface temperature and the height of the temperature inversion layer
(Cereceda et al., 2002, Garreaud et al., 2008), together with changes in other forest
features affecting fog capture (Hildebrandt and Eltahir, 2006).
An emblematic example of fog-dependent forests found in semiarid Chile (30°S)
is the northernmost extension of temperate rainforest on coastal hilltops of the semiarid
region. Here, a mosaic of rain forest patches of different sizes occurs immersed in a
xerophytic shrubland matrix (Barbosa et al., 2010). The dominant tree species in all
forest patches is the southern South American endemic Aextoxicon punctatum Ruiz and
Pav, belonging to the monotypic and isolated family Aextoxicaceae. This species is
broadly distributed in temperate rain forests of western South America. In fray Jorge, it
occurs in forest patches of all sizes and throughout the soil moisture gradient produced
by fog influx from windward to leeward edges (del-Val et al., 2006). Moreover,
population genetic studies suggest that gene flow via seed dispersal across neighboring
patches in this patchy landscape has been highly significant (Fst < 0.05) during recent
history (Nuñez-Ávila et al. 2013). Patterns of tree radial growth and regeneration
dynamics of A. punctatum in this forest have shown constant growth and continuous
regeneration for 200 years, despite a declining trend in rainfall during the last century.
This suggests that this species can survive extreme temporal fluctuations in water
availability (Gutiérrez et al., 2008). Understanding the ability of A. punctatum to
withstand spatial and temporal fluctuations in water availability requires improved
knowledge of the mechanisms involved in drought tolerance and vulnerability to the
combined effects of increased water shortage and forest fragmentation.
Plants often respond to water deficit by modifying leaf traits and decreasing
transpirational water losses through reductions in stomatal size and density, greater
trichome density (Fahn, 1986; Baldini et al., 1997), and enhanced leaf mass per unit
area (LMA) (Niinemets, 2001). We know less about hydraulic features conferring
drought tolerance, but it has been reported that a large number of short, narrow, vessels
per unit area are adaptive under arid conditions (Carlquist, 2001) and reduced the
chances of hydraulic embolism (Markesteijn et al., 2011). The above-cited studies have
generally focused on changes in mean trait values, while changes in trait variability
(measured by the coefficient of variation) have received less attention (Violle et al.,
2012). Likewise, comparative studies across moisture gradients have often ignored

50
coordinated trait responses (Nicotra et al. 2007). Coordinated variation of
morphological traits can result from genetic, developmental and functional relationships
among traits, combined in the concept of phenotypic integration (Murren, 2002;
Pigliucci, 2003). Correlations between leaf (Wright et al., 2004) and hydraulic traits
(Chave et al., 2009; Zanne et al., 2010) have been documented by several recent studies
(Brodribb and Field, 2000; Brodribb et al., 2002; Santiago et al., 2004; Wright et al.,
2006; Meinzer et al., 2008; Baraloto et al., 2010). However, we lack information about
how the environment can alter patterns of phenotypic integration (Nicotra et al., 1997;
Nicotra et al. 2007; Wright et al., 2006). Nevertheless, studies of other groups of traits
indicate that phenotypic integration should increase with environmental stress
(Schlichting, 1989; Gianoli, 2004; Godoy et al., 2012).
This study explores the magnitude, variability and correlation patterns of leaf
and hydraulic traits of the rain forest tree A. punctatum across contrasting soil moisture
conditions, which occur within fog-dependent forest patches in semiarid Chile. A
striking asymmetric pattern in these patches is that tree mortality increases towards the
leeward edge and regeneration is enhanced towards windward edges (del Val et al.
2006). Specifically, we addressed the following two hypotheses: (1) Individuals that
occur in drier leeward edges of forest patches may display traits that favor water
conservation (lower stomatal and higher and trichome density, and higher LMA) and
minimize cavitation risk (lower vessel diameter, higher vessel density, and enhanced
hydraulic conductivity); (2) Phenotypic variation and integration may increase in
leeward edges due to greater environmental variability and increased water shortage.
Aextoxicon punctatum populations in this northern outpost of temperate forests have
confronted climate change over an extended period of increasing aridity (Villagrán et
al., 2004; Gutierrez et al., 2008). Accordingly, studying drought tolerance strategies in
this species will be of great value to understand and predict the consequences of future
changes in climate and forest fragmentation at the margins of distribution of temperate
forests. In addition, increased fragmentation of temperate forests, due to human land
use, and expansion of edge habitats combined with climate change, are likely to
enhance desiccation effects and cause increased mortality of forest trees (Choat et al.,
2012), unless trees can accommodate to drier edge environments (Breda et al., 2006).
The analysis of A. punctatum responses to pronounced microhabitat differences within
and between patches in fog-dependent forests could provide clues to understanding tree
responses to changing water stress gradients.
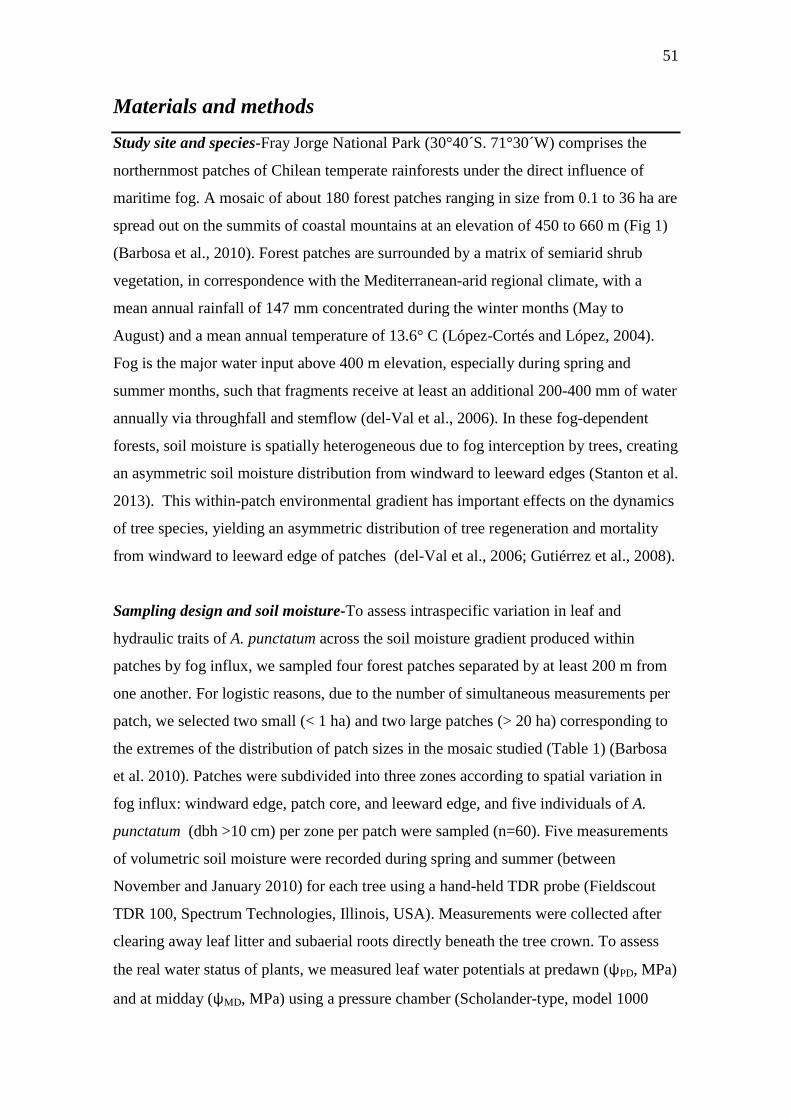
51
Materials and methods
Study site and species-Fray Jorge National Park (30°40´S. 71°30´W) comprises the
northernmost patches of Chilean temperate rainforests under the direct influence of
maritime fog. A mosaic of about 180 forest patches ranging in size from 0.1 to 36 ha are
spread out on the summits of coastal mountains at an elevation of 450 to 660 m (Fig 1)
(Barbosa et al., 2010). Forest patches are surrounded by a matrix of semiarid shrub
vegetation, in correspondence with the Mediterranean-arid regional climate, with a
mean annual rainfall of 147 mm concentrated during the winter months (May to
August) and a mean annual temperature of 13.6° C (López-Cortés and López, 2004).
Fog is the major water input above 400 m elevation, especially during spring and
summer months, such that fragments receive at least an additional 200-400 mm of water
annually via throughfall and stemflow (del-Val et al., 2006). In these fog-dependent
forests, soil moisture is spatially heterogeneous due to fog interception by trees, creating
an asymmetric soil moisture distribution from windward to leeward edges (Stanton et al.
2013). This within-patch environmental gradient has important effects on the dynamics
of tree species, yielding an asymmetric distribution of tree regeneration and mortality
from windward to leeward edge of patches (del-Val et al., 2006; Gutiérrez et al., 2008).
Sampling design and soil moisture-To assess intraspecific variation in leaf and
hydraulic traits of A. punctatum across the soil moisture gradient produced within
patches by fog influx, we sampled four forest patches separated by at least 200 m from
one another. For logistic reasons, due to the number of simultaneous measurements per
patch, we selected two small (< 1 ha) and two large patches (> 20 ha) corresponding to
the extremes of the distribution of patch sizes in the mosaic studied (Table 1) (Barbosa
et al. 2010). Patches were subdivided into three zones according to spatial variation in
fog influx: windward edge, patch core, and leeward edge, and five individuals of A.
punctatum (dbh >10 cm) per zone per patch were sampled (n=60). Five measurements
of volumetric soil moisture were recorded during spring and summer (between
November and January 2010) for each tree using a hand-held TDR probe (Fieldscout
TDR 100, Spectrum Technologies, Illinois, USA). Measurements were collected after
clearing away leaf litter and subaerial roots directly beneath the tree crown. To assess
the real water status of plants, we measured leaf water potentials at predawn (ψPD, MPa)
and at midday (ψMD, MPa) using a pressure chamber (Scholander-type, model 1000
52
PMS). Measures were conducted between 0500 and 0700 hours and between 1100 and
1300 hours respectively.
Leaf traits-Ten mature, fully expanded leaves without herbivore damage were taken
from each of five sample trees per patch zone (n=10*60=600). Leaves were scanned
(EPSON Stylus TX200) and analyzed using ImageJ software (http://imagej.nih.gov/ij/)
to determine leaf area (LA), and then dried for 48 h at 65°C to obtain leaf dry mass (g)
and then calculate leaf mass per area (LMA) in g cm-2 (Cornelissen et al., 2003). One
leaf per individual was prepared to determinate trichome and stomatal density. Leaves
were kept in Jeffrey solution (chromic acid at 10% and nitric acid at 10% in equal parts)
for 48 h, until the epidermis could be easily separated from the mesophyll. Later, the
epidermis was dyed in diluted methylene blue and stomatal and trichome densities were
measured on one spot of 1 mm diameter located halfway along the length of the leaf
using ImageJ software (http://imagej.nih.gov/ij/).
Hydraulic traits and conductivity- A sample of branches, each 10-15 mm in diameter
was collected from the outer crown of sampled trees to measure hydraulic conductivity,
i.e., water flux through a unit length of stem divided by the pressure gradient (Ks, in kg
m-1 s-1 MPa-1), following Sperry et al. (1988). Samples were cut in the morning
(between 6:00 to 9:00 am) and immediately after cutting they were re-cut under water
about 0.2 m higher. Branches were subsequently transported inside dark bags to the
field station, located 45 min from the place of collection. Hydraulic conductivity was
measured in the field station within five hours after cutting as follows. Distal ends of
each branch were trimmed under water with a razor blade (to clear any accidentally
blocked vessels), and a segment of around 30 cm in length was obtained. Segments
were larger than the maximum conduit length, which was previously estimated from a
separate collection of branches taken from the same individuals (see below). While
submerged, the basal end of the branch was connected to a fluid column fed by a
reservoir of 10 mM KCl solution elevated to a height of 1 m (providing a constant
pressure of 9.8 KP), while the apex end of the branch was wrapped with parafilm. An
electronic balance recorded KCl solution flux as increase in sample mass every 15
seconds. Measurements were made when an approximately constant flow was observed
for at least 3 min. Afterwards, a subset of branches was flushed with KCl solution at a

53
pressure of 170 kPa for 10-15 min to remove embolism (Sperry et al. 1987) and
hydraulic conductivity was measured again at its maximum capacity. To standardize
the flow of water per unit sapwood area and obtain sapwood specific hydraulic
conductivity (Ks, kg MPa-1 m-1 s-1), we divided Kh by the cross-sectional area of the
conductive xylem (see hydraulic anatomy below). Thus, hydraulic conductivity was
made comparable among segments of different diameters. Ks was compared with
sapwood specific hydraulic conductivity at maximum capacity to obtain the percentage
of loss of conductivity (PLC), estimated as (max Ks-field Ks)/max Ks. These data were
available for a subset of three individuals per zone in only two patches.
Hydraulic anatomy-- To visualize the conductive wood area, the same stems were
perfused with safranin dye using positive pressure by syringe connected to the cut end
of the branch to introduce the dye into stems. A cross-sectional area of the upper distal
end of the stem was photographed with a digital camera mounted on a microscope, at
10x and the image processed using the imaging software SigmaScan Pro 5 (SPSS Inc.)
to determine vessel diameter (µm) and density (vessels mm-2).
Data analysis- Differences across forest patch zones (windward and leeward edges and
core) in leaf and hydraulic traits were explored using principal component analysis
(PCA). We also performed split-plot two-way ANOVA model with zone (Z) and patch
size (S) as factors and estimated the interaction between them. Stomatal and trichome
densities and leaf water potentials at predawn and midday were incorporated into the
model using an exponential function for the relationship between the variance and the
mean to conform to assumptions of heteroscedasticity. Because ANOVA showed
significant interactions between patch zone and patch area, we analyzed large and small
patches separately using one-way ANOVA with Z as factor, followed by post-hoc
Tukey´s tests to identify individual responses of each trait.
Given that we did not find clear differences in mean values among patch zones in
small forest patches, we examined shifts in the spread (coefficient of variation) and
phenotypic integration among zones only in the large patches. Because the two large
patches studied showed similar patterns in mean values, we pooled these data for further
analyses (10 individuals per zone). In order to compare the level of variation of leaf and
hydraulic traits among zones within patches, we obtained 95% confidence intervals
(CI95%) by bootstrapping the original data using Poptools (Hood, 2010).

54
To assess phenotypic integration, we constructed 5*5 correlation matrices with
morphological traits for each zone (MCs) and for all individuals using Pearson’s
correlation coefficients to test the relationships for every pair of traits. The magnitude of
character integration (INT) for each zone and for large patch data was estimated from
the variance of eigenvalues of each correlation matrix (Wagner, 1984; Cheverud et al.,
1989). A 95% confidence interval of INT was estimated by bootstrapping the original
log-transformed data.
Results
Within-patch moisture gradient and leaf water potential- In both small and large
patches volumetric soil moisture varied substantially among zones, with leeward edges
significantly drier than the other two microhabitats (small patches: F=16.42, p<0.0001,
large patches: F=73.77, p<0.0001) (Table 2, see Supplemental data with the online
version of this article). Differences in soil moisture among patch zones were reflected in
lower ψPD at leeward edges in large forest patches (small: F=1.33, p=0.2806, large:
F=98.78, p<0.0001) and lower ψMD at leeward edges in both small and large patches
(small: F=8.63, p=0.0013, large: F=54.51, p<0.0001) (Table 2). The ψPD and ψMD
estimated in the patch cores were comparable to windward edge values in both patch
sizes (Table 2, see Supplemental data with the online version of this article).
Shifts in mean trait values across zones within patches- Hydraulic and leaf traits also
differed among patch zones. The first PCA axis, which explained 41% of trait variation,
clearly separated leeward edge from other two wetter zones (Fig. 2). This axis was
positively correlated with traits related to water conservation strategy (trichome and
stomatal density and LMA) and negatively correlated with K (see Supplemental data
with the online version of this article). Then, higher values along the first PCA axis
reflect stronger ability to conserve water and tolerate drought, but decreased water
transport efficiency. The second PCA component explained an additional 27% of the
total variance and it was dominated by the tradeoff between vessels diameter and
density. However, it did not separate trees in different patch zones (see Supplemental
data with the online version of this article). Similar results were detected when each trait
was analyzed separately. ANOVAs show significant differences among patch zones for

55
mean values of leaf traits and hydraulic conductivity, but no for vessel density and
vessel diameter (Table 2, see Supplemental data with the online version of this article).
These analyses also provided evidence that trait variation was more pronounced in large
than in small forest fragments. In the latter, within-patch differences in soil moisture
and water potentials were less accentuated. Stomatal density was higher for trees in the
leeward edge than in the wetter windward and core zones of large forest patches
(F=21.48, p<0.0001), but did not differ among zones in the small patches (F=2.77,
p=0.08). Trichome density and leaf mass area were higher for trees in the leeward edge
than in the wetter core zone in both small (trichomes: F=14.31, p=0.0001, LMA:
F=5.11, p=0.01) and large forest patches (trichomes: F=31.43, p<0.0001, LMA:
F=17.32, p<0.0001), but did not show differences with the windward edge in small
patches (Table 2). Likewise, K was lower for trees in the leeward edges than in the
wetter windward edges in both small (F=17.98, p=0.0001) and large patches (F=28.95,
p<0.0001) (Table 2). To assess whether reduction in Ks at leeward edges reflected
higher levels of embolism, we estimated K at maximum capacity and the percentage of
loss conductivity (PLC) in three to five individuals per zone for two patches. As
expected, we found higher PLC values for trees in leeward edges of both small
(F=10.52, p=0.01) and large patches (F=32.63, p<0.001)
Shifts in the spread of trait values across zones within patches- Three of the six traits
evaluated showed significant trends in relation to forest patch zones (Fig 3).
Coefficients of variation (CV) of stomatal density, trichome density and hydraulic
conductance differed significantly among zones within patches as revealed by the non-
overlapping 95% confidence intervals, which are 1.8 to 4.6 times higher in the leeward
edge than in the wetter core and windward zones (Fig 3). LMA and xylem anatomical
traits did not show statically significant differences in CV (Fig 3).
Shifts in trait correlations and the extent of phenotypic integration within patches-
Phenotypic correlation matrices varied among zones within forest patches (Table 3).
The most divergent matrix was that of the windward zone, showing similarity indices of
-0.12 and 0.11 with respect to the leeward and core matrices. Phenotypic matrices of
these last two zones (leeward and core) were more similar (similarity index=0.71,
p=0.02), but often correlation coefficients were stronger in the drier leeward zone.
Whereas mean r2 value for characters of trees in leeward areas was 0.40, this parameter

56
was only 0.14 and 0.18 for trees in windward and core zones respectively. Integration
values were also higher in the drier leeward zone (INT = 1.9, 95%, Confidence interval
(CI): 1.32-3.39) than in windward (INT = 0.64, 95%, CI 0.52-1.99) or core (INT = 0.92,
95%, CI: 0.90-2.30) zones, but differences were not statically significant.
Discussion
The temperate rainforest tree Aextoxicon punctatum showed considerable variation in
leaf traits across soil-moisture gradients produced by fog interception by the tree
canopy. Notably, leaf trait variation within structurally asymmetric forest fragments (del
Val et al., 2006; Stanton et al., 2013) at spatial scales of 100 meters or less was greater
than variation observed between fragments of contrasting size, and even greater than
differences between trees in the Fray Jorge patch mosaic and Aextoxicon populations
located 1500 km to the south, where precipitation is ten times higher (Salgado-Negret,
unpublished data). In contrast to foliar traits, those related to xylem anatomy (vessel
diameter and density) did not vary significantly within forest fragments of A. punctatum
in Fray Jorge or in populations located 1500 km to the south (Salgado-Negret,
unpublished data), and were decoupled from the observed variation in leaf traits. Lack
of variability in xylem anatomy of Aextoxicon trees in Fray Jorge forest patches was
associated with lower hydraulic conductivity in the drier leeward edge, as K was four
times lower for trees in the core or windward zones of patches. Reduced conductivity at
the leeward edge might be explained by higher levels of embolism, because PLC values
at leeward edges were five times higher than PLC measured at core zones in both small
and large patches.
To determine whether leaf trait differentiation among patch zones is due plastic
responses or to local adaptation is necessary to compare among trees experimentally
grown in common gardens. Indirect evidence based on distances between patches and
dispersal distances of Aextoxicon seeds dispersed by birds suggest that gene flow should
occur among zones within forest patches as well as among patches (Nuñez-Ávila et al.
2013), and hence differences among trees in different patch zones are likely due to
plasticity. Thus, leaf phenotypic plasticity in response to within patch differences in
water availability is likely involved in the persistence of this tree species across a range
of habitats. Trees with higher LMA, trichome and stomatal densities grew more often in
leeward edges, where water availability was two to three times lower than in the patch
57
core zone and windward edges of patches. These differences in leaf traits can be related
to water conservation strategies (Chapin, 1980). Leaves that are more dense and rigid
(higher LMA) have smaller transpiring surfaces, hence reducing wilting and water
requirements (Poorter et al., 2009). Greater leaf pubescence increases boundary layer
resistance, decreases transpirational water losses (Fahn, 1986; Baldini et al., 1997), and
also enlarges the surface available for water uptake by leaves (Savé et al., 2000;
Grammatikopoulos and Manetas, 1994). The observed increment in leaf stomatal
density in trees growing at the drier leeward edge of patches is less intuitive, because
greater stomatal densities are often associated with higher transpiration and water loss.
However, stomata in A. punctatum leaves are sunken and located in the abaxial
epidermis. Sunken stomata generally reduce leaf transpiration (Jordan et al., 2008) and
facilitate CO2 diffusion in thick, hard leaves (Hassiotou et al., 2009). High stomatal
densities in the drier leeward edge may probably compensate for the greater internal
resistance to CO2 uptake by thicker and denser leaves (with higher LMA). In addition,
long-lived leaves with higher LMA can exhibit higher stomatal densities as a ‘backup’
mechanism, in case that some stomata become inactive, i.e., dust blocked (Hassiotou et
al., 2009).
Three of the four leaf traits that showed differences in mean values across zones
within fragments, also showed differences in their degree of variability. For stomatal
and trichome densities, and K, the coefficient of variation was greater for trees in the
drier leeward edge. This patch zone is not only drier but also subjected to higher
fluctuations in irradiance and temperature and therefore soil moisture compared to core
and windward zones of patches. These results agree with other studies showing
increasing number of alternative phenotypes with increasing resource heterogeneity
(Sultan, 1987; Lortie and Aarssen, 1996; Balaguer et al., 2001). In the case of A.
punctatum, the higher coefficient of variation for stomatal and trichome densities of
trees in leeward habitats may be related to successive generations of leaves experiencing
contrasting environments and therefore promoting alternative phenotypes. In contrast,
the uniformity of hydraulic traits may indicate high environmental canalization, due to
the strong connection of hydraulic properties with water transport and survival, which
enables organisms to maintain the highest possible level of fitness across environments
(Debat and David, 2001). High canalization of hydraulic anatomy across all within-
patch zones could lead to high K variability at leeward edges.
58
We also found stronger correlations among leaf traits and greater level of
phenotypic integration at decreasing levels of soil water availability within patches.
Other studies of phenotypic integration also showed greater correlation values in
heterogeneous environments (Schlichting, 1989; Nicotra et al., 1997; Gianoli, 2004),
but the functional benefits or constraints on this pattern for plants have not been clearly
established (Gianoli, 2004; Matesanz et al., 2010). Notably, we found that in the case of
Aextoxicon punctatum leaf traits varied rather independently of hydraulic traits, except
for trees in the leeward edge, where LMA, vessel density and vessel diameter were
correlated. In this heterogeneous and variable environment, which characterizes
fragmented forests, functional coordination between stem conductive capacity and leaf
hydraulic properties might be essential. Our results on this point contrast with other
studies reporting coordinated variation of leaf and stem traits in forest trees (Brodribb
and Field, 2000; Brodribb et al., 2002; Santiago et al., 2004; Wright et al., 2006;
Meinzer et al., 2008; but see Baraloto et al., 2010), and highlight the need to examine
patterns of phenotypic integration across different environmental gradients.
Overall, this study demonstrates that Aextoxicon punctatum leaf traits, but not xylem
anatomy, vary within forest patches under contrasting soil-moisture conditions
produced by fog interception patterns and also vary among patches due to differences in
forest patch size. The absence of similar plasticity in xylem traits of trees was correlated
with a reduction in hydraulic conductance at the drier leeward edge and it evidenced
higher water stress expressed by more negative ψPD in the leeward edges with respect to
other zones.
Although vessel diameters recorded for A. punctatum stems are in the smaller
range of those reported for tree species in the literature (Ewers and Fisher, 1989; Zanne
et al., 2003; Chave et al., 2009), they could not prevent cavitation, revealing that soil
water availability at the leeward edge of patches is insufficient to maintain a constant
flux along stems. Indeed, we previously reported that hydraulic potential at midday
(ψMD) for individuals of A. punctatum growing at leeward edges frequently fell below
the turgor loss point (πtlp), suggesting intense water stress (Salgado-Negret et al., 2013).
Recent climate change scenarios for Chile (CONAMA, 2006) predict enhanced
interannual variability in rainfall, greater intervals between extremely wet and dry years,
and particularly a decline in winter rainfall (concentrating >80% of annual rainfall) in
the study area. However, rain contributes only a fraction (about 50% during low rainfall
years) of the annual water budget in Fray Jorge forests and future changes in fog

59
frequency over time, are uncertain (Gutiérrez et al. 2008). Reductions in rainfall and fog
inputs coupled to increasing patch fragmentation (Sala et al., 2000), will decrease water
budget of these forests because lower water capture surfaces and higher environmental
variability. This scenario will expose A. punctatum trees to greater water stress in this
patch mosaic. The inability of this tree species to modify xylem anatomy traits,
associated with its problem to maintain leaf turgor in the face of decreasing soil
moisture at leeward edges (Salgado-Negret et al., 2013) and the narrow hydraulic safety
margins for tree species around the world (Choat et al., 2012) could seriously impair the
ability of A. punctatum to supply water to leaves for photosynthetic gas exchange. This
mechanism could eventually lead to negative water balance and increased tree mortality
along exposed patch edges and small size patches. Higher tree mortality would alter
hydrologic balance of fragmented forests, affecting regeneration and persistence of
other species that depend on ecosystem integrity. In particular, fog capture by the A.
punctatum canopy may be impaired due to disruption of hydrologic balance in small
patches and leeward edge of patches. Global change, expressed in reductions of forest
cover, increased fragmentation and more intense edge effects are likely to have strong
negative impacts, on forest ecosystems worldwide, and on these fog-dependent
ecosystems in particular, because of ecophysiological limitations and drought effects on
the performance and survival of the dominant tree species.
Acknowledgements
We express our gratitude to Leonardo Ramirez, Felipe Albornoz, Juan Monardez,
Carmen Ossa, Daniel Salinas and Patricio Valenzuela for their invaluable assistance in
the field. We thank to Daniel Stanton for useful discussions and comments on the
manuscript and to Fernando Casanoves for statistical support. Work was supported by
CONICYT fellowship 24110074 to B.S-N., and grants Fondecyt 1110929 to F.P., P05-
002 from Millennium Scientific Initiative and PFB-23 from CONICYT to the Institute
of Ecology and Biodiversity, Chile. This is a contribution to LINC-Global (Chile-Spain)
and to the Research Program of the Chilean LTSER network at Fray Jorge National
Park.
60
References
ANDEREGG, W. R., J. M. KANE, AND L. D. ANDEREGG.2013. Consequences of
widespread tree mortality triggered by drought and temperature stress. Nature
Climate Change 3: 30-36.
BALAGUER, L., E. MARTÍNEZ-FERRI, F. VALLADARES, M. E. PÉREZ-
CORONA, F. J. BAQUEDANO, F. J. CASTILLO, AND E. MANRIQUE. 2001.
Population divergence in the plasticity of the response of Quercus coccifera to
the light environment. Functional Ecology 15: 124-135.
BALDINI, E., O. FACINI, F. NEROZZI, F. ROSSI, AND A. ROTONDI. 1997. Leaf
characteristics and optical properties of different woody species. Trees 12: 73-
81.
BARALOTO, C., C. E. T. PAINE, L. POORTER, J. BEAUCHENE, D. BONAL, A. M.
DOMENACH, B. HÉRAULT, ET AL. 2010. Decoupled leaf and stem
economics in rain forest trees. Ecology Letters 13: 1338-1347.
BARBOSA, O., P. A. MARQUET, L. D. BACIGALUPE, D. A. CHRISTIE, E. DEL-
VAL, A. G. GUTIERREZ, C. G. JONES, ET AL. 2010. Interactions among
patch area, forest structure and water fluxes in a fog-inundated forest ecosystem
in semi-arid Chile. Functional Ecology 24: 909-917.
BRÉDA, N., R. HUC, A. GRANIER, AND E. DREYER. 2006. Temperate forest trees and
stands under severe drought: a review of ecophysiological responses, adaptation
processes and long-term consequences. Annals of Forest Sciences 63: 625-644.
BRESHEARS, D.D., N. S. COBB, P. M. RICH, K. P. PRICE, D. C. ALLEN, R. G.
BALICE, W. H. ROMME, ET AL. 2005. Regional vegetation die-off in
response to global-change-type drought. Proceedings of the National Academy
of Sciences of the United States of America 102: 15144-15148.
BRODRIBB, T.J., AND T. S. FIELD. 2000. Stem hydraulic supply is linked to leaf
photosynthetic capacity: evidence from New Caledonian and Tasmanian
rainforest. Plant, Cell and Environment 23: 1381–1388.
BRODRIBB, T.J., N. M. HOLBROOK, AND M. V. GUTIÉRREZ. 2002. Hydraulic
and photosynthetic co-ordination in seasonally dry tropical forest trees. Plant,
Cell and Environment 25: 1435–1444.

61
CARLQUIST, S. 2001. Comparative wood anatomy: systematic, ecological and
evolutionary aspects of dicotyledon wood. 2nd Edn. Springer-Verlag. Berlin
Heidelberg. Germany.
CERECEDA, P., P. OSSES, H. LARRAÍN, M. FARÍAS, M. LAGOS, R. PINTO, AND
R. S. SCHEMENAUER. 2002. Advective, orographic and radiation fog in the
Tarapacá region, Chile. Atmospheric Research 64: 261-271.
CHAPIN, F.S. III. 1980. The mineral nutrition of wild plants. Annual Review of
Ecology and Systematics 11: 233-260.
CHAVE, J., D. COOMES, S. JANSEN, S. L. LEWIS, N. G. SWENSON, AND A. E.
ZANNE. 2009. Towards a worldwide wood economics spectrum. Ecology
Letters 12: 351-366.
CHEVERUD, J.M., G. P. WAGNER, AND M. M. DOW. 1989. Methods for the
comparative analysis of variation patterns. Systematic Zoology 38: 201-213.
CHOAT, B., L. SACK, AND N. M. HOLBROOK. 2007. Diversity of hydraulic traits in
nine Cordia species growing in tropical forests with contrasting precipitation.
New Phytologist 175: 686-698.
CHOAT, B., S. JANSEN, T. J. BRODRIBB, H. COCHARD, S. DELZON, R.
BHASKAR, S. J. BUCCI, ET AL. 2012. Global convergence in the vulnerability
of forests to drought. Nature 491: 752-755.
CONAMA. 2006. Estudio de la variabilidad climática en Chile para el siglo XX1.
Comisión Nacional de Medio Ambiente. Santiago, Chile.
CORNELISSEN, J.H.C., S. LAVOREL, E. GARNIER, S. DÍAZ, N. BUCHMANN, D.
E. GURVICH, P. B. REICH, ET AL. 2003. A handbook of protocols for
standardised and easy measurement of plant functional traits worldwide.
Australian Journal of Botany 51: 335-380.
CORNWELL, W.K., AND D. D. ACKERLY. 2009. Community assembly and shifts in
plant trait distributions across an environmental gradient in coastal California.
Ecological Monographs 79: 109-126.
DAWSON, T.E. 1998. Fog in the California redwood forest: ecosystem inputs and use
by plants. Oecologia 117: 476-485.
DEBAT, V., AND P, DAVID. 2001. Mapping phenotypes: canalization, plasticity and
developmental stability. Trends in Ecology and Evolution 16: 555-561.
DEL-VAL, E., J. J. ARMESTO, O, BARBOSA, D. A. CHRISTIE, A. G. GUTIÉRREZ,
P. A. MARQUET, C. G. JONES, AND K. C. WEATHERS. 2006. Rain forest

62
islands in the Chilean semiarid region: fog-dependency, ecosystem persistence
and tree regeneration. Ecosystems 9: 598-608.
ECHEVERRIA, C., D. COOMES, J. SALAS, J. M. REY-BENAYAS, A. LARA, AND
A. NEWTON. 2006. Rapid deforestation and fragmentation of Chilean
Temperate Forests. Biological Conservation 130: 481-494.
ENGELBRECHT, B.M.J., L. S. COMITA, R. CONDIT, T. A. KURSAR, M. T.
TYREE, B. L. TURNER, AND S. P. HUBBELL. 2007. Drought sensitivity
shapes species distribution patterns in tropical forests. Nature 447: 80-83.
EWERS, F.W., AND J. B. FISHER. 1989. Techniques for measuring vessel lengths and
diameters in stems of woody plants. American Journal of Botany 76: 645-656.
EWING, H.A., K. C. WEATHERS, P. H. TEMPLER, T. E. DAWSON, M. K.
FIRESTONE, A. M. ELLIOTT, AND V. K. S. BOUKILI. 2009. Fog water and
ecosystem function: heterogeneity in a California Redwood forest. Ecosystems
12: 417-433.
FAHN A. 1986. Structural and functional properties of trichomes of xeromorphic
leaves. Annals of Botany 57: 631-637.
FAJARDO, A., AND F. I. PIPER. 2011. Intraspecific trait variation and covariation in
a widespread tree species (Nothofagus pumilio) in southern Chile. New
Phytologist 189: 259-271.
FIGUEROA, J.A., H. M. CABRERA, C. QUEIROLO, AND L. F. HINOJOSA. 2010.
Variability of water relations and photosynthesis in Eucryphia cordifolia Cav.
(Cunoniaceae) over the range of its latitudinal and altitudinal distribution in
Chile. Tree Physiology 30: 574-585.
GARREAUD, R., J. BARICHIVICH, C. CHRISTIE, AND A. MALDONADO. 2008.
Interannual variability of the coastal fog at Fray Jorge relict forests in semiarid
Chile. Journal of Geophysical Research doi:10.1029/2008JG000709
GIANOLI, E. 2004. Plasticity of traits and correlations in two populations of
Convolvulus arvensis (Convolvulaceae) differing in environmental
heterogeneity. International Journal of Plant Sciences 165: 825-832.
GIANOLI, E., AND F. VALLADARES. 2012. Studying phenotypic plasticity: the
advantages of a broad approach. Biological Journal of the Linnean Society 105:
1-7.
63
GODOY, O., F. VALLADARES, AND P. CASTRO-DÍEZ. 2012. The relative
importance for plant invasiveness of trait means, and their plasticity and
integration in a multivariate framework. New Phytologist 195: 912-922.
GRAMMATIKOPOULOS, G., AND Y. MANETAS. 1994. Direct absorption of water
by hairy leaves of Phlomis fruticosa and its contribution to drought avoidance.
Canadian Journal of Botany 72: 1805-1811.
GUTIÉRREZ, A.G., O. BARBOSA, D. A. CHRISTIE, E. DEL-VAL, H. A. EWING,
C. G. JONES, P. A. MARQUET, ET AL. 2008. Regeneration patterns and
persistence of the fog dependent Fray Jorge forest in semiarid Chile during the
past two centuries. Global Change Biology 14: 161-176.
HASSIOTOU, F., J. R. EVANS, M. LUDWIG, AND E. J. VENEKLAAS. 2009.
Stomatal crypts may facilitate diffusion of CO2 to adaxial mesophyll cells in
thick sclerophylls. Plant, Cell and Environment 32: 1596-161.
HILDEBRANDT, A., AND E. A. B. ELTAHIR. 2006. Forest on the edge: seasonal
cloud forest in Oman creates its own ecological niche. Geophysical Research
Letter 33: L11401.
HOOD, G. M. 2010. PopTools version 3.2.5. Available on the internet. URL
http://www.poptools.org
JOHNSTONE, J.A., AND T. E. DAWSON. 2010. Climatic context and ecological
implications of summer fog decline in the coast redwood region. Proceedings of
the National Academy of Sciences of the United States of America 107: 4533-
4538.
JORDAN, G.J., P. H. WESTON, R. J. CARPENTER, R. A. DILLON, AND T. J.
BRODRIBB. 2008. The evolutionary relations of sunken, covered, and
encrypted stomata to dry habitats in Proteaceae. American Journal of Botany 95:
521-530.
KATATA, G., H. NAGAI, M. KAJINO, H. UEDA, AND Y. HOZUMI. 2010.
Numerical study of fog deposition on vegetation for atmosphere–land
interactions in semi-arid and arid regions. Agricultural and Forest Meteorology
150: 340-353.
LÓPEZ-CORTÉS, F., AND D. LÓPEZ. 2004. Antecedentes bioclimáticos del Parque
Nacional Bosque Fray Jorge. In: Squeo, F.A., Gutiérrez, J.R. & Hernández, I.R.
(eds.) Historia natural del parque nacional bosque Fray Jorge. Ediciones
Universidad de La Serena, Chile. 45-60.

64
LORTIE, C., AND L. W. AARSSEN. 1996. The specialization hypothesis for
phenotypic plasticity in plants. International Journal of Plant Science 157: 484-
487.
MARKESTEIJN, L., L. POORTER, F. BONGERS, H. PAZ, AND L. SACK. 2011a.
Hydraulics and life history of tropical dry forest tree species: coordination of
species’ drought and shade tolerance. New Phytologist 191: 480-495.
MARKESTEIJN, L., L. POORTER, H. PAZ, L. SACK, AND F. BONGERS. 2011b.
Ecological differentiation in xylem cavitation resistance is associated with stem
and leaf structural traits. Plant Cell and Environment 34: 137-148.
MATESANZ, S., A. ESCUDERO, AND F. VALLADARES. 2009. Impact of three
global change drivers on a Mediterranean shrub. Ecology 90: 2609-2621.
MATESANZ, S., E. GIANOLI, AND F. VALLADARES. 2010. Global change and the
evolution of phenotypic plasticity in plants. Annals of the New York Academy of
Sciences 1206: 35–55.
MEINZER, F. C., D. R. WOODRUFF, J. C. DOMEC, G. GOLDSTEIN, P. I.
CAMPANELLO, M. G. GATTI, AND R. VILLALOBOS-VEGA. 2008.
Coordination of leaf and stem water transport properties in tropical forest trees.
Oecologia 156: 31-41.
MURREN, C.J. 2002. Phenotypic integration in plants. Plant Species Biology 17: 89-
99.
NICOTRA, A.B., R. L. CHAZDON, AND A. D. SCHLICHTING. 1997. Patterns of
genotypic variation and phenotypic plasticity of light response in two tropical
Piper (Piperaceae) species. American Journal of Botany 84: 1542-1552.
NICOTRA, A.B., J.P. HERMES, C.S. JONES, AND C.D. SCHLICHTING. 2007.
Geographic variation and plasticity to water and nutrients in Pelargonium
austral. New Phytologist 176: 136–149.
NIINEMETS, U. 2001. Global-scale climatic controls of leaf dry mass per area, density
and thickness in trees and shrub. Ecology 82: 453-469.
NUÑEZ-ÁVILA, M. C., URIARTE, M., MARQUET, P. A., AND J. J. ARMESTO.
2013. Decomposing recruitment limitation for an avian-dispersed rain forest tree
in an anciently fragmented landscape. Journal of Ecology doi: 10.1111/1365-
2745.12148
PIGLIUCCI, M. 2003. Phenotypic integration: studying the ecology and evolution of
complex phenotypes. Ecology Letters 6: 265-272.
65
POCKMAN, W.T., AND J. S. SPERRY. 2000. Vulnerability to xylem cavitation and
the distribution of Sonoran Desert. American Journal of Botany 87: 1287-1299.
POORTER, H., U. NIINEMETS, L. POORTER, I. J. WRIGHT, AND R. VILLAR.
2009. Causes and consequences of variation in leaf mass per area (LMA): a
meta-analysis. New Phytologist 182: 565-588.
SALA, O.E., F. S. III. CHAPIN, J. J. ARMESTO, E. BERLOW, J. BLOOMFIELD, R.
DIRZO, E. HUBER-SANWALD, ET AL. 2000. Global biodiversity scenarios
for the year 2100. Science 287: 1770-1774.
SALGADO-NEGRET, B., F. PÉREZ, L. MARKESTEIJN, M. JIMENEZ-CASTILLO,
AND J. J. ARMESTO. 2013. Diverging drought tolerance strategies explain tree
species distribution along a fog-dependent moisture gradient in a temperate rain
forest. Oecologia. doi 10.1007/s00442-013-2650-7
SANTIAGO, L.S., G. GOLDSTEIN, F. C. MEINZER, J. B. FISHER, K. MACHADO,
D. WOODRUFF, AND T. JONES. 2004. Leaf photosynthetic traits scale with
hydraulic conductivity and wood density in Panamanian forest canopy trees.
Oecologia 140: 543-550.
SAVÉ, R., C. BIEL, AND F. DE HERRALDE. 2000. Leaf pubescence, water relations
and chlorophyll fluorescence in two subspecies of Lotus creticus L. Biologia
Plantarum 43: 239-244.
SCHLICHTING, C. D. 1989. Phenotypic plasticity in Phlox. II. Plasticity of character
correlations. Oecologia 78: 496-501.
SPERRY, J. S., N. M. HOLBROOK, M. H. ZIMMERMANN, AND M. T. TYREE.
1987. Spring filling of xylem vessels in wild grapevine. Plant Physiology 83:
414-417.
SPERRY, J.S., J. R. DONNELLY, AND M. T. TYREE. 1988. A method for measuring
hydraulic conductivity and embolism in xylem. Plant Cell and Environment 11:
35-40.
STANTON, D. E., B. SALGADO-NEGRET, J. J. ARMESTO, AND L. O. HEDIN.
2013. Forest patch symmetry depends on direction of limiting resource delivery.
Ecosphere http://dx.doi.org/10.1890/ES13-00064.1
SULTAN, S. E. 1987. Evolutionary implications of phenotypic plasticity in plants.
Evolutionary Biology 21: 127-178.
VALLADARES, F., E. GIANOLI, AND J. M. GÓMEZ. 2007. Ecological limits to
plant phenotypic plasticity. Tansley review. New Phytologist 176: 749-763.

66
VILLAGRÁN, C., J. J. ARMESTO, L. F. HINOJOSA, J. CUVERTINO, C. PÉREZ,
AND C. MEDINA. 2004. El enigmático origen del bosque relicto de Fray
Jorge. In: Squeo, F.A., Gutiérrez, J.R. & Hernández, I.R. (eds.) Historia natural
del parque nacional bosque Fray Jorge. Ediciones Universidad de La Serena,
Chile. 3-43.
VIOLLE, C., B. J. ENQUIST, B. J. MCGILL, L. JIANG, C. H. ALBERT, C.
HULSHOF, V. JUNG, AND J. MESSIER. 2012. The return of the variance:
intraspecific variability in community ecology. Trends in Ecology & Evolution
27: 244–252.
WAGNER, G.P. 1984. On the eigenvalue distribution of genetic and phenotypic
dispersion matrices: Evidence for a nonrandom organization for quantitative
character variation. Journal of Mathematical Biology 21: 77-95.
WEATHERS, K.C., G. M. LOVETT, G. E. LIKENS, AND N. F. M. CARACO. 2000.
Cloudwater inputs of nitrogen to forest ecosystems in southern Chile: Forms,
fluxes and sources. Ecosystems 3: 590-595.
WRIGHT, I.J., P. B. REICH, M. WESTOBY, D. D. ACKERLY, Z. BARUCH., F.
BONGERS, J. CAVENDER-BARES, ET AL. 2004. The worldwide leaf
economics spectrum. Nature 428: 821-827.
WRIGHT, I.J., D. S. FALSTER, M. PICKUP, AND M. WESTOBY. 2006. Cross-
species patterns in the coordination between leaf and stem traits, and their
implications for plants hydraulics. Physiologia Plantarum 127: 445-456.
ZANNE, A.E., M. WESTOBY, D. S. FALSTER, D. D. ACKERLY, S. R. LOARIE, S.
E. J. ARNOLD, AND D. A. COOMES. 2010. Angiosperm wood structure:
global patterns in vessel anatomy and their relation to wood density and
potential conductivity. American Journal of Botany 97: 207-215.

67
Table 1. Characterization of forest patches, including differences in mean values for
microclimatic variables and relative basal area for all live stems (>5 cm dbh) (Gutierrez
et al., 2008, Barbosa et al., 2010).
P1 P2 P5 P6
Patch area 0.21 0.28 36.08 23.76
Altitude (m) 529 566 635 639
Slope (%) 1 11 42 38
Throughfall (mm) 31.10 ± 21.31 49.91 ± 43.16 29.56 ± 18.05 37.38 ± 22.55
Stemflow (mm) 0.10 ± 0.06 0.25 ± 0.06 0.69 ± 1.07 1.00 ± 0.99
Mean temperature (°C) 11.8 ± 1.6 11.46 ± 1.75 11.29 ± 1.51 10.95 ± 1.42
Mean relative humidity (%) 91.33 ± 4.00 94.98 ± 3.04 95.96 ± 3.73 95.12 ± 4.63
Tree basal area (m2 ha-1) 61.64 49.41 125.12 102.61
Basal area A. punctatum (%) 49 75.7 46.4 88.8

68
Table 2. Differences in soil moisture, leaf water potential, leaf and hydraulic traits
among individuals of Aextoxicon punctatum growing in different zones of small and
large forest patches in Fray Jorge. Traits are abbreviated as, SOIL= soil moisture, ψPD=
leaf water potential at predawn, ψMD = leaf water potential at midday, SD = Stomatal
density, TD = Trichome density, LMA = Leaf mass area, VD = Vessel density, VDi =
Vessel diameter, K = Sapwood-specific hydraulic conductivity, PLC = % loss
conductivity. Different letters above mean values represent statistical differences
between zones for each trait from univariate ANOVA and post-hoc Tukey tests. PLC
data are available only for a subset of three individuals per zone in two patches.
Variables Small patches Large patches
Windward Core Leeward Windward Core Leeward
SOIL
(%)
10.43 ± 1.01
(b)
12.13 ±
1.12 (b)
5.02 ±
0.49 (a)
9.25 ±
0.62 (b)
14.59 ±
0.72 (c)
4.72 ±
0.30 (a)
ΨPD
(MPa)
0.55 ± 0.10
(a)
0.57 ±
0.09 (a)
0.74 ±
0.10 (a)
0.14 ±
0.03 (a)
0.10 ± 0.02
(a)
0.82 ±
0.06 (b)
ΨMD
(MPa)
1.27 ± 0.10
(a)
1.42 ±
0.08 (a)
1.81 ±
0.11 (b)
0.72 ±
0.04 (a)
0.71 ± 0.04
(a)
1.71 ±
0.12 (b)
SD
(N/mm2)
143.70 ±
4.82 (a)
130.00 ±
4.84 (a)
147.00 ±
6.44 (a)
107.90 ±
1.59 (a)
123.00 ±
4.35 (b)
170.70 ±
11.34 (c)
TD
(N/mm2)
9.30 ± 0.52
(b)
6.50 ±
0.45 (a)
9.50 ±
0.34 (b)
4.70 ±
0.30 (a)
5.00 ± 0.26
(a)
10.70 ±
0.97 (b)
LMA
(g/cm2)
0.02 ±
0.0007 (ab)
0.02 ±
0.001 (a)
0.02 ±
0.001 (b)
0.02 ±
0.001 (a)
0.01 ±
0.002 (a)
0.03 ±
0.002 (b)
VD (#/mm2) 330.76 ±
10.25(a)
330.55 ±
16.92 (a)
290.57 ±
17.54 (a)
284.96 ±
10.55 (a)
302.00 ±
11.37 (a)
309.28 ±
12.03 (a)
VDI (µm) 16.62 ± 0.24
(a)
16.65 ±
0.33 (a)
17.66 ±
0.41 (a)
17.97 ±
0.36 (a)
16.68 ±
0.49 (a)
16.89 ±
0.36 (a)
K 0.40 ± 0.04
(c)
0.24 ±
0.02 (b)
0.13 ±
0.02 (a)
0.41 ±
0.04 (b)
0.37 ± 0.03
(b)
0.10 ±
0.02 (a)
PLC (%) 0.063 ±
0.048 (a)
0.075 ±
0.043 (a)
0.502 ±
0.116 (b)
0.023 ±
0.014 (a)
0.045 ±
0.014 (a)
0.251 ±
0.032 (b)
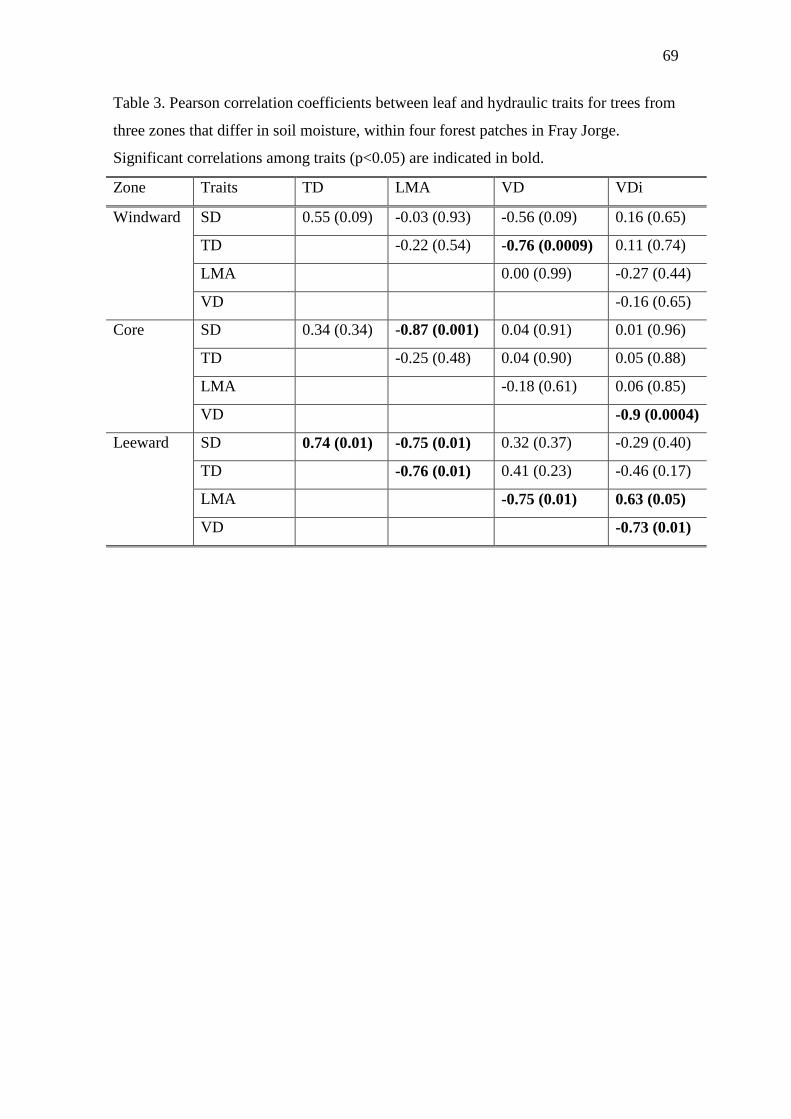
69
Table 3. Pearson correlation coefficients between leaf and hydraulic traits for trees from
three zones that differ in soil moisture, within four forest patches in Fray Jorge.
Significant correlations among traits (p<0.05) are indicated in bold.
Zone Traits TD LMA VD VDi
Windward SD 0.55 (0.09) -0.03 (0.93) -0.56 (0.09) 0.16 (0.65)
TD -0.22 (0.54) -0.76 (0.0009) 0.11 (0.74)
LMA 0.00 (0.99) -0.27 (0.44)
VD -0.16 (0.65)
Core SD 0.34 (0.34) -0.87 (0.001) 0.04 (0.91) 0.01 (0.96)
TD -0.25 (0.48) 0.04 (0.90) 0.05 (0.88)
LMA -0.18 (0.61) 0.06 (0.85)
VD -0.9 (0.0004)
Leeward SD 0.74 (0.01) -0.75 (0.01) 0.32 (0.37) -0.29 (0.40)
TD -0.76 (0.01) 0.41 (0.23) -0.46 (0.17)
LMA -0.75 (0.01) 0.63 (0.05)
VD -0.73 (0.01)
70
Figure caption
Figure 1. a. Location of rain forest patches in Fray Jorge National Park, Chile, at 30°S
(Barbosa et al. 2010). b. Directionality of fog and atmospheric resource inputs to forest
patches in Fray Jorge (Stanton et al. 2013).
Figure 2. Principal Component Analysis (PCA) of hydraulic and leaf trait variation for
Aextoxicon punctatum trees among forest patches (P1: circle, P2: rhombus, P5: triangle,
P6: square) and zones within patches (windward edge: black, patch core: grey, leeward
edge: white) in Fray Jorge.
Figure 3. Coefficient of variation of leaf and hydraulic traits of A. punctatum trees
among zones (windward: black, core: grey, leeward: white) within large forest patches
in semiarid Chile. Bars represent means ± 1 SE (n = 10). Different letters above the bars
represent statistically significant differences between zones.

Fig 1.
a
CoreWindward
b
71
Core Leeward

72
Fig 2.
-4.00 -2.00 0.00 2.00 4.00PCA 1 (40.6%)
-4.00
-2.00
0.00
2.00
4.00P
CA
2 (
26.8
%)
SD
TD
LMA
Ks
VD
VDi
SD
TD
LMA
Ks
VD
VDi
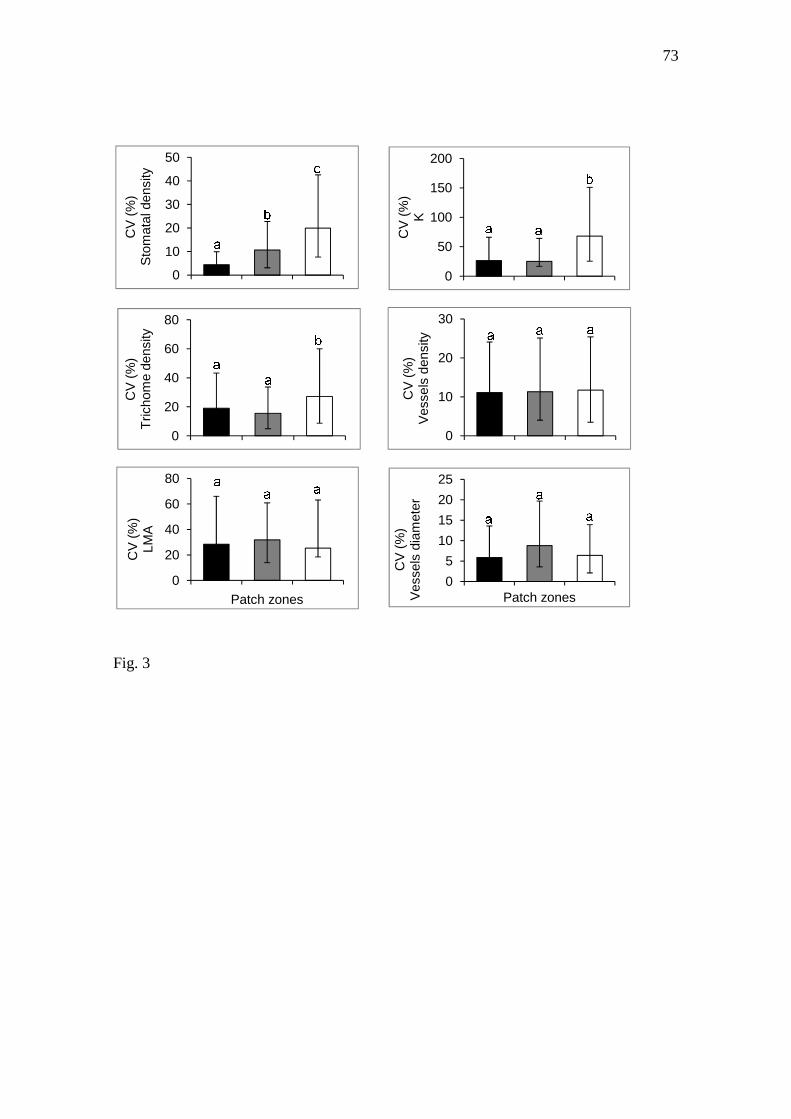
Fig. 3
0
20
40
60
80
CV
(%
)T
richo
me
dens
ity
0
20
40
60
80
CV
(%
)LM
A
Patch zones
0
10
20
30
40
50
CV
(%
)S
tom
atal
den
sity
Patch zones
0
50
100
150
200
CV
(%
)K
0
10
20
30
CV
(%
)V
esse
ls d
ensi
ty
0
5
10
15
20
25
CV
(%
)V
esse
ls d
iam
eter
Patch zones
73
Patch zones

74
Online Supplemental Materials
Appendix S1. Differences in soil moisture, leaf water potential, leaf and hydraulic traits
among individuals of Aextoxicon punctatum growing in different zones of small and
large forest patches. Traits are abbreviated as, SOIL= soil moisture, ψPD= leaf water
potential at predawn, ψMD = leaf water potential at midday, SD = Stomatal density, TD
= Trichome density, LMA = Leaf mass area, VD = Vessel density, VDi = Vessel
diameter, K = Sapwood-specific hydraulic conductivity, PLC = % loss conductivity
(available only for a subset of three individuals per zone for two patches).
Traits df F p
SOIL (%) Patch size (S) 1 0.20 0.6677
Zone (Z) 2 66.43 <0.0001
S x Z 2 3.30 0.0458
ΨPD (-MPa) Patch size (S) 1 54.50 0.0001
Zone (Z) 2 27.65 <0.0001
S x Z 2 4.91 0.012
ΨMD (-MPa) Patch size (S) 1 86.75 <0.0001
Zone (Z) 2 47.37 <0.0001
S x Z 2 4.13 0.022
SD (number mm-2) Patch size (S) 1 15.42 0.0044
Zone (Z) 2 24.28 <0.0001
S x Z 2 10.59 <0.0001
TD (number mm-2) Patch size (S) 1 32.15 0.0002
Zone (Z) 2 37.82 <0.0001
S x Z 2 13.57 <0.0001
LMA (g cm-1) Patch size (S) 1 0.49 0.5047
Zone (Z) 2 20.19 <0.0001
S x Z 2 9.83 0.0003
VD (number mm-2) Patch size (S) 1 2.85 0.1296
Zone (Z) 2 0.74 0.4829
S x Z 2 3.09 0.0553
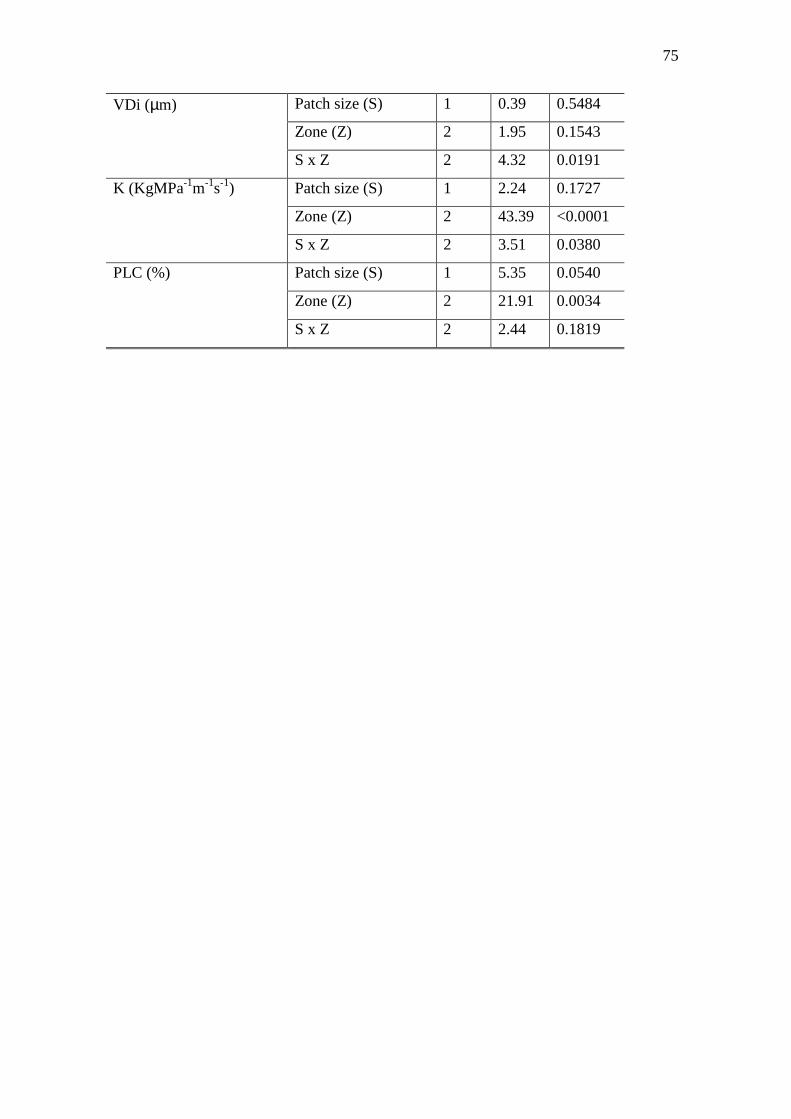
75
VDi (µm) Patch size (S) 1 0.39 0.5484
Zone (Z) 2 1.95 0.1543
S x Z 2 4.32 0.0191
K (KgMPa-1m-1s-1) Patch size (S) 1 2.24 0.1727
Zone (Z) 2 43.39 <0.0001
S x Z 2 3.51 0.0380
PLC (%) Patch size (S) 1 5.35 0.0540
Zone (Z) 2 21.91 0.0034
S x Z 2 2.44 0.1819

76
Appendix S2. Eigenvector scores of leaf and hydraulic traits in two main PCA axes.
Values in parentheses indicate the percentage of total variance accounted by each axis.
Traits are abbreviated as: SD = Stomatal density; TD = Trichome density; LMA = Leaf
mass area; Ks = Hydraulic conductivity; VD = Vessels density; VDi Vessels diameter.
Variables PCA 1 (40.6%) PCA 2 (26.8%)
SD 0.53 -0.06
TD 0.54 -0.07
LMA 0.42 -0.23
K -0.43 0.14
VD 0.16 0.68
VDi -0.17 -0.68

77
V. Conclusiones Generales

78
Conclusiones
Los rasgos funcionales ayudan a explicar la distribución de las especies a través de
gradientes de humedad del suelo, debido a que determinan la habilidad de las especies
para competir por agua y tolerar la sequía. El estudio de los rasgos funcionales y
mecanismos fisiológicos que determinan la tolerancia a la sequía de las especies es
importante para predecir sus respuestas a motores de cambio global como cambios
climáticos y fragmentación del hábitat.
En la primera parte de la tesis se evaluaron rasgos foliares e hidráulicos
relacionados con la tolerancia a la sequía en tres especies arbóreas con patrones
contrastantes de distribución dentro de los parches dependientes de neblina en el Parque
Nacional Fray Jorge. Los resultados mostraron que la distribución contrastante de las
especies a través del gradiente de humedad del suelo a pequeña escala es explicada por
las diferentes estrategias de uso del agua y carbono: Drimys winteri, especie restringida
al núcleo húmedo de los grandes fragmentos, presentó rasgos que permiten un eficiente
transporte de agua y ganancia de carbono; por el contrario, Myrceugenia correifolia,
especie que domina los bordes secos de los fragmentos, exhibió rasgos que promueven
la conservación del agua y bajas tasas fotosintéticas, así como menores punto de pérdida
de turgor. Aextoxicon punctatum, la especie ampliamente distribuida entre zonas y
fragmentos mostró valores intermedios de rasgos. Los datos demostraron que el
particionamiento del gradiente de humedad desde el núcleo a los bordes más secos entre
las especies arbóreas es dirigido por la tolerancia diferencial a la sequía, lo que implica
habilidades contrastantes para lidiar con las futuras reducciones en humedad del suelo.
En la segunda parte de la tesis se estudió la variación de la magnitud (media),
variabilidad (coeficiente de variación) y patrones de integración fenotípica de rasgos
foliares e hidráulicos en Aextoxicon punctatum a través de las zonas de humedad del
suelo en bosques de diferente tamaño en el Parque Nacional Fray Jorge. Los resultados
variaron según los rasgos evaluados: individuos creciendo en los bordes secos
mostraron mayores valores de LMA y densidad de tricomas y estomas que los
individuos creciendo en las zonas más húmedas del núcleo y el borde barlovento. En
contraste, los rasgos de la anatomía del xilema (diámetro y densidad de vasos
conductores) no variaron entre zonas o tamaños de fragmentos, produciendo pérdida de
conductividad hidráulica en las zonas más secas (sotavento). También se detectó mayor

79
integración fenotípica y variabilidad en sotavento. La habilidad de A. punctatum para
modificar los rasgos foliares en respuesta a la disponibilidad de agua en el suelo facilita
su persistencia en un amplio rango de microhábitats dentro de los fragmentos. Sin
embargo, su limitada plasticidad en la anatomía xilemática amenaza el flujo de agua e
incrementa el riesgo de cavitación en sotavento.
Los resultados obtenidos en esta tesis demuestran la importancia del estudio de
rasgos funcionales para explicar patrones de coexistencia y distribución espacial de las
especies a través de gradientes ambientales. Adicionalmente, son un insumo clave para
predecir la respuesta de las especies a futuros cambios en el clima, información que
debería ser incluida en los modelos de distribución de las especies bajo diferentes
escenarios de cambio climático.
Con el desarrollo de esta tesis surgieron algunas preguntas que sería interesante
responder a futuro:
El mantenimiento de la vegetación de los fragmentos de bosque de Fray Jorge
está determinado por el balance entre la niebla en primavera – verano y la precipitación
en temporada invernal. Este estudio se realizó durante la temporada primavera-verano
donde los fragmentos dependen exclusivamente de la neblina costera y se genera el
mayor gradiente de humedad. Sin embargo, sería clave monitorear el comportamiento
de las especies arbóreas a través de las distintas temporadas del año y a través de años
Niño y Niña que generan fuertes cambios en la precipitación y niebla. Este monitoreo
permitirá tener un panorama más claro sobre el estrés hídrico que experimentan las
especies y sobre las posibles tendencias climáticas en la zona.
Los rasgos foliares e hidráulicos relacionados con la tolerancia a la sequía
ayudaron a explicar la distribución de las especies arbóreas a través del gradiente de
humedad del suelo. Sin embargo, sería interesante explorar que otros factores podrían
afectar estos patrones de distribución. Por ejemplo evaluar si existen limitaciones en la
dispersión de las semillas o en el reclutamiento debido a la depredación de frutos,
semillas o plántulas. Adicionalmente, sería importante incluir la medición de rasgos
radiculares, por su importancia para la adquisición de agua-
A. puncatum y D. winteri son especies con amplia distribución en Chile. A
futuro sería interesante entender cómo varían los rasgos foliares e hidráulicos a través
de su rango de distribución y estudiar si las posibles diferencias son generadas por

80
plasticidad fenotípica o adaptación local. Si son adaptaciones generadas por presiones
selectivas en largos periodos de tiempo, los cambios climáticos acelerados pueden ser
más rápidos que la capacidad de las poblaciones a adaptarse. Así, esta información se
convierte en un insumo clave para tratar de predecir la respuesta de las especies a
variaciones ambientales.

81
V. Anexo I
82
Simetría de los parches de bosque depende de la
dirección de los recursos limitantes
Stanton DE, Salgado-Negret B, Armesto JJ, Hedin LO. 2013. Forest patch symmetry
depends on direction of limiting resource delivery. Ecosphere
http://dx.doi.org/10.1890/ES13-00064.1
83
Forest patch symmetry depends on direction of limiting resource delivery.
Daniel E. Stanton1,2,3, Beatriz Salgado-Negret2,4, Juan J. Armesto2,4, Lars O. Hedin1
1Department of Ecology and Evolutionary Biology, Princeton University, Princeton,
New Jersey 08544 USA
2Departamento de Ecología, Pontificia Universidad Católica de Chile, Santiago, Chile
3Ecology, Evolution and Behavior Department, University of Minnesota, St. Paul,
Minnesota 55108 USA
4Institute of Ecology and Biodiversity (IEB), Santiago, Chile
5Present address: Division of Plant Sciences, Research School of Biology, the
Australian National University, Acton, ACT 0200, Australia.
E-mail: [email protected]

84
Abstract
Edge effects are a major concern in the study and conservation of forest patches. The
traditional perspective, derived from patches formed by fragmentation, considers forest
edges as intermediates in a gradient between interior and exterior conditions,
symmetrically distributed around the core of the patch. We present a more general
conceptual model that shows that this perspective is only one of several possible
environmental gradients across forest patches. When resources are delivered
horizontally (e.g., fog, surface runoff), environmental parameters and species
composition are expected to have very different, asymmetric, distributions within forest
patches. We conducted transect surveys characterizing environmental conditions (light,
soil moisture, soil nutrients), vegetation structure and species composition in fog-fed
patches of relict temperate forest in northern Chile. Windward edges differed most from
the surrounding scrubland, whereas the core merely represented an intermediate
between windward and leeward edges. Community composition changed drastically
from temperate forest specialists on the windward edge to mediterranean shrub species
leeward. The simple edge-core model is shown to be inadequate for describing spatial
patterns in fog-influenced forests: a more universal model including the directionality of
external resource inputs and internal dynamics must be considered when evaluating
forest patch dynamics.
Keywords
asymmetry; community composition; ecosystems; fog; forest patch; matorral; temperate
rainforest; vegetation banding.
85
Introduction
Concerns over increasing forest fragmentation have drawn attention to the par
ticularities of forest patches. The edge of a forest will be affected by the surrounding
matrix outside the forest, and thus differ considerably from the interior. A consistent
focus of the literature has been to evaluate how far into a forest these ‘edge effects’
penetrate. Within this c on text, forest patches have often bee n portrayed as an edge
(bearing the influence of the area outside of the patch) surrounding a core unaffected by
the external matrix (Murcia 1995). Often implicit in this understanding of forest patches
is the assumption that small patches were formerly parts of a larger continuous forested
area.
This idealization is inherently radially symmetrical when viewed from above.
The width of the edge may be variable but the nucleus is conceived as a core around
which approximately symmetrical sides extend (Fig. 1A). Intrinsic to this concept of the
patch is an assumption that resources are delivered either vertically or diffuse
horizontally from all sides equally. Edge effect s such as slanted light, wind and non-
forest animals diffuse inwards towards the core from all sides. Vertically delivered
resources (light and rain) are delivered approximately evenly to the entire top layer of
the forest. Ecosystem properties that are tied to these resources, such as soil moisture,
soil nutrients and plant height can therefore be expected to also show a radial symmetry
around the core (Fig. 1B), as competition for the m will occur along the vertical axis.
Although often the case in antropogenically modified landscape s, patchiness is
not necessarily formed by fragmentation (Rietkerk and Van De Koppel 2008).
Vegetation patches can also arise by self-organization through local facilitation. For
example, Klausmeier (1999) showed theoretically that forest patches can arise from
directional surface-runoff in semi-arid ecosystems, and similar pat terns have been
empirically been demonstrated to occur in a wide range of ecosystems, from fog-fed
bromeliad fields in the Atacama (Borthagaray et al. 2010) through semi-arid shrublands
(Klausmeier 1999, Van De Koppel and Rietkerk 2004, Saco et al. 2007, Kéfi et al.
2010) to Sphagnum aggregations in fens (Eppinga et al. 2008, 2009, Manor and Shnerb
2008) and tree islands in the Everglades (Wetzel et al. 2008). In all of these cases
limiting resources such as water and nutrients are delivered in a horizontally asymmetric
86
manner (Fig. 1C). This strong directionality of resource delivery is likely to lead to
asymmetrical distribution of related ecosystem properties (Fig. 1D).
We propose a single general conceptual model that unites symmetrical and
asymmetric al forest patch structures. These two models are not so different when we
consider that light is also a directional limiting resource in forests. Although light
competition is considered a fundamental aspect of plant community structuring, it is
rarely considered in the context of generating asymmetry along the axis of delivery,
even if such a situation is evidently implied. This is qualitatively different from the
reported difference s between north- and south- facing edges of forests (Wales 1972,
Matlack 1993, 1994, Chen et al. 1996, Hylander 2005), which are attributed to effects of
insolation (i.e ., response to microclimatic differences rather than growth towards light).
The difference between vertically and horizon tally delivered resources is therefore best
considered in terms of directionality relative to the axis of plant growth, either parallel
(Fig. 1A) or perpendicular (Fig. 1C). Although light competition may be the most
commonly known form vertical competition, rainwater and nitrogen can also be subject
to ‘vertical processing’ (Ewing et al. 2009).
Many resources are effectively co-limiting at the ecosystem scale. For example,
if we consider banded forests in semi-arid environments, surface run-off water
(perpendicular) determines the presence and scale of forest patches, but light may
structure vegetation within t he patch (parallel). As such, while some ecosystem
properties (e.g., soil moisture) may be horizontally asymmetrical, others may be
horizontally symmetrical (e.g., vegetation structure) (Fig . 1E). Spatial patterns in plant
communities composition, which are driven by colimitation and trade-off between both
paralleland perpendicular resources, will reflect an intersection of these bidirectional
effects (Fig. 1F).
The consideration of directionality of resource delivery additionally challenges
the static view of forest patches. In a vertically structured forest patch the dynamics of
light competition will lead to upward growth and tradition al forest succesion (Horn
1971). If critical resources are delivered horizontally, we expect competition to occur
along the horizontal axis, for example ups lope for water and nutrients from surface run-
off (Saco et al. 2007), windward for resources from fog (Borthagaray et al. 2010) or
leeward when wind is a cause of mortality (Watt 1947, Sprugel and Bormann 1981,
Sato and Iwasa 1993). Since horizontal expansion is not constrained by the

87
biomechanical costs of overcoming gravity and retaining access to soil resources, it
should become apparent as a directional progression of forest patches across a
landscape, with considerable differences in community composition and ecosystem
processes between leading and lagging edges.
To test this conceptual model of spatial distribution of resources within forest
patches, we measured a number of above- and below-ground environmental variables
across fog-dependent forest patches in northern Chile. These forest patches contain
temperate rainforest trees far outside of their main climatic range in the midst of
Mediterranean semi-arid matorral (Squeo et al. 2004). The fog-water inputs are strongly
directional, and lead to large differences in tree recruitment and mortality between
wind-ward and leeward patch edge s (del Val et al. 2006). This directionality makes
these patches an ideal system in which to test whether ecosystem properties are more
strongly associated with directionality of resource deliver y or simply symmetrically
determined by distance from forest edge.
The spacing and width of fog-created banding is also dependent on slope: steep
slopes decrease the strength of horizontal competition for fog, leading to broader bands
or even continuous plant cover, whereas flatter ground encourage s the formation of
narrow, widely spaced bands (Borthagaray et al. 2010). Fog forest relics occur in areas
of highly variable topography, and larger patches tend to be associated with steeper
slopes (Barbosa et al. 2010), and so the effects of directionality on resource distribution
might be expected to weaken with increasing slope and patch size.
Considering that the primary source of water is horizontally driven fog, we
predicted below-ground ecosystem properties controlled by water availability (soil
moisture and nutrient availability) to be horizontally asymmetric al (Fig. 1 D), where as
above ground properties (plant height, understory light availability, litter depth) to be
driven by light competition, and therefore horizontally symmetrical (Fig. 1B). Plant
community composition, which is expected to be driven by competition for light, water
and nutrients, was predicted to reflect both vertical and horizontal influences (Fig. 1F).
We hypothesized that the fog influenced forest patches would not show a
symmetrical resource distribution (Core > Windward Edge = Leeward Edge > Matrix;
Fig. 1B) but rather an entirely asymmetrical (Windward Edge > Core > Leeward Edge >
Matrix; Fig. 1D) or mixed (Windward Edge = Core > Leeward Edge > Matrix; Fig. 1F).

88
Furthermore, we predicted asymmetries to be stronger in the small patches, in which
horizontal competition is expected to be stronger than in the larger patches.
Materials and methods
Site description
Research was conducted in Fray Jorge National Park, IVth Region, Chile (30°40´S,
71°83´W). A large number (370) of small patches of forest form a mosaic embedded in
a xerophytic matorral scrubland (Squeo et al. 2004, del Val et al. 20 06, Gutiérrez et al.
2008, Barbosa et al. 2010). The persistence of these forest patches, whose species
composition closely resembles Valdivian temperate rainforest (Villagrán et al. 2004),
despite very low rain fall (147 mm annually) at Fray Jorge has been attributed to
fogwater inputs (del Val et al. 2006). Forest patches span a wide range of sizes, from
0.1 to 36 ha (Barbosa et al. 2010) and in some areas form bands perpendicular to the
predominant wind direction (Fig. 2).
Sampling design
Transects were established perpendicular to forest patch edges and parallel to the
dominant wind direction. The length of each transect depended on the width of the
forest patch crossed, and was chosen to extend at least 3 sampling points beyond both
lee- and windward border. The ‘borders’ of the patch were determined as the first and
last point along each transect at which at least one plant exceeded 3 m in height. Ten
transects were conducted crossing a total of 14 patches, with several transects crossing
more than one patch. The patches sampled had been identified as representative of the
range of patch size s by previous studies (Barbosa et al. 2010), and can be roughly
categorized as small (width < 30 m, area < 1 ha), medium (30 m < width < 100 m, 1 ha
< area < 10 ha) and large (width > 100, area > 10 ha).
Light environments, vegetation structure and composition was assessed at 2-m
intervals along each transect (4-m intervals in medium and large patches).
Measurements of photosynthetically active radiation (PAR) were made using aquantum
sensor (LI-1905B; LI-COR, Lincoln, Nebraska, USA) under uniformly cloudy
conditions, and expressed as a percentage of the above-canopy PAR, which was
89
simultaneously recorded using a second quantum sensor that had been placed in a
nearby forest clearing. PAR measurements along transects were taken 1m above the
ground to represent the light environment of small saplings. The area surrounding the
sampling point was divided into 4 equal quadrats. The height and species of the canopy
overlying the sampling point, as well as the height and identity of the nearest woody
plant species in each quadrat were recorded.
Volumetric soil moisture at 2-m intervals was recorded in situ using a hand-held
TDR probe (Field scout TDR 100, Spectrum Technologies, Illinois, USA). Five
measurements were recorded for each sampling point, after clearing away leaf litter and
sub aerial roots. The depth of leaf litter was recorded when present.
Soil samples for soil nutrient content were collected at intervals of 2 m (small
patches), 4 m (medium patches) or 8 m (large patches). Approximately 20 g of soil were
collected, homogenized and oven-dried at 60 8 C to constant weight in the
Biogeochemistry lab of the Pontificia Universidad Católica de Chile, Santiago, Chile.
Subsamples (3 g) were sieved through 1-mm mesh and sent to the Hedin Lab, Prince
ton University, New Jersey, US A, for analysis. Samples were ground by mortar and
pestle and oven-dried at 60 °C for 3 days prior to carbon and nitrogen analysis using an
elemental analyzer (Carlo Erba 4500, Costech, California, USA).
Data analysis
The points within each transect were partitioned according to location within the
transect as one of four zones: core, leeward edge, windward edge, matrix. The core of
each patch was defined as the region in which average plant height at each sampling
point > 3 m. Edges were defined as those points within the patch (at least one plant > 3
m tall) but not contained in the core. The matrix was considered to be all points within a
transect in which no plants exceeded > 3 m in height, corresponding to scrubland rather
than forest.
All statistical analyses were performed using the open-source statistical soft
ware program R (R Development Core Team 2012). The distributions of above and
below-ground variables were evaluated by linear mixed effects models maximising log-
likelihood using the function lme in R package nlme (Pinheiro et al. 2013). Soil
moisture, plant height, leaf litter and light availability data were square-root transformed

90
for the analysis to conform to assumptions of normality and heteroscedasticity. Patch
identity and zone were used as random effects and patch size, zone and the interaction
of patch size and zone applied as fixed effects. Likelihood ratio tests were used to
determine the best model for each. Single fixed effect models are compared to the null
model, interaction models are compared to the relevant significant single fixed effect
model. Data available was insufficient to fit full inter action models for soil carbon and
soil nitrogen. To determine the pattern underlying significant fixed effects we conducted
Tukey multiple comparisons applied to the fullest significant LME using R package
multcomp (Hothorn et al. 2008).
Vegetation community composition was analyzed using Principal Coordinates
Analysis (PCO). We computed floristic similarity between locations using a Sorensen
dissimilarity and computed the two first axes of the PCO projection using R package
labdsv (Roberts 2012). The first axis of the PCO provided a single variable descriptor of
the community assemblage of each transect point. Linear mixed models using the PCO
1st axis as the dependent variable, patch size and/or zone as fixed effects and patch
identity and zone as random effects were created and tested as above to determine the
distribution of vegetation across patch zones and patch sizes. Furthermore, the
proportional distribution of individual species across patch zones was evaluated.
Results
Spatial patterns of abiotic variables
All but one (C:N ratio) of the above and below-ground abiotic variables measured
varied significantly with zone within the landscape (Table 1). Furthermore there were
interactions between zone and patch size for soil moisture, leaf litter depth and
understory light. Plant height was symmetrically distributed around the core (Fig. 3A),
which is partly driven by the height–based definition of the zonation. Leaf litter depth
did not differ within patches but was significantly greater than in the surrounding matrix
(z=-5, P< 0.0001; Fig. 3B), the only interaction with patch size being the significance of
the difference between the patch and the surroundings. No variables were found to be
completely asymmetrically distributed (Windward Edge > Core > Leeward Edge >
Matrix; Fig. 1D), however soil moisture, light, soil C and soil N all showed mixed
symmetry (Windward Edge = Core > Leeward Edge > Matrix; Fig. 1F, Fig. 3C, D, Fig.

91
4A, B). Windward edges and cores were wettest and most shaded in the small patches,
but not in the medium and large patch (Fig. 4A). Small patches showed asymmetrical
distributions, with the degree of symmetry decreasing with size. Large patches showed
the most symmetrical within-patch distributions (Fig. 4). Contrary to predictions soil C
and N were marginally asymetrical (z = -2.550, P < 0.05217 and z = -2.408, P <
0.07464, respectively) with the greatest values found at the leeward edge and core (Fig.
3C, D).
Plant community composition
The PCO first axis was able to repre sent 38.5% of the variance in plant community
composition. The woody plant community showed a significant response to patch zone
(Table 1). Although patches always differed from the surrounding matrix, the within-
patch distributions varied with patch size, from a symmetrical in small patches to
symmetrical around the core in medium and large patches (Fig. 4C). When individual
species are considered the patter ns are even more clearly pronounced. Species with
strong temperate wet forest affinities (Villagrán et al. 2004) were predominantly found
inside patches (Table 2). In small patches they showed asymmetric al preferences for
the windward edge and core with a reduced presence at the leeward edge. In large
patches the distribution was more frequently symmetrical, centering around the core of
the patch for the trees Aextoxicon punctatum, Drimys winteri and Raphithamnus
spinosus, but not for sclerophyllous trees Azara microphylla and Myrceugenia
correifolia and woody vine Griselinia scandens.
Discussion
Above-ground variables
The fog-fed forest patches were poorly described by the tradition al symmetrical model,
and showed strong directionality in several ecosystem properties. Many environmental
variables showed horizontally asymmetric al distributions (Table 1). Although some of
these distributions matched those predicted by our conceptual model, others differed
from prediction either in symmetry or in the form of asymmetry.

92
Differences in tree survival and foliage retention are also a likely explanation for
the striking asymmetry in understory light availability (Salgado-Negret et al. 2013).
Although we predicted that the vertical competition for light within patches would lead
to a symmetrical distribution (Fig. 1A, B), understory light availability actually appears
to show an inverse response to soil water content (Fig. 4). We observed considerably
denser living vegetation at windward than leeward edges, and high drought-induced
mortality and leaf loss probably allow for far greater light penetration. The increased
light penetration would then create a positive feedback by increasing evaporation from
the soil surf ace. The reduced insolation on the wind ward edge should also translate
into lowered soil temperatures and reduced vaporation rates from the soil, which may
translate into reduce d drought and greater canopy density.
Below-ground variables
Soil characteristics were distinctly asymmetrical along a windward to leeward axis, as
predicted, however the details of the distributions differed markedly from our
hypotheses. Soil moisture, which is strongly influenced by fog water inputs, was
expected to be greatest at the windward edge and decrease a cross the patch due to the
progressive ‘filtering’ out of fog-droplets from the air by trees, as described in simpler
fog-influenced banded vegetation (Borthagaray et al. 2010). However, although soil
water content was high at the windward edge, it was comparable or greater in the patch
core (Fig. 4A). Trees were significantly taller in the patch core, which may allow them
to access fog water unavailable to shorter trees, thereby partially escaping the
interference effects of upwind competitors. Soil carbon and nitrogen increased greatly
from the windward edge to the core, before decreasing again more gradually to leeward.
This suggests that the availability of soil nutrients is not a simple function of moisture
and litter inputs, and may instead be indicative of more complex ecosystem dynamics,
as discussed below.
Fundamental differences between patch types
Small and large patches differed considerably in their spatial structure, both above- and
below-ground. Barbosa et al. (2010) characterized the microclimatic and structural
characteristics of forest patches (including a subset of those sampled in the present
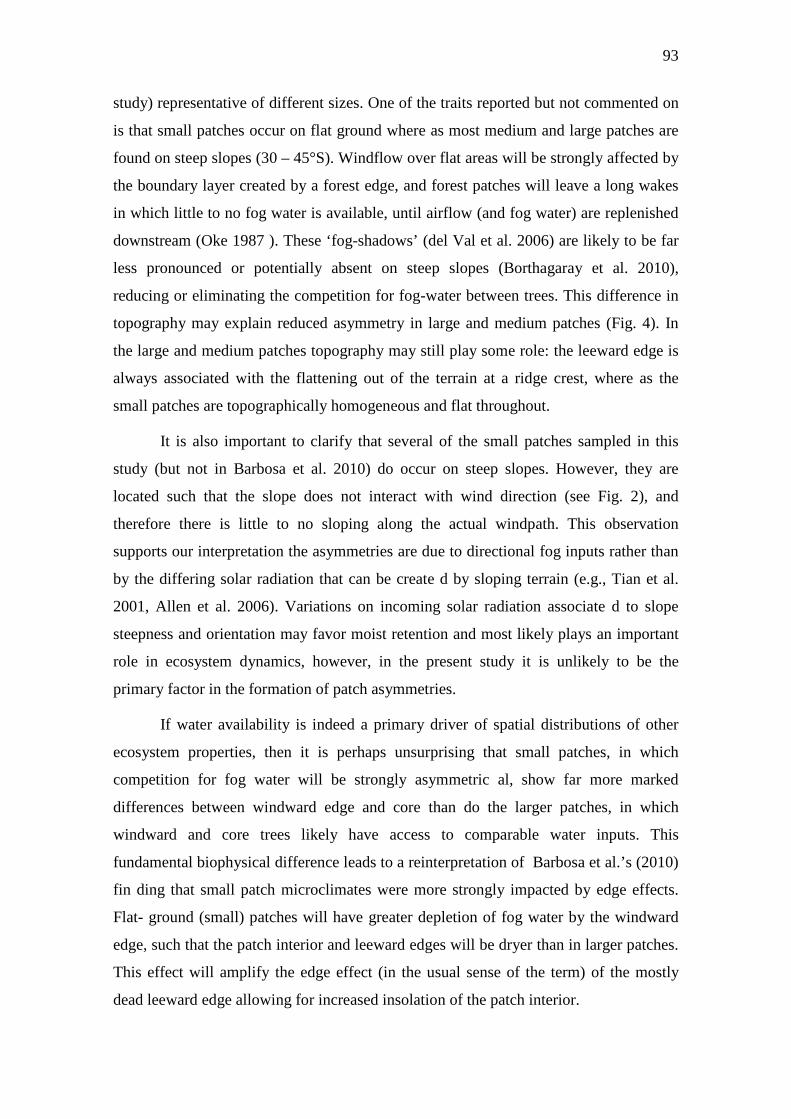
93
study) representative of different sizes. One of the traits reported but not commented on
is that small patches occur on flat ground where as most medium and large patches are
found on steep slopes (30 – 45°S). Windflow over flat areas will be strongly affected by
the boundary layer created by a forest edge, and forest patches will leave a long wakes
in which little to no fog water is available, until airflow (and fog water) are replenished
downstream (Oke 1987 ). These ‘fog-shadows’ (del Val et al. 2006) are likely to be far
less pronounced or potentially absent on steep slopes (Borthagaray et al. 2010),
reducing or eliminating the competition for fog-water between trees. This difference in
topography may explain reduced asymmetry in large and medium patches (Fig. 4). In
the large and medium patches topography may still play some role: the leeward edge is
always associated with the flattening out of the terrain at a ridge crest, where as the
small patches are topographically homogeneous and flat throughout.
It is also important to clarify that several of the small patches sampled in this
study (but not in Barbosa et al. 2010) do occur on steep slopes. However, they are
located such that the slope does not interact with wind direction (see Fig. 2), and
therefore there is little to no sloping along the actual windpath. This observation
supports our interpretation the asymmetries are due to directional fog inputs rather than
by the differing solar radiation that can be create d by sloping terrain (e.g., Tian et al.
2001, Allen et al. 2006). Variations on incoming solar radiation associate d to slope
steepness and orientation may favor moist retention and most likely plays an important
role in ecosystem dynamics, however, in the present study it is unlikely to be the
primary factor in the formation of patch asymmetries.
If water availability is indeed a primary driver of spatial distributions of other
ecosystem properties, then it is perhaps unsurprising that small patches, in which
competition for fog water will be strongly asymmetric al, show far more marked
differences between windward edge and core than do the larger patches, in which
windward and core trees likely have access to comparable water inputs. This
fundamental biophysical difference leads to a reinterpretation of Barbosa et al.’s (2010)
fin ding that small patch microclimates were more strongly impacted by edge effects.
Flat- ground (small) patches will have greater depletion of fog water by the windward
edge, such that the patch interior and leeward edges will be dryer than in larger patches.
This effect will amplify the edge effect (in the usual sense of the term) of the mostly
dead leeward edge allowing for increased insolation of the patch interior.
94
Plant community as an integration of co-limiting factors
Vascular plant communities are often structured by competition for numerous
potentially limiting resources, such as light, water and nutrients. Having predicted that
these different resources would have different spatial distributions driven by
directionality of resource delivery, we hypothesized that plant communities would
reflect overlapping effects of vertical inputs (light and rain fall, Fig. 1A, B) and
horizontal inputs (fog water and nutrients, Fig. 1C, D). Principal components ordination
clearly distinguished between forest and matorral plant communities (Fig. 4C). Contrary
to our predictions, understory light availability was strongly horizontally asymmetrical
in all patches, and itself possibly driven by positive feedbacks with asymmetric soil
water availability (Fig. 4A, B). As such, plant community composition was also
strikingly asymmetrical across patches, especially in small patches. Larger patches were
symmetrical in nature, with some more arid adapted shrubs (Myceugenia correifolia,
Kageneckia oblongata) present at both edges (Table 2). The differential microclimatic
conditions across these patches may also lead to ecophysiological differences between
individuals in those species that span the patches (Salgado-Ne gret et al. 2013).
Forest patches as self-organizing ecosystems
The spatial asymmetries of soil carbon and nitrogen content (Fig. 3C, D), while
differing from those predicted, they are in line with a dynamic view of forest patches.
Del Val et al. (2006) have proposed, based on the strong asymmetry in recruitment and
mortality between edges, that forest patches at Fray Jorge may be progressively moving
windward across the landscape. Under such a scenario, windward edges would be the
youngest, and considering that matorral soils are very carbon and nitrogen-poor, the
greater carbon and nitrogen content in core and leeward soils (Fig. 3C, D) may in fact
reflect the greater accumulation of organic matter and nutrients. The transition from
matorral to forest soils and communities across very small spatial scales (at times <5 m)
may therefore reflect the build-up of water and nutrient cycling facilitated by fog
collection. Such a self-organization of forest patches will leave a trail of modified
above-and below-ground ecosystem attributes in its leeward wake. The presence of such

95
a ‘foot-print’ of forests past can indeed be identified, and will be the subject of a
forthcoming paper (Stanton et al., unpublished manuscript).
Several forest associated species, such as Aextoxicon punctatum, Griselinia
scandens and Myrceugenia correifolia were occasionally found outside of the forest
patches (Table 2). These individuals, when not just windward of the forest edge, formed
small ‘mini-patches’ that may be incipient forest patches. The long-term persistence of
windward migrating forest patches requires the regeneration of patches downwind. The
mechanisms for formation of these patches are unknown, and may be associated with
exceptional weather events, such as large El Niño-Southern Oscillation (ENSO) events,
as is the case for tree recruitment in other semi-arid locations (Holmgren et al. 2006).
It is well understood that species will assort along environmental gradients such
as those found across forest patches. However, general models of how these gradients
themselves form are more often overlooked or implicitly assumed. We have shown that
the direction of delivery of limiting resources drives the spatial asymmetries in forest
structure. Symmetrical forest patches consisting of a core and periphery are but a special
(albeit widespread) case of forest patch structure, in which t he primary directional
limiting resources (water and light) are delivered vertically. Not all natural ecosystems
incorporating a mosaic of small forest patches may show the same directionality. For
example, Silva and Anand (2011) studied Araucaria forest patches that exhibited
asymmetries, but without the strong directionality that we have documented in Fray
Jorge. In such cases feedbacks from the surrounding matrix (e.g., fire, competition with
shrubs or grasses, different water and nutrient availability, soil microbial communities)
may act to stabilize patches. In yet other ecosystems the driver of asymmetries may be
seed rain, nutrient deposition (Weathers 1999, Ewing et al. 2009), run off (Klausmeier
1999, Van De Koppel and Rietkerk 2004, Saco et al. 2007, Kéfi et al. 2010) or frost
damage (Watt 1947, Sprugel and Bormann 1981, Sato and Iwasa 1993). The conceptual
frame work and empirical confirmation presented here are a step towards a more
inclusive understanding of forest patches and their internal and external dynamics.
Acknowledgements
This research was funded by NSF DDIG award # 0909984 to L. H. and D. S.; Princeton
Latin American Studies Travel Grants and a Princeton President’s Award to D. S. and
96
CONICYT fellowship 24110074 to B.S-N. Research in Chile was conducted under
CONAF research permit 06/08. We would like to extend special thanks to Patricio
Valenzuela, María Fernanda Pérez and the CONAF staff at Fray Jorge for support in the
field, Aurora Gaxiola, Pablo Marquet, Adam Wolf, Carla Staver and members of the
Armesto and Perez labs for their support and discussion of ideas as well as Madhur
Anand and two anonymous reviewers for suggestions that have greatly improved the
manuscript.
References
Allen, R. G., R. Trezza, and M. Tasumi. 2006. Analytical integrated functions for daily
solar radiation on slopes. Agricultural and Forest Meteorology 139:55-73.
Barbosa, O., P. A. Marquet, L. D. Bacigalupe, D. A. Christie, E. Del-Val, A. G.
Gutierrez, C. G. Jones, K. C. Weathers, and J. J. Armesto. 2010. Interactions
among patch area, forest structure and water fluxes in a fog-inundated forest
ecosystem in semi-arid Chile. Functional Ecology 24:909-917.
Borthagaray, A. I., M. A. Fuentes, and P. A. Marquet. 2010. Vegetation pattern
formation in a fog-dependent ecosystem. Journal of Theoretical Biology 265:18-
26.
Chen, J., J. Franklin, and J. Lowe. 1996. Comparison of abiotic and structurally defined
patch patterns in a hypothetical forest landscape. Conservation Biology 10:854-
862.
del Val, E., J. Armesto, O. Barbosa, D. Christie, A. Gutiérrez, C. Jones, P. Marquet, and
K. Weathers.2006. Rain forest islands in the Chilean semiarid region: fog-
dependency, ecosystem persistence and tree regeneration. Ecosystems 9:598-
608.
Eppinga, M., M. Rietkerk, W. Borren, E. Lapshina, W. Bleuten, and M. Wassen. 2008.
Regular surface patterning of peatlands: confronting theory with field data.
Ecosystems 11:520-536.
Eppinga, M. B., P. C. De Ruiter, M. J. Wassen, and M. Rietkerk. 2009. Nutrients and
hydrology indicate the driving mechanisms of peatland surface patterning.
American Naturalist 173:803-818.

97
Ewing, H. A., K. C. Weathers, P. H. Templer, T. E. Dawson, M. K. Firestone, A. M.
Elliott, and V. K. S. Boukili. 2009. Fog water and ecosystem function:
heterogeneity in a California redwood forest. Ecosystems 12:417-433.
Gutiérrez, A., O. Barbosa, D. Christie, E. Del-Val, H. Ewing, C. Jones, P. Marquet, K.
Weathers, and J. Armesto. 2008. Regeneration patterns and persistence of the
fog-dependent Fray Jorge forest in semiarid Chile during the past two centuries.
Global Change Biology 14:161-176.
Holmgren, M., B. López, J. Gutiérrez, and F. Squeo. 2006. Herbivory and plant growth
rate determine the success of El Niño Southern Oscillation-driven tree
establishment in semiarid South America Global Change Biology 12:2263-2271.
Horn, H. S. 1971. The adaptive geometry of trees. Princeton University Press,
Princeton, New Jersey, USA.
Hothorn, T., F. Bretz, and P. Westfall. 2008. Simultaneous inference in general
parametric models. Biometrical Journal 50:346-363.
Hylander, K. 2005. Aspect modifies the magnitude of edge effects on bryophyte growth
in boreal forests. Journal of Applied Ecology 42:518-525.
Kéfi, S., M. B. Eppinga, P. C. Ruiter, and M. Rietkerk. 2010. Bistability and regular
spatial patterns in arid ecosystems. Theoretical Ecology 3:257-269.
Klausmeier, C. 1999. Regular and irregular patterns in semiarid vegetation. Science
284:1826-1828.
Manor, A., and N. Shnerb. 2008. Facilitation, competition, and vegetation patchiness:
From scale free distribution to patterns. Journal of Theoretical Biology 253:838-
842.
Matlack, G. R. 1993. Microenvironment variation within and among forest edge sites in
the eastern United States. Biological Conservation 66:185-194.
Matlack, G. R. 1994. Vegetation dynamics of the forest edge: trends in space and
successional time. Journal of Ecology 82:113-123.
Murcia, C. 1995. Edge effects in fragmented forests: implications for conservation.
Trends in Ecology and Evolution 10:58-62.
Oke, T. R. 1987. Boundary layer climates. Routledge, Oxon, UK.

98
Pinheiro, J., D. Bates, S. DebRoy, D. Sarkar, and R Core Team. 2013. nlme: Linear and
nonlinear mixed effects models. http://CRAN.R-project.org/package=nlme.
R Development Core Team. 2012. R: A language and environment for statistical
computing. R Founda-tion for Statistical Computing, Vienna, Austria.
Rietkerk, M., and J. Van De Koppel. 2008. Regular pattern formation in real
ecosystems. Trends in Ecology and Evolution 23:169-175.
Roberts, D. W. 2012. labdsv: Ordination and multivariate analysis for ecology.
http://CRAN.R-project. org/package¼labdsv
Saco, P., G. Willgoose, and G. Hancock. 2007. Ecogeomorphology of banded
vegetation patterns in arid and semi-arid regions. Hydrology and Earth System
Sciences 11:1717-1730.
Salgado-Negret, B., F. Pérez, L. Markesteijn, M. J. Castillo, and J. J. Armesto. 2013.
Diverging drought-tolerance strategies explain tree species distribution along a
fog-dependent moisture gradient in a temperate rain forest. Oecologia doi:
10.1007/s00442-013-2650 -7
Sato, K., and Y. Iwasa. 1993. Modeling of wave regeneration in subalpine Abies
forests: population dynamics with spatial structure. Ecology 74:1538-1550.
Silva, L. C. R., and M. Anand. 2011. Mechanisms of Araucaria (Atlantic) forest
expansion into southern Brazilian grasslands. Ecosystems 14:1354-1371.
Sprugel, D., and F. Bormann. 1981. Natural disturbance and the steady state in high-
altitude balsam fir forests. Science 211:390-393.
Squeo, F., A. Gutiérrez, and I. Hernández, editors. 2004. Historia Natural del Parque
Nacional Bosque Fray Jorge. Ediciones Universidad de La Serena, Chile.
Tian, Y. Q., J. Davies-Colley, P. Gong, and B. W. Thorrold. 2001. Estimating solar
radiation on slopes of arbitrary aspect. Agricultural and Forest Meteorology
109:67-74.
Van De Koppel, J., and M. Rietkerk. 2004. Spatial interactions and resilience in arid
ecosystems. American Naturalist 163:113-121.
Villagrán, C., J. Armesto, F. Hinojosa, J. Cuvertino, F. L. Pérez, and C. Medina. 2004.
Historia Natural del Parque Nacional Bosque Fray Jorge, Chapter El enigmático
99
origen del bosque relicto de Fray Jorge. Ediciones Universidad de La Serena, La
Serena, Chile.
Wales, B. A. 1972. Vegetation analysis of north and south edges in a mature oak-
hickory forest. Ecological Monographs 42:451-471.
Watt, A. 1947. Pattern and process in the plant community. Journal of Ecology 35:1–22.
Weathers, K. 1999. The importance of cloud and fog in the maintenance of ecosystems.
Trends in Ecology and Evolution 14:214-215.
Wetzel, P. R., A. G. Valk, S. Newman, C. A. Coronado, T. G. Troxler-Gann, D. L.
Childers, W. H. Orem, and F. H. Sklar. 2008. Heterogeneity of phosphorus
distribution in a patterned landscape, the Florida Everglades. Plant Ecology
200:83-90

100
Table 1. Effects of forest patch size and location with patch (zone) on soil moisture,
plant height, leaf litter depth, understory light availability, soil carbon, soil nitrogen and
woody plant community composition in linear mixed effects models (LME).
Dependent
variable
Fixed variable df AIC ∆AIC Likelihood
ratio
p Pattern
Soil
moisture
Patch size
Zone
Patch size x Zone
6
7
15
4419.1
4427.1
4461.4
6.3
4.8
-34.3
10.304
42.569
25.472
0.0058
<0.0001
0.0013
Mixed
Mixed-Sym
Plant height Patch size
Zone
Patch size x Zone
6
7
15
9163.8
9107.1
9115.6
-2
54.7
-8.5
2.051
60.724
7.516
0.3587
<0.0001
0.4821
Sym
Leaf litter
depth
Patch size
Zone
Patch size x Zone
6
7
15
673.1
644.8
643.9
-1.6
-1.6
26.7
2.360
32.690
18.929
0.3073
<0.0001
0.0309
Sym
Sym
Understory
light
Patch size
Zone
Patch size x Zone
6
7
15
623.0
602.2
595.1
-2.6
18.3
7.1
1.402
24.205
23.202
0.4962
<0.0001
0.0031
Mixed
Mixed-Sym
Soil carbon Patch size
Zone
6
7
1000.9
991.9
-1.9
7.18
7.18
2.117
13.110
13.110
0.3470
0.0044
Mixed
Soil
nitrogen
Patch size
Zone
6
7
140.6
133.4
-1.9
5.3
2.161
11.302
0.3394
0.0102
Mixed
C:N Patch size
Zone
6
7
663.6
661.4
-3.3
-1.1
0.687
4.812
0.7093
0.1861
Community
composition
Patch size
Zone
Patch size x Zone
6
7
15
-1194.9
-1246.7
-1250.1
-2.1
49.7
3.4
1.911
55.796
19.363
0.3846
<0.0001
0.0130
Mixed
Mixed-Sym

101
Table 2. Species and distribution of woody vascular plants (and the comparably sized
bromeliad Puya) large found in forest patch transects.
Species Family Small patches (%) Large patches (%)
WE C LE M WE C LE M
Aextoxicon punctatum Aextoxicaceae 32 49 3 15 6 76 17 1
Ageratina glechonophylla Asteraceae 50 0 17 33 11 0 0 89
Azara microphylla Salicaceae 0 89 0 11 36 19 17 28
Baccharis linearis Asteraceae 0 0 0 100 0 0 0 0
Baccharis vernalis Asteraceae 5 3 5 87 0 0 9 91
Bahia ambrosoides Asteraceae 0 0 0 100 0 0 0 0
Berberis actinacantha Berberidaceae 20 0 0 80 0 0 0 100
Calceolaria integrifolia Calceolariaceae 0 0 0 0 0 0 0 100
Colletia spinosa Rhamnaceae 0 0 0 100 0 0 0 100
Colliguaja odorifera Euphorbiaceae 0 0 0 0 100 0 0 0
Drimys winteri Winteraceae 0 0 0 0 5 92 3 0
Echinopsis chilensis Cactaceae 0 0 0 100 0 0 0 0
Erigeron luxurians Asteraceae 0 0 2 98 0 0 0 100
Eupatorium salvia Asteraceae 0 0 8 92 6 4 2 88
Fuchsia lysioides Onagraceae 0 0 0 100 0 0 0 0
Griselinia scandens Griselinaceae 26 32 16 26 10 28 47 16
Haplopappus foliosus Asteraceae 0 0 0 100 0 0 0 0
Kageneckia oblonga Rosaceae 0 0 0 100 0 0 0 100
Myrceugenia correifolia Myrtaceae 22 37 18 22 9 31 38 23
Puya chilensis Bromeliaceae 0 0 0 100 0 0 0 0
Raphithamnus spinosus Verbenaceae 8 58 8 25 8 69 18 5
Ribes punctatum Grossulariaceae 0 7 0 93 0 0 29 71
Senecio planiflorus Asteraceae 9 0 0 91 0 0 0 100
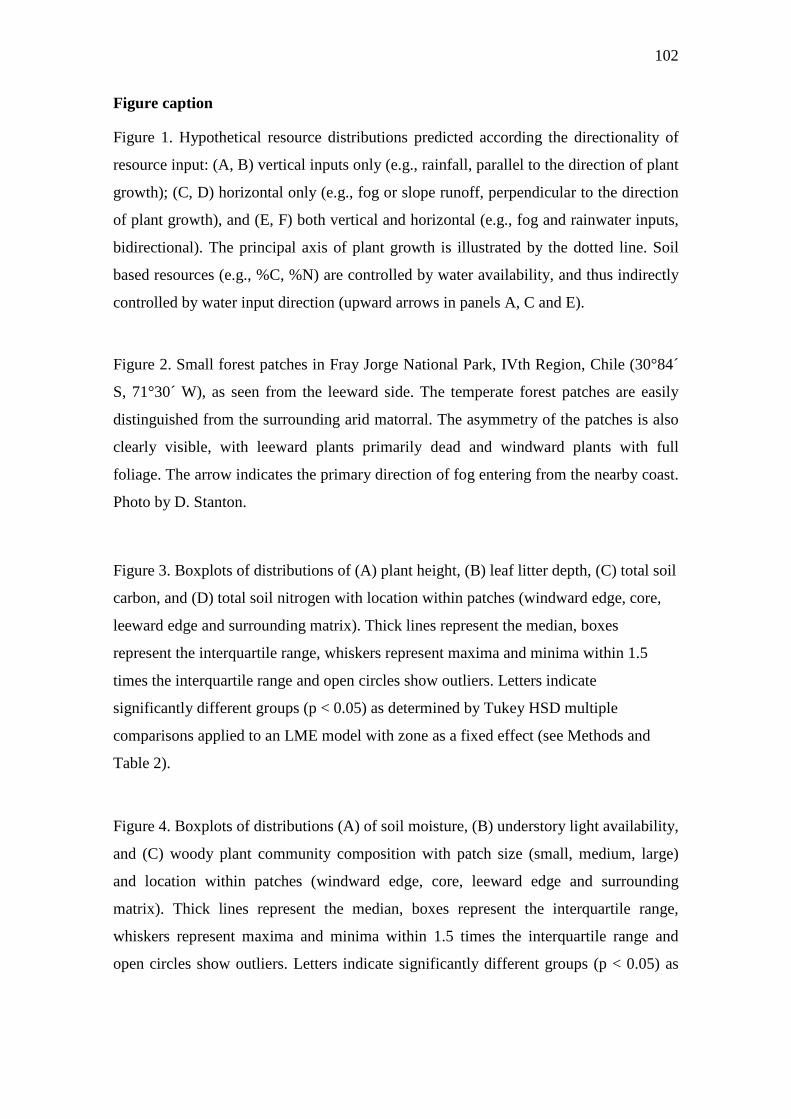
102
Figure caption
Figure 1. Hypothetical resource distributions predicted according the directionality of
resource input: (A, B) vertical inputs only (e.g., rainfall, parallel to the direction of plant
growth); (C, D) horizontal only (e.g., fog or slope runoff, perpendicular to the direction
of plant growth), and (E, F) both vertical and horizontal (e.g., fog and rainwater inputs,
bidirectional). The principal axis of plant growth is illustrated by the dotted line. Soil
based resources (e.g., %C, %N) are controlled by water availability, and thus indirectly
controlled by water input direction (upward arrows in panels A, C and E).
Figure 2. Small forest patches in Fray Jorge National Park, IVth Region, Chile (30°84´
S, 71°30´ W), as seen from the leeward side. The temperate forest patches are easily
distinguished from the surrounding arid matorral. The asymmetry of the patches is also
clearly visible, with leeward plants primarily dead and windward plants with full
foliage. The arrow indicates the primary direction of fog entering from the nearby coast.
Photo by D. Stanton.
Figure 3. Boxplots of distributions of (A) plant height, (B) leaf litter depth, (C) total soil
carbon, and (D) total soil nitrogen with location within patches (windward edge, core,
leeward edge and surrounding matrix). Thick lines represent the median, boxes
represent the interquartile range, whiskers represent maxima and minima within 1.5
times the interquartile range and open circles show outliers. Letters indicate
significantly different groups (p < 0.05) as determined by Tukey HSD multiple
comparisons applied to an LME model with zone as a fixed effect (see Methods and
Table 2).
Figure 4. Boxplots of distributions (A) of soil moisture, (B) understory light availability,
and (C) woody plant community composition with patch size (small, medium, large)
and location within patches (windward edge, core, leeward edge and surrounding
matrix). Thick lines represent the median, boxes represent the interquartile range,
whiskers represent maxima and minima within 1.5 times the interquartile range and
open circles show outliers. Letters indicate significantly different groups (p < 0.05) as

103
determined by Tukey HSD multiple comparisons applied to the LME model of the
Patch Size x Patch Zone interaction (see Methods and Table 2).
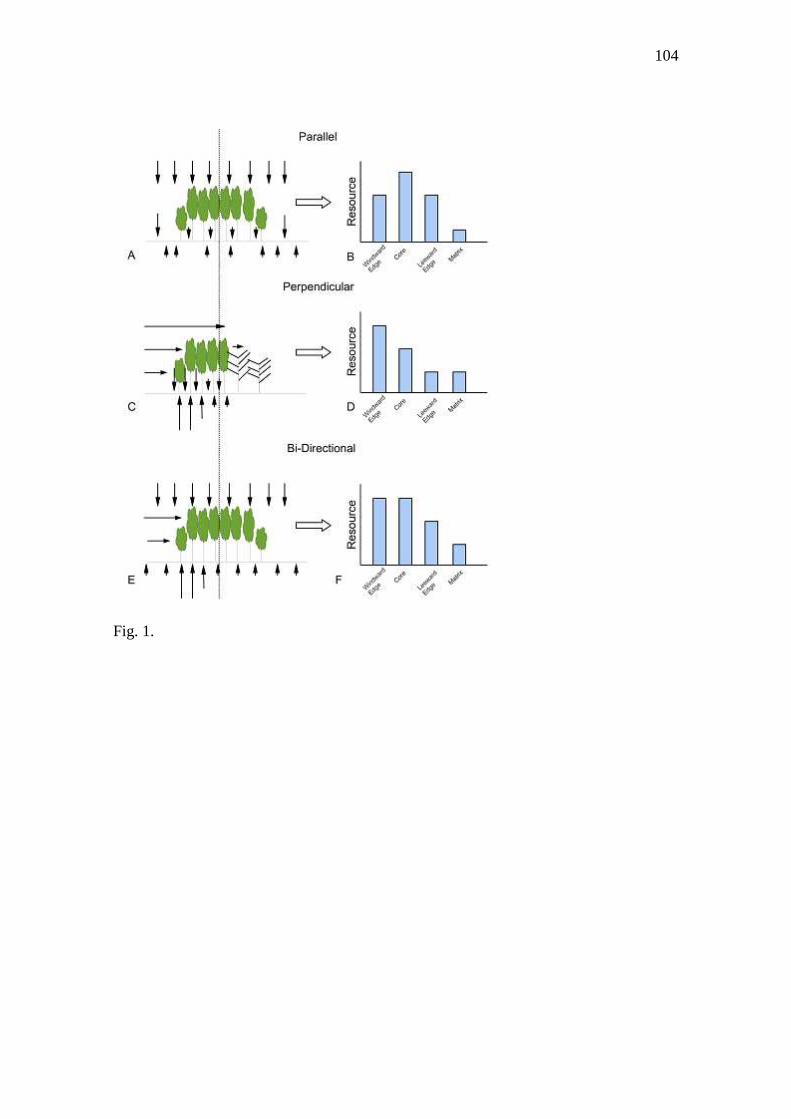
104
Fig. 1.
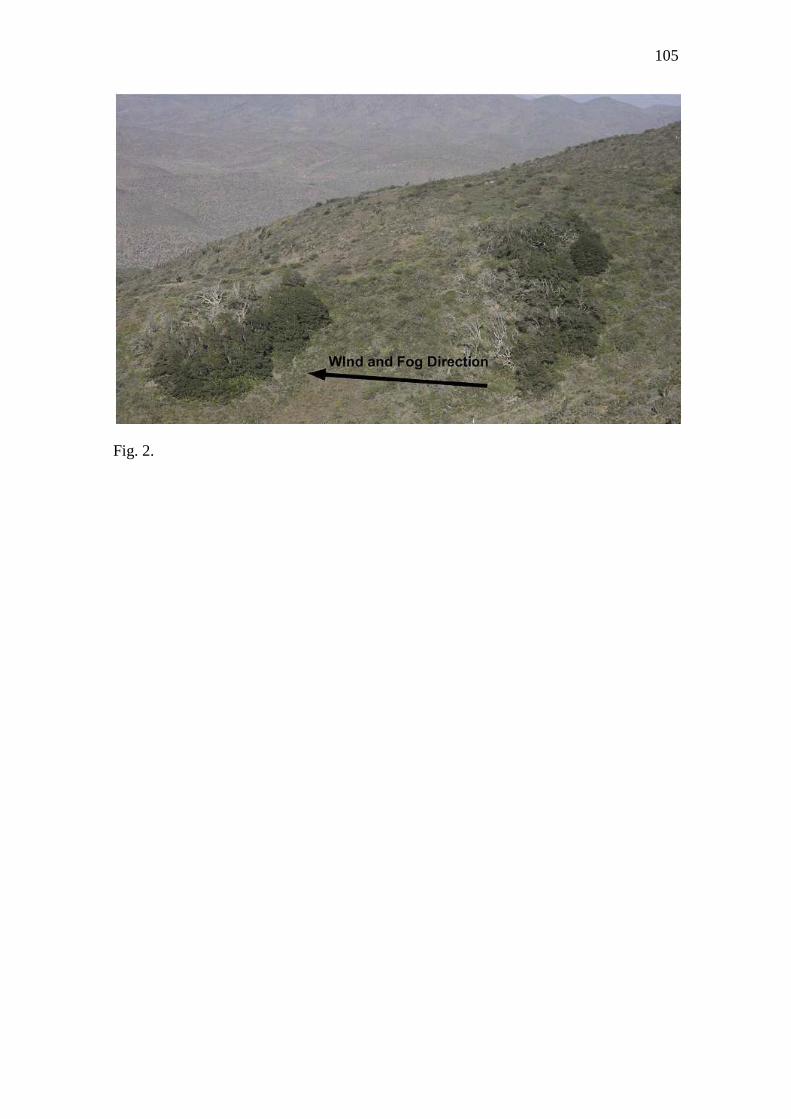
105
Fig. 2.
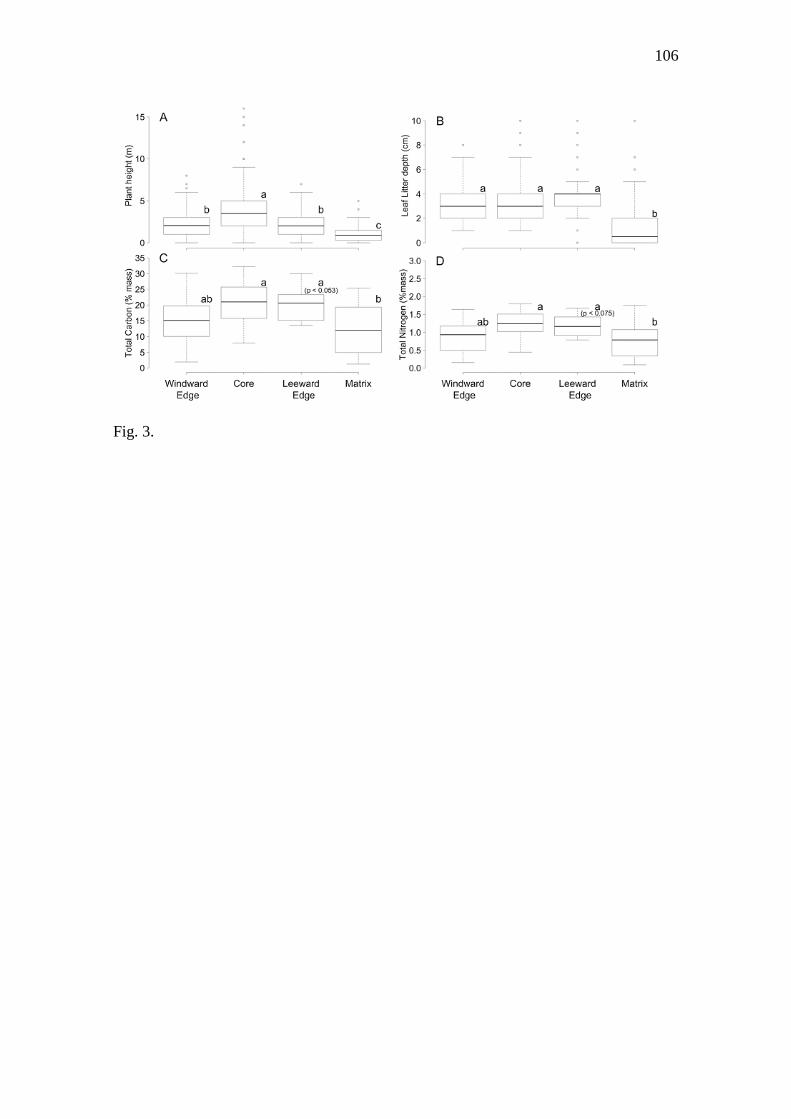
106
Fig. 3.
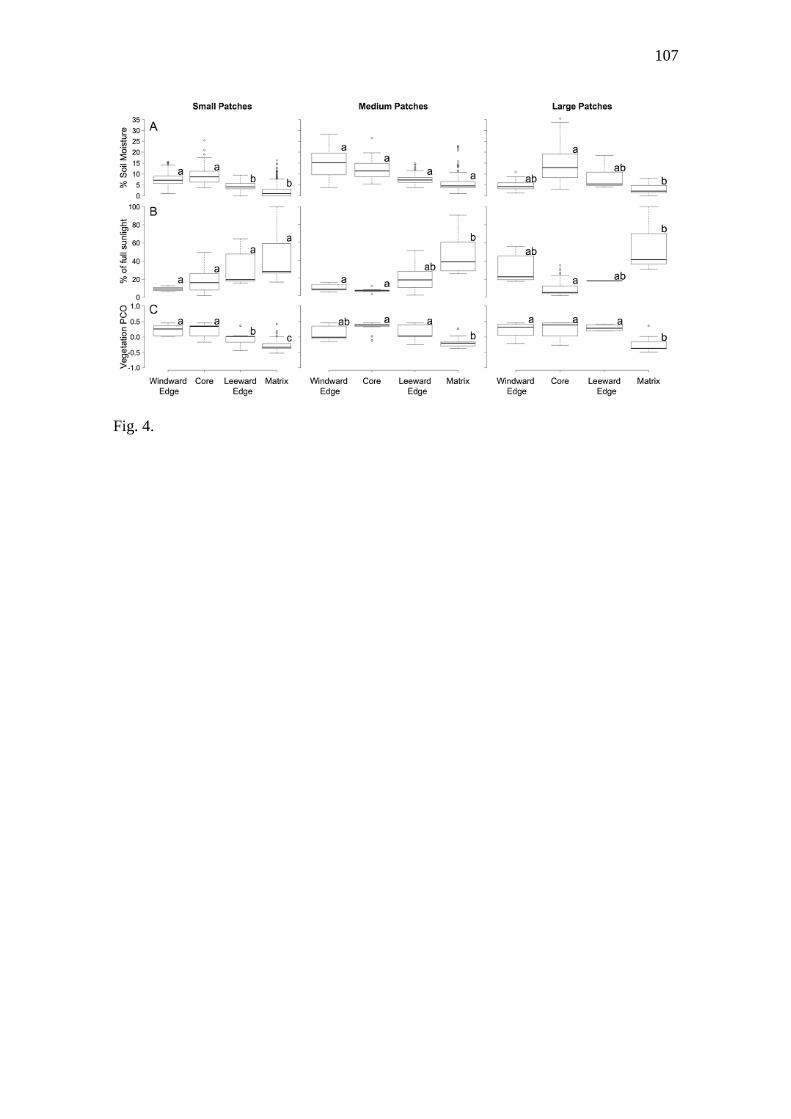
107
Fig. 4.