
UNIVERSID ADE SANTIA GO DE COMPOSTELA F A CUL T … · Doutor. San tiago de Comp ostela, F ebreiro...
252
-
Upload
nguyenthien -
Category
Documents
-
view
217 -
download
0
Transcript of UNIVERSID ADE SANTIA GO DE COMPOSTELA F A CUL T … · Doutor. San tiago de Comp ostela, F ebreiro...

UNIVERSIDADE DE SANTIAGO DE COMPOSTELAFACULTADE DE FÍSICADepartamento de Físi a de Partí ulasLabCAFRESEARCH AND DEVELOPMENTSON TIMING RPC'S.APPLICATION TO THE ESTRELA DETECTOROF THE HADES EXPERIMENT AT GSI
Diego González DíazSantiago de Compostela, February 2006

D. Juan Antonio Garzón HeydtProfesor titular da área de Físi a Atómi a Mole ular e Nu leareD. Paulo Jorge Ribeiro da FonteProfesor- oordinador do Instituto Superior de Engenhería deCoimbra (ISEC)Investigador no Laboratorio de Investigação e Físi a Experimentalde Partí ulas (LIP)CERTIFICANque a tese titulada:Resear h and developments on timing RPC's.Appli ation to the ESTRELA dete tor of theHADES experiment at GSI.foi realizada por D. Diego González Díazno Departamento de Físi a de Partí ulasda Universidade de Santiago de Compostelabaixo a súa dire ión, e onstitúe a teseque presenta para a adar o título de Doutor.Santiago de Compostela, Febreiro do 2006(defendida en Marzo do 2006)(revisada en Setembro do 2006)Asinado:Juan Antonio Garzón Heydt Paulo Jorge Ribeiro da Fonte


Agrade ementosO amiño ara a tese é largo e non está exento de in ertezas e frustra ións; étamén unha épo a na que, de maneira forzosa, profundizamos nas nosas apa i-dades e as levamos a limites que non sospeitabamos. O mundo da investiga iónque se me mostrou durante a elabora ión do presente traballo posúe múltiples aras: baste men ionar a alarmante proximidade do éxito e do fra aso que nosobriga a relativizar sobre estas e outras uestións fundamentais, ou a imperiosane esidade de distinguir entre o plano profesional e o personal : desgra iada-mente, a miña idea románti a da ien ia difí ilmente asa o feito de que oinvestigador é, ante todo, un ser humano. Por en ima das diferen ias persoais,a existen ia dun grupo de traballo aberto e on apa idade de ríti a, no queas persoas poden expresar as súas opinións ó mesmo nivel e dunha maneirahonesta, paré eme esen ial de ara ó éxito omún.Un último pensamento: a grande espe ializa ión da ien ia a tual obríganosa traballar en uestións extremadamente té ni as que teñen, a otío, unhaenorme inuen ia sobre avan es posteriores na nosa omprensión do mundo; senembargo, son fre uentemente estes últimos traballos os que al anzan renome eimportan ia. Compaxinar o disfrute desta espe ializa ión, hegando a per ebero papel último que ela xoga no avan e global da ien ia e da so iedade debe ser,penso eu, o motor que impulse a investiga ión moderna.Primeiramente, debo expresar o meu agrade emento ara ó atedráti o E.Zas e, en espe ial, ara ó profesor R. Vázquez. Con eles tiven a oportunidadede estudiar un problema de enorme a tualidade no ampo das astropartí ulas:a ara teriza ión dos uxos de neutrinos pro edentes da intera ión de protóns on enerxías a ima do orte GZK on fotóns do fondo universal de mi roondas,tema entral do meu traballo de investiga ión tutelado (TIT). É sabido portodos os meus oñe idos ata que punto estes dous primeiros anos mar aron omeu ará ter e a miña forma de entender a ien ia. Gardo gratos re ordos destaprimeira épo a, en parti ular das dis usións (diserta ións) os meus ompañeirosde despa ho, Lorenzo, Ángel e Kike.Nembargantes, o texto a tual, que onstitúe a miña tese de doutoramento,non sería posible sen o apoio ilusionado e in ondi ional do profesor J. A. Garzón(Hans), que me in orporou ó proxe to ESTRELA (Ele tri ally Shielded TimingRPCs Ensemble for Low Angles) no experimento HADES no GSI, Alemaña. Foigra ias a él que puiden oñe er a P. Fonte, nos laboratorios LIP en Coimbra,Portugal. Non teño palabras para des ribir as virtudes de Paulo, baste de ir queé unha persoa un grande sentido da responsabilidade tanto no ámbito ientfi o oma no personal. Creo ser ons iente da sorte que tiven ó poder traballar on él.A lista de agrade ementos profesionais non estaría ompleta sen A. Mangiarotti;a súa profunda e ríti a maneira de ollar ara a vida e ara a ien ia, impregnaesta tese desde a primeira palabra até a última. Muito obrigado Paulo e Alessio.
I must a knowledge a lot of other people with whom I had the oportunity towork along the years: to V. Pon e and N. Arista and the intense dis ussionson the uores en e yield in Barilo he: to all the Coimbra sta, spe ially to A.Blan o and L. Lopes, to me an example of s ienti integrity and friendship;to the GSI/HADES sta, in spe ial to W. Koenig and P. Salabura, who showedme how to deal with an experiment of the size of HADES and still keeping a harming personality; thanks to my friend H. Alvarez-Pol from whom I learnt theimportan e of the details and to M. Sán hez who always nds time to dis ussabout HADES; thanks to W. Riegler and C. Lippmann, our ommon dis ussionshave being ertainly enlightening and possibly paved the road to forth omingworks; I am endebted to M. Abbres ia who left a strong footprint in the last hapter of the thesis, and nally to F. Gómez for introdu ing me to the worldof un ertainty propagation, for his availability and honestity.Máis, alén da traxe toria profesional, sinto que teño unha débeda igual deimportante os meus: on Silviña, que me viu na er; on Rober, que de algunhamaneira sempre está presente; gra ias a Pablo pola súa amizade e amor poloaxedrez; ao `Tiempos Modernos' e todas as súas versións anteriores; a Dan,Ángel, Chis, Torri, Rubén, Paxtor, Lu, Isa, Eva, Enma e Móni a por tantos etantos momentos; a Lu ía pola súa ompañía e pa ien ia; gra ias a Julkin, porser un tipo ojonudo, a pesar de ser o meu irmán; gra ias a María, por ser amiña irmá; gra ias a Carlos e Marga (a parella imposible) pola súa amizade; aNa ho 'Xotehpli o' por ter sempre algo que expli arme; a Jaime, por abrirmeo amiño; a Bea, a se retaria do departamento, sen a al esta tese non seríaposible; ós amareiros da afetería de Físi a, Pa hín, pola súa presen ia, a Isae, espe ialmente, a Iván por demostrar que un mundo mellor é posible; ós meus ompañeiros de despa ho José Camino, Lorenzo, Ángel, Kike e Teresa por tantasdis usións interminables sobre alquera tema imaxinable, e, re entemente, aInés, Ví tor e Gonzalo, herdeiros desta longa tradi ión dos despa hos 003 e 005;espe ialmente gra ias a Manu, por ser así e selo ata o n, e a Tona, por soportalo;moitas gra ias Noe, por ter sempre un momento para es oitarme; gra ias ó restode estudiantes, a M. Zappata sen o al ESTRELA sería imposible, a Martín,Alex, Carme, Miguel, Eva, David e en espe ial a Pablo e Dani, por aturarme,thanks to my friends at GSI, spe ially to Gosia, Kasia, Svi ek, Stashu, Alex,Alberto, Gonzalo and Isaa , thanks to Gilo and his pizza fromaggio that allowedme (and still allows) to survive in Wixhausen, to Bella Italia and to all theHADES PhD students... (being a PhD student in HADES is not easy, I know);gardo unha débeda moi espe ial on Chiqui, que resistiu ase ata o nal, polasua serenidade e apoio nos momentos máis duros; por último gra ias ós meuspais e ós pais dos meus pais, que me apoiaron egamente mesmo sen ter unhaidea pre isa do que fago en realidade. É a eles a quen o meu esforzo e traballovan fundamentalmente adi ados, gra ias.

Contents1 Motivation 152 Pro esses in ionization gas dete tors 172.1 Ele tromagneti intera tions with matter . . . . . . . . . . . . . 172.1.1 Heavy parti les . . . . . . . . . . . . . . . . . . . . . . . . 182.1.2 High energy ele trons . . . . . . . . . . . . . . . . . . . . 232.1.3 γ photons . . . . . . . . . . . . . . . . . . . . . . . . . . . 242.2 Avalan hes in gases . . . . . . . . . . . . . . . . . . . . . . . . . . 262.2.1 Main pro esses . . . . . . . . . . . . . . . . . . . . . . . . 262.2.2 Energy distributions of the swarm . . . . . . . . . . . . . 262.2.3 Relevant parameters of the swarm . . . . . . . . . . . . . 272.2.4 Avalan he propagation . . . . . . . . . . . . . . . . . . . . 292.2.5 Avalan he statisti s . . . . . . . . . . . . . . . . . . . . . . 292.2.6 Streamer propagation . . . . . . . . . . . . . . . . . . . . 302.3 Breakdown in parallel plate geometries . . . . . . . . . . . . . . . 322.3.1 Townsend me hanism . . . . . . . . . . . . . . . . . . . . 322.3.2 Streamer me hanism . . . . . . . . . . . . . . . . . . . . . 333 Timing RPCs 353.1 Histori al introdu tion . . . . . . . . . . . . . . . . . . . . . . . . 353.1.1 PPCs . . . . . . . . . . . . . . . . . . . . . . . . . . . . . 353.1.2 RPCs . . . . . . . . . . . . . . . . . . . . . . . . . . . . . 363.1.3 Double gap RPC . . . . . . . . . . . . . . . . . . . . . . . 373.1.4 Operation modes . . . . . . . . . . . . . . . . . . . . . . . 373.1.5 Multi-gap RPC (MRPC) . . . . . . . . . . . . . . . . . . 383.1.6 Timing RPC (tRPC) . . . . . . . . . . . . . . . . . . . . . 393.2 Timing RPC physi s . . . . . . . . . . . . . . . . . . . . . . . . . 403.2.1 E ien y and primary ionization . . . . . . . . . . . . . . 403.2.2 Time response . . . . . . . . . . . . . . . . . . . . . . . . 413.2.3 Time- harge orrelation . . . . . . . . . . . . . . . . . . . 433.2.4 Spa e-Charge . . . . . . . . . . . . . . . . . . . . . . . . . 433.2.5 Prompt harge vs indu ed harge . . . . . . . . . . . . . . 453.2.6 Signal indu tion . . . . . . . . . . . . . . . . . . . . . . . 453.2.7 Rate apability . . . . . . . . . . . . . . . . . . . . . . . . 463.2.8 Type of ondu tivity . . . . . . . . . . . . . . . . . . . . . 473.2.9 Aging . . . . . . . . . . . . . . . . . . . . . . . . . . . . . 473.2.10 Ele troni s . . . . . . . . . . . . . . . . . . . . . . . . . . 483.3 Some timing RPC systems . . . . . . . . . . . . . . . . . . . . . . 497

8 CONTENTS3.3.1 HARP . . . . . . . . . . . . . . . . . . . . . . . . . . . . . 493.3.2 ALICE . . . . . . . . . . . . . . . . . . . . . . . . . . . . 493.3.3 STAR . . . . . . . . . . . . . . . . . . . . . . . . . . . . . 523.3.4 FOPI . . . . . . . . . . . . . . . . . . . . . . . . . . . . . 523.3.5 HADES . . . . . . . . . . . . . . . . . . . . . . . . . . . . 543.3.6 Features of tRPC walls . . . . . . . . . . . . . . . . . . . 554 Nu lear physi s at HADES 574.1 Relativisti heavy ion ollisions . . . . . . . . . . . . . . . . . . . 574.1.1 The Equation of State of Nu lear Matter . . . . . . . . . 574.1.2 In medium ee ts . . . . . . . . . . . . . . . . . . . . . . 594.2 Leptoni probes of in medium ee ts . . . . . . . . . . . . . . . . 614.2.1 CERES . . . . . . . . . . . . . . . . . . . . . . . . . . . . 624.2.2 NA60 . . . . . . . . . . . . . . . . . . . . . . . . . . . . . 644.2.3 DLS . . . . . . . . . . . . . . . . . . . . . . . . . . . . . . 654.3 The HADES experiment . . . . . . . . . . . . . . . . . . . . . . . 674.3.1 The SIS18 a elerator . . . . . . . . . . . . . . . . . . . . 694.3.2 The start and veto dete tors . . . . . . . . . . . . . . . . 704.3.3 The RICH . . . . . . . . . . . . . . . . . . . . . . . . . . . 704.3.4 The MDCs and the magnet . . . . . . . . . . . . . . . . . 704.3.5 The TOF wall . . . . . . . . . . . . . . . . . . . . . . . . 724.3.6 The shower dete tor . . . . . . . . . . . . . . . . . . . . . 734.3.7 The trigger s heme . . . . . . . . . . . . . . . . . . . . . . 744.3.8 O-line analysis . . . . . . . . . . . . . . . . . . . . . . . 744.3.9 The ba kground reje tion . . . . . . . . . . . . . . . . . . 755 The HADES tRPC wall 775.1 Introdu tion . . . . . . . . . . . . . . . . . . . . . . . . . . . . . . 775.1.1 Coordinate system and notation . . . . . . . . . . . . . . 775.1.2 Spe i ations of the TOF wall . . . . . . . . . . . . . . . 795.1.3 Simulation . . . . . . . . . . . . . . . . . . . . . . . . . . 815.2 Chara teristi s of the tRPC wall . . . . . . . . . . . . . . . . . . 845.2.1 Determination of the tRPC wall a eptan e . . . . . . . . 845.2.2 Rate of parti les . . . . . . . . . . . . . . . . . . . . . . . 865.2.3 O upan y . . . . . . . . . . . . . . . . . . . . . . . . . . 875.2.4 Number of petals . . . . . . . . . . . . . . . . . . . . . . . 895.3 Design . . . . . . . . . . . . . . . . . . . . . . . . . . . . . . . . . 985.3.1 1-layer layout . . . . . . . . . . . . . . . . . . . . . . . . . 985.3.2 2-layer layout . . . . . . . . . . . . . . . . . . . . . . . . . 1035.3.3 3-D design . . . . . . . . . . . . . . . . . . . . . . . . . . . 1075.4 Other issues . . . . . . . . . . . . . . . . . . . . . . . . . . . . . . 1095.4.1 Evaluation of the impa t over other dete tors . . . . . . . 1095.4.2 Au+Au 8 GeV/A . . . . . . . . . . . . . . . . . . . . . . . 1155.5 Con lusions . . . . . . . . . . . . . . . . . . . . . . . . . . . . . . 1166 Performan e of HADES tRPCs 1196.1 Introdu tion . . . . . . . . . . . . . . . . . . . . . . . . . . . . . . 1196.1.1 Cross-talk . . . . . . . . . . . . . . . . . . . . . . . . . . . 1206.2 Experimental setup . . . . . . . . . . . . . . . . . . . . . . . . . . 1216.2.1 The prototype . . . . . . . . . . . . . . . . . . . . . . . . 121

CONTENTS 96.2.2 The a quisition system . . . . . . . . . . . . . . . . . . . . 1226.2.3 The trigger system . . . . . . . . . . . . . . . . . . . . . . 1246.3 The parti le environment . . . . . . . . . . . . . . . . . . . . . . 1286.3.1 β and γβ distributions . . . . . . . . . . . . . . . . . . . . 1286.3.2 Primary rate . . . . . . . . . . . . . . . . . . . . . . . . . 1316.3.3 Spill time prole . . . . . . . . . . . . . . . . . . . . . . . 1326.4 Analysis . . . . . . . . . . . . . . . . . . . . . . . . . . . . . . . . 1336.4.1 Cuts . . . . . . . . . . . . . . . . . . . . . . . . . . . . . . 1336.4.2 q-t orrelation . . . . . . . . . . . . . . . . . . . . . . . . 1356.4.3 Time walks . . . . . . . . . . . . . . . . . . . . . . . . . . 1366.5 Dete tor performan es . . . . . . . . . . . . . . . . . . . . . . . . 1376.5.1 Intrinsi e ien y . . . . . . . . . . . . . . . . . . . . . . 1376.5.2 S an in voltage: working point . . . . . . . . . . . . . . . 1396.5.3 S an in position: homogeneity . . . . . . . . . . . . . . . . 1396.5.4 S an in rate: robustness . . . . . . . . . . . . . . . . . . . 1436.6 Spe i issues . . . . . . . . . . . . . . . . . . . . . . . . . . . . . 1446.6.1 Indu tion to walls . . . . . . . . . . . . . . . . . . . . . . 1446.6.2 Timing tails . . . . . . . . . . . . . . . . . . . . . . . . . . 1476.6.3 Multi-hit apability . . . . . . . . . . . . . . . . . . . . . 1476.6.4 High and low ionizing parti les . . . . . . . . . . . . . . . 1516.6.5 Calibration (slewing orre tion) . . . . . . . . . . . . . . . 1536.7 Con lusions . . . . . . . . . . . . . . . . . . . . . . . . . . . . . . 1567 Measurement of the growth oe ient 1577.1 Introdu tion . . . . . . . . . . . . . . . . . . . . . . . . . . . . . . 1577.2 The experimental te hnique . . . . . . . . . . . . . . . . . . . . . 1587.3 Results . . . . . . . . . . . . . . . . . . . . . . . . . . . . . . . . . 1597.4 Con lusions . . . . . . . . . . . . . . . . . . . . . . . . . . . . . . 1608 In rease of rate apability with T 1618.1 RPC behavior at high rates . . . . . . . . . . . . . . . . . . . . . 1618.1.1 The DC model . . . . . . . . . . . . . . . . . . . . . . . . 1618.1.2 RPC behavior under temperature variations . . . . . . . . 1638.2 The experiment . . . . . . . . . . . . . . . . . . . . . . . . . . . . 1658.2.1 Goal . . . . . . . . . . . . . . . . . . . . . . . . . . . . . . 1658.2.2 Setup . . . . . . . . . . . . . . . . . . . . . . . . . . . . . 1658.2.3 Data a quired . . . . . . . . . . . . . . . . . . . . . . . . . 1688.3 Single rate . . . . . . . . . . . . . . . . . . . . . . . . . . . . . . . 1708.3.1 Determination of the primary rate prole . . . . . . . . . 1708.3.2 A model for the e ien y to γ rays . . . . . . . . . . . . . 1728.3.3 Interpretation of the results . . . . . . . . . . . . . . . . . 1758.3.4 Dark rate . . . . . . . . . . . . . . . . . . . . . . . . . . . 1808.4 Time response . . . . . . . . . . . . . . . . . . . . . . . . . . . . 1818.4.1 S intillator time response to photons . . . . . . . . . . . . 1818.4.2 Cuts and data analysis . . . . . . . . . . . . . . . . . . . . 1838.4.3 Time response measurements (σ) . . . . . . . . . . . . . 1848.4.4 Time response measurements (to) . . . . . . . . . . . . . 1848.4.5 σ vs to . . . . . . . . . . . . . . . . . . . . . . . . . . . . 1868.4.6 Des ription of the time response to γ rays . . . . . . . . . 1878.5 Con lusions . . . . . . . . . . . . . . . . . . . . . . . . . . . . . . 189
10 CONTENTS9 Analyti des ription of rate ee ts 1939.1 An analyti model for the RPC time response . . . . . . . . . . . 1939.1.1 Conditions for omparison with data . . . . . . . . . . . . 1949.2 Data analysis . . . . . . . . . . . . . . . . . . . . . . . . . . . . . 1969.2.1 Data set . . . . . . . . . . . . . . . . . . . . . . . . . . . . 1969.2.2 Cuts applied . . . . . . . . . . . . . . . . . . . . . . . . . 1969.3 DC des ription . . . . . . . . . . . . . . . . . . . . . . . . . . . . 1979.3.1 Time at maximum (to) and e ien y (ε) . . . . . . . . . 1979.3.2 Time resolution (σT) . . . . . . . . . . . . . . . . . . . . . 2019.4 Flu tuations in the time response . . . . . . . . . . . . . . . . . . 2039.4.1 Stati non-uniformity of the ele tri eld . . . . . . . . . 2039.4.2 Dynami non-uniformity of the eld . . . . . . . . . . . . 2049.5 Constraints from the model . . . . . . . . . . . . . . . . . . . . . 2179.6 Con lusions . . . . . . . . . . . . . . . . . . . . . . . . . . . . . . 21910 Con lusions and outlook 221A A ompilation of useful results 223A.1 Derivation of the time at maximum to . . . . . . . . . . . . . . . 223A.2 Inuen e of the dead region . . . . . . . . . . . . . . . . . . . . . 224A.3 Formal derivation of the ee t of u tuations . . . . . . . . . . . 225A.4 Derivation of the instantaneous ohmi drop V (t) . . . . . . . . . 227A.5 Derivation of the auto orrelation fun tion for white noise . . . . 227A.6 Derivation of the stabilization time teq . . . . . . . . . . . . . . . 228B The weighting eld 231C Resumo 233C.1 Introdu ión . . . . . . . . . . . . . . . . . . . . . . . . . . . . . . 233C.2 Deseño . . . . . . . . . . . . . . . . . . . . . . . . . . . . . . . . . 235C.3 Veri a ión do on epto . . . . . . . . . . . . . . . . . . . . . . . 236C.4 RPCs mornas . . . . . . . . . . . . . . . . . . . . . . . . . . . . . 238C.5 Un tratamento analíti o das u tua ións . . . . . . . . . . . . . . 240C.6 Con lusións . . . . . . . . . . . . . . . . . . . . . . . . . . . . . . 242D Frases élebres 243

List of Tables3.1 Dierent timing RPC walls and some of their hara teristi s . . . 564.1 Light pseudo-ve tor mesons life times and bran hing ratios . . . 625.1 Arrangement of the ells in the proposed design . . . . . . . . . . 1066.1 Results of the evaluation of the multi-hit performan es . . . . . . 1516.2 Time response for fast and slow parti les . . . . . . . . . . . . . . 1538.1 Sour es used, distan es to the tRPC and geometri orre tion. . 172
11

NotationIn order to fa ilitate the reading, the magnitudes and onstants more fre-quently used in the following are ompiled here, together with their abbreviatednotation and typi al units.letter magnitude typi al unitsA mass number -A inuen ed area per avalan he mm2
Ag area of the glass plate m2
A A eptan e (also a tivity) - (mC)a q-V onstant pC/kVα Townsend oe ient mm−1
α∗ ee tive Townsend oe ient mm−1
B magneti eld Tb prompt to total harge ratio -b impa t parameter fmβ velo ity normalized to c -C apa itan e pC/kVc speed of light m/nsD diusion oe ient mm2/nsD ell length mD lepton dete tion probability -d thi kness of the resistive plate mmδ probability of ele tron extra tionat the athode -E ele tri eld kV/ mE total energy MeV
Ekin kineti energy MeVEw weighting eld m−1
e ele tron harge pCǫ energy of a parti le from theswarm eVǫo va uum diele tri onstant F m−1
ǫr relative diele tri onstant -ε dete tor e ien y -η atta hment oe ient mm−1
η density g/ m3
Φ, φ rate Hz/ m2
φlab azimuthal angle in `lab' -12

letter magnitude typi al unitsg gap size mmγ relativisti fa tor -I primary intensity Hz, ions/sI mean ex itation energy eV
i, I ele tri urrent nAk Boltzmann onstant eV/K
K, Kσ
intrinsi time resolution -K
Tintrinsi time at maximum -
K rate apability Hz/ m2
κ relative rate apability -κ ompressibility of nu lear matter MeVξ proje ted angle in the plane YZ -L separation distan e mL ideal ele tron dete tion probabil-ity -λ ionization mean free path mmM mass MeV/ 2m avalan he gain -
mte harge threshold -me ele tron mass MeV/ 2µi ion mobility V−1 m2/sN number of gaps -NA Avogadro number -No number of primary lusters -n average o upan y -no average number of primary lus-ters -n′
o average number of ee tive pri-mary lusters -P pressure barp momentum MeV/
q, qtotal
total harge pCqp, q
promptprompt indu ed harge pC
qinduced
total indu ed harge in the gap pCR resistan e Ωρ resistivity Ω mS avalan he growth oe ient ns−1
σT
time resolution psT kineti energy MeVT temperature Kt time s
teq stabilization time sto time at maximum ns
τg, τ relaxation time (also intrinsi time) s (-)θlab polar angle -
13

letter magnitude typi al unitsV ∗ redu ed voltage kVVth threshold voltage for Spa e-Charge regime kVve ele tron drift velo ity m/ns
vprop propagation velo ity of signal m/nsw ell width m
Xlab x oordinate in `lab' mx x oordinate in lo al tRPC sys-tem m
Xo radiation length mYlab y oordinate in `lab' my y oordinate in lo al tRPC sys-tem mZ impedan e ΩZ harge of the atoms of the media -
Zlab z oordinate in `lab' mz z oordinate in lo al tRPC sys-tem mz harge of the primary parti le -
14
Chapter 1MotivationThe development of RPCs in 1981 gave a han e to operate gaseous dete -tors under parallel geometries at very high ele tri elds, providing a very fastand narrow time response and, what is more important, avoiding the dete -tor breakdown. Due to the uniform ele tri eld, the avalan he multipli ationstarts immediately after the rst ele tron-ion pair is produ ed at any positionwithin the gas gap. This represents a fundamental dieren e when ompared tothe ylindri al geometries used in proportional dete tors, where the free hargesmust drift up to the multipli ation region. As a onsequen e, the u tuations inthe time measured with an RPC are linked to the avalan he u tuations duringthe pro esses of primary ionization and multipli ation of ele trons in the gas:they ultimately regulate the u tuations in the size of the signal indu ed in theread-out ele troni s, resulting in dierent rossing times at the threshold of the omparator, and yielding its hara teristi time resolution. On the other hand,the variations on the position of the rst intera tion ause a high independen eof the released harge from the olle ted one ( ontrary to the ase of propor-tional dete tors), resulting in a poor estimate of the energy lost by the primaryparti le.Possibly it was the realization of the importan e of the toleran es in narrowgaps that allowed, in year 2000, to improve the RPC time resolutions up to thelevel of 50 ps, being ompetitive with present `state of the art' fast s intillatorsand providing, as a benet, a redu ed pri e per hannel and magneti eld ompatibility. Su h te hnology has been named timing RPCs or simply tRPCs.There are several works that demonstrate that operation of RPCs, in any oftheir more usual ongurations, takes pla e under a very strong Spa e-Chargeee t, resulting from an avalan he self-eld of the order of the applied ele tri eld. There is a lassi al argument for wide gaps due to Raether, that linksSpa e-Charge with the apparition of streamers. Notably, RPCs an be operatedin a region of elds where Spa e-Charge is strong but streamers are absent. Thepresen e of the last would result in, at least, a worsening of the rate apabilities,limiting the maximum rea hable voltage in many appli ations and thereforeresulting in an overall worsening of the performan es.As in the ase of the RPCs developed in the 80's, yielding time resolutionsat the level of 1 ns, the re ent introdu tion of timing RPCs in 2000, with timeresolutions at the level of 100 ps, has opened the possibility of appli ation innu lear and parti le physi s. 15
16 CHAPTER 1. MOTIVATIONThis thesis represents a small part of a proje t that is aimed at overingthe region at the lower polar angles of the HADES spe trometer pla ed at GSIin Darmstadt, Germany. Su h tRPC wall represents an upgrade of the urrentspe trometer, that will allow to explore heavy ion ollisions of Au+Au up to1.5 GeV/A, in reasing our understanding of the properties of hadroni matterat densities more than twi e larger than in ordinary onditions.The tRPC wall proje t, internally alled ESTRELA (Ele tri ally ShieldedTiming RPCs Ensemble for Low Angles) is based on re ent en ouraging devel-opments of similar on epts, but in orporates the features that make HADESto be an unique environment. Among its more demanding requirements, thefollowing must be mentioned: the tRPC wall must provide: a) a high multi-hit apability and b) working rates up to almost 1 kHz/ m2 with ) an homoge-neous time distribution at the level of 100 ps. The experiment is devoted toprobe dense media through the measurement of lepton pairs oming from lightpseudo-ve tor mesons; the low bran hing ratio of the pro ess (10−5-10−4) re-quires also a very high dete tion e ien y and geometri a eptan e, to providereasonable statisti s. The design presented in hapter 5 has been devised tomeet those requirements.Su essful tests of a on ept based on ele tri ally shielded ells took pla e inspring 2003 and a detailed analysis is presented in hapter 6, together with themain `pros' and ` ons' of the approa h. Re ent results (November 2005) on anew tRPC prototype are out of the s ope of the present work but an be foundelsewhere [1.In view of the re ent interest in rea hing higher and higher primary rates, hapter 8 is devoted to the study of a te hnology that allows for an extension ofthe rate apability in one order of magnitude, based still on ordinary oat-glass,but moderately warmed. Also a more general des ription of rate ee ts on thiskind of dete tors, beyond a simple DC model, is proposed in hapter 9, andused to des ribe the data from hapter 6. Aiming at a quantitative omparison,a way for obtaining experimentally the parameter of the swarm S = α∗ve isa omplished in hapter 7 for a number of dierent gas admixtures.
Chapter 2Pro esses in ionization gasdete tors2.1 Ele tromagneti intera tions with matterOf the four known fundamental intera tions, the ele tromagneti one is the basi prin iple of almost all the dete tor systems that are nowadays used in experi-ments of nu lear and parti le physi s. Among the main reasons, the following an be mentioned: a) it is well understood, b) most of the parti les of interesthave ele tromagneti harge, and therefore they intera t ele tromagneti ally1, ) the ele tromagneti intera tion probability is large even for very thin media.Despite this, both the energy and harge released in a dete tor via ele tro-magneti intera tions are usually undete table. The ampli ation of the fewreleased harges to sizable signals be omes a te hni al problem, whose solutionresults in dierent dete tor families. Moreover, not always dete tion takes pla ethrough the ionization of the media, being also possible to make use of ex i-tation and de-ex itation pro esses (s intillators), Cherenkov emission (RICH2),transition radiation (TRD3) or all of them (ele tromagneti alorimeter). Fromthose who resort to ionization, the most widely used dete tor geometries are:a) the very fast parallel geometries as PPACs4 and RPCs5, b) the ylindri- al/proportional ones popularized for tra king in Wire Chambers. Other dete -tors that are worth to mention and that also make use of the ionization are theGEMs (Gas Ele tron Multipliers), TPCs (Time Proje tion Chambers) or solidstate dete tors popularized for tra king (sili on) or γ dete tion (germanium).As the aim of this work is the study of timing RPCs, the ele tromagneti intera tions will be des ribed under the perspe tive of ionization and ex itationpro esses in the following. Se tions 2.2 and 2.3 are dedi ated to the propertiesof ionized gases subje t to external ele tri elds; in parti ular, the ase wherethe eld is onstant will be impli itly onsidered, being this a feature of theparallel plate geometries.1Notable ex eptions are neutrons and neutrinos.2Ring Imaging Cherenkov.3Transition Radiation Dete tor.4Parallel Plate Avalan he Chambers.5Resistive Plate Chambers. 17
18 CHAPTER 2. PROCESSES IN IONIZATION GAS DETECTORS2.1.1 Heavy parti lesThe Bethe-Blo h urveWhen a moderately relativisti heavy harged parti le traverses a medium,it loses energy mainly through ionizations and ex itations of the onstitutingatoms/mole ules. The pro ess an be des ribed in the framework of quantumele trodynami s under the Born approximation [2, resulting in an average en-ergy loss per unit length given by the Bethe-Blo h formula [3:− 1
η
dE
dx= Kz2 Z
A
1
β2
[
1
2ln
2mec2β2γ2Tmax
I2− β2
] (2.1)The ontribution of the medium is ondensed in the ratio of its atomi to massnumber Z/A, the density η and the mean ex itation energy I. In eq. 2.1 me isthe ele tron mass, z the harge of the in ident parti le in units of the ele tron harge and β its velo ity, γ the relativisti fa tor and K is a onstant given by:K = 4π
NA
mec2
(
e2
4πǫo
)2
= 0.307075 MeV g−1 m2 (2.2)e is the ele tron harge, ǫo the va uum diele tri onstant and N
Athe Avogadro'snumber. Tmax is dened as the maximum kineti energy that an be transferredin an en ounter with a free ele tron, due to momentum onservation:
Tmax =2mec
2β2γ2
1 + 2γme/M + (me/M)2(2.3)where M is the mass of the parti le. The re ommended values for the meanex itation energy I have varied with time, but nowadays the values given inICRU[4 are widely used. Due to the logarithmi dependen e of eq. 2.1 on thisparameter, rough parameterizations as the des ribed in [5 an be used for manypurposes:
I = 16Z0.9 eV for Z > 1 (2.4)The magnitude − 1η
dEdx is usually referred as the `stopping power' and, re-markably, it depends on the primary parti le mainly through β and z, disre-garding any inuen e of its mass. The immediate onsequen es are: a) on e thetime of ight of a heavy harged parti le along a ertain path is determined,and knowing the properties of the traversed material, the average energy loss an be al ulated, b) taking advantage of this feature, it is useful to express theenergy loss as a fun tion of the kinemati variable p/Mc = γβ (g. 2.1) and ) the time of ight and the energy loss of a heavy harged parti le are highlyredundant observables at intermediate energies.Ex ept for the ase of hydrogen, the urve of stopping power as a fun tionof γβ shows a minimum at γβ ≃ 3, orresponding to 1
ηdEdx ≃ 1-2 MeV g−1 m2(g. 2.1). Parti les with energy losses lose to the point of minimum ionizationare denoted as MIPs (Minimum Ionizing Parti les).Close and distant ollisionsThe average energy loss an be formally written as:
− dE
dx=∑
i
ηi
∑
n
∫ ∞
o
Qdσn,i
dQdQ (2.5)

2.1. ELECTROMAGNETIC INTERACTIONS WITH MATTER 19
Figure 2.1: Energy loss from the Bethe-Blo h formula for a number of elements and parti lespe ies as a fun tion of γβ [3.being σn,i the inelasti ross se tion for leading an atom (or mole ule) of type ito a level with an energy En,i above its ground state, Q the energy transferredand ηi the density of atoms (or mole ules) of type i. The derivation of eq. 2.1from 2.5 is usually performed through the des ription of two regimes:• Distant ollisions: ollisions that take pla e at large impa t parameters
b > bmin ( onversely low energy transferred Q < Qmin). They are re-sponsible for the ex itations of the atoms (mole ules) of the medium. Thes heme of energy levels of the atom (mole ule) plays an important role,being synthesized in the average parameter I [2.• Close ollisions: ollisions that take pla e at small impa t parameters
b < bmin ( onversely, at large energy transferred Q > Qmin). They are

20 CHAPTER 2. PROCESSES IN IONIZATION GAS DETECTORSresponsible for ionizations. The binding energy an be negle ted and theionizing parti le together with the ele tron from the medium an be re-garded as free parti les. For that reason, the s attering amplitudes areobtained from the QED al ulation for dierent spins of the parti les.Eventually, lose ollisions are responsible for the kno k-out of energeti ele trons (δ-ele trons), resulting in large u tuations of the energy releasedand therefore deviations from the average formula 2.5.It an be said that:− dE
dx=∑
i
ηi
∑
n
∫ Qmin
o
Qdσn,i
dQ
∣
∣
∣
∣
dist
dQ +∑
i
ηi
∫ ∞
Qmin
Qdσi
dQ
∣
∣
∣
∣
clos
dQ (2.6)The evaluation of 2.6 an be performed analyti ally in the two regimes andlater grouped together, yielding the Bethe-Blo h formula (eq. 2.1). Details onthis last step are extensively dis ussed in [2.Energy loss urveIt is remarkable the high degree of generality and the a ura y of the Bethe-Blo h formula (an agreement with experimental data at the level of 1% is ob-served in the range 0.6 < γβ < 60 for some ases [3). However, its appli abilityis only valid at intermediate energies, failing in both the high and low energyregimes owing to the following reasons:1. Eq. 2.1 lays on the assumption that the velo ities of the atomi ele trons an be negle ted as ompared to the ones of the parti le traversing themedia. The validity of su h assumption be omes weak in the limit of lowenergies of the primary parti le. This ee t is a ounted for by the so- alled shell orre tion, a term of the form C/Z that is usually in luded inthe bra kets of eq. 2.1.2. The ele tri eld transversal to the movement of a parti le in reases withγ [6, being theoreti ally possible to ionize at innite distan es wheneverγ tends also to innite. However, any media rea ts to an ele tri eldthrough the polarization of its onstituting atoms or mole ules, resultingin the s reening of the eld at large distan es that yield smaller losses as ompared to the Bethe-Blo h predi tion (g. 2.2). This so- alled `densityee ts' an be des ribed in the framework of lassi al ele trodynami s [7,[8, and are often parameterized by a term of the form −δ/2 in the bra ketsof eq. 2.1.At even higher energies the radiative losses due to bremsstrahlung startto dominate, growing linearly with E. The energy at whi h this happensis denoted as riti al energy Ec.The stopping power for µ+ on opper over nine orders of magnitude inmomentum is shown in g. 2.2, in luding a) the low energy regime where theatomi stru ture be omes relevant, b) the Bethe-Blo h regime, ) the regimewhere polarization ee ts starts to ae t the energy loss and, nally, d) theregime where bremsstrahlung radiation dominates.

2.1. ELECTROMAGNETIC INTERACTIONS WITH MATTER 21
Figure 2.2: Energy loss for µ+ in opper over 9 orders of magnitude in momentum [3.Delta raysIt must be stressed that parti le dete tors are sensitive to the energy depositedon them, not to the energy lost. This subtlety is important in ase a sizableamount of energy an be transferred to energeti δ-ele trons that are able toabandon the dete tor before being stopped. As the distan e a δ-ele tron antravel is related to its energy, it is interesting in general to dene the `restri tedstopping power ' as:− 1
η
dE
dx
∣
∣
∣
∣
T <Tcut
= Kz2 Z
A
1
β2
[
1
2ln
2mec2β2γ2Tupper
I2− β2
2
(
1 +Tupper
Tmax
)] (2.7)where Tupper = min(Tcut, Tmax). Expression 2.7 agrees with 2.1 in the limitwhere Tcut is larger than the maximum energy transferable by momentum on-servation, Tmax.On the other hand, the energy distribution of δ-ele trons with kineti energyI ≪ T < Tmax an be approximated by [9:
1
η
d2N
dTdx=
1
2Kz2Z
A
1
β2
1
T 2(2.8)and their angle of emission is given, in a free-ele tron approximation, by:
cos θ =T
p
pmax
Tmax(2.9)that results in emission perpendi ular to the parti le tra k, whenever T ≪ Tmax.However, elasti s attering in the medium qui kly randomizes the dire tion ofmotion of δ-ele trons [10. When dealing with ele trons, it is ustomary to dene

22 CHAPTER 2. PROCESSES IN IONIZATION GAS DETECTORSa pra ti al range Rp, that an be up to 3 times shorter than the total range.For energies below some hundreds of keV, it is well des ribed by [11:Rp[g m−2] = 0.72
(
T
1 MeV)1.72 (2.10)Energy loss u tuationsIt must be re alled that the Bethe-Blo h formula (eq. 2.1) provides a meanvalue. As the pro ess of energy loss has a sto hasti nature it will show, ingeneral, a hara teristi distribution whose mean value is given by eq. 2.1. Dueto the sizable probability of emission of high energy δ-ele trons, the distributionof energy losses diers from a Gaussian expe tation as long as the releasedenergy is smaller than the energy of the parti le (thin media). A ording toa lassi al formulation given by Landau, the energy loss distribution on a thinmedium of thi kness δx an be written as:dN
dξ=
1√2π
e−12 (ξ+e−ξ) (2.11)being ξ the deviation from the most probable energy loss in non-dimensionalunits:
ξ =∆E − ∆Emp
K ZA
ηβ2 δx
(2.12)Eq. 2.11 is rather distin t from the Gaussian expe tation, showing tailstowards large values of ξ due to the ontribution of one or more δ-rays. Theresult has pra ti al onsequen es, indi ating that the measurement of the energylost in thin media by a single tra k does not represent, usually, a reliable estimateof the average energy loss.Energy loss in ompoundsAmixture or ompound an be thought as onstituted by pure elements weightedin the right proportion (the so- alled Bragg additivity rule):dE
dx=∑
j
wjdE
dx
∣
∣
∣
∣
j
(2.13)and wj is the fra tion of elements of type j in the ompound. Care must betaken when applying the Bragg rule to magnitudes like I or δ (the density ee tterm), as the values of the ompound an be totally dierent owing to the verydierent ele tri properties (see [3).
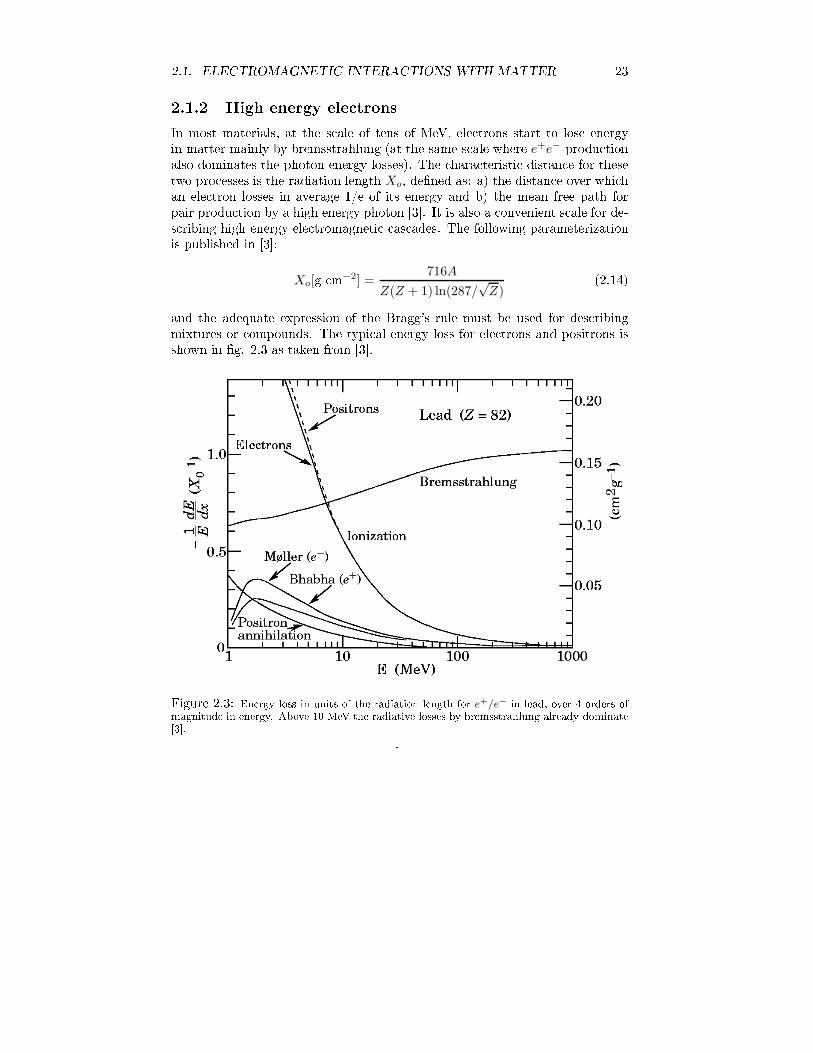
2.1. ELECTROMAGNETIC INTERACTIONS WITH MATTER 232.1.2 High energy ele tronsIn most materials, at the s ale of tens of MeV, ele trons start to lose energyin matter mainly by bremsstrahlung (at the same s ale where e+e− produ tionalso dominates the photon energy losses). The hara teristi distan e for thesetwo pro esses is the radiation length Xo, dened as: a) the distan e over whi han ele tron losses in average 1/e of its energy and b) the mean free path forpair produ tion by a high energy photon [3. It is also a onvenient s ale for de-s ribing high energy ele tromagneti as ades. The following parameterizationis published in [3:Xo[g m−2] =
716A
Z(Z + 1) ln(287/√
Z)(2.14)and the adequate expression of the Bragg's rule must be used for des ribingmixtures or ompounds. The typi al energy loss for ele trons and positrons isshown in g. 2.3 as taken from [3.
Figure 2.3: Energy loss in units of the radiation length for e+/e− in lead, over 4 orders ofmagnitude in energy. Above 10 MeV the radiative losses by bremsstrahlung already dominate[3. .

24 CHAPTER 2. PROCESSES IN IONIZATION GAS DETECTORS2.1.3 γ photonsPhotons an intera t with matter in several manners. From them, the morerelevant are usually three:1. Photoele tri ee t: at energies omparable to the binding energies ofele trons in the atom (up to some keV for the inner shells) the photontransfers all its energy, resulting in an eje ted ele tron with energy equalto that of the photon minus the ele tron binding energy:Ee = hν − K (2.15)where K is the binding energy and hν the energy of the photon.The pro ess is strongly enhan ed for large values of Z, being the followingparameterization suggested in [12:σp.e. ≃ C
Zn
E3.5γ
(2.16)where n takes values between 4 and 5.2. Compton ee t: at intermediate energies, the ele trons an be regarded asfree, and the kinemati s of the intera tion an be evaluated by imposingenergy and momentum onservation, yielding an ele tron energy:Ee =
(1 − cos θ)α
1 + (1 − cos θ)αhν (2.17)with α = hν
mec2 and θ being the angle between the photon and the ele tronafter the intera tion. For the purpose of γ-ray dete tion it is ustomary todene the Compton edge as the maximum energy arried by the ele tron, orresponding to θ = π. Roughly speaking, the Compton edge representsthe maximum energy released in the a tive medium by Compton intera -tion.Compton s attering an be solved in QED, yielding the Klein-Nishinaformula:dσ
dΩ
∣
∣
∣
Compton
= Z
(
e2
4πǫomec2
)2(1
1 + α(1 − cos θ)
)2(1 + cos2 θ
2
)
×(
1 +α2(1 + cos θ)2
(1 + cos2 θ)[1 + α(1 − cos θ)]
) (2.18)3. Pair produ tion: when a γ-ray ex eeds in energy a value equal to twi ethe ele tron mass (2me ≃ 1.02 MeV) the pro ess of pair (e+e−) produ -tion (also alled γ- onversion) be omes energeti ally possible. The energyin ex ess over 2me is shared in kineti energy of both the ele tron andpositron. There is no simple expression for the probability of pair produ -tion but its magnitude varies approximately as the square of the atomi number of the medium [26.The strength of the three mentioned intera tions as a fun tion of the energyof the photon is shown in g. 2.4.
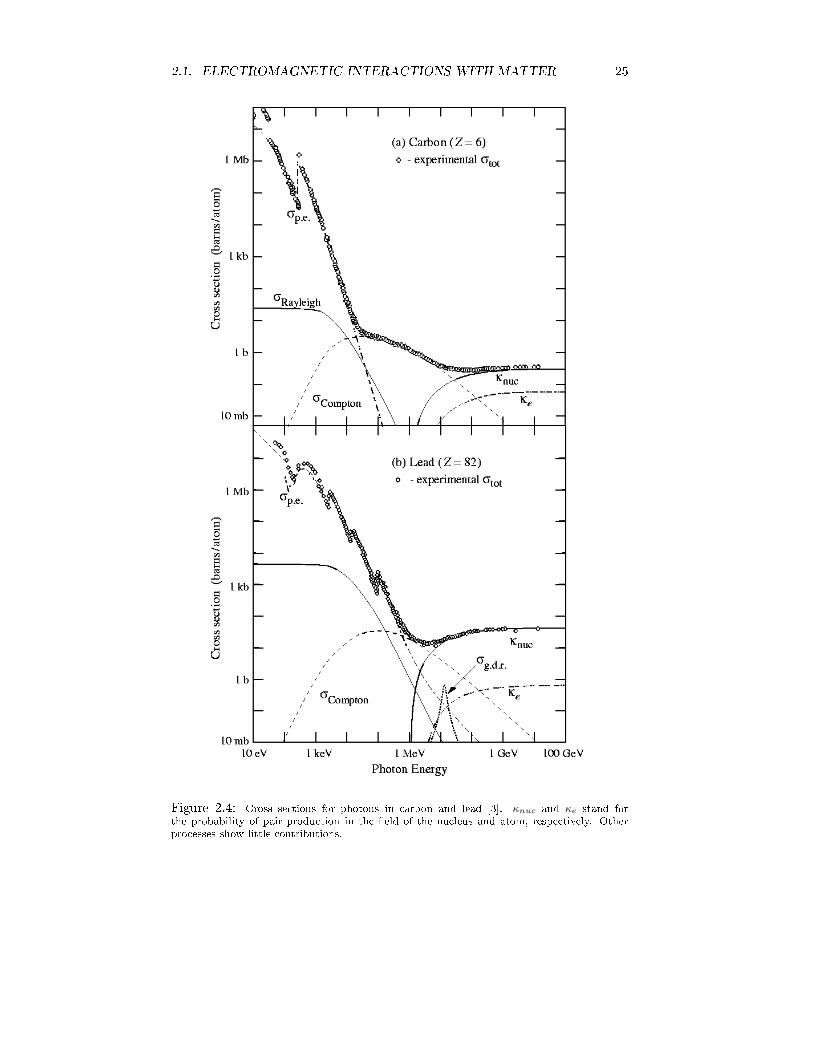
2.1. ELECTROMAGNETIC INTERACTIONS WITH MATTER 25
Figure 2.4: Cross se tions for photons in arbon and lead [3. κnuc and κe stand forthe probability of pair produ tion in the eld of the nu leus and atom, respe tively. Otherpro esses show little ontributions.

26 CHAPTER 2. PROCESSES IN IONIZATION GAS DETECTORS2.2 Avalan hes in gasesIn 1910 Townsend [14 measured the urrent between two parallel ele trodeswhen a small number of ele trons was released at the athode, observing anexponential growth as soon as the applied voltage between them was in reasedabove a ertain value. Su h phenomenon was interpreted as the result of amultipli ation pro ess, originated by the drifting ele trons and ions, when theya hieve the energy required to indu e further ionizations.Townsend's interpretation is nowadays known to be essentially orre t, andthe term avalan he has be ame popular for des ribing the in rease of urrentdue to the mentioned as ading pro ess. The avalan he phenomenon in gaseshas been used sin e then to produ e measurable signals out of a relatively smallnumber of primary ionizations, nding a widespread appli ation in the dete tionof harged parti les.2.2.1 Main pro essesThe mi ros opi pro esses ruling the ele tromagneti intera tions in gases at lowenergies are key for des ribing the avalan he properties. This is so be ause it isthe swarm of low energy se ondary ele trons and ions whi h ultimately regulatesthe avalan he pro ess, and no a urate des ription an be a hieved as long as itis not well des ribed the way they intera t with the mole ules and atoms of themedium. Currently there are transport odes that predi t some of the relevantparameters of the swarm (des ribed later) like for example, MAGBOLTZ [15,IMONTE [16 or HEED [17, and they have found, indeed, remarkable su essin interpreting a number of features observed in RPC dete tors (see [18 andse tion 3.2.1).It is ustomary to speak about inelasti or elasti ollisions, dependingwhether the kineti energy of the olliding parti les goes or does not go todierent degrees of freedom (ionizations, ex itations, mole ular vibrations...),respe tively. Among them, the pro esses of ionization and ex itation are spe- ially relevant; but also photon absorption, ele tron atta hment and ionizationby ion impa t or photoele tri ee t are worth being onsidered (a detaileddis ussion an be found at [19).2.2.2 Energy distributions of the swarmIn the absen e of ele tri elds, a free harge in a gas will lose its energy bymultiple ollisions until rea hing the average thermal distribution of the onsti-tuting mole ules and atoms. The kineti theory of gases provides the thermaldistribution of energies6:dN
dε=
2√
ε√π(kT )3/2
e−ε/kT (2.19)with an average energy ε = 32kT ≃ 0.04 eV under normal onditions (T ≃ 25C).Whether this thermal equilibration is still ee tive or not when an external eldis applied, results from the balan e between the energy lost by ollisions and6Usually denoted as `Maxwellian'.

2.2. AVALANCHES IN GASES 27the energy regained owing to the ele tri eld during the mean free path of theparti le (eEλ).The fra tion of energy transferred in an elasti ele tron-mole ule (atom) ol-lision is of the order of the ratio between the masses (10−5 for Ar), being the ioni losses lose to 50% under similar onditions, allowing for a fast thermalizationof the last even in the presen e of very high ele tri elds. The ase for ele tronsis very distin t, existing both numeri al [20 and analyti [21 des riptions basedon the kineti theory of gases, but taking into a ount the ontribution of theinelasti pro esses and the ele tri eld. G. S hultz derived the following ex-pression under the assumption that only vibrational and rotational ex itations ompete with elasti ollisions:dN
dε= C
√ε exp(− ∫ 3Λ(ε)εdε
[eEλe(ε)]2 + 3Λ(ε)εkT
) (2.20)Λ(ε) =
2me
M+∑
i
εiσi(ε)
εσe(ε)(2.21)where λe and σe are the mean free path and ross se tion for elasti ollisions, re-spe tively, εi is the energy lost to the degree of freedom i (as ribed to rotationalor vibrational states in the proposed derivation) and σi is the inelasti rossse tion for that pro ess. The fun tion Λ(ε) stands for the fra tion of energy lostin ea h ollision, or inelasti ity.For su iently small elds su h that:
[eEλe(ε)]2 ≪ 3Λ(ε)εkT (2.22)the ele tron thermalization an take pla e and its energy distribution be omesMaxwellian. Otherwise, its average energy will be typi ally larger than theexpe ted in thermal equilibrium.2.2.3 Relevant parameters of the swarmThe drift velo ities ve and viEle trons and ions drift parallel to the ele tri eld, with a typi al value resultingfrom the average over the distribution of possible energies:
ve(i) =
∫
cos θ
√
2ε
me(i)
1
2π
dN
dεdε d cos θ (2.23)denoting by θ the angle between the parti le velo ity and the dire tion of theele tri eld7. It is ustomary to expand the energy distribution in the presen eof an ele tri eld by using the Legendre polynomials [21:
dN
dε=
dN
dε
∣
∣
∣
∣
o
+dN
dε
∣
∣
∣
∣
1
cos θ + ... (2.24)being dNdε
∣
∣
othe energy distribution in the absen e of ele tri elds.7Eq. 2.23 is nothing but the average of the velo ities in the dire tion of the ele tri eld.

28 CHAPTER 2. PROCESSES IN IONIZATION GAS DETECTORSIn the limit where the swarm is thermalized and the eld is negligible, theevaluation of eq. 2.23 naturally produ es a null result, while in the presen e ofsizable ele tri elds it an be re-expressed as [10:ve(i) =
2
3
eE
me(i)
∫
ελe(ε)∂(√
me(i)
2εdNdε
∣
∣
o)
∂εdε (2.25)Expression 2.25 an be analyti ally solved by assuming a onstant value for λeand a thermal distribution, produ ing:
ve(i) ≃2
3
√
me(i)e2
2kTλeE = µe(i)E (2.26)where µe(i) is dened as the ele troni (ioni ) mobility. The mean free pathis proportional to the inverse of the gas density; therefore, under the assump-tion that the gas has ideal behavior, it is expe ted that λe(P ) = λe(Po)Po/P ,resulting in:
ve(i) = µe(i)(Po)E
P(2.27)and su h linear behavior provides, indeed, a reasonable des ription of the iondrift in gases. At high elds, the al ulation of the ele troni drift may requirethe use of the exa t non-thermal distribution in the parti ular ase.The diusion oe ient DIn a one dimensional medium, a lo alized luster of No parti les diuses throughmultiple ollisions as:
dN
dx=
No√4πDt
e−x2/4Dt (2.28)I.e., a Gaussian distribution whose width in reases in time as σx =√
2Dt. Theresult an be extended to d dimensions (d = 1, 2, 3), providing:σd =
√2dDt (2.29)In fa t, the diusion pro ess is governed by a single parameter, namely, thediusion oe ient D, that an be obtained a ording to the kineti theory ofgases [20 as:
D =1
3
∫
λe(ε)
√
2ε
m
dN
dεdε (2.30)and for the ioni (thermalized) ase, the solution of eq. 2.30 is:
Di =µikT
e(2.31)In the presen e of ele tri elds it is usual to distinguish between the longitu-dinal and transversal diusion oe ients, depending on whether the diusionis onsidered in the dire tion of the eld or perpendi ular to it.

2.2. AVALANCHES IN GASES 29The multipli ation oe ient αEventually, parti les rea h enough energy to start to ionize. The rst Townsend oe ient α is the hara teristi magnitude that des ribes the pro ess, beingrelated to the inverse of the mean free path for ionization λ. For the ase ofele trons from the swarm, its value is given by:α =
1
ve
∫
λ(ε)−1
√
2ε
m
dN
dεdε (2.32)There are no general rules for estimating the behavior of the rst Townsend oe ient, despite some analyti expressions have been devised under ertain onditions [10.2.2.4 Avalan he propagationThe equations for the evolution of the ele tron and ion densities in a regionwhere an ele tri eld exists, an be des ribed in terms of the parameters of theswarm ve, vi, De, Di, α, following [22:
∂ne(x, y, z, t)
∂t= αne|ve| − ∇(neve) + De∇2ne (2.33)
∂ni(x, y, z, t)
∂t= αne|ve| − ∇(nivi) + Di∇2ni (2.34)where the presen e of ele tronegative omponents has been negle ted. Theequations a ount for the multipli ation during the drifts of the arriers, plustheir spatial diusion.In the simple ase where No ele trons were released at instant t = 0 at apoint pla ed somewhere in the athode (taken as zero position):
ne(0) = Noδ(t)δ(x)δ(y)δ(z) (2.35)ni(0) = 0 (2.36)and making the simplifying assumptions that the transversal and longitudinaldiusion oe ients are equal, and the parameters of the swarm are onstantduring propagation, the solution of eqs. 2.33 and 2.34 is given by [23:
ne(x, y, z, t) = Noeαvet 1
(4πDet)3/2exp(−x2 + y2 + (z − vet)
2
4Det) (2.37)Therefore, in a rst approa h, the avalan he an be des ribed by an exponentialgrowth of the harges eαvet, diusing in spa e with an average radius that growswith the square root of the diusion time as r
D∼
√Det.After olle tion at the anode (assumed to be separated a distan e g from thepoint where the avalan he started), the average in rease in the initial numberof parti les is given by m = eαg, usually referred as the avalan he gain.2.2.5 Avalan he statisti sPrimary u tuationsThe number of primary ionizing ollisions k produ ed within a gap of width gfollows a Poisson distribution with average no = g/λ (λ the mean free path for

30 CHAPTER 2. PROCESSES IN IONIZATION GAS DETECTORSionization of the primary parti le):P (k) =
nko
k!e−no (2.38)Also dierent number of ele trons an be eje ted in a single ionization, on-stituting the so- alled luster size distribution: a ording to [24, ionizationsreleasing more than one ele tron an amount to 10% of the total in a typi algas like iso-C4H10.Multipli ation u tuationsIt must be re alled that, as for the intera tion of the primary parti le, theionizing probability of the ele trons (ions) of the swarm has also a sto hasti nature. The relative ontribution of the ee t is small whenever the numberof released ele trons (ions) is very large, but will ae t the avalan he gain if it ontributes in the early stages of avalan he development. When the swarm isthermalized, the behavior of its onstituting parti les be omes independent fromthe details of previous intera tions8. In that ase, the distribution of avalan hegains after a ertain distan e follows an exponential distribution, known asthe Furry law [25. The distribution of gains over a distan e g for avalan hesinitiated by a single ele tron is, therefore, given by:
dN
dm=
1
me−m/m (2.39)being m = eαg the average gain. For in reasing elds, deviations from thesimple Furry law are expe ted, a regime where the so- alled Polya law provedto be more a urate:
dN
dm=
1 + θ
Γ(1 + θ)m
[
m(1 + θ)
m
]θ
e−m(1+θ)/m (2.40)Γ is the Euler Gamma fun tion and θ is a free parameter that depends on theeld (at θ = 0 eq. 2.40 oin ides with the Furry law).2.2.6 Streamer propagationDepending on the onditions, at very high elds the avalan he formation anpre ede the development of a luminous lament between anode and athode,resulting from a fast in rease of the released harge. Su h in rease an be as- ribed to the onset of new phenomena, dierent than the normal propagation ofthe avalan he, and it is usually referred as streamer. The nature of su h pro essis not understood in full detail, despite dierent models have been devised, pro-viding an adequate interpretation of some of the observations [27, [28, [29. Ingeneral, it is a epted that the onditions for a streamer to develop are boundto the distortions of the ele tri eld when the self-eld of the avalan he is om-parable to the applied eld (a on ept also denoted as Spa e-Charge ee ts).Su essful quantitative attempts have been made [27, [28, by assuming thatthe in rease of urrent hara teristi of the streamer development is related to8Sometimes it is said that the parti les lost their memory.

2.2. AVALANCHES IN GASES 31the presen e of short-range UV photons that are able to ionize the gas in re-gions of high ele tri elds. The main short oming for he king the validityof any realisti des ription of the streamer pro ess is that al ulations rely onestimates of a number of parameters of the swarm, that are usually di ult toa ess experimentally.Despite the un ertainties, it is well established sin e the 60's, thanks toRaether [29, that an experimental limit exists for the maximum gain attainablein wide gap gaseous dete tors before the streamer an progress:m = eαg ≃ e20 = 5 108 (2.41)that is alled Raether limit.
Figure 2.5: Simulated behavior of the longitudinal omponent of the ele tri eld reatedby the avalan he, as a fun tion of the position along the gap z and the radial distan e r. Theavalan he has been started by a single ele tron at z = 0 ( athode) in a gas mixture based onC2H2F4/SF6/iso-C4H10 (85/10/5) at an applied eld E ≃ 93 kV/ m [24.Cathode streamerIn g. 2.5 the simulated behavior of the avalan he self-ele tri eld is showna ording to the work of C. Lippmann and W. Riegler [24, that will be used

32 CHAPTER 2. PROCESSES IN IONIZATION GAS DETECTORSfor illustration. In the streamer models proposed in [13, [27, [28 it is assumedthat UV photons are generated during avalan he formation. Being emittedisotropi ally, they an travel towards the athode up to the head of the ion tail,where the eld is higher, and there indu e new avalan hes. For this pro essto end in a streamer, the onset of the Spa e-Charge regime is required. Insu h a ase, a wave of su essive ionizations in the dire tion of the athode anprogress, resulting in the so- alled ` athodi streamer'.Anode streamerA similar pro ess an take pla e in the ele tron front. However, it must be notedthat the anode streamer does not require from UV photons to propagate. Thehigher density of ele trons in that region results on higher elds as omparedto the ion front. In that ase, [28 predi ts the formation of a streamer arisingfrom the intera tion between the ele tron front of the avalan he and the anode.The dierent origin of anode and athode streamers suggests that both frontsof the streamer (anodi and athodi ) an travel at dierent velo ities. Su hbehavior has been reported under some onditions [30.2.3 Breakdown in parallel plate geometriesIt is denoted by breakdown a pro ess that produ es a high ondu tivity between athode and anode, eventually leading to a violent spark that results in the dropof the voltage a ross the gap. Two pro esses are assumed to be the more frequentones in leading a dete tor to the breakdown.2.3.1 Townsend me hanismTogether with dire t ionization of mole ules (atoms) of the gas, that is des ribedby the rst Townsend oe ient, there are other pro esses that ontribute tothe release of se ondary ele trons. Among them, the more relevant are boththe photoele tri ee t (from photons emitted during the development of theavalan he) and ele tron extra tion by ion ollisions at the athode. The eje tedele trons are a elerated ba k towards the anode, resulting in the generation ofsu eeding avalan hes.This feedba k me hanism is expe ted to be ome self-sustained whenever theaverage number of ele trons eje ted at the athode ex eeds the average numberof primary ele trons released by the primary parti le. Assuming an eje tionprobability δ, and a ertain gain m, the average number of primary ele tronsno is related to the number of ele trons eje ted at the athode through:
nδ = nomδ (2.42)Therefore, as long as mδ & 1, the number of new eje ted ele trons nδ omingtowards the anode be omes larger than the no released by the primary parti le.This situation orresponds to the appearan e of a self-sustained urrent, thatextends to the whole gap after a ertain time, and leads to the breakdown. The ondition:mδ & 1 (2.43)
2.3. BREAKDOWN IN PARALLEL PLATE GEOMETRIES 33is denoted as `Townsend Breakdown Criteria'. Due to the ne essity of furtheravalan hes, this me hanism is rather slow as ompared with the avalan he for-mation itself, lasting some tens of µs, depending on the ase.2.3.2 Streamer me hanismIt is an experimental fa t that, after a streamer develops, a path of ondu tingionized plasma is left through the gap, allowing for the progress of a violent sparkbetween the ele trodes, that leads to the breakdown of the applied voltage.Apart from its dierent origin, the streamer me hanism is mu h faster thanthe Townsend one, as it is started immediately after the rst avalan he is pro-du ed in the gas. A mixture of the two breakdown me hanisms des ribed ispossible. It is, for example, probable that the rst stage of the Townsend me h-anism pre edes the reation of a streamer in, let's say, the 10th generation, thatnally auses the breakdown.It must be mentioned that, in the ase of the streamer me hanism, theavalan he statisti s an make the onditions for breakdown possible even if theRaether ondition is not fullled. This phenomenon requires the gases used indete tors to be `quen hed', that is, to have a low light emission.


Chapter 3Timing RPCs3.1 Histori al introdu tion3.1.1 PPCsA Parallel Plate Chamber (PPC) onsists in 2 parallel metalli ele trodes oper-ated at high voltage, thus providing an uniform ele tri eld a ross the volumethat they delimit. When a harged parti le rosses the spa e between the ele -trodes, it reates ele tron-ion pairs with a ertain density; in a later stage, andif the eld is high enough, the released ele trons are a elerated towards theanode, regaining enough energy for indu ing further ionizations in a as adingpro ess alled avalan he (see se tion 2.2). In this simple way it is possible toprodu e a measurable harge from a redu ed number of initial harges. Thevery fast drifting ele trons produ e a prompt signal that an be used for timingpurposes, whereas the ions drift to the athode at mu h smaller velo ities, dueto their higher mass.The rst appli ation of a parallel plate geometry for timing dates ba k to1948, and was alled Keuel Spark Counter after its inventor [31. It showed atime resolution at the level of 1 ns but, due to the enormous amount of hargereleased by the spark reated, a large re overy time of some millise onds wasrequired, limiting the rate apability of the devi e.The operation of parallel geometries with ele trodes overed by high resis-tivity materials, preventing the voltage breakdown, was pioneered in 1971 [32and onsolidated in 1981 [33 with the advent of the Resistive Plate Chambers(RPCs).In 1971, the Pestov's group [32 made use of a highly resistive material (glass)for limiting the progress of the spark. The so- alled `Pestov ounter' is able toa hieve ultimately a time resolution at the level of 25 ps. However, the ounteris hara terized by its high te hni al omplexity: i) its gap is as small as 100µm wide, therefore aiming for a high e ien y it must be operated at around12 bar; ii) it is required the use of a spe ial kind of glass with ρ ∼ 5 109 Ω m( alled `Pestov glass'); iii) at last, the requirements on erning me hani s arevery demanding. 35

36 CHAPTER 3. TIMING RPCS3.1.2 RPCsThe Resistive Plate Chamber (RPC)1 was developed by R. Santoni o and R.Cardarelli in 1981 [33 with the intention of over oming the di ulties inherentto the Pestov ounter [32, while keeping its more fundamental virtues (namely,the possibility of working at very high elds by avoiding the breakdown of thedete tor).The rst RPC onsisted in two parallel opper ele trodes overed with highresistan e plates made of a phenoli resin known as Bakelite, with a volumeresistivity ρ ≃ 1010 Ω m. The ensemble delimited a `wide' gap of 1.5 mm lledwith a gas mixture of Argon/iso-C4H10 (iso-butane) in a proportion 1:1 (g.3.1 left)2. The main advantage as ompared to the Pestov ounter is that thegas ir ulates at atmospheri pressure along a wide (1.5 mm) gap. A ordingto the onvention used nowadays, it an be said that the dete tor was operatedin streamer mode3, allowing a high simpli ation of the ele troni s (see se tion3.1.4).Under the onditions mentioned, the dark rate of the ounter was onsid-erable, ontributing to a de rease in the observed e ien y. For avoiding thisee t, the plates were painted with linseed oil and, remarkably, this te hniquehas been kept sin e then for Bakelite-based RPCs.The signal was measured with pi k-up strips, separated from the HV foilthrough PVC4, avoiding the use of oupling apa itors. The HV has to beapplied through a non-perfe t ondu tor (poorly ondu tive paper foil) in orderto be transparent to the indu ed signal, otherwise a fra tion of it will be lost.The basi operation prin iple of an RPC is already des ribed in the originalpaper and not mu h has hanged sin e then:1. The signal indu tion time, around 10 ns for the ele tron (prompt) ompo-nent, is mu h smaller than the time onstant of the RC ir uit formed bythe resistive plate, τ = RC ≃ ρǫ ≃ 10 ms [34. This means that, from thepoint of view of the signal indu ed in the read-out ele troni s, the resistiveplate behaves as a perfe t diele tri (R=∞).2. From the point of view of the physi al phenomena involved, the situation isvery similar to the PPC ase, just be ause the resistive plate is essentiallytransparent to the indu ed signal. However, operation of PPCs at thetypi al high elds of RPCs is di ult in pra ti e, be ause the harge owrequired for breakdown is not limited by resistive plates.3. For avoiding the presen e of self-sustained dis harges that may arise fromthe Townsend me hanism (see se tion 2.3.1), the hoi e of a standard UVquen her (iso-C4H10) was adopted.4. The rate apability of an RPC is ultimately related to the average hargeper avalan he and the re overy time of the plate τ or, equivalently, to theaverage ohmi drop in the resistive plates Vdrop = q/CφAτ , being C the1It must be said that, in the original paper, the letter C was used for `Counter', but themore generi word `Chamber' be ame later more popular.2Iso-C4H10 is an UV quen her, while Argon is a noble gas well suited for appli ations withgaseous dete tors, due to its high density.3In the original paper, the word `dis harge' is preferred for des ribing the signal.4Polyvinyl hloride.

3.1. HISTORICAL INTRODUCTION 37Figure 3.1: Left: example of a 1-gap RPC [33 and right: a symmetri 2-gap RPC [34, bothdrawn a ording to their original designs. The HV apa itors are avoided by the use of a PVClayer and a low ondu tivity paper foil for applying the HV (a graphite oating was used inthe 2-gap design). Details are given in text. The dimensions are not realisti , in parti ularthe gap has been enlarged. apa ity of the RPC, φ the primary rate and A the area of the plates(se tion 3.2.7).5. Regarding timing, the situation is more favorable in a parallel plate ge-ometry (E ∼ onstant) than in a ylindri al one (E ∼ 1/r) ommonlyused for proportional dete tors. The parallel geometry allows to extendthe `multipli ation region' to all the dete tor (the eld is high enough forindu ing an avalan he at any point), while in proportional dete tors itis required a propagation time along the `drift region' before the multi-pli ation an take pla e, ae ting the timing properties. Conversely, thesensitivity to the energy released by the primary parti le is mu h higherin the ase of ylindri al geometries as ompared to the parallel ones, dueto the fa t that the multipli ation region is well delimited.In its rst design, the RPC te hnology a hieved very promising perfor-man es, rea hing 97% e ien y and a time distribution of 1.2 ns FWHM, be- oming an aordable alternative to the use of plasti s intillators.3.1.3 Double gap RPCThe double gap stru ture was introdu ed in 1988 [34 and the gap width in- reased up to 2 mm, whi h is the value ommonly used nowadays. The setupwas symmetri with the ground ele trode in the enter and the HV applied overthe outer layers (g. 3.1).The 2-gap onguration allowed for an in rease in e ien y and onrmedthat the time resolution was well at the level of σ
T≃ 1 ns.3.1.4 Operation modesStreamer modeAs said in se tion 2.2.6, a streamer is a pro ess of a dierent nature thanavalan he multipli ation, releasing a high amount of harge as ompared tothe one of a normal avalan he. Therefore, the rate apability is a potentialproblem for RPCs operated in streamer mode. Despite this drawba k, it hasfound wide appli ation in experiments that work at low rates, as in the ase ofBELLE at KEK that operates below 1 Hz/ m2 [35, or BaBar at SLAC [36.

38 CHAPTER 3. TIMING RPCSThe benet of this operation mode is that the read-out ele troni s is simpliedas ompared to the avalan he mode. Be ause of these hara teristi s, RPCs instreamer mode are spe ially well suited for osmi ray experiments as ARGOat YangBaJing [37.This mode was also alled `spark mode' [38 but it is probably not a good hoi e: the formation of a spark requires an enormous urrent that is limited,in fa t, by the presen e of the resistive plates. So, the term `streamer mode'be ame more popular [39.Avalan he modeThe introdu tion of the avalan he mode of operation took pla e in 1993 [40as an attempt to improve the rate apability by redu ing the harge releasedper avalan he, while using dedi ated ele troni s for ampli ation (an interesting omparison between streamer and avalan he mode an be found in [38). Forthis purpose, a highly ele tronegative gas (CF3Br) was used and, sin e then,a number of dierent ele tronegative mixtures were tried, in luding CH2FCF3,C2H2F4 and SF6.RPCs operating in avalan he mode have found appli ation in high energyphysi s (like ATLAS or CMS at LHC, see [41, [42 for instan e) and are of-ten alled `trigger RPCs', allowing for rate apabilities in the range 100-1000Hz/ m2.The avalan he mode of operation was also alled `proportional mode' [39whi h is probably a bit ambitious in view of the following: on one hand, the harge of the olle ted signal is not proportional to the harge released by theprimary parti le as it depends on the position of the rst luster; on the otherhand, the growth of the avalan he is known to be ae ted by Spa e-Chargeee t, a regime where the orrelation with the harge initially released is verysmall. Therefore, the more general term `avalan he mode' prevailed [38.3.1.5 Multi-gap RPC (MRPC)A new design appeared in 1996 [43 due to the eorts of M.C.S Williams' group, onsisting in a triple set of Bakelite plates separated by gaps of 3 mm, thatallowed, a ording to its inventors, for a similar time resolution as a single-gap2 mm hamber while redu ing the dark urrent and in reasing the e ien yplateau.It an be roughly expe ted that the multi gap allows for an in rease in thee ien y as:ε = 1 − (1 − ε
N)N (3.1)where N stands for the number of gaps and ε
Ndenotes the e ien y per singlegap. Expression 3.1 is exa t under the assumption that, for dete tion, at leastone of the gaps must provide a dete table signal with independen e of the others.This assumption is not true, as two independent indu ed signals falling belowthe dete tion threshold an yield a total signal that is above; therefore thee ien y represented by eq. 3.1 represents a lower limit to the one expe tedin reality. On the other hand, the time resolution slightly in reases, in a rstapproa h, as:
σT
=σ
T,N√N
(3.2)

3.1. HISTORICAL INTRODUCTION 39whi h is the expe ted, if the time response is Gaussian. The details on theapproximate statement 3.2 are dis ussed in hapter 9.It has been observed repeatedly that the time resolution depends on the gapwidth, typi ally improving for small gaps [44. It an be argued, therefore, thata multi-gap onguration an provide a good timing, as hara teristi of narrowRPCs, while keeping the e ien y at high levels, as hara teristi of wide RPCs.Multi-gap te hnology has a very interesting feature: the inner resistive plates an be left oating and they will take in average the voltage drop expe ted dueto ele trostati s. The argument is the following: in the ele trostati situationthe voltage drop in ea h of the N gaps is dire tly VN
= V/N . If now a par-ti le ionizes in two neighboring gaps, it an release dierent harges, indu ingdierent voltage drops in the gaps orresponding to both sides of the plate. Inthis way the plate is harged up. However, the next avalan he will see a lowereld in the gap where more harge was produ ed, whereas in the other gap thesituation will be the opposite. As a result, the harges of the next avalan hesthat are olle ted at ea h side of the resistive plate will ompensate from those harges of the previous avalan hes, balan ing the eld in the neighboring gaps.This ee t suggests that the grounding of the resistive plates is not expe ted tobe a fundamental issue, as it has been onrmed experimentally.See g. 3.2 for typi al examples of multi-gap ongurations.3.1.6 Timing RPC (tRPC)The realization of the importan e of the me hani al uniformity of the gap in re-lation with high pre ision timing (see hapter 9) together with the developmentof fast ampli ation ele troni s, made possible to operate a multi-gap RPC inavalan he mode with thin gaps of 0.3 mm and glass ele trodes, at elds as highas 100 kV/ m. Su h step was a omplished in the year 2000 by P. Fonte, A.Smirnitski and M.C.S. Williams [45, opening a new bran h in the eld. Thisrst development a hieved a time resolution at the level of 120 ps, althoughsoon after that, the possibility of going down to the level of 50 ps for small de-te tors [46 was proved. The appli ability of the te hnology in large size tRPCswas later onrmed [47, providing resolutions omfortably below 100 ps, withreasonable homogeneity. The gas mixture originally used was C2H2F4/SF6/iso-C4H10 (85/10/5) based on results for wide-gap RPCs [48 and alled sin e then`standard mixture' in the ontext of timing RPCs. The addition of a small fra -tion of SF6 seems to improve the stability, to in rease the e ien y `plateau'and to redu e the amount of streamers. Similar mixtures (90/5/5) have beenalso tried, showing a slight improvement a ording to [49.Soon after the rst development, it be ame popular the use of standardwindow glass in RPCs, also alled soda-lime-sili a glass or just oat glass [47,[50. It is widely available, aordable and still with a resistivity ρ ≃ 1012−13
Ω m, allowing for operation at rates up to around 500 Hz/ m2.As `timing RPCs' is the entral issue of the present work, its des riptionwill be developed in more detail in forth oming se tions. However, most ofthe hara teristi s mentioned in the following an be extrapolated to standardRPCs.
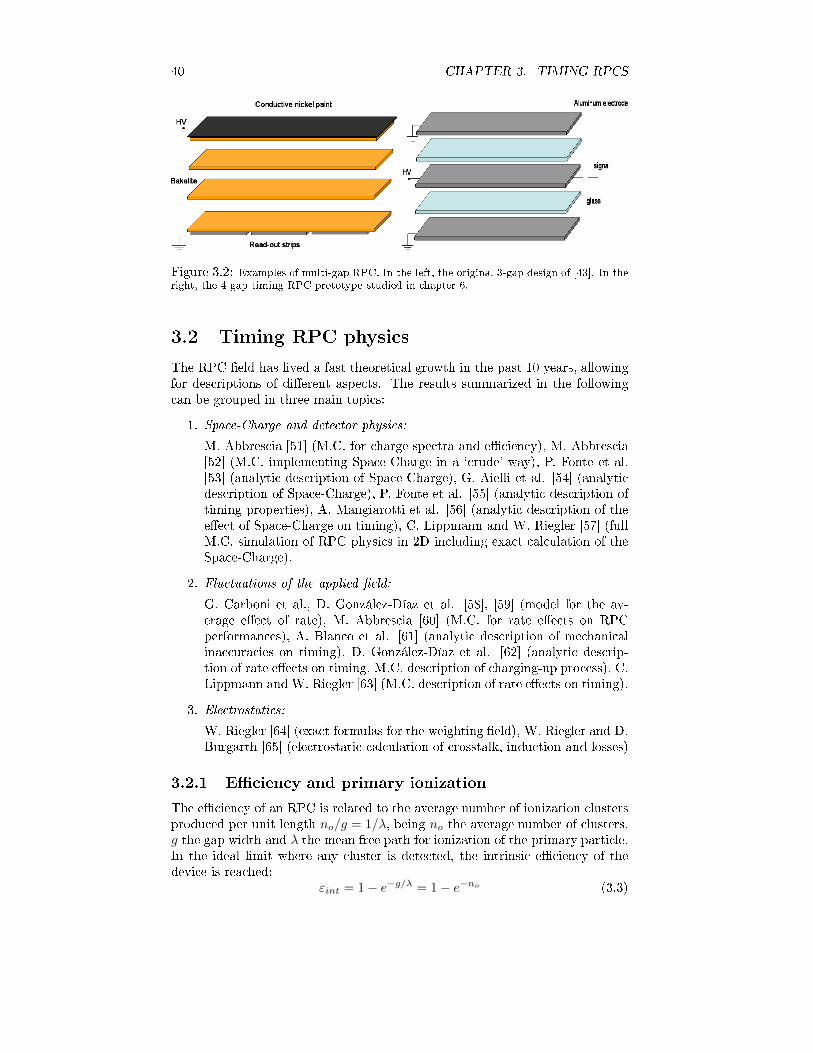
40 CHAPTER 3. TIMING RPCS
Figure 3.2: Examples of multi-gap RPC. In the left, the original 3-gap design of [43. In theright, the 4-gap timing RPC prototype studied in hapter 6.3.2 Timing RPC physi sThe RPC eld has lived a fast theoreti al growth in the past 10 years, allowingfor des riptions of dierent aspe ts. The results summarized in the following an be grouped in three main topi s:1. Spa e-Charge and dete tor physi s:M. Abbres ia [51 (M.C. for harge spe tra and e ien y), M. Abbres ia[52 (M.C. implementing Spa e-Charge in a ` rude' way), P. Fonte et al.[53 (analyti des ription of Spa e-Charge), G. Aielli et al. [54 (analyti des ription of Spa e-Charge), P. Fonte et al. [55 (analyti des ription oftiming properties), A. Mangiarotti et al. [56 (analyti des ription of theee t of Spa e-Charge on timing), C. Lippmann and W. Riegler [57 (fullM.C. simulation of RPC physi s in 2D in luding exa t al ulation of theSpa e-Charge).2. Flu tuations of the applied eld:G. Carboni et al., D. González-Díaz et al. [58, [59 (model for the av-erage ee t of rate), M. Abbres ia [60 (M.C. for rate ee ts on RPCperforman es), A. Blan o et al. [61 (analyti des ription of me hani alina ura ies on timing), D. González-Díaz et al. [62 (analyti des rip-tion of rate ee ts on timing, M.C. des ription of harging-up pro ess), C.Lippmann and W. Riegler [63 (M.C. des ription of rate ee ts on timing).3. Ele trostati s:W. Riegler [64 (exa t formulas for the weighting eld), W. Riegler and D.Burgarth [65 (ele trostati al ulation of rosstalk, indu tion and losses)3.2.1 E ien y and primary ionizationThe e ien y of an RPC is related to the average number of ionization lustersprodu ed per unit length no/g = 1/λ, being no the average number of lusters,g the gap width and λ the mean free path for ionization of the primary parti le.In the ideal limit where any luster is dete ted, the intrinsi e ien y of thedevi e is rea hed:
εint = 1 − e−g/λ = 1 − e−no (3.3)
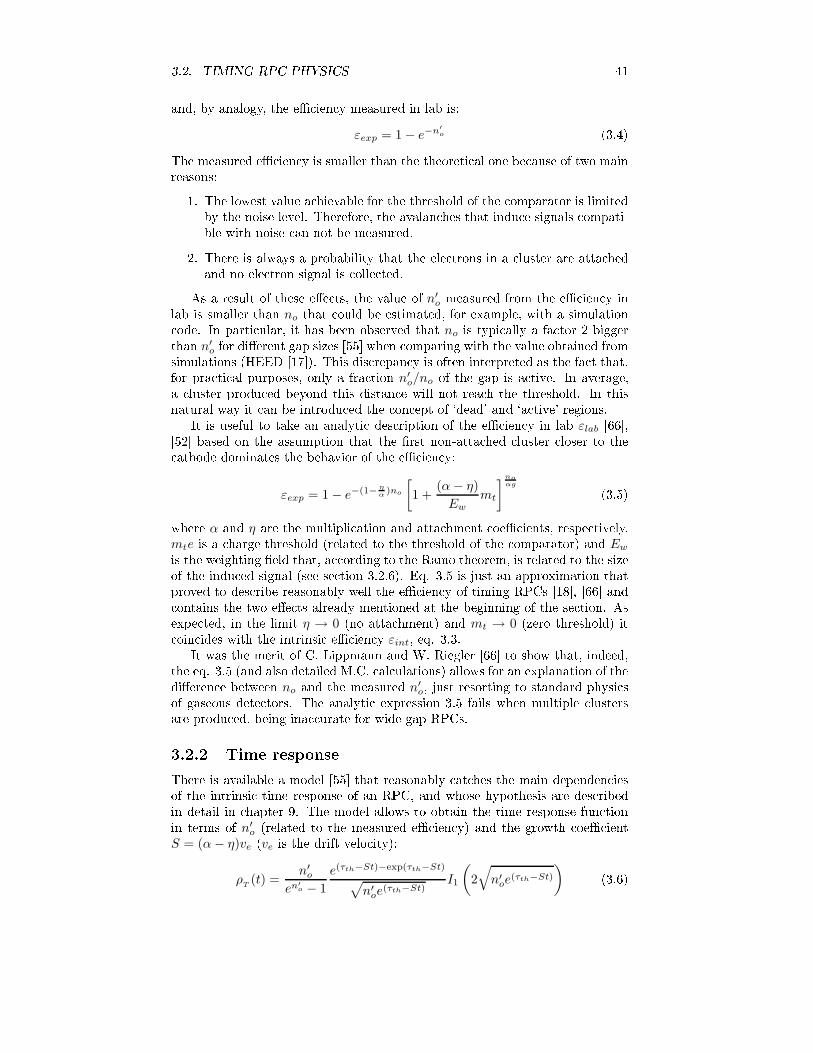
3.2. TIMING RPC PHYSICS 41and, by analogy, the e ien y measured in lab is:εexp = 1 − e−n′
o (3.4)The measured e ien y is smaller than the theoreti al one be ause of two mainreasons:1. The lowest value a hievable for the threshold of the omparator is limitedby the noise level. Therefore, the avalan hes that indu e signals ompati-ble with noise an not be measured.2. There is always a probability that the ele trons in a luster are atta hedand no ele tron signal is olle ted.As a result of these ee ts, the value of n′o measured from the e ien y inlab is smaller than no that ould be estimated, for example, with a simulation ode. In parti ular, it has been observed that no is typi ally a fa tor 2 biggerthan n′
o for dierent gap sizes [55 when omparing with the value obtained fromsimulations (HEED [17). This dis repan y is often interpreted as the fa t that,for pra ti al purposes, only a fra tion n′o/no of the gap is a tive. In average,a luster produ ed beyond this distan e will not rea h the threshold. In thisnatural way it an be introdu ed the on ept of `dead' and `a tive' regions.It is useful to take an analyti des ription of the e ien y in lab εlab [66,[52 based on the assumption that the rst non-atta hed luster loser to the athode dominates the behavior of the e ien y:
εexp = 1 − e−(1− ηα
)no
[
1 +(α − η)
Ewmt
]noαg (3.5)where α and η are the multipli ation and atta hment oe ients, respe tively.
mte is a harge threshold (related to the threshold of the omparator) and Ewis the weighting eld that, a ording to the Ramo theorem, is related to the sizeof the indu ed signal (see se tion 3.2.6). Eq. 3.5 is just an approximation thatproved to des ribe reasonably well the e ien y of timing RPCs [18, [66 and ontains the two ee ts already mentioned at the beginning of the se tion. Asexpe ted, in the limit η → 0 (no atta hment) and mt → 0 (zero threshold) it oin ides with the intrinsi e ien y εint, eq. 3.3.It was the merit of C. Lippmann and W. Riegler [66 to show that, indeed,the eq. 3.5 (and also detailed M.C. al ulations) allows for an explanation of thedieren e between no and the measured n′o, just resorting to standard physi sof gaseous dete tors. The analyti expression 3.5 fails when multiple lustersare produ ed, being ina urate for wide gap RPCs.3.2.2 Time responseThere is available a model [55 that reasonably at hes the main dependen iesof the intrinsi time response of an RPC, and whose hypothesis are des ribedin detail in hapter 9. The model allows to obtain the time response fun tionin terms of n′
o (related to the measured e ien y) and the growth oe ientS = (α − η)ve (ve is the drift velo ity):
ρT(t) =
n′o
en′
o − 1
e(τth−St)−exp(τth−St)
√
n′oe
(τth−St)I1
(
2√
n′oe
(τth−St)
) (3.6)

42 CHAPTER 3. TIMING RPCSwhere τth = ln [mt(1 − η/α)] and I1 is the modied Bessel fun tion. The rms5(time resolution) an be extra ted from eq. 3.6 to be:rmsT
=K(n′
o)
S(V )(3.7)
K(n′o) has an analyti expansion as a fun tion of n′
o that an be found elsewhere[67, whereas its fun tional dependen e is presented in g. 9.1.The relevant feature of eq. 3.7 is that the time resolution an be separatedin two dierent ontributions: the u tuation due to the primary and multipli- ation statisti s K(n′o) that depends on the primary intera ting parti le on onehand, and the growth oe ient of the gas S that depends on the applied eldand the parti ular gas mixture on the other hand. It must be noted that thetwo magnitudes n′
o and S are not ompletely independent6, but expression 3.7provides onsiderable insight in the timing properties of an RPC as a fun tionof the physi s involved.It is apparent in expression 3.6 that the ee t of τth (equivalently, the thresh-old of the omparator) is just a global shift that will not ae t any moment oforder larger than one around the mean of the distribution, in parti ular the timeresolution. This ee t is well known experimentally [46 and is also reprodu edby the numeri al al ulations of [57.Limitations for timingThe maximum eld applied in a timing RPC is limited by the apparition ofstreamers, that start to deteriorate the apabilities due to the large hargereleased. In a rst approa h, this situation an be identied with the Raether ondition αg ≃ 20 (eq. 2.41)7. Therefore, repla ing α in eq. 3.7, it is possible toinfer that the best time resolution a hievable in a given onguration behavesas: rmsT
∣
∣
min∼ K(n′
o)
veg (3.8)The dependen e on the gap size is also present through the number of primary lusters released n′
o but, being this dependen e relatively small (g. 9.1), thedominant ee t is that the time resolution worsens with the in rease in thegap size. This ee t is well established experimentally [44, showing deviationsfor very small gaps (g < 0.3 mm). A omplete pi ture requires to understanddeeply the Spa e-Charge physi s and the Raether riteria.Eq. 3.6 has tails towards delayed times, be oming Gaussian for high n′o.In this limit, K(n′
o) behaves approximately as K/√
n′o a ording to g. 9.1.Therefore, in the limit where n′
o is large, it is possible to rewrite expression 3.85Root Mean Square.6For example: if the voltage hanges, S will hange, but also the e ien y, and thereforen′
o. However, the inuen e of the voltage over n′
o is only logarithmi while linear over S (see hapter 7).7In fa t, the Raether limit was experimentally obtained for wide gaps with widths at thelevel of m. The quantitative justi ation for the limit derived in [29 would be also modiedin ase of narrow gaps. However, what is required for the argument presented in the text is toassume that αg ≃ tant represents a pra ti al limit with independen e on g, for typi al RPCsizes.

3.2. TIMING RPC PHYSICS 43in a more transparent way as a fun tion of fundamental variables:rmsT
∣
∣
min∝ 1
ve(E)
√
λg
N(3.9)being ve the drift velo ity at the eld orresponding to the begining of theprodu tion of streamers, g the gap size, N the number of gaps and λ the meanfree path for ionization.3.2.3 Time- harge orrelationEquation 3.6 stands for the intrinsi response of the RPC and no attempt isdone to des ribe the extra jitter oming from non-ideal ele troni s. Besidesthe unavoidable ele troni jitter, a systemati shift of the tof8 measured atxed velo ity of the primary parti le is always present, and it depends on theavalan he size. This `walk' an be subtra ted, if the harge is measured, througha pro edure often alled in the literature `the slewing orre tion'.There is a part of the time- harge orrelation oming from ele troni s, er-tainly, but it has been suggested that there is also an intrinsi orrelation omingfrom the avalan he physi s [47, an ee t not favoured by M.C. al ulations [57.It is not the obje tive of this work to dis uss the nature of the time- harge orrelation in timing RPCs. However, it must be said that the slewing orre tionallows to typi ally improve the time resolution by 20-60 ps (see table 3.1 at theend of the hapter). An example of how this orrelation looks like is shown ing. 6.15.3.2.4 Spa e-ChargeSpa e-Charge is known to be ru ial for interpreting the harge spe tra ande ien ies of both standard RPCs [48 and tRPCs [53, [57.Let's assume the following very naive image: a) the avalan he grows untilrea hing a riti al number of ele trons, b) su h riti al number is related tothe situation where the avalan he self-eld is omparable to the applied one,resulting in a redu tion of the ee tive eld in a large region of the avalan hedevelopment (see g. 2.5), ) further ionizations are highly redu ed for a largefra tion of the se ondary ele trons, whi h drift towards the anode almost unaf-fe ted (see g. 3.3), d) the average eld reated by the avalan he is proportionalto the number of arriers (negle ting diusion ee ts):
Eavalanche ∝ ne ∝ q (3.10)On the other hand, a ording to the assumptions made, the avalan he willgrow up to the point when the lo al eld is equal to the applied eld E, i.e.Eavalanche = E . This implies that q ∝ E. In a parallel geometry E ∝ V andtherefore:
q ∝ V (3.11)For low voltages, i.e., before the onset of the Spa e-Charge regime, the growth ofthe average harge q with V will be the one expe ted for a proportional ounter:q ∝ eα(V )g (3.12)8Time of ight.

44 CHAPTER 3. TIMING RPCS
Figure 3.3: Figures inspired in [54, for trigger RPCs. The left pi ture orresponds to thesemi-empiri al law q(V ) = K ln(1 + ea(V −Vth)) that des ribes well the exponential and thelinear regions observed experimentally. Vth is related to the onset of the Spa e-Charge ee t.The dashed line shows the region where the linear behavior is a reasonable assumption. Inthe right, the Spa e-Charge ee t is illustrated a ording to the very naive model of text.For high elds, the behavior of α as a fun tion of V an be approximated by alinear trend [66, so the growth of the average harge with V is well des ribedby an exponential.Despite its simpli ity, the view proposed for des ribing Spa e-Charge is inagreement with the observations made on tRPCs [68 (quoted as a transitionfrom an exponential region to a `sub-exponential' region) and standard 2 mmRPCs [54 [58.A ni e attempt to reprodu e the transition from the exponential to the linearregime onsists in omparing this situation with a self-regulated system su h asa biologi al population in an environment with limited resour es [54. In this ase the role of the `resour es' is played by the eld observed by the ele trons inthe avalan he, whi h are the a tive population. The ele trons `eat' ele tri eldup to when it is exhausted and then further growing is stopped. This modelpredi ts in a natural way an exponential `proportional' regime followed by a`saturated' regime where the behavior is linear (g. 3.3).Spa e-Charge redu es the released harge by several orders of magnitude as ompared to the expe ted from a proportional regime. Moreover, it allows torea h very high values of α before streamers start to be important, resultingin a very narrow time response (eq. 3.7). For illustration: taking the averagevalue α ≃ 90/mm obtained in lab at E = 100 kV/ m under operation withthe standard mixture [69 it would be expe ted αg = 25, yielding for a tRPCworking in a proportional regime a total harge given by:q
total≃ e eαg ≃ 104pC (3.13)whi h is orders of magnitude above the typi al harges observed in tRPCs (atthe level of few pC).It is known that a parallel geometry does not represent an adequate hoi efor measuring the energy released by the primary parti le, be ause of the un- ertainty in the position of the rst intera tion. In RPCs, due to the presen eof Spa e-Charge, the orrelation between the released harge and the olle tedone is even smaller, be ause all the avalan hes are doomed to a similar end.
3.2. TIMING RPC PHYSICS 453.2.5 Prompt harge vs indu ed hargeThe harge indu ed during the drift of the ele trons along the gap is denotedas prompt/ele troni harge qprompt
, a pro ess that takes pla e typi ally in therst 3 ns after luster formation (ve ≃ 100 µm/ns [69, g/ve ≃ 3.0 ns). Thedrift time of the ions is onsiderably larger, being at the level of µs. The termindu ed harge qinduced
is used here to denote the harge indu ed during boththe drifts of the ele trons and the ions in the gap.The total harge released annot be a ounted for before the ow in theresistive plates takes also pla e (at the s ale of its relaxation time). In a naturalway, this harge is denoted as the total harge qtotal
or simply q.The average ratio qprompt
/qinduced
is often evaluated, as it has a lean depen-den e in the ase of a parallel plate hamber in the proportional regime:q
prompt
qinduced
≃ 1
αg(3.14)indi ating that most of the olle ted harge is indu ed during the ions drift, asthese are mainly produ ed lose to the anode, drifting along the whole gap g.In the presen e of Spa e-Charge the ratio is modied, and dierent des riptionsof this regime an be evaluated (see [53, [54 for instan e).3.2.6 Signal indu tionThe signal indu ed in the read-out ele troni s is usually expressed by followingthe Ramo theorem [70:
i(t) = ~Ew · ~ve(t)nee (3.15)where ne is the number of arriers, e the ele tron harge and ~ve the drift velo ity.Therefore, the measured urrent is related to the harge drifting inside the gas,through a quantity ~Ew that is alled the `weighting eld'. The weighting eldis not really an ele tri eld, having units of [L−1. It is dened as the ele tri eld when the signal ele trode is set to a voltage of 1 (no units) and all theother ele trodes to 0 (a detailed theoreti al dis ussion an be found in [64).In Appendix B it is derived that, for a parallel geometry with innite plates:q
total=
C
Cgapq
induced(3.16)where C is the total apa ity of the RPC, q
inducedis the harge indu ed duringthe drift in the gas and q
totalis the harge released (see previous se tion). Onthe other hand, also for innite plates, the weighting eld is given by:
Ew =1
g
C
Cgap(3.17)The exa t analyti expression of the weighting eld, oming from the eval-uation of the generalized Ramo theorem in the presen e of resistive materials, an be found exhaustively studied elsewhere [64. However, expressions 3.16 and3.17 provide a reasonable des ription in many pra ti al ases, as long as edgeee ts are small and the inuen e of the resistive material an be negle ted.
46 CHAPTER 3. TIMING RPCS3.2.7 Rate apabilityThe rate apability depends mainly on the volume resistan e of the plates andthe average harge released per avalan he. However, as indi ated in [38, thesurfa e ondu tivity must have also a role, and a part of the ee t is to enlargethe area ae ted by the avalan he [60.A des ription of the pro ess an be attempted by assuming that the average harge q released in an avalan he is deposited on the resistive plate, inuen inga transverse area A and indu ing an average drop Vaval = q/C (C is the apa ityof the glass). The physi al pro ess is approximated by an RC ir uit oupledto a noise generator (the RPC) with a typi al relaxation time τg = RC ≃ 1s(see hapter 9 for a detailed des ription). Let's assume, for simpli ity, that at atime τg after an avalan he is produ ed the glass is already re overed and takesits nominal potential. Naming by φ the primary rate in units of [L−2 T−1 it an be reasoned that the ondition for rate ee ts to start to ontribute is:φτgA ≃ 1 (3.18)This means that the average o upan y of the area illuminated by the forth om-ing avalan hes is 1. However, eq. 3.18 does not ontain an important ingredient:the average drop per avalan he. For in luding this ee t, let's assume that a ertain drop in the voltage ∆V is required for worsening the RPC performan es(let's say a voltage drop ne essary to indu e a 5% drop in e ien y, for exam-ple). The average drop per avalan he is Vaval = q/C, therefore the onditionfor not inuen ing the RPC performan es an be written as:
φτgAq
C. ∆V (3.19)In parti ular, the left hand side of eq. 3.19 is the ohmi drop in the resistiveplates (Vglass=IR=φτgAq/C). Working on expression 3.19:
φτgA .∆V
q/C(3.20)
φ .∆V
ρdq(3.21)As natural, if the avalan he drop q/C is equal to ∆V , the expression 3.18 isre overed. Eq. 3.21 shows the ondition for rate ee ts not to be important;it an be inferred from it that the rate apability of an RPC is governed bythe average avalan he harge q, and the ` olumn resistivity' ρd (where d is thetotal thi kness of the resistive plates divided by the number of gaps and ρ is theele tri resistivity). In a rst approa h, the rate apability is independent fromthe area of inuen e of the avalan he A. This is so be ause a larger area meansa higher number of events per ae ted region, but also a lower drop indu ed perevent, due to the larger apa ity.The above reasoning provides a rule of thumb. However, it an be shownthat the u tuations of the eld in the gap around its average value depend on
A, in fa t. Under ertain onditions this ee t ould be even dominant for theRPC performan es, and it is dis ussed in detail in hapter 9.The maximum rate a hievable before the ohmi drop in the plates resultsin a deterioration of the performan es is referred in the following as the rate

3.2. TIMING RPC PHYSICS 47 apability K (in units of ux), keeping in mind that, in a rst approa h, its ales as:K ∝ 1
ρdq(3.22)If either the resistivity, the average harge, or the thi kness of the resistiveplates is de reased by a ertain fa tor, the rate apability will improve by thesame amount.It is very important to realize that an unbiased estimate of the rate apabilityrequires that data were taken during typi al times tspill larger than τg. Thisis required for the stabilization of the voltage drop ( hapter 9). If the spill ismu h shorter than the relaxation time τg, the voltage drop will be signi antlysmaller than the orresponding to the stabilized situation, leading to an over-estimation of the performan es. The ee t has been proved in short spills of0.25 s as ommonly used at CERN PS [71.3.2.8 Type of ondu tivityThere are natural questions regarding the way the harge ows through theplates. If the ondu tivity has ioni origin it will de rease in time with theamount of harge delivered, exa tly as in the ase of a battery, while if the on-du tivity is ele troni it will be stable. The former is the ase of Bakelite, whose ondu tivity seems to be related to the movement of H+ ions [72. However, forglass RPCs su h a de rease was not seen. This led to some authors to arguethat the ondu tivity is ele troni , but `hopping' [73 in ontradi tion to theexpe ted ion ondu tivity [74, [75.The mi ros opi hara teristi s of the resistivity are therefore alled to playa role in the stability of the RPC operation along time, dire tly related to therate apability and dark urrent.3.2.9 AgingAging in RPCs has nowadays a number of features, with a reasonably degree ofunderstanding. Most of the ee ts reported regarding RPC-aging are related tothe properties of the resistive plates, but also some of them have to do with thegas mixture. Bakelite, for example, has a resistivity whi h is typi ally in reasingwith time, presumably due to the loss of ioni arriers. This in rease an be orrelated with the absen e of H+ ions (see previous se tion) and thereforedepends on the drying of the gas. It has been seen that a partial re overy ofthe resistivity an be obtained via the addition of small amounts of water vapor[76, [77. This idea has been implemented for CMS hambers showing a highstability of the rate apability [42. A total re overy seems to be also possiblejust by inverting the eld [78 whi h is probably not a pra ti al solution.Another sour e of deterioration for Bakelite plates is related to the ` uring'of the linseed oil. It is signi ative the ase of the BaBar experiment, wherereal `oil stalagmites' were formed in the dete tors, de reasing signi antly itse ien y by more than 10% [79. Nowadays, only a very thin and well uredlayer of linseed oil is applied. As oil is a potential sour e of aging ee ts, somestudies are being performed in the dire tion of non-oil Bakelite RPCs [80.At last, the ne essity of monitoring the on entration of F− radi als thatappear in the mixture after the avalan he pro ess has been pointed out [81.
48 CHAPTER 3. TIMING RPCSThese radi als may bound forming the very orrosive HF. A parti ular unfavor-able situation would be that of losed gas loops; however, the addition of smallsamounts of water vapor, that rea t with HF, improves the situation [82.The situation regarding aging seems to be better in the ase of glass RPCs.On one hand, timing RPCs operated in avalan he mode during an equivalenttime of 8.5 years at a typi al maximum rate of 300 Hz/ m2 didn't show anydegradation for a wide set of ongurations as shown in [83 and also [49. In [83a small deposit was found at the glass athode, indi ating that some hemi alpro ess had taken pla e, but without inuen e on the performan es.In the ontext of glass RPCs, several tests were performed for studying thedependen e on environmental fa tors like humidity or temperature. For the ase of wide RPCs, no sizable degradation was found with the temperature[73, but a strong dependen e was observed with the per entage of humidity[84, apparently related to the presen e of freon in the mixture (CH2FCF3 wasused in this ase) and the formation of HF a id [72. The ee t vanishes when leaning up the hamber with a ow of ammonia [73.Putting everything together some ontroversy is apparent, laiming for a lari ation of the inuen e of water vapour on the formation of HF a id andageing.3.2.10 Ele troni sDue to the fast tRPC signals, having rise-times at the level of ns ( hapter3.2.5), very fast amplifying ele troni s are required, with a bandwidth up to 1GHz. Despite being a ru ial part in any fast tRPC development, the detaileddes ription of the a quisition ele troni s is out of the s ope of the present workand therefore only the two designs that have be ame more popular are brieydis ussed: the NINO ASIC9 of the ALICE group [85 and the TAQUILA boardof the FOPI group [86.The NINO hip has a dierential input and it is hara terized by its verylow power onsumption of 40 mW/ hannel. It implements a measurement ofthe time-over-threshold (TOT) of the signal, for performing the slewing orre -tion: the TOT width is sampled with a HPTDC of 25 ps bin that allow for ameasurement of both the leading and trailing edge. The design proved to befully adequate, keeping the time resolution of a 10-gap tRPC at the level of 50ps with a large e ien y plateau.The TAQUILA board is only a part of the ele troni hain, namely, it workswith the digital signals after the dis rimination stage. It is a 16 hannel boardstarted by any of the hannels and ommon-stopped by a free running 40 MHz lo k, yielding a very low jitter of σT
= 12 ± 2 ps. The FEE ele troni s stagerises the jitter up to σT
= 33 ± 4 ps, still within the requirements for operate atiming RPC. The harge for the slewing orre tion is measured with a QDC.In the framework of the HADES tRPC proje t, that is des ribed later, de-velopments are ongoing regarding fast and ompa t low-noise FEE ele troni sthat use the TOT information for the slewing orre tion [87.9Appli ation-Spe i Integrated Cir uits.
3.3. SOME TIMING RPC SYSTEMS 493.3 Some timing RPC systemsIn this se tion, the dierent timing RPC walls, in onstru tion stage or alreadynished that have been developed so far, are des ribed. Five are the experimentsthat are applying this te hnology to the eld of nu lear and parti le physi s:HARP [88, [89, ALICE [90, STAR [91, [92, [93, FOPI [86, [94 and HADES[95, [96, [97 although some others like CBM [98 are foreseen for the future.3.3.1 HARPLo ated at the CERN-PS, the tRPC wall of the HARP experiment has themerit of being the rst timing RPC wall to operate in a high energy physi sexperiment (and the only one nished so far). The design and onstru tion ofthe ele troni s together with the whole set of ells (368 hannels) took 4 monthsbetween De ember 2000 to April 2001. It is based on the original design of [45, onsisting in 4 gaps, 0.3 mm wide, operated at 3 kV/gap, with resistive platesmade out of standard oat glass (Glabervel) in a double layer onguration,for avoiding geometri losses. It is lled with a gas mixture similar to the`standard', C2F4H2/SF6/iso-C4H10 in a proportion 90/5/5. Due to the la k ofspa e, it was ne essary to ma hine the glass with a thi kness of 0.7 mm over anarea of 192×10.6 m2. This is the area per tRPC module, being ea h moduledivided in 64 pads, grouped in 8 strips per ele troni hannel. A drawing of theexperiment together with a s hemati diagram of a module are shown in g.3.4.The requirements in terms of rate apability are not severe, as the typi alrates stand below 1 Hz/ m2. Typi al e ien y is at the level of 99% and timeresolutions around 150 ps, that an be redu ed to 105 ps for a single pad. Therequirements of the experiment were ε ≥ 99% (for an error lower than 1-2% inthe determination of the ross-se tion [88) and σT<200 ps (for PID10).Although rate apability was not a tight requirement, a test was performedat φ=2 kHz/ m2 at CERN-PS, observing a slight deterioration of the perfor-man es.Crosstalk was reported below the level of 10%.3.3.2 ALICEThe onstru tion of the ALICE tRPC wall was foreseen in 2000 in the frameworkof the new hadron ollider fa ility at CERN (LHC). It provides the best perfor-man es so far. The authors even indi ate that they are lose to the maximumresolution a hievable with the devi e, due to the fa t that the larger ontributionto the time jitter omes from the ele troni s, not from the dete tor.ALICE tRPC is a huge proje t for overing 150 m2 with 160000 ele troni hannels and a time resolution below 100 ps, with a high overall e ien y. The athode is segmented in pads with areas of 9 m2 approximately, and the designexploits the multi-gap on ept up to a total of 10 gaps with an applied voltage
V = 2.5 kV/gap. Note that the voltage is lower than HARP be ause the gapis also slightly smaller (0.25 mm) requiring less voltage for getting the typi aloperating elds of 100 kV/ m. The glass is as thin as 0.4 mm. A layout of atypi al ell is shown in g. 3.5.10Parti le IDenti ation.

50 CHAPTER 3. TIMING RPCS
Figure 3.4: HARP spe trometer (up) and detail of the HARP tRPC wall (down) [88.
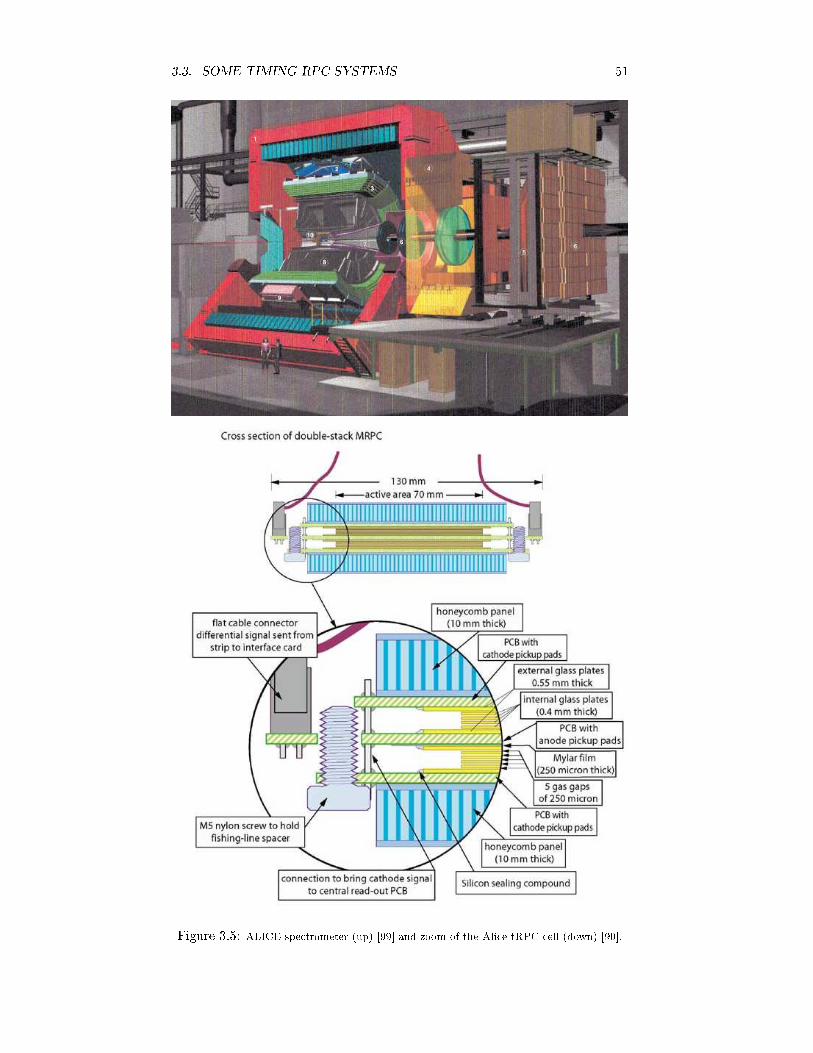
3.3. SOME TIMING RPC SYSTEMS 51
Figure 3.5: ALICE spe trometer (up) [99 and zoom of the Ali e tRPC ell (down) [90.

52 CHAPTER 3. TIMING RPCSThe results of the ALICE tRPC tests have shown to fulll the ommissioningrequirements, providing resolutions well below 50 ps and e ien ies up to 99.9%.The rate apability was estimated to be around 1 kHz/ m2.3.3.3 STARThe tRPC wall for STAR at RHIC was born, in fa t, at CERN, some of theirmembers oming from the ALICE tRPC group. It is in an advan ed stage andone of the nal 120 trays foreseen has shown already satisfa tory performan es.Its main te hni al requirement is to provide a time resolution below 100 ps overa large area of 60 m2. The dete tor is onstituted by modules of 9.4×21 m2,pi king-up the signals in pads of 6.3×3.15 m2. It is made out of 6-gap tRPCs ofthin glass (0.5 mm) and very narrow gaps of 0.22 mm, allowing for operation at± 7.5 kV between the ele trodes. The e ien y is at the level of 95-97%, plusadditional 5% losses due to geometri ine ien y. Regarding time response,60-70 ps of resolution were a hieved, fullling the requirements. A pi ture ofthe design is presented in g. 3.6.A ording to the authors, measurements performed under a pulsed beam (0.3ms) at CERN-PS suggest a rate apability higher than 500 Hz/ m2, providinga safe operating margin for the typi al rates around 10 Hz/ m2 expe ted for theSTAR experiment. Re ent `in-beam' measurements for p-p and d-Au ollisionshave shown also good performan es [93.3.3.4 FOPIFOPI dete tor is lo ated at GSI-SIS in Darmstadt-Germany. There, a tRPCwall is under development to surround the entral tra king hamber. It wasa multi-step development, from Pestov ounter to 4-gap tRPC to 6-gap tRPC(0.3 mm gap), that seems to oer the best performan es, rea hing e ien ies of97 ± 3% and time resolutions of 73 ± 5 ps. It uses the standard mixture and isreally a multi-strip design in the sense that the pit h between pi k-up strips isas small as 3.44 mm, being 90 m long.Its performan e has been tested under dierent onditions: Co60, protonand deuterium at rates of 50-100 Hz/ m2, whi h are a fa tor 2 larger than theexpe ted in the experiment. An inhomogeneity of the ells regarding systemati shifts of the time distribution has been reported; however, it an be orre tedo-line. There are also plans to improve the me hani s [94.FOPI design has the remarkable parti ularity that the impedan e of the ell oin ides with the impedan e of the read-out ables and nally the FEEele troni s with a value Z = 50 ± 1 Ω [86. This avoids ree tions inside thedete tor, making easier the handling of the indu ed signal. A pi ture of the ells is shown in g. 3.7.

3.3. SOME TIMING RPC SYSTEMS 53
Figure 3.6: STAR spe trometer [100 and the STAR wall [91.
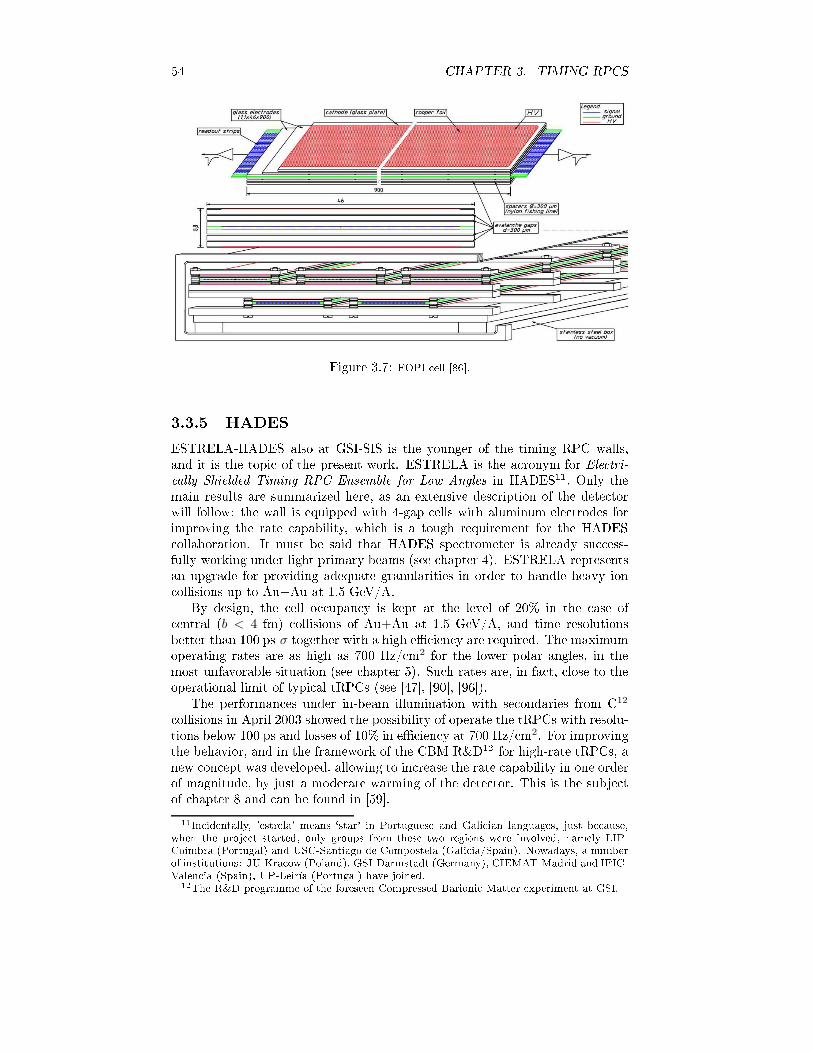
54 CHAPTER 3. TIMING RPCS
Figure 3.7: FOPI ell [86.3.3.5 HADESESTRELA-HADES also at GSI-SIS is the younger of the timing RPC walls,and it is the topi of the present work. ESTRELA is the a ronym for Ele tri- ally Shielded Timing RPC Ensemble for Low Angles in HADES11. Only themain results are summarized here, as an extensive des ription of the dete torwill follow: the wall is equipped with 4-gap ells with aluminum ele trodes forimproving the rate apability, whi h is a tough requirement for the HADES ollaboration. It must be said that HADES spe trometer is already su ess-fully working under light primary beams (see hapter 4). ESTRELA representsan upgrade for providing adequate granularities in order to handle heavy ion ollisions up to Au+Au at 1.5 GeV/A.By design, the ell o upan y is kept at the level of 20% in the ase of entral (b < 4 fm) ollisions of Au+Au at 1.5 GeV/A, and time resolutionsbetter than 100 ps-σ together with a high e ien y are required. The maximumoperating rates are as high as 700 Hz/ m2 for the lower polar angles, in themost unfavorable situation (see hapter 5). Su h rates are, in fa t, lose to theoperational limit of typi al tRPCs (see [47, [90, [96).The performan es under in-beam illumination with se ondaries from C12 ollisions in April 2003 showed the possibility of operate the tRPCs with resolu-tions below 100 ps and losses of 10% in e ien y at 700 Hz/ m2. For improvingthe behavior, and in the framework of the CBM R&D12 for high-rate tRPCs, anew on ept was developed, allowing to in rease the rate apability in one orderof magnitude, by just a moderate warming of the dete tor. This is the subje tof hapter 8 and an be found in [59.11In identally, 'estrela' means `star' in Portuguese and Gali ian languages, just be ause,when the proje t started, only groups from these two regions were involved, namely LIP-Coimbra (Portugal) and USC-Santiago de Compostela (Gali ia/Spain). Nowadays, a numberof institutions: JU-Kra ow (Poland), GSI-Darmstadt (Germany), CIEMAT-Madrid and IFIC-Valen ia (Spain), UP-Leiría (Portugal) have joined.12The R&D programme of the foreseen Compressed Barioni Matter experiment at GSI.

3.3. SOME TIMING RPC SYSTEMS 55After the 2003 test, `pros' and ` ons' were found in the design. The main`pro' is that the ross-talk between neighboring strips was redu ed to 0.5% dueto the shielding between the ells, as ompared to previous results at the levelof 80% [47. The dete tor also proved to be highly homogeneus over an area of60×2 m2 and, furthermore, the parameters required for performing the slew-ing orre tion ould be obtained from any position. As the main ` on', it mustbe mentioned that the shielding requires dead regions between ells, that wereestimated to be around 15% per ent of the total area for perpendi ular tra ks.Therefore, the multi-hit apability is guaranteed at the pri e of some loss ingeometri a eptan e. The last an be over ame by a double layer ongura-tion [101. The di ulties of this approa h are not negligible: on one hand itin reases the number of hannels by around 20% due to the ne essary overlap,providing, as a benet, the possibility of self- alibration of the devi e [97; on theother hand the material budget is in reased and a dependen e of the geometri a eptan e with the angle of in iden e is also introdu ed. The rst problem(the in rease in the material budget) is mitigated by the fa t that the only de-te tor pla ed downstream the tRPC wall is a shower dete tor whi h proved tobe quite insensitive to the amount of material pla ed upstream. The se ondproblem requires a detailed design guaranteeing that all the parti les within the`relevant angles' of in iden e over the tRPC wall are handled. Dis ussions onthese issues are postponed to hapter 5.A photograph of the prototype tested in April 2003 an be found in g. 6.1.3.3.6 Features of tRPC wallsA summary of the main hara teristi s of ea h tRPC wall is presented in table3.1. The table intends to be a omprehensive ompilation of data that allowsto ompare the performan es of ea h timing wall. Some of the elds require ex-planation: the `e ien y' do not in lude geometri ine ien y, it stands for theintrinsi e ien y of the devi e. In the ase of the urrent HADES prototypethe ine ien y is, in fa t, dominated by the geometri losses due to shielding.The ` ell size' is dened as the area per pi k-up pad/strip and stands for the typ-i al values. The values reported for the ` olumn resistivity' ρd are based on theestimates given by the authors. The spa e resolution is usually not published:it is followed the onvention of taking one σ for the position resolution alongthe dire tion of signal propagation and w/√
12 in the transversal dire tion (w isthe ell width)13. Finally, some of the entries in the table are empty, meaningthat the magnitude is onsidered as re ommendable for inter- omparisons buthas not been provided by the authors.The rate apability is di ult to obtain: in the ase of HADES and ALICEit has been dened as the rate required for a 5% drop in e ien y, and HARPand STAR are just reasonable estimates from data. Only HADES used longspills with durations above 5 s.Besides the omments above, not all the measurements were taken under thesame onditions. For example: HARP values really ome from the nal barrelalready installed, ALICE represents the performan es under spot illumination,STAR tested a single tray under realisti onditions, FOPI is ready to start13I.e., for the resolution in the transversal dire tion, the rms of a at distribution a ross the ell width was assumed.

56 CHAPTER 3. TIMING RPCSDete tor HARP ALICE STAR FOPI HADESNgaps 4 10 6 6 4gap size [mm 0.3 0.25 0.22 0.3 0.3gas[C2F4H2/SF6/C4H10 90/5/5 90/5/5 90/5/5 85/10/5 98.5/1/0.5ele tri onguration at-an- at at-an- at an- at at-an- at at-an- at ell size [ m× m 22×10.6 2.5× 3.7 6.3× 3.1 90×0.34 60×2dete tor size 10 m2 150 m2 60 m2 5 m2 8 m2Nchannels 368 160000 ≃ 30000 5000 ≃ 2100HV /gap 3.0 kV 2.4 kV 2.35 kV 3.3 kV 3.2 kVε 99% 99.9% 95-97% 97 ± 3% >95%plateau length 300 V 2000 V 500 V 600 V & 200 VσT - 90 ps 120 ps - 100 psσ
T(after slewing orr.) 150 ps 40 ps 60 ps 73 ± 5 ps 70 ps ross-talk/neighbor < 10% - - - < 0.5%3-σ tails - - - < 2% 6%spa e resolution [ m2 - - - - 0.6×0.6experiment rates 1 Hz/ m2 50 Hz/ m2 10 Hz/ m2 50 Hz/ m2 700 Hz/ m2dark rate [Hz/ m2 < 0.1 - < 0.3 < 1 2−3rate apability [Hz/ m2 ≤ 2000 ≤1000 - - 350
ρ d [1012 Ω × m2 10 × 0.105 - × 0.04 5 × 0.055 - × 0.15 5 × 0.1q - 2 pC - - -qprompt - - - - 0.7 pCmaterial budget (x/Xo) - - - - 12-24%resistive material oat glass oat glass oat glass oat glass oat glassTable 3.1: Dierent timing RPC walls and some of their hara teristi s.mass produ tion and HADES is at the se ond prototype (results on the lastprototype are not in luded here but an be found in [1).As a on lusion from table 3.1, the situation of the RPC te hnology is ratherex iting, with several experiments ready to take data. There is a number of dif-ferent RPC spe ies, and the parti ular hoi e is determined by the requirementsof the experiment, regarding mainly the required rate apability, granularity( ell size), e ien y, ross-talk, spa e and time resolution, and material budget.By now, some ommon features have also emerged: a) oat glass is widely usedin timing RPCs, b) the gas mixtures adopted are similar, using a ertain amountof C2F4H2, SF6 and iso-C4H10 in a proportion around 85/10/5 (the standardmixture), ) the gaps lay in a narrow range from 0.22 to 0.3 mm, allowing fortypi al elds around 100 kV/ m, d) the rate apability is limited to some hun-dreds of Hz/ m2 and e) all the tRPC walls have 4 gaps or more allowing fore ien ies well above 95%.

Chapter 4Nu lear physi s at HADES4.1 Relativisti heavy ion ollisionsThere are, at least, two important reasons for studying heavy ion ollisions atrelativisti energies:1. To understand the properties of nu lear matter, mainly its Equation ofState (EoS).2. To establish the presen e of in medium ee ts on the properties (mass,de ay width, rea tion ross se tion) of hadrons surrounded by a densenu lear medium.The latter is the paramount s ope of the HADES onstru tion at GSI-SIS(Darmstadt, Germany) and in parti ular of the upgrade to the tRPC wall at lowpolar angles (θ < 45). The wall has been devised to study heavy ion ollisionsup to Au+Au at kineti energies Ekin = 1.5 GeV/A and is the subje t of thepresent work.4.1.1 The Equation of State of Nu lear MatterWith the term nu lear matter it is usually meant an innite (to negle t surfa eee ts) medium, made of nu leons at global me hani al, hemi al and thermalequilibrium, where the ontribution to the energy per nu leon W of the Coulombintera tion an be ignored. As su h, nu lear matter an be onsidered mainly atheoreti al obje t. Some ases are (were), however, present in nature, as neutronstars or the early phases of the Big-Bang. On earth, the losest possible situationis the re-ball formed in entral heavy ion ollisions: at bombarding energies of1-2 GeV/A, barioni densities of 2-3 times ρo
1 an be rea hed. Unfortunately,su h onditions last merely 15 fm/ and the degree of equilibration a hieved insu h a short time is open to questions.Typi ally, the EoS is represented through the energy per baryon W and ex-pressed as a fun tion of two thermodynami variables: the temperature T and1ρo ≃ 0.17 nu leons/fm3 is the saturation value in the ore of heavy nu lei.57

58 CHAPTER 4. NUCLEAR PHYSICS AT HADESthe density ρ. It is usually de omposed in a thermal part WTand a ompres-sional part W
C[102:
W (ρ, T ) = WC(ρ) + W
T(ρ, T ) + Wo
Wo = W (ρ = ρo, T = 0)
WC(ρ) = W (ρ, T = 0) − Wo
WT(ρ, T ) = W (ρ, T ) − W (ρ, T = 0)
(4.1)The energy per nu leon an be expressed in dierential form as:dW = T ds − P dv (4.2)where v and s are the volume and entropy per nu leon, and the pressure an betherefore expressed as:
P = −(
∂W
∂v
)
s
= ρ2
(
∂W
∂ρ
)
s
(4.3)The EoS is hara terized by three fundamental onstraints:1. The value of Wo given by the nu leon mass minus the volume term in theliquid drop mass formula Wo ≃ (938 − 15) MeV/A = 923 MeV/A.2. The ondition of stability for ordinary nu lei (i.e. W must have a minimumat ρ = ρ0):
(
∂WC
∂ρ
)
ρ=ρo
= 0
(
∂2WC
∂ρ2
)
ρ=ρo
> 0
(4.4)3. The value of the ompressibility κ [102:κ = 9
(
∂P
∂ρ
)
s
= 9 ρ2
(
∂2W
∂ρ2
)
s
(4.5)A high ompressibility (κ . 200 MeV) will lead to high densities in entralheavy ion ollisions and the orresponding EoS is alled `soft', while alow ompressibility (κ & 250 MeV) will lead to low densities and the orresponding EoS is alled `sti'.Histori ally, the study of parti le produ tion in heavy ion ollisions wasstarted with the motivation of rea hing an independent estimate of κ, but nowa-days has a vigorous life of its own with the investigation of possible in mediumee ts (see next se tion).Pion produ tion was believed to be a good observable to extra t κ [103:their yield per ollision is proportional to the fra tion of initial beam energythat is onverted into thermal ex itation (≃ WT) and is higher for a stierEoS2. However, pions intera t strongly with nu leons and are easily absorbed,2Smaller densities are rea hed in the re-ball and less energy is stored in ompressionalform ≃ W
C.
4.1. RELATIVISTIC HEAVY ION COLLISIONS 59so their total number is ae ted also by the details of the expansion phase ofthe re-ball.J. Ai helin ans C.M. Ko had then an idea that hanged the s ope of theeld: the use of sub-threshold K+ produ tion (NN → K+ΛN requires Elab >1.6 GeV) as a promising probe for κ [104: in fa t strangeness is onservedin strong intera tions and K+ absorption (due to the presen e of a s quark)is negligible in nu lear matter3. This idea seemed even more attra tive: atsub-threshold energies the produ tion in dire t nu leon-nu leon ollision is veryunlikely, requiring of a two step pro ess involving baryon-baryon or baryon-pion ollisions. An experimental onrmation of this ooperative me hanismis given by the almost quadrati dependen e of the K+ multipli ity on thenumber of parti ipants [105. For pions, that are above threshold at the sameenergies, a simple linear dependen e is found. The probability of the two stepsto happen in as ade is expe ted to be inuen ed by the volume of the re-ball, that is in turn, for a given entrality, ae ted by κ. This qualitative on lusion has been onrmed by detailed transport model al ulations [106.Unfortunately, this apparently lear situation is obs ured by the possibility of inmedium ee ts on the K+ mass, that is predi ted to in rease with the densityinside the nu lear matter (see next se tion). So, a given value of κ will ae talso the K+ produ tion by hanging the in medium threshold and introdu ingmore un ertainties in the theoreti al al ulation. The determination of the EoSfrom the measured K+ yield be omes therefore more di ult. Re ently, thisobsta le has been attenuated by the use of the K+ multipli ity ratio between aheavy system (Au+Au) and a light one (C+C):
(MK+/A)Au+Au
(MK+/A)C+C
(4.6)Studying the beam energy dependen e of this magnitude in the range from 0.8GeV/A to 1.6 GeV/A, the KaoS ollaboration has established that a soft EoS(κ = 200 MeV) is ompatible with data, while a sti one (κ = 380 MeV) is not[107.The value of κ has also important astrophysi al onsequen es. In the oreof a neutron star the gravitational for e is ounterbalan ed by the resistan e ofnu lear matter to ompression. So, depending on the EoS, only ertain regionsof the mass-radius parameter spa e are possible [108. In parti ular, a stierEoS (κ & 200 MeV) would allow higher stellar masses (M & 2M⊙).4.1.2 In medium ee tsA se tion on the theoreti al des ription of in medium ee ts lays out of thes ope of the present work. However, it should be appre iated in the follow-ing that a lear di hotomy exists in the theoreti al ma hinery devised to treatpseudo-s alar (π, K) or pseudo-ve tor (ρ, ω, φ) mesons, that are widely used asexperimental probes of in medium ee ts.3Strangeness ex hange is present and so a omplete measurement would require the har-a terization of Ko produ tion.

60 CHAPTER 4. NUCLEAR PHYSICS AT HADES
200
300
400
500
600
700
800
900
0 0.5 1 1.5 2 2.5 3
ρ/ρ0
m* (
MeV
)
G.Q. Li and C.M. Ko, N.P. A594(1995)460C.H. Lee, P.R. 275(1996)255W. Weise, N.P. A610(1996)35cJ. Schaffner et al., P.L. B334(1994)268
K −
K +
kaon in−medium mass
Figure 4.1: Compilation of several al ulations for the K+/K− ee tive masses at zerotemperature [109.K+/K−A systemati omparison [109 between dierent al ulations of the in mediumkaon mass is reprodu ed in g. 4.1 for the ase of innite nu lear matter inequilibrium at zero temperature. The ee tive mass of the K+ rises with densitywhile that of the K− de reases, both in an approximately linear way. In morefundamental terms, K+ and K− are subje t to a repulsive and an attra tivepotential, respe tively. All approa hes agree qualitatively and, for example, atρ ≃ ρ0 a ≃ 10% rise and a ≃ 20% drop are predi ted for the ee tive mass ofthe K+ and of the K−, respe tively.

4.2. LEPTONIC PROBES OF IN MEDIUM EFFECTS 61ρ, ω, φBased on arguments dealing with the symmetries of the QCD Lagrangian, G.E. Brown and M. Rho introdu ed in 1991 what is nowadays known as theBrown-Rho s aling [110:
m⋆ω
mω≃
m⋆ρ
mρ≃ f⋆
π
fπ(4.7)where the star indi ates in medium quantities, fπ is the pion de ay onstantand mρ and mω refer to the masses of the orresponding pseudo-ve tor mesons.They were also able to link the pion de ay onstant fπ with the hiral ondensate[110:
〈0⋆|qq|0⋆〉〈0|qq|0〉 =
(
f⋆π
fπ
)3 (4.8)For illustration, a re ent al ulation of the hiral ondensate as a fun tion ofthe density and temperature in innite nu lear matter at equilibrium is repro-du ed in g. 4.2 [113, normalized to the value at ρ = 0, T = 0. In parti ular,the de rease of 〈0⋆|qq|0⋆〉/〈0|qq|0〉 at ρ → ∞ and/or T → ∞ is linked to thepartial restoration of hiral symmetry of the QCD Lagrangian. Su h a symme-try is broken expli itely by the nite masses of the quarks and spontaneouslyby the non-zero value of the hiral ondensate.In 1992, Hatsuda and Lee [111 onrmed the on lusions of [110 using inmedium QCD sum rules to onne t hadroni and quark degrees of freedom. Alater reexamination of QCD sum rules by F. Klingl, N. Kaiser and W. Weise[112 lead to the dis overy that the same rules an be satised by a ompletelydierent model in whi h the in medium masses are unae ted but widths greatlyin rease with density and/or temperature. The two s enarios are ommonlyreferred as `dropping mass' and `melting'.4.2 Leptoni probes of in medium ee tsThe experimental eorts to establish the presen e of in medium ee ts havefollowed three main approa hes: hadroni probes in heavy ion ollisions, leptoni probes in heavy ion ollisions and elementary on nu leus ollisions. Attentionis fo used here only on the leptoni probes as to their dete tion the HADESspe trometer is mainly devoted. The main ideas behind lepton spe tros opy an be summarized as follows:1. The parti les are studied through the de ay hannels of pseudo-ve tormesons into e+e− or µ+µ− pairs. This has a double benet as: a) on onehand the lifetimes of the pseudo-ve tor mesons are small enough to allowfor a strong inuen e of the high density stages of the re-ball, while b)di-leptons from the de ay intera t only feebly with nu lear matter, beingpossible to determine dire tly the invariant mass spe tra of their parents.Table 4.1 show the main properties of light pseudo-ve tor mesons.2. The main disadvantage is the low bran hing ratio into di-leptoni hannels(for the pseudo-ve tor mesons ∼ 10−5-10−4). Moreover, many pro esses an ontribute signi antly to the ba kground, like π0, η Dalitz de ay andγ onversions for di-ele trons, or pion and kaon de ay for di-muons.

62 CHAPTER 4. NUCLEAR PHYSICS AT HADES−−
0
100
200 T [MeV]
01
23
4ρ/ρ0
0.2
0.6
1
<qq>
Figure 4.2: Evolution of the normalized quark ondensate 〈0⋆|qq|0⋆〉/〈0|qq|0〉 as a fun tionof density and temperature, taken from [113.Meson Mass Width cτ [fm] Main hannel e+e− BR µ+µ− BR[MeV
c2 ] [MeVc2 ]
ρ 775.8 150 1.3 ππ 4.67 × 10⁻⁵ 4.55 × 10⁻⁵
ω 782.6 8.49 23.4 π+π−π0 7.14 × 10⁻⁵ 9 × 10⁻⁵
φ 1019.5 4.26 44.4 K+K− 2.98 × 10⁻⁴ 2.85 × 10⁻⁴Table 4.1: Light pseudo-ve tor mesons life times and bran hing ratios [3.4.2.1 CERESA heavy ion program has been running sin e the 90's at the CERN SPS. Thebeam energies (50-200 GeV/A) are so high that, indeed, the attention is fo usedon the sear h of a possible Quark Gluon Plasma phase. In parti ular, hadronprodu tion is highly above threshold and in medium ee ts are expe ted to playa minor role on it. However, some eviden es have been reported on possible hintsof in medium ee ts as dis ussed in the following.CERES [114, [115, [116, [117 was optimized to measure e+e− pairs in aninvariant mass range from ≃ 10 MeV to ≃ 1 GeV. A typi al spe tra in entralPb+Au ollisions at 158 GeV/A is reprodu ed in g. 4.3 after ombinatorialba kground was subtra ted. The spe trum is unfortunately missing a distin -tive feature with a lean interpretation (i.e. a ρ peak displa ed at a lower value,for example) and its understanding requires, rst, the identi ation of the on-tributions from all known usual sour es: the Dalitz de ays of the π0, η, η′ andω and the e+e− de ay of the ρ, ω and φ. For this reason a spe ial Monte-Carloprogram, alled GENESIS, has been developed over the years.Comparison between data and model is shown in g. 4.3, indi ating a learex ess in the data whi h, for the invariant mass region 0.2 GeV ≤ mee ≤ 0.6
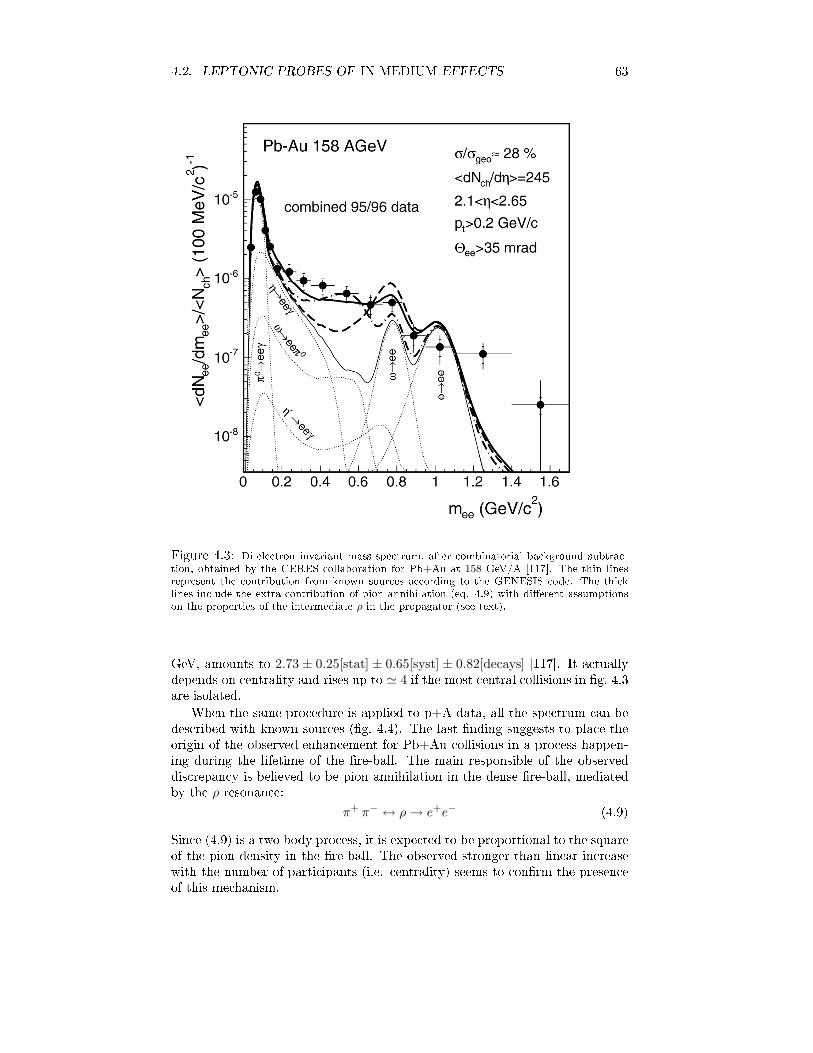
4.2. LEPTONIC PROBES OF IN MEDIUM EFFECTS 63
Figure 4.3: Di-ele tron invariant mass spe trum, after ombinatorial ba kground subtra -tion, obtained by the CERES ollaboration for Pb+Au at 158 GeV/A [117. The thin linesrepresent the ontribution from known sour es a ording to the GENESIS ode. The thi klines in lude the extra ontribution of pion annihilation (eq. 4.9) with dierent assumptionson the properties of the intermediate ρ in the propagator (see text).GeV, amounts to 2.73 ± 0.25[stat] ± 0.65[syst] ± 0.82[decays] [117. It a tuallydepends on entrality and rises up to ≃ 4 if the most entral ollisions in g. 4.3are isolated.When the same pro edure is applied to p+A data, all the spe trum an bedes ribed with known sour es (g. 4.4). The last nding suggests to pla e theorigin of the observed enhan ement for Pb+Au ollisions in a pro ess happen-ing during the lifetime of the re-ball. The main responsible of the observeddis repan y is believed to be pion annihilation in the dense re-ball, mediatedby the ρ resonan e:π+ π− ↔ ρ → e+e− (4.9)Sin e (4.9) is a two body pro ess, it is expe ted to be proportional to the squareof the pion density in the re-ball. The observed stronger than linear in reasewith the number of parti ipants (i.e. entrality) seems to onrm the presen eof this me hanism.

64 CHAPTER 4. NUCLEAR PHYSICS AT HADES
Figure 4.4: The same as g. 4.3 but for p+B and p+Au at 450 GeV/A [115.Nevertheless, all attempts to des ribe rea tion 4.9 with the va uum prop-erties of the ρ meson have failed to explain data (thi k dashed line of g. 4.3)be ause they predi t an in rease only in the region of the free ω mass. If adropping mass s enario is added for the ρ a ording to the Brown-Rho s aling,the al ulations (thi k dot-dashed line in g. 4.3) an reprodu e the data. How-ever, the data an also be explained if the ρ in medium properties are modieda ordingly to the spe tral fun tions approa h of [118 (thi k ontinuous lineof g. 4.3), and there is no expli it onne tion with the Brown-Rho s aling or hiral symmetry restoration. The two s enarios (Brown-Rho s aling, spe tralfun tions) reprodu e the lo alization of the enhan ement at intermediate mee,therefore no lear statement on in medium ee ts an be done. Remarkably,by measuring Pb+Au ollisions at 40 GeV/A with an improved setup [116, anenhan ement even larger than at 158 GeV/A was found.4.2.2 NA60Indi ations that favor one of the two s enarios for in medium ee ts have beenreported by the NA60 ollaboration [119, [120, [121, also at CERN SPS. Un-like CERES, di-muon pairs were sele ted as probes. NA60 is based on a 17 mlong muon spe trometer onstru ted for the NA35/NA50 experiments, sepa-rated from the target by a 5.5 m long hadron absorber (> 70 X0) made mostlyof Carbon. Under su h onditions, essentially only muons an survive degra-dation. The nal signal distribution after ba kground subtra tion is shown ing. 4.5.In the analysis of [121, the nal ex ess in the ρ region is isolated by sub-

4.2. LEPTONIC PROBES OF IN MEDIUM EFFECTS 65
Figure 4.5: Di-muon invariant mass spe trum measured by the NA60 ollaboration for In+In ollisions at 158 GeV/A [121. The open symbols are the data after ba kground subtra tion.The ontinuous lines represent the ontribution from known sour es ex ept the ρ. The losesymbols are the dieren e, yielding a shallow peak at the ρ mass.tra ting, in a onservative way, all known ontributions, ex ept the ρ, using thesame GENESIS generator as CERES. The evolution of the enhan ement with entrality is displayed in g. 4.6. Two main features an be observed: a) forsemi-peripheral ollisions there is almost no enhan ement as ompared with freespa e ( ontinuous line) and b) for the most entral ollisions, a strong enhan e-ment is present but ) it remains learly entered at the value of the ρ mass infree spa e. Su h fa t is therefore learly in favour of a 'melting s enario'.4.2.3 DLSAt a lower energy s ale of the order of GeV, di-ele trons from pseudo-ve tormesons oming from the re-ball were studied by the DLS ollaboration atBEVALAC in the 90's [122, [123. Whereas the invariant mass spe tra ob-tained for p+p intera tions ould be reasonably well des ribed by theoreti al al ulations negle ting in medium ee ts, a very distin t situation arose even inlight systems as C+C and Ca+Ca at 1 GeV/A. Under su h onditions neither al ulations assuming free di-ele tron de ays nor those in luding in medium ef-fe ts ould des ribe the observed spe tra. In parti ular, an enhan ement above
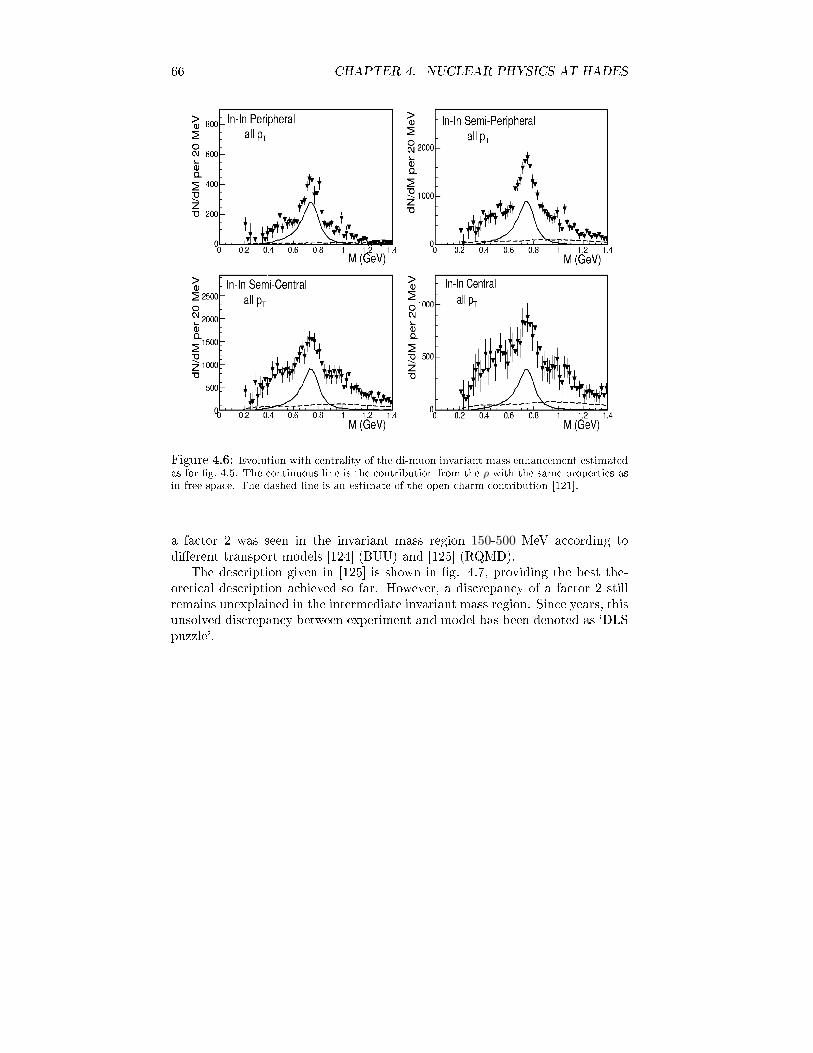
66 CHAPTER 4. NUCLEAR PHYSICS AT HADES
Figure 4.6: Evolution with entrality of the di-muon invariant mass enhan ement estimatedas for g. 4.5. The ontinuous line is the ontribution from the ρ with the same properties asin free spa e. The dashed line is an estimate of the open harm ontribution [121.a fa tor 2 was seen in the invariant mass region 150-500 MeV a ording todierent transport models [124 (BUU) and [125 (RQMD).The des ription given in [125 is shown in g. 4.7, providing the best the-oreti al des ription a hieved so far. However, a dis repan y of a fa tor 2 stillremains unexplained in the intermediate invariant mass region. Sin e years, thisunsolved dis repan y between experiment and model has been denoted as `DLSpuzzle'.

4.3. THE HADES EXPERIMENT 67
Figure 4.7: Invariant mass spe tra obtained from C+C and Ca+Ca ollisions at 1 GeV/Aby the DLS ollaboration, together with dierent theoreti al des riptions [125.4.3 The HADES experimentIn order to provide an answer to the `DLS puzzle' and to further study in mediumee ts up to Au+Au ollisions at Ekin = 1.5 GeV/A, the High A eptan eDi-Ele tron Spe trometer HADES was on eived and built at GSI, Darmstadt,Germany [95, [126. Therefore, it is a se ond generation experiment in di-leptonspe tros opy that aims at measuring the invariant mass of the light pseudo-ve tor mesons ρ, ω, φ with pre isions as good as ∆M/M = 1% (10 times betterthan DLS) and an a eptan e for e+e−pairs at the level of A = 35% (100 timesmore than DLS) [95.A high hadron reje tion apability and toleran e to high rates is mandatoryprovided that the fra tion of interesting di-lepton pairs is as small as 1 permillion [127. The te hni al spe i ations are that a primary beam intensityof I = 108 ions/s impinging over a target with a thi kness equivalent to 1%intera tion probability should be aordable by the experiment in terms of rate apability for Au+Au up to 1.5 GeV/A [95.Fig. 4.8 shows an s hemati view of the HADES spe trometer, where its hara teristi hexagonal symmetry an be appre iated.The story of an ion ollision in HADES is as follows: (1) an ion beam omesfrom the SIS18 at typi al energies Ekin ≃ 1 GeV/A and is deviated to HADES ave ( oming from the left on pi ture 4.8); (2) before and after intera ting withthe target, a oin iden e/anti- oin iden e system (start/veto) provides a signalindi ating that an intera tion took pla e; (3) the outgoing sub-produ ts rossa threshold RICH blind to hadrons; (4) high pre ision wire hambers (MDCs)tra k the parti le before the toroidal oils of the magnet; (4) after the magnet,two more tra king MDCs are present and (5) a TOF wall is devised for leptonidenti ation after the magneti eld; (6) at low polar angles a shower dete torimproves the reje tion apability of fast pions.

68 CHAPTER 4. NUCLEAR PHYSICS AT HADES
Beam
Figure 4.8: Up: 3D view of the HADES spe trometer. Down: side view, indi ating the onstituting dete tors.

4.3. THE HADES EXPERIMENT 69
Figure 4.9: GSI's a elerator.4.3.1 The SIS18 a eleratorThe a elerator system onsists in a linear a elerator (UNILAC) inje ting ionsinto a 60 meter diameter syn hrotron (SIS18), from where the beam an be ex-tra ted to the Fragment Separator (FRS), to the Ele tron Storage Rings (ESR)or to the experimental areas.The UNILAC was built in 1975 and upgraded in 1999 thanks to the devel-opment of a new high urrent inje tor, alled HSI. It provides an in rease in thebeam intensity that is able to ll the syn hrotron up to almost its spa e hargelimit for all ions (I ≃ 1011 ions for C beam and I ≃ 109 ions for Au beam).After stripping and harge state separation, the beam from the HSI is mat hedto the UNILAC, whi h a elerates the nu lei (without any signi ant parti leloss) up to a few MeV/A, feeding the SIS18.The SIS18 onsists in 24 bending magnets and 36 magneti lenses, with ava uum lower than 10−11 Torr in the beam line. The a eleration takes pla e intwo resonan e avities diametri ally opposed, rea hing kineti energies up to 2GeV/A in the ase of C beam and 1.5 GeV for Au beam. In order to rea h thehigher energies with Au beams, an ex eptional operation is required: a) highlyionized Au atoms (197Au63+) are a elerated in SIS18 up to 0.3 GeV, b) thenextra ted and fully stripped, ) inje ted into the ESR and ooled by ele tron ooling, d) nally inje ted into SIS18 and a elerated up to 1.5 GeV/A. Thelength of the y le is 25 s. However, typi al operation allows for spills of 5-10 sduration with roughly 50% of duty y le.A pi ture of the urrent SIS18 is shown in g. 4.9. There are prospe ts of an

70 CHAPTER 4. NUCLEAR PHYSICS AT HADESimminent upgrade towards the so- alled SIS100/300 within the proje t FAIR(Fa ility for Anti-proton and Ion Resear h). It will be able to ultimately rea hintensities as large as I ≃ 1012 ions/spill and energies up to 30 GeV/A for heavyions [128.4.3.2 The start and veto dete torsTwo identi al diamond dete tors are pla ed 75 m upstream (start) and down-stream (veto) the target. The system is aimed at working su h that a validsignal on start dete tor and null on veto results in a valid start signal, thatmust be delivered faster than 1 MHz4. The dete tor-ele troni s ongurationyields a time resolution as good as 29 ps being rate resistant beyond 108 ions/sper hannel for meeting the HADES requirements [129. The dete tor is on- eived to provide a veto e ien y ε > 96.5%, over an area A = 2.5 m×1.5 m(larger than the beam spot).4.3.3 The RICHThe RICH [130 is the rst dete tor found by the produ ts of the primaryintera tion, as it is lo ated surrounding the target. It is a ru ial dete torfor lepton identi ation, being totally blind to hadrons while providing a verylow multiple s attering and γ onversion probability, due to its gaseous low Zradiator, namely C4F10 (the equivalent thi kness x/Xo is at the level of 1%).The low refra tion index of the radiator gas provides a threshold for Cherenkovemission γth = 18.2, sensitive to ele trons with momenta above 10 MeV. On theother hand it is blind to pions up to energies of around Ekin ≃ 2.5 GeV, whi his by far above the maximum kineti energies available at SIS18. Therefore thehadron blindness is ensured.The Cherenkov radiation is very softly attenuated by absorption within anUV window orresponding to 145 < λ < 190 nm. The traversing UV photons areree ted on a spheri al arbon ber mirror (2 mm thi k) to the ba k part of thesystem where they are dete ted. For this last step, the radiation gas is separatedthrough a CaF2 window from a multi-wire proportional hamber operated inpure CH4. It has a pi k-up pad stru ture pla ed behind a photosensitive CsIlayer for enhan ing the probability of photon dete tion. A typi al ring-likepattern is at that point registered. For on-line trigger purposes (see se tion4.3.7), the full event pattern information of 28272 pads must be transferredwithin 10 µs (100 kHz), allowing for ring identi ation apabilities at the levelof 90%.Fig. 4.10 shows a pi ture of the RICH dete tor.4.3.4 The MDCs and the magnetThe Multi-wire Drift Chambers (MDCs) [129 are in total 2 × 2 × 6 hambers,namely, two groups of two MDCs (before and after the magnet), 6 se tors,designed to provide tra k re onstru tion before and after the magneti eld withspa e resolutions below 140 µm [131. This extremely high position resolution4Resulting from around 1% primary intera tions at the maximum SIS18 intensity.
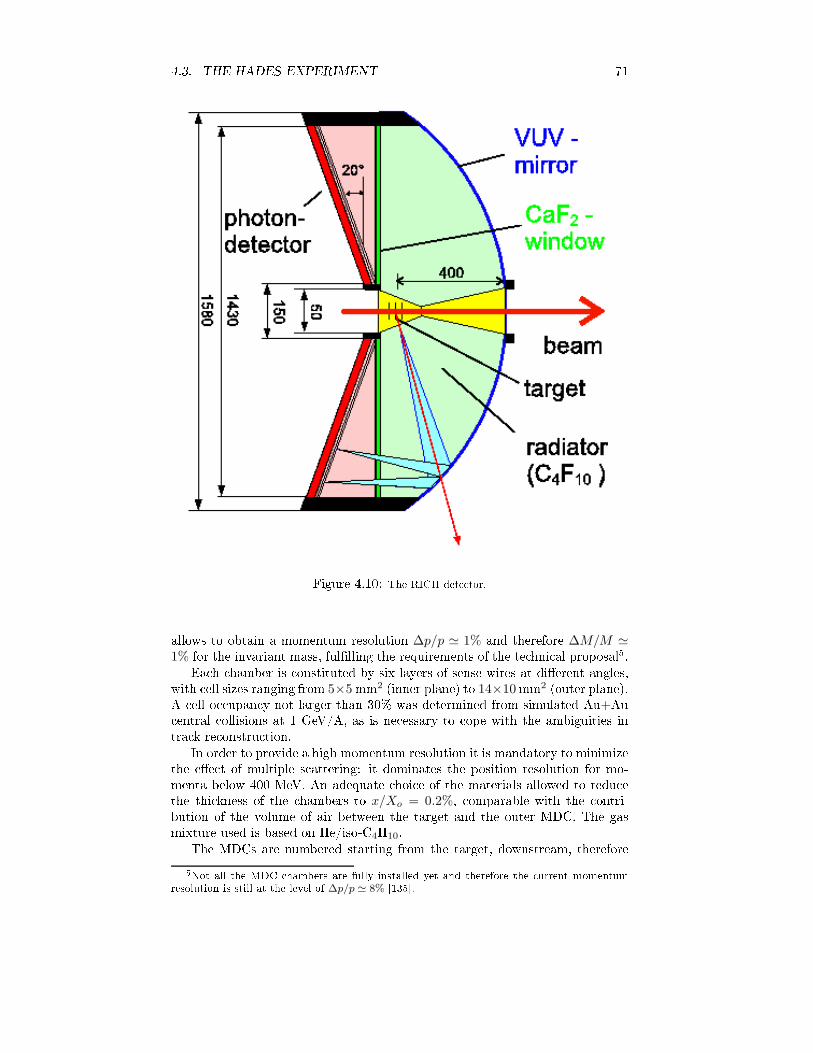
4.3. THE HADES EXPERIMENT 71
Figure 4.10: The RICH dete tor.allows to obtain a momentum resolution ∆p/p ≃ 1% and therefore ∆M/M ≃1% for the invariant mass, fullling the requirements of the te hni al proposal5.Ea h hamber is onstituted by six layers of sense wires at dierent angles,with ell sizes ranging from 5×5 mm2 (inner plane) to 14×10mm2 (outer plane).A ell o upan y not larger than 30% was determined from simulated Au+Au entral ollisions at 1 GeV/A, as is ne essary to ope with the ambiguities intra k re onstru tion.In order to provide a high momentum resolution it is mandatory to minimizethe ee t of multiple s attering: it dominates the position resolution for mo-menta below 400 MeV. An adequate hoi e of the materials allowed to redu ethe thi kness of the hambers to x/Xo = 0.2%, omparable with the ontri-bution of the volume of air between the target and the outer MDC. The gasmixture used is based on He/iso-C4H10.The MDCs are numbered starting from the target, downstream, therefore5Not all the MDC hambers are fully installed yet and therefore the urrent momentumresolution is still at the level of ∆p/p ≃ 8% [135.

72 CHAPTER 4. NUCLEAR PHYSICS AT HADESI and II are the inner ones (before the magneti eld) and III and IV standfor the outer ones. In between, a super ondu ting magnet onsisting of 6 oils,produ es an inhomogeneous magneti eld whi h rea hes a maximum value ofB ≃ 3 T near the oils, down to B ≃ 1.5 T in the a eptan e region.The eld is mostly onned to the region between the two groups of MDC hambers, whose frames are pla ed in the region orresponding to the shadowof the magnet oils (see g. 4.8).4.3.5 The TOF wallTOF and TOFino are time of ight dete tors aimed at providing a high res-olution timing for separation of leptons from fast pions, and are required forimplementing the multipli ity ondition to sele t dierent entralities of theprimary ollisions.
Figure 4.11: The TOF wall.The TOF dete tor is made out of plasti s intillator rods (BC408) read atboth ends by EMI 9133B photo-multipliers. Therefore, an unbiased estimate ofthe time of ight and impa t position an be obtained, yielding σT≃ 100-150 psand σx ≃ 1.5-2.3 m. The pad prole is a 2.0 × 2.0 m2 re tangle for the innerfour sets and 3.0 × 3.0 m2 for those at larger polar angle. They are groupedin sets of eight, with eight su h sets per se tor, overing the laboratory polarangles 45 < θlab < 85. A photo of the TOF wall is shown in g. 4.11.At polar angles below 45 the TOFino dete tor is temporary pla ed in order

4.3. THE HADES EXPERIMENT 73to fulll the minimum requirements that allow to explore light environments upto Ca+Ca, providing a reasonable multipli ity trigger still. TOFino is onsti-tuted by four s intillator rods with single read-out and time resolution σT≃ 350ps [132 after orre ting for the position of the intera tion (see g. 4.12).As said, in order to ope with the high multipli ities present in typi alAu+Au ollisions at 1.5 GeV/A, the TOFino will be repla ed by a tRPC wallwith a granularity 80 times larger and time resolutions well below 100 ps, beingthis the entral subje t of the present work.4.3.6 The shower dete torA ording to [132, fast pions will emulate di-leptons (fake) by an amount of2-3 per event in Au+Au ollisions at Ekin = 1 GeV/A, for a time resolutionof σ
T= 100 ps. The ee t is redu ed for the large polar angle region, whereless than 1 fake per event is expe ted. Be ause of this fa t, it was de ided topla e an ele tromagneti shower dete tor behind the TOFino wall, in order toin rease hadron reje tion.
Figure 4.12: The shower dete tor and the TOFino [133.Ea h se tor of the shower dete tor is onstituted by three sensitive planesof wire hambers with signal pi k-up in pads of squared shapes, ranging inheights from 3 to 4.5 m. The sizes ensure an o upan y below 5% for Au+Au ollisions [133. Between the a tive layers, two lead onverters of thi kness 2Xoea h are interposed, aiming at indu ing an ele tromagneti shower with a highprobability, but still keeping the probability of hadroni intera tion at low levels.The interposition of lead onverters denes naturally the so- alled Pre-shower,Post-shower1 and Post-shower2 sub-dete tors. Chambers are operated in SelfQuen hing Streamer mode.The pads of the three modules are proje ted towards the target, resultingin a one-to-one orresponden e between pads in a parti ular row and olumn inall three dete tors. A `shower ondition' an be dened through the ratio of the
74 CHAPTER 4. NUCLEAR PHYSICS AT HADES harge olle ted in ea h of the two Post-shower dete tors to the one olle ted inthe Pre-shower, allowing to identify leptons.A pi ture ontaining the shower dete tor layout, together with the TOFino,is shown in g. 4.12.4.3.7 The trigger s hemeFor primary intensities of I ∼ 108 ions/s impinging over a 1% intera tion prob-ability target, 106 primary ollisions per se ond must be handled. As said, thebran hing ratio for the di-ele tron de ay of light pseudo-ve tor mesons is of theorder of 10−4, therefore most of the events are of no interest for di-ele tronspe tros opy. Moreover, pro essing all the event information orresponding tosu h a large number of primary ollisions is impossible in pra ti e. In order toenhan e the `interesting' events and redu e the olle ted data to a manageableset, a strategy based on 2 trigger levels is a omplished:1. The rst level trigger (LVL1) is given by a valid signal in the start/vetodete tor together with a multipli ity ondition in the TOF+TOFino walls.It is expe ted from simulation that, in Au+Au ollisions, this multipli -ity/ entrality ondition leads to a sele tion of only 10% of the total numberof ollisions, redu ing the rate of andidate events to 100 kHz.2. The se ond level trigger (LVL2) performs a sele tion of lepton andidatesby looking at any ring in the RICH that an be mat hed in an angularwindow with a hit in the system TOF+shower dete tor. A onservativewindow in time of ight is sele ted and a shower riteria applied [134.After the mat hing, the bending in the magneti eld an be estimatedfrom the position information of the RICH and the shower dete tor, al-lowing for a ut in parti le momentum; nally, ele trons and positrons are ombined. This task is performed in the Mat hing Unit (MU). For notlosing events, the LVL2 de ision must be taken in less than 10 µs, allowingfor a redu tion in the andidate tra ks up to a fa tor 100, and yieldingan event ow of 100 kHz. Re ent results on C+C at 2 GeV/A with a onservative mat hing window, indi ate a redu tion of a fa tor 12, with92% ba kground reje tion and e ien y above 70%.4.3.8 O-line analysisOwing to its hadron blindness, the RICH is the key dete tor for lepton identi- ation. Whenever it provides a ring, it is mat hed with a re onstru ted tra kfrom the inner MDC planes within a ertain angular window. Later on, anddue to the absen e of the outer drift hambers in the physi s runs orrespondingto the data analyzed so far, the position at TOF and Pre-shower is mat hedwith a valid tra k. Finally, the shower ondition is applied, plus an extra utin time-of-ight. An illustrative example of this pro edure, taken from [135, isshown in g. 4.13.The extreme apability of hadron reje tion is apparent, being the averagemultipli ity of the lepton tra ks as low as 2 × 10⁻² per LVL1 event.

4.3. THE HADES EXPERIMENT 75
Figure 4.13: Left: β vs p distribution for all the re onstru ted parti les (LVL1). Right: thesame plot after imposing all the uts for reje ting hadrons. The last ut, namely, a ut in thetime of ight of the parti les, is graphi ally shown.
Figure 4.14: Left: ontributions of the ba kground and the signal to the invariant massspe tra. Right: invariant mass spe tra of di-leptons and omparison with simulation [135.4.3.9 The ba kground reje tionOn e lepton identi ation has been a omplished, the next step onsists in mak-ing an adequate ombination of e+e− andidates. However, a large fra tion ofthe reated e+e− pairs omes from γ onversion in the target and the RICHradiator but also πo de ays. Su h pairs an be identied, in prin iple, be ausetheir relative angle of emission is very small. However, very often one of theleptons of a lose pair is strongly bended by the magneti eld, leaving his om-panion free for randomly ombine with other leptons, reating 'fake' pairs. `Thereje tion of this ombinatorial ba kground is one of the most di ult problemsin di-ele tron spe tros opy' [127, being required to devise adequate algorithmsfor redu ing their ontribution. The remaining fakes ontribute to the invariantmass spe tra as ba kground, that is estimated from the spe tra of like-sign pairs

76 CHAPTER 4. NUCLEAR PHYSICS AT HADESand also using the event mixing te hnique, being subtra ted afterwards.The rst distribution of e+e− invariant mass obtained in HADES for C+C ollisions at 2 GeV, not orre ted by a eptan e and e ien y, is shown in g.4.14 after the lose pair reje tion algorithm is performed and the ba kground issubtra ted as mentioned above. The signal-to-ba kground ratio is on average4:1 for Minv < 100 MeV/ 2 and 1:2 for higher masses. Latest results an befound in [136.

Chapter 5The HADES tRPC wall5.1 Introdu tion5.1.1 Coordinate system and notationThe following lines are devoted to introdu e the notation that will be thoroughlyused within the present hapter. For that, in g. 5.1 a lateral prole of one ofthe six HADES se tors is shown, with attention fo used on the dete tors lose tothe foreseen tRPC wall, namely: a) the outer drift hamber (MDC IV), b) thelarge angle s intillator TOF wall and ) the three planes of the shower dete tor.The values 12 and 45 have been extra ted from the geometry implemented inthe HADES simulation pa kage1.Two referen e systems an be distinguished:1. The `laboratory' referen e system. Its origin is pla ed at the nominaltarget position (vertex), with Z dened along the beam axis, being positivein the downstream dire tion, and Y dened perpendi ular to the oor,upwards. The variables referred to that system will be denoted in apitalletters and labeled with `lab'. The HADES geometri a eptan e in thisreferen e system an be expressed in spheri al oordinates as:18 < θlab < 85 (5.1)together with roughly 360 overage on the azimuthal oordinate, groupedin six se tors: 30 < φlab < 90, 90 < φlab < 150, ... , −30 < φlab <
30 (1, 2, ..., 6).2. The `lo al' tRPC referen e system. For designing purposes, it is veryuseful to speak about lo al oordinates, that will be denoted in lower ase, without label, in the following. Taking, for simpli ity, the se tor 1(30 < φlab < 90), the origin of the lo al referen e system an be denedby the interse tion of three planes: a) the Ylab-Zlab plane (y-z plane), b)a plane parallel to the larger fa e of the shower dete tor, pla ed at thetRPC position (x-y plane), and ) the plane perpendi ular to the y-z andx-y planes that ontains the vertex (x-z plane); the z axis is dened to be1In parti ular, they were obtained from the limits of the a tive volume of the TOFino wallthat is pla ed temporary at the tRPC position.77

78 CHAPTER 5. THE HADES TRPC WALL
Figure 5.1: Referen e system and onventions used in this hapter.positive in the region tRPC downstream and y is positive in the dire tionof in reasing θlab.The origins of the two referen e systems are represented by ir les in g. 5.1.It is shown in the following that the tRPC wall must over, indeed, polarangles θlab from 12 to 45 in order to meet HADES geometri a eptan e.The small angle 12 (see eq. 5.1) arises from the ne essity to measure positive harged tra ks that are bent towards low θlab.It is very useful to dene the angle proje ted over the y-z plane. This isdened for any tra k as the angle between the z axis and the proje tion of thetra k over the y-z plane. It is denoted by ξ and an be expressed in spheri al oordinates as:tan ξ = tan θ sin φ (5.2)
ξ ≃ θ sin φ (5.3)and an analogous denition for the ase of ξlab.

5.1. INTRODUCTION 795.1.2 Spe i ations of the TOF wallThe pro ess of optimization of a large dete tor an be dened as a multi-variableproblem that provides a feasible ompromise between physi s requirements anddete tor performan es. Some of the impli ations of this observation must benoted:1. Several designs and even te hnologies may fulll the same physi s require-ments, providing dierent hoi es for optimization.2. Optimization an evolve in time owing to any hange in the physi s re-quirements or in the dete tor performan es.3. The key word in any realisti design is feasibility. An optimum solutionmust be, impli itly, feasible.For understanding the pro ess of optimization followed in this work, it must bere alled that the physi s requirements were dis ussed elsewhere, along earlierstudies about the feasibility of the HADES spe trometer itself [95, [132, [139,but also more re ent dis ussions will be expli itly mentioned when ne essary.Su h physi s requirements will not be revisited in this work, but simply ompiledwithin the following paragraphs.The design of the HADES-TOF wall at low angles must be optimized forhandling the highest rates and multipli ities foreseen at the HADES spe trom-eter, for the maximum energies available at SIS182. On one hand, this meansthat the wall must be operational for Au beam intensities up to I = 108 ions/simpinging over a Au target with 1% intera tion probability, a ording to thete hni al proposal [95 (a requirement that was later relaxed down to I = 2 107ions/s, be ause of te hni al reasons [140). On the other hand, the dete tor musthave enough granularity to ope with the highest multipli ities foreseen ( entralAu+Au ollisions3 with a kineti energy Ekin = 1.5 GeV/A 4). Te hni al spe -i ations [95 suggest an o upan y per ell at the level of 20%, but later on itwas advi ed to go below 10% for lepton dete tion [141. Requirements on ern-ing granularity and rate apability are ompletely dierent in essen e: while therst one an be always virtually met by in reasing the total number of ells,the se ond one must be provided by the TOF te hnology used: for glass timingRPCs, rates higher than 500 Hz/ m2 in long spills are hardly rea hable withouta sizable degradation of the performan es, and more ells will not improve thesituation.Other `important' requirements that the TOF wall must fulll are:1. High time resolution (σT≃ 100 ps) for separating e+e− pairs from fastpions [132, [139.2. Robust multi-hit apabilities.3. High geometri a eptan e, lose to 100%.2The performan es at higher energies, as expe ted in SIS100, are briey dis ussed at theend of the hapter.3`Central' is dened in the following by the ondition b < 4 fm for Au+Au ollisions, orresponding to the 5-10% of more entral events.41.5 GeV/A is the larger energy attainable for heavy systems at SIS18, 2 GeV/A an bea hieved in lighter systems due to the larger Z/A ratio.

80 CHAPTER 5. THE HADES TRPC WALL4. High intrinsi e ien y, lose to 100%.5. Highly unbiased multipli ity estimate for entrality sele tion on the pri-mary ollisions.6. It must not ae t the dete tors pla ed tRPC downstream.7. It must t to the available spa e.8. It must be equipped with fast, low noise, ompa t and robust FEE foroperating a large number of hannels under stable onditions (the statusof the ele troni s an be found elsewhere [87).At last, other `interesting' features of the TOF wall would be:1. Low ross-talk.2. Easy abling.3. Possibility of providing iso hroni ity of the tRPC ells through inter- omparisons between them.4. Possibility of providing iso hroni ity of the tRPC ells through inter- omparisons with other high resolution timing dete tors (Start dete torand/or TOF wall at large angles).5. Moderate tails towards delayed times.The results on erning the estimate on the timing required for lepton iden-ti ation an be found in [95, [132, [139. There, a value for σT
= 100 ps isderived, based on studies with Au+Au entral ollisions. For the sake of onsis-ten y, some basi gures about parti le identi ation apabilities based on tofwill be provided: the time of ight of a parti le traveling along a distan e L isrelated to its momentum through:t =
E
pcL =
L
c
√
1 +
(
mc
p
)2 (5.4)When measured over the same distan e L, the tof of two parti les (1, 2) withmasses m1 and m2 will dier by an amount δt, a ording to:δt =
L
c
√
1 +
(
m1c
p
)2
−
√
1 +
(
m2c
p
)2
(5.5)Let's assume that the tof measurement is performed by a dete tor with a Gaus-sian time response of width σT: the degree of admixture k = δt/σ
T an betherefore dened. It is shown in g. 5.2 that, as long as k & 2, it is possible toresolve the ontributions of both peaks. If, for illustration, the riteria for be-longing to ea h respe tive population is dened at the interse tion between bothdistributions, the dete tion e ien y and degree of admixture an be obtained:
k = 2 e = 84% admixture = 16% (5.6)k = 4 e = 97.5% admixture = 2.5% (5.7)
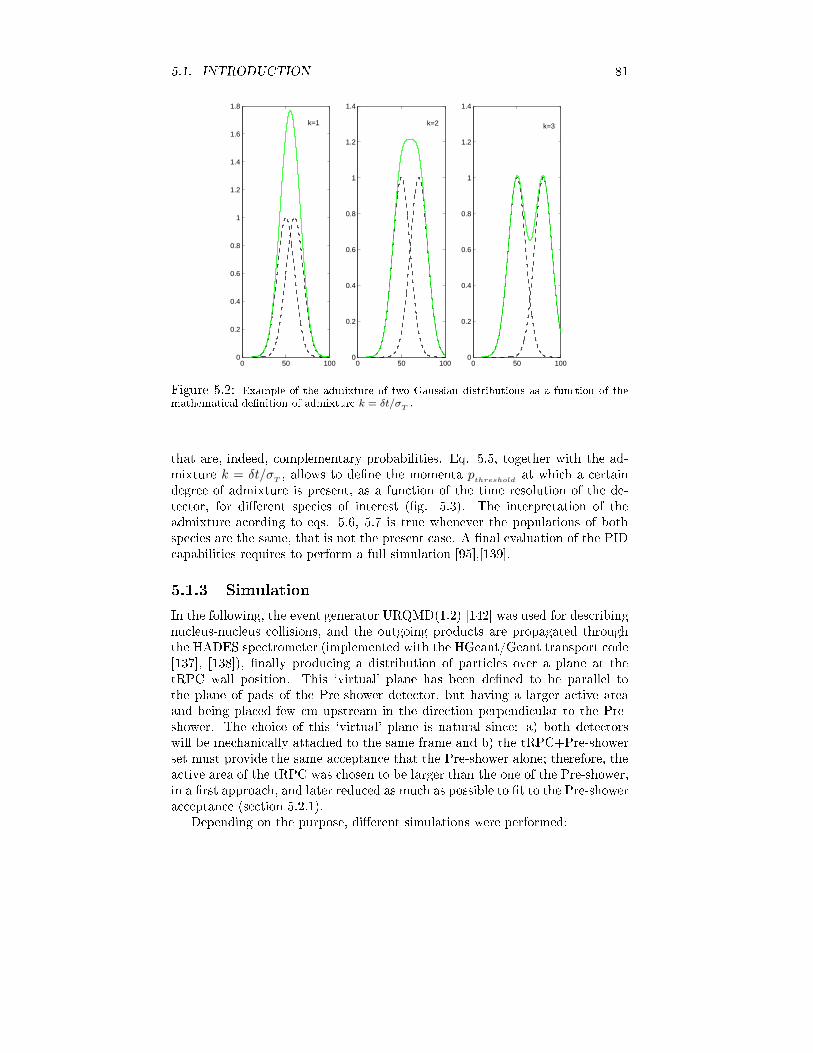
5.1. INTRODUCTION 81
0 50 1000
0.2
0.4
0.6
0.8
1
1.2
1.4
1.6
1.8
0 50 1000
0.2
0.4
0.6
0.8
1
1.2
1.4
0 50 1000
0.2
0.4
0.6
0.8
1
1.2
1.4
k=1 k=2 k=3
Figure 5.2: Example of the admixture of two Gaussian distributions as a fun tion of themathemati al denition of admixture k = δt/σT.that are, indeed, omplementary probabilities. Eq. 5.5, together with the ad-mixture k = δt/σ
T, allows to dene the momenta p
thresholdat whi h a ertaindegree of admixture is present, as a fun tion of the time resolution of the de-te tor, for dierent spe ies of interest (g. 5.3). The interpretation of theadmixture a ording to eqs. 5.6, 5.7 is true whenever the populations of bothspe ies are the same, that is not the present ase. A nal evaluation of the PID apabilities requires to perform a full simulation [95,[139.5.1.3 SimulationIn the following, the event generator URQMD(1.2) [142 was used for des ribingnu leus-nu leus ollisions, and the outgoing produ ts are propagated throughthe HADES spe trometer (implemented with the HGeant/Geant transport ode[137, [138), nally produ ing a distribution of parti les over a plane at thetRPC wall position. This `virtual' plane has been dened to be parallel tothe plane of pads of the Pre-shower dete tor, but having a larger a tive areaand being pla ed few m upstream in the dire tion perpendi ular to the Pre-shower. The hoi e of this `virtual' plane is natural sin e: a) both dete torswill be me hani ally atta hed to the same frame and b) the tRPC+Pre-showerset must provide the same a eptan e that the Pre-shower alone; therefore, thea tive area of the tRPC was hosen to be larger than the one of the Pre-shower,in a rst approa h, and later redu ed as mu h as possible to t to the Pre-showera eptan e (se tion 5.2.1).Depending on the purpose, dierent simulations were performed:
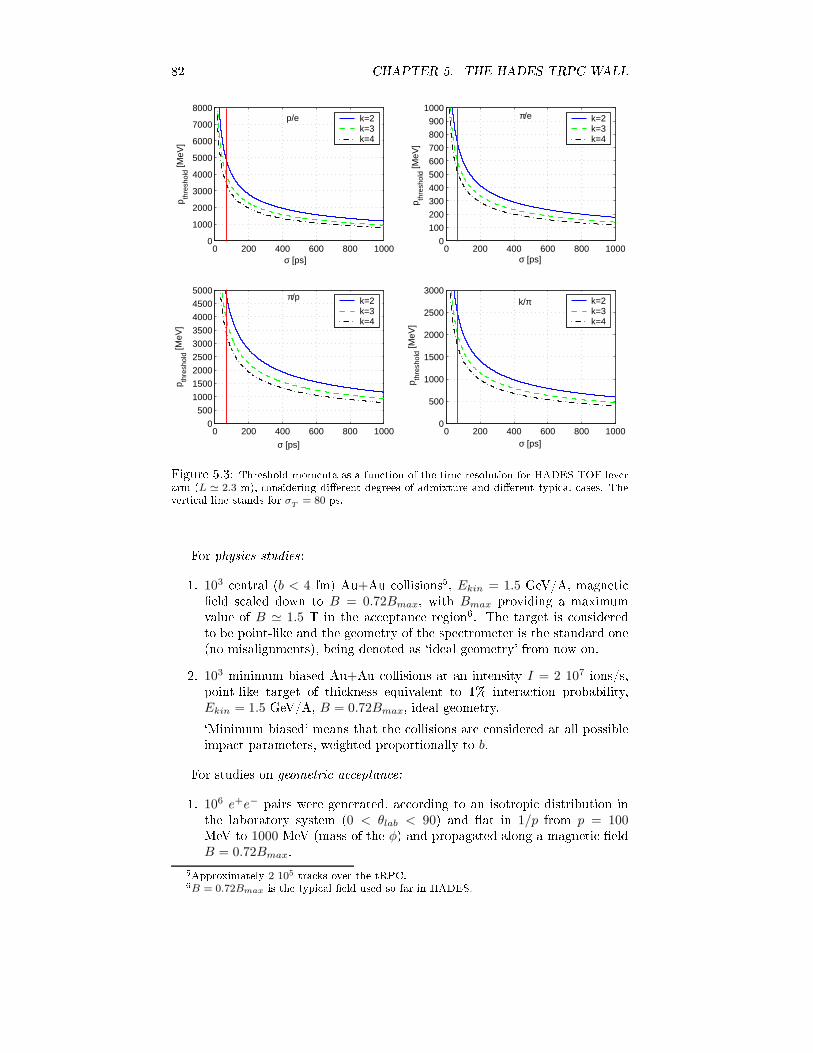
82 CHAPTER 5. THE HADES TRPC WALL0 200 400 600 800 1000
0
1000
2000
3000
4000
5000
6000
7000
8000
σ [ps]
p thre
shol
d [MeV
]
p/e k=2k=3k=4
0 200 400 600 800 10000
100
200
300
400
500
600
700
800
900
1000
σ [ps]
p thre
shol
d [MeV
]
π/e k=2k=3k=4
0 200 400 600 800 10000
500
1000
1500
2000
2500
3000
3500
4000
4500
5000
σ [ps]
p thre
shol
d [MeV
]
π/p k=2k=3k=4
0 200 400 600 800 10000
500
1000
1500
2000
2500
3000
σ [ps]
p thre
shol
d [MeV
]
k/π k=2k=3k=4
Figure 5.3: Threshold momenta as a fun tion of the time resolution for HADES-TOF leverarm (L ≃ 2.3 m), onsidering dierent degrees of admixture and dierent typi al ases. Theverti al line stands for σT
= 80 ps.For physi s studies :1. 103 entral (b < 4 fm) Au+Au ollisions5, Ekin = 1.5 GeV/A, magneti eld s aled down to B = 0.72Bmax, with Bmax providing a maximumvalue of B ≃ 1.5 T in the a eptan e region6. The target is onsideredto be point-like and the geometry of the spe trometer is the standard one(no misalignments), being denoted as `ideal geometry' from now on.2. 103 minimum biased Au+Au ollisions at an intensity I = 2 107 ions/s,point-like target of thi kness equivalent to 1% intera tion probability,Ekin = 1.5 GeV/A, B = 0.72Bmax, ideal geometry.`Minimum biased' means that the ollisions are onsidered at all possibleimpa t parameters, weighted proportionally to b.For studies on geometri a eptan e:1. 106 e+e− pairs were generated, a ording to an isotropi distribution inthe laboratory system (0 < θlab < 90) and at in 1/p from p = 100MeV to 1000 MeV (mass of the φ) and propagated along a magneti eldB = 0.72Bmax.5Approximately 2 105 tra ks over the tRPC.6B = 0.72Bmax is the typi al eld used so far in HADES.
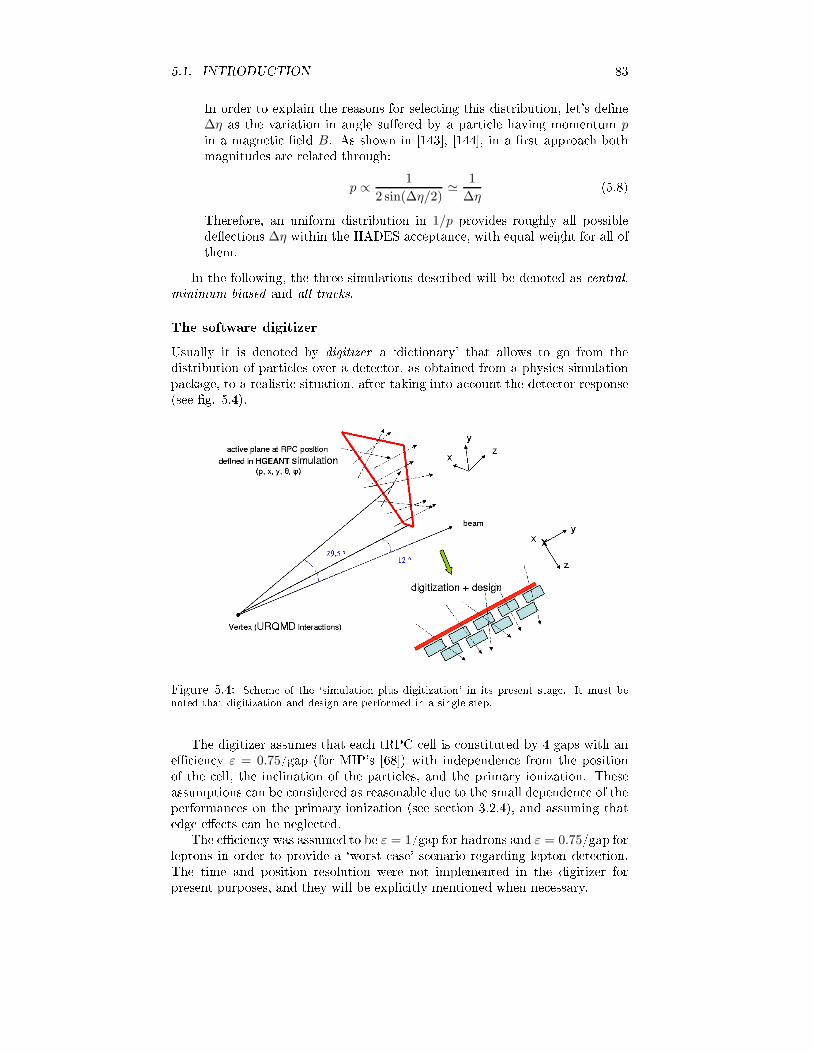
5.1. INTRODUCTION 83In order to explain the reasons for sele ting this distribution, let's dene∆η as the variation in angle suered by a parti le having momentum pin a magneti eld B. As shown in [143, [144, in a rst approa h bothmagnitudes are related through:
p ∝ 1
2 sin(∆η/2)≃ 1
∆η(5.8)Therefore, an uniform distribution in 1/p provides roughly all possibledee tions ∆η within the HADES a eptan e, with equal weight for all ofthem.In the following, the three simulations des ribed will be denoted as entral,minimum biased and all tra ks.The software digitizerUsually it is denoted by digitizer a `di tionary' that allows to go from thedistribution of parti les over a dete tor, as obtained from a physi s simulationpa kage, to a realisti situation, after taking into a ount the dete tor response(see g. 5.4).
Figure 5.4: S heme of the `simulation plus digitization' in its present stage. It must benoted that digitization and design are performed in a single step.The digitizer assumes that ea h tRPC ell is onstituted by 4 gaps with ane ien y ε = 0.75/gap (for MIP's [68) with independen e from the positionof the ell, the in lination of the parti les, and the primary ionization. Theseassumptions an be onsidered as reasonable due to the small dependen e of theperforman es on the primary ionization (see se tion 3.2.4), and assuming thatedge ee ts an be negle ted.The e ien y was assumed to be ε = 1/gap for hadrons and ε = 0.75/gap forleptons in order to provide a `worst ase' s enario regarding lepton dete tion.The time and position resolution were not implemented in the digitizer forpresent purposes, and they will be expli itly mentioned when ne essary.

84 CHAPTER 5. THE HADES TRPC WALL5.2 Chara teristi s of the tRPC wall5.2.1 Determination of the tRPC wall a eptan eThe geometri a eptan e of the HADES spe trometer at the tRPC position hasbeen dened by generating all possible tra ks over it, as des ribed in previousse tion, imposing the ondition that su h tra ks provide a valid hit in all theMDCs7 and the Pre-shower (ideal MDC and Pre-shower response is thereforeassumed).The distribution obtained over the tRPC is shown in g. 5.5. As said, thetRPC area has been hosen in simulation to be larger than the a tive area ofthe Pre-shower dete tor. In the left side of g. 5.5, the distribution of all tra ksover the tRPC an be seen, while, in the right side, the same distribution isshown after imposing the ondition of having a valid hit in the 4 MDC planesand the Pre-shower, therefore dening the limits of the geometri a eptan e atthe tRPC position.10
-1
1
10
-80 -60 -40 -20 0 20 40 60 80-80
-60
-40
-20
0
20
40
60
80counts
x [cm]
y [c
m]
active region in simulation
RPC 10-1
1
10
-80 -60 -40 -20 0 20 40 60 80-80
-60
-40
-20
0
20
40
60
80active region in simulation acceptance counts
x [cm]
y [c
m]
RPC+MDCs+ShowerFigure 5.5: Left: gure showing the area illuminated for a eptan e estimates under aprimary distribution that ontains all the possible tra ks within the spe trometer. Right:the same distribution as in left but requiring a valid hit in all the drift hambers and thePre-shower, providing an estimate of the a eptan e at the tRPC position (thi k line).In order to a ount for possible, unavoidable, displa ements of the HADESdete tors, it may be required to adopt the onservative assumption of overingan area larger than the true tRPC a eptan e. For evaluating su h possibil-ity, the HADES geometry obtained from the November 2002 beam time afteralignment of the dete tors8, was implemented in simulation and the a eptan eobtained is shown in g. 5.6 (left) together with the estimate for the ase of idealgeometry. The only ee t of su h misalignments seems to be related, indeed, toa small de rease of the geometri a eptan e at the tRPC position: thereforethe ideal geometry provides a onservative upper limit to the a eptan e.Fig. 5.6 also shows (lines) the a eptan e estimated from Au+Au entral ollisions at 1.5 GeV/A, dening essentially the same a eptan e that g. 5.5.In parti ular, the distribution of all tra ks has lost the azimuthal symmetry.This ee t an be explained by a sizable magneti ki k over the azimuthal anglethat bends the low p tra ks towards the middle of the se tor. The depletion atlow polar angles θlab in the ase of the Au+Au distribution is reated by the7This is done by requiring a hit in ea h of the 6 wire planes of the 4 MDC hambers.8Software alignment.

5.2. CHARACTERISTICS OF THE TRPC WALL 8510
-1
1
10
-80 -60 -40 -20 0 20 40 60 80-80
-60
-40
-20
0
20
40
60
80
x [cm]
y [c
m]
counts
HADES geometry taken from November 2002 experiment
(all tracks)
1
10
102
-80 -60 -40 -20 0 20 40 60 80-80
-60
-40
-20
0
20
40
60
80
x [cm]
y [c
m]
counts
ideal geometry
(AuAu, central collisions)Figure 5.6: Left: distribution of all tra ks over the tRPC plane for the HADES geome-try present in the November 2002 experiment. Also shown (lines) the geometri a eptan eestimated for the ideal geometry (statisti s are a fa tor 3 smaller than in g. 5.5). Right: dis-tribution orresponding to Au+Au entral ollisions after imposing the ondition of valid hitin MDCs+Pre-shower. The distribution obtained lays in the a eptan e (lines), as expe ted.presen e of the MDC frames.The dimensions of the HADES geometri a eptan e obtained from g. 5.5are shown in g. 5.7, together with its position in the `laboratory' referen esystem. For design purposes, the following onvention is adopted: the geometri a eptan e is dened at the plane of the foreseen last gap of the tRPC in thedownstream dire tion.
Figure 5.7: HADES a eptan e at the tRPC in the laboratory referen e system.There is a natural question on how to distribute the ells over the tRPCa eptan e. The overage an be a omplished, for example, with a) verti alor b) horizontal strips, or ) squared ells, d) having dierent orientations with

86 CHAPTER 5. THE HADES TRPC WALLrespe t to the impinging parti les, pla ed on e) one or f) several layers. Here,using the knowledge a umulated in previous studies [139 and [145, an ap-proa h based on an array of long ells extended along the x dire tion will befollowed. The benets are, among others, a high homogeneity of the distributionof parti les over the ell, due to the approximate azimuthal symmetry, and thepossibility of pla ing the FEE (Front End Ele troni s) under the shadow of themagnet oils (the region lose to the slanting sides of the trapezium that denesthe a eptan e).Having this in mind, the distributions of interest over the tRPC, regardingo upan ies and primary rates, will be expressed as a fun tion of the y oordi-nate, after integrating (or averaging) over the x oordinate. As mentioned, theexpe ted large homogeneity of the distributions of parti les as a fun tion of xjusties the approa h.5.2.2 Rate of parti lesThe primary intensity onsidered is I = 2 107 ions/s, orresponding to the max-imum value expe ted in HADES for a heavy ion environment. The intera tionprobability in the target is set to 1% a ording to HADES proposal [95 andprimary minimum biased Au+Au ollisions at 1.5 GeV/A are transported. Therate expe ted at the tRPC wall as a fun tion of y (averaged over x) is shown ing. 5.8.
Figure 5.8: Rate over the tRPC wall for the most unfavorable environment expe ted inHADES: minimum biased Au+Au ollisions, Ekin = 1.5 GeV/A, I = 2 107 ions/s, Pint=1%,B =0.72 Bmax. A maximum value Φ = 700 Hz/ m2 is rea hed at the lower polar angles.It an be observed that the distribution is peaked towards low values of y(low polar angles θlab) due to the Lorentz boost. The strong dependen e of the
5.2. CHARACTERISTICS OF THE TRPC WALL 87rate with y9, suggests that dierent kind of tRPCs ould be used within thesame experiment [98, for the overage of dierent polar angles.A ording to previous works on glass timing RPCs (for instan e [47, [147)and hapter 6, the expe ted maximum rate (Φ ≃ 700 Hz/ m2) is already at thelimit where glass timing RPCs an oer good performan es. The impli ationsof su h a worsening are quantitatively dis ussed in the next se tions.Frequen y of parti lesBesides the rate limitation, that has to do with the a umulation of harge overthe resistive plates (see se tion 3.2.7), working at high rates also results in anin reased probability of piling-up of the tRPC signals. For an estimate of theee t, it must be re alled that the tRPC signal extends in time up to around∆Tsignal ∼ 1 µs, mainly due to the ion tail. Therefore, if the frequen y of hitsover the tRPC ell is higher than 1/∆Tsignal ∼ 1 MHz, the pile-up be omessizable, resulting in a worsening of the timing performan es. For the highestrates expe ted at low polar angles (Φ = 700 Hz/ m2) and the typi al ell sizesforeseen for that region (around 15× 2 m2) 10, the frequen y of hits is kept aslow as 0.020 MHz, that guarantees a safe operation with pile-up at the level of2%. In ase of higher frequen ies of hits, the possibility of ltering out the iontail should be onsidered.5.2.3 O upan yThe average number of tra ks over the tRPC a eptan e per primary intera tionper unit length (namely, the o upan y density) along the y dire tion is shownin g. 5.9. It has been obtained for the highest multipli ity s enario expe ted inHADES under urrent SIS18: entral Au+Au ollisions at Ekin = 1.5 GeV/A,yielding N = 30 × 6 harged parti les over the tRPC wall.A ording to g. 5.9, HADES requirements of 10-20% o upan y per ell an be fullled, at low y, by strips having widths in the range 3-6 mm. Asimilar approa h has been followed by FOPI experiment, where the pi k-upele trodes are segmented by long strips of 3.44 mm pit h; however, the large luster sizes observed require dedi ated multi-hit studies [148. The luster sizes an be redu ed virtually to one by working with ele tri ally isolated tRPC ells,but the feasibility of produ ing long ells with sub- m widths is me hani allyquestionable.So, it was de ided to keep the ell width at the m s ale, and the requiredo upan y levels an be met by an additional segmentation of the se tor insmall sub-se tors or petals (in g. 5.10 dierent possibilities are illustrated).Moreover, the advantages of a moderate segmentation (therefore wider ells),are onsiderable, as shown in se tions 5.2.4 and 5.3.2.Ea h segmentation produ es an ine ient region due to the separation be-tween the tRPC petals, that redu es the geometri a eptan e; therefore a largenumber of petals is not advisable. On the other hand, by symmetry, an even-fold segmentation pla es an ine ient region at the middle of the se tor, azone where a fra tion of the low momentum parti les is strongly fo used at the9A fa tor ×10 redu tion is observed from the lower value of y (θlab ∼ 12) to its maximumvalue (θlab ∼ 45).10See next se tions.

88 CHAPTER 5. THE HADES TRPC WALL
Figure 5.9: O upan y density on the tRPC wall (full line) for the highest multipli ityenvironment expe ted in HADES: entral Au+Au ollisions (b < 4 fm), Ekin = 1.5 GeV/A.The ontributions of protons (dashed), pions (dotted) and others (dash-dotted) are shown,being the latter dominated mainly by ele trons. The redu tion of the number of protons atlow y is aused by the MDC frames.
Figure 5.10: Natural segmentations in 1-4 petals, that keep onstant the area of the elland provide, in a rst approa h, equivalent o upan ies (and granularities) of the tRPC wall.
5.2. CHARACTERISTICS OF THE TRPC WALL 89tRPC plane (see se tion 5.2.4 and also [143) due to the inhomogeneities of themagneti eld.The interpretation of the o upan yFor low o upan ies, and assuming that the positions of the parti les over thetRPC are not orrelated among themselves, the statisti al distribution of tra ksover a region ∆y at the tRPC follows Poisson statisti s. Therefore, by takingthe average o upan y of the ell n = dndy ∆y, the probability that the ell isempty (Po), that it has 1 hit (P1), et , an be dened:
Po = e−n ≃ 1 − n (5.9)P1 = ne−n ≃ n(1 − n) (5.10)· · ·
Pk =nke−n
k!≃ nk
k!(1 − n) (5.11)Due to expression 5.9, the probability that the ell is o upied (1-Po) is oftenapproximated by the average o upan y n. While the last has no upper bound,the former is a true probability, taking values between 0 and 1.Number of ele troni hannelsIn a one layer design, on e the maximum assumable o upan y is imposed by theexperiment requirements, the number of required ells be omes a xed number;it is just a geometri (and te hni al) problem to hose the adequate arrangementand the shapes of the ells. Furthermore, the details of the o upan y densitybe ome irrelevant for al ulating the total number of ele troni hannels.Let's assume, for illustration, the numbers oming from the simulation of entral Au+Au ollisions at 1.5 GeV/A: N = 30 harged parti les over ea hse tor of the tRPC wall. It must be re alled that simulations at a lower energy
Ekin = 1 GeV/A and b = 0 provide N = 20 [139, [145. If the o upan y isset to 20% being uniform over the wall, the number of required ells an beobtained as:Ncells = 6 se t× 20/0.2 = 600 Au+Au, b = 0 fm, 1.0 GeV/A (5.12)Ncells = 6 se t× 30/0.2 = 900 Au+Au, b < 4 fm, 1.5 GeV/A (5.13)Using a double-end read-out for having unbiased estimates of the time-of-ight, 1800 ele troni hannels would be required (and 1200 at 1 GeV, in qual-itative agreement with earlier proposals [139 (1440 hannels) and [145 (1320 hannels)).5.2.4 Number of petalsDierent possibilities of segmentation will be dis ussed, through the study ofthree ee ts: volume ee ts, double hits and azimuthal magneti dee tion.The rst two are general issues, while the third is hara teristi of the HADESmagneti eld.

90 CHAPTER 5. THE HADES TRPC WALLVolume ee tsThe requirements that allow to negle t the thi kness of the dete tor for o u-pan y al ulations an be extra ted by looking at the situation illustrated ing. 5.11. An a tive volume with dimensions d × D × w (thi k, long, wide)and an average angle of in iden e ξ, proje ted over a plane parallel to the fa ed × w, have been assumed. In that simple ase, the volume ee ts an be eval-uated through the ratio of the parti les impinging from the side to the parti lesimpinging on the surfa e:
n =dn
dyw (5.14)
nside =dn
dyd| tan ξ| (5.15)
nside
n=
d
w| tan ξ| (5.16)
Figure 5.11: Simplied situation where the volume ee t, namely the fra tion nside/n, anbe dire tly evaluated.It has been assumed that the only `volume' ontribution omes from thefa e d × D, that is enough for the present dis ussion and true in general forlong ells (D ≫ w). As a onsequen e, when nside/n & 1, the in rease inthe granularity will not help to redu e the o upan y, being dominated by theparti les impinging from the side.In HADES, a value for ξ an be obtained from geometri onsiderations,as most of the hadrons travel through almost straight lines due to their largemomentum. Fig. 5.12 shows the behavior of the proje ted angle ξ as a fun tionof the lo al tRPC position y:tan ξ =
y
L(5.17)being L is the distan e from the target to the enter of the se tor.The geometri expe tation given by eq. 5.17 is shown in g. 5.13, togetherwith the observed y vs ξ distribution for entral Au+Au ollisions at 1.5 GeV/A.Most of the parti les are very lose to the geometri predi tion, being slightly
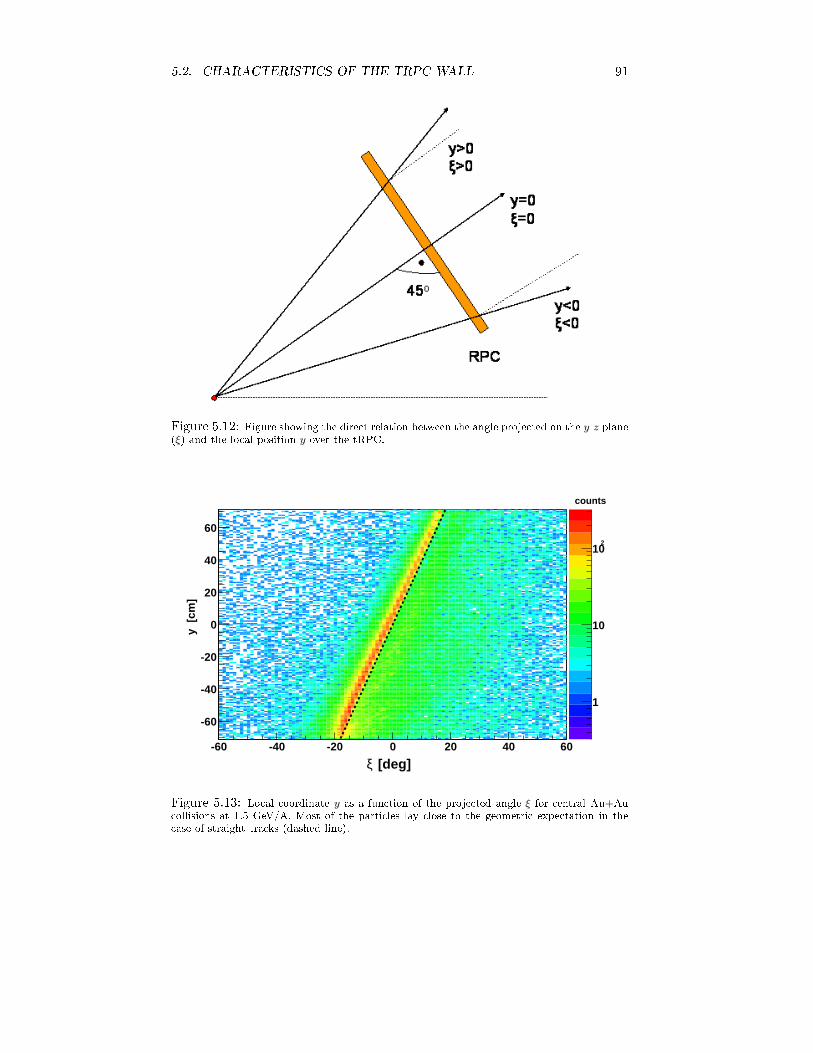
5.2. CHARACTERISTICS OF THE TRPC WALL 91
Figure 5.12: Figure showing the dire t relation between the angle proje ted on the y-z plane(ξ) and the lo al position y over the tRPC.
1
10
102
-60 -40 -20 0 20 40 60
-60
-40
-20
0
20
40
60
y [
cm]
[deg]ξ
counts
Figure 5.13: Lo al oordinate y as a fun tion of the proje ted angle ξ for entral Au+Au ollisions at 1.5 GeV/A. Most of the parti les lay lose to the geometri expe tation in the ase of straight tra ks (dashed line).

92 CHAPTER 5. THE HADES TRPC WALLdee ted towards low values of ξ, orresponding to an average downwards de-e tion ∆ξ ≃ −1.5. The points s attered out of tan ξ ≃ yL are mainly leptonsand parti les produ ed out of the vertex.Let's assume, for illustration, that the design is performed to provide ano upan y n = 20%; then, a) a ording to g. 5.9, the ells must have thefollowing widths at low y: w = 0.6 m for a 1-fold segmentation, w = 1.2 mfor a 2-fold segmentation and so on; b) at low y, ξ ≃ −20 is obtained fromg. 5.13; ) the a tive thi kness is assumed to be d = 0.72 m (four 0.3 mmgas gaps and three 2 mm plates). With these values, the volume ee t an bequantied for dierent ongurations through the magnitude nside/n, as shownin g. 5.14.
1 2 3 40.05
0.1
0.15
0.2
0.25
0.3
0.35
0.4
number of segmentations
n side
/n
-60 -40 -20 0 20 40 600
2
4
6
8
10
/n [
%]
sid
en
y [cm]
analytical estimate
simulation
Figure 5.14: Left: nside/n (volume ee t) as a fun tion of the number of segmentations(the o upan y was set to n = dndy
∆y = 20%). Also shown (right) the omparison between theevaluation of formulas 5.16, 5.17 and the simulated values of nside/n for the layout proposedin se tion 5.3.1.For a 1-fold segmentation and 20% o upan y, the volume ontribution isalready 40%, being around 10% for a 3-fold segmentation. The magnitude ofthe ee t for a 3-fold segmentation, with the ell sizes proposed in se tion 5.3.1,is also shown, together with the result of the evaluation of eq. 5.16 (triangles),indi ating a reasonable mutual agreement, not ex eeding the volume ee t a10%.The volume ee t an be redu ed by in lining the dete tor ells su h thatstraight tra ks oming from the vertex are impinging perpendi ularly at anyposition of the TOF wall. This option would lead to a ompletely dierentassembling of the ells in the gas box as ompared to the one proposed here,but must be onsidered as a reasonable hoi e.Azimuthal dee tion in the magneti eldBy onstru tion, HADES magneti eld is aimed at providing a momentum ki kalong the polar angle. However, a residual azimuthal ki k is present, tendingto fo us (de-fo us) the parti les to (from) the middle of the se tor11, dependingon their harge. This ee t has been re ently hara terized in some detail [143,providing an explanation of why both the fo using and the de-fo using pro esses11y-z plane.

5.2. CHARACTERISTICS OF THE TRPC WALL 93lead to an enhan ement of the lepton population lose to the middle of the se torat the tRPC position.For illustrating the ee t, the distribution of parti les along the x dire tion isshown in g. 5.15 at the lower polar angles (−66 m < y < −65 m, θlab ≃ 12),as it would be expe ted for entral ollisions and for a 1/p di-lepton distribution.
-40 -30 -20 -10 0 10 20 30 400
0.02
0.04
0.06
0.08
0.1
0.12
x [cm]
leptons, (all tracks)
AuAu, (central collisions)
Pro
bab
ility
[ in
2 c
m b
in]
Figure 5.15: Distribution over x at θlab = 12, obtained for leptons and entral Au+Au ollisions. The gure shows the fo using observed for leptons (mainly positrons in the plottedregion) towards the middle of the se tor, while a large homogeneity is present in the events oming from Au+Au entral ollisions.While the distribution orresponding to entral ollisions is roughly uniform,as expe ted due to the azimuthal symmetry, the leptons tend to fo us towardsthe middle of the se tor, due to the azimuthal magneti ki k. Therefore, toavoid possible losses of geometri origin, a segmentation in an even number ofpetals is not advisable.Inuen e of the propagation timeIt is very important to take into a ount that a parti le is not dete ted untilthe avalan he signal has been indu ed and propagated along the ell up to theFEE ele troni s. If a dierent parti le arrives to the ell before the olle tion ofthe signal has nished, su h a signal will be distorted12. Otherwise, the se ondparti le will arrive to the same ell but will not ae t the rst. This representsa favorable situation whenever the parti le of interest is faster than a typi alparti le from the bulk, as is the present ase. Therefore, when dealing withleptons, the s enario provided by the o upan y given in g. 5.9 is expe ted tobe more favorable.The situation an be des ribed from a simple point of view, in order toevaluate the ee t: a) two parti les arrive to the ell separated in time by∆t and b) the distribution along the ell is homogeneous. Let's onsider that12Let's note that for a velo ity of propagation vprop = 2/3c and a typi al ell size D = 20 m the propagation time from one of the ell ends to the other is 1 ns.

94 CHAPTER 5. THE HADES TRPC WALLthe rst parti le arrives at a position x and that the distan e traveled by the orresponding indu ed signal when the se ond parti le arrives is ∆x = vprop ∆t(vprop is the velo ity of propagation of the signal). Under these assumptions,the probability that the se ond parti le impinges on a region where the signalindu ed by the rst has already arrived, an be regarded as the probabilityof having a lean signal from the rst, without any kind of interferen e omingfrom the se ond. Su h probability an be written as a fun tion of the probabilitythat both signals interfere (Pinterf ) a ording to:1 − Pinterf (x, ∆t, D) =
1
D[∆x Θ(D − (x + ∆x)) + ∆x Θ(x − ∆x)] +
1
D[(D − x) Θ((x + ∆x) − D) + x Θ(∆x − x)] (5.18)with Θ being the step fun tion, x the position of in iden e of the rst parti leand D the length of the ell. The integral interferen e probability Pinterf of eq.5.18 for all the positions of the rst parti le an be obtained as:
1 − Pinterf (∆t, D) =1
D
∫ D
o
(1 − Pinterf (x, ∆t, D)) dx =
1
D2
[∫ D−∆x
o
∆xdx +
∫ D
∆x
∆xdx +
∫ D
D−∆x
(D − x)dx +
∫ ∆x
0
xdx
] (5.19)that results in the simple expression:Pinterf (∆t, D) =
(
1 − vprop∆t
D
)2 (5.20)Naturally, the interferen e probability in reases with D, providing a strong ar-gument against very long ells (low segmentations). For illustration, the mag-nitude Pinterf (∆t, D) is shown in g. 5.16 for the low polar angle region anddierent segmentations, assuming ∆t = 0.1, 0.25, 0.5 ns.Eq. 5.20 must be averaged over the time distribution of the spe ies of inter-est, yielding Pinterf (D). Therefore, the ee tive o upan y an be dened, ingeneral, as:neff = nPinterf (D) (5.21)If Pinterf (D) → 1 all the hadrons ontribute to the ee tive o upan y.Algorithm for re overing double hitsIn general, leptons with high tof are always present, orresponding to low mo-mentum and therefore large dee tions (see g. 5.18, for instan e). In su h asituation, it exists a han e that the lepton signal is ompletely hidden, be ausea fast hadron rossed the same ell. This ase will be referred as `total interfer-en e'. Therefore, the on epts of `total' and `partial' interferen e an be dened,as des ribed in g. 5.17, and denoted by Pinterf [2] and Pinterf [1], respe tively13.In g. 5.17 (up), it exists partial interferen e and, as a result, indu ed sig-nals oming from dierent parti les are olle ted at both tRPC ends, providinga biased estimate of the position. Fortunately, HADES has two a urate means13In previous se tion, the interfering probability was referring to the ase of partial inter-feren e Pinterf [1].

5.2. CHARACTERISTICS OF THE TRPC WALL 95
1 2 3 40
0.1
0.2
0.3
0.4
0.5
0.6
0.7
0.8
0.9
1
number of segmentations
Pin
terf
∆t = 500 ps∆t = 250 ps∆t = 100 ps
Figure 5.16: Probability of interferen e expe ted at low polar angles as a fun tion of thenumber of segmentations (therefore the ell length), and the tof dieren e ∆t.
Figure 5.17: Partial (up) and total (down) interferen e. The ar s show the wave front ofthe indu ed signal at xed time. The position re onstru ted by the tRPC (biased) is shown,together with the ones resulting from an ideal auxiliary dete tor system.for determining the true position over the tRPC: the MDC tra king systemand the Pre-shower dete tor (that is atta hed to the tRPC). Therefore, a par-tially interfering double hit an be identied by the typi al pattern des ribedin g. 5.17 (up) (I.e.: a mismat h between the position estimated from thetRPC, xRPC
= (tL− t
R)vprop/2, and the two positions re onstru ted by thetra king. In identally, the biased tRPC position lays always between the twore onstru ted positions, making a lean pattern).If the true positions of the double hits are known with the help of external
96 CHAPTER 5. THE HADES TRPC WALLinformation, the times of ight of the two parti les (t1, t2) an be estimatedthrough:t1 = t
R−
D − xR
∣
∣
ext
vprop(5.22)
t2 = tL−
xL
∣
∣
ext
vprop(5.23)
σ2T
= (σT
∣
∣
RPC)2 +
(
σx
∣
∣
ext
vprop
)2 (5.24)with x starting from the left end of the ell. Assuming a propagation velo ityvprop = 2
3c (se tion 6.5.3) and a reasonable value of σx
∣
∣
ext< 1 m14, a ontri-bution of 50 ps is obtained when a ounting for the resolution of the tra kingsystem (still smaller than the intrinsi tRPC resolution).It must be noti ed that, in ase of double hits, the harge information is orrupted15. However, a time resolution σ
T= 100 ps an be obtained evenin the absen e of slewing orre tion as shown in se tion 6.4.2. Therefore, theexpe ted time resolution for double hits is:
σx
∣
∣
ext. 1 m → σ
T∼ 100 ps (5.25)Note that, if the algorithm for re overing double hits an be implemented inpra ti e, it would suggest, against the on lusion of previous se tion, to buildvery long ells so that the probability of partial interferen e Pinterf [1] is enhan edand the total interferen e Pinterf [2] redu ed virtually to zero. However, it isadvisable at the present stage to try to minimize interferen e and keep thelength of the ells at reasonable values.The time of ight of leptonsThe fa t that the e+e− pairs travel at the speed of light indi ates that their timeof ight and momentum are orrelated only due to the dee tion in the magneti eld. Before studying su h orrelation it is ne essary to remove from the sampleof lepton tra ks those with unreasonable times of ight due to errati paths alongthe magneti eld that are, anyway, hard to re onstru t for the tra king system.The more riti al ases an be identied by looking for orrelations between tof -
ξlab and tof -∆ξ (∆ξ is dened as the dieren e between the proje ted angle inlab at the tRPC position and the proje ted angle at vertex): looping leptons orthose with very long paths are identied as dis onne ted regions in any of thesetwo representations (g. 5.18 up). Furthermore, g. 5.18 (up-right) indi atesthat parti les with zero dee tion (∆ξ = 0) an have very large times of ight,an ee t that an be only explained by the errati movement of low momentaele trons in regions of high eld, yielding ∆ξ = 0 just by han e. Su h leptonswere removed from the sample through the uts indi ated by the lines in g.5.18.14The nominal pre ision of the HADES tra king system is at the level of 0.1 mm at theplane of the drift hambers.15Large shaping times of some tens of ns are ommonly used for harge measurements,therefore resulting, in ase of double hits, in the analog sum of the harges produ ed by bothparti les.

5.2. CHARACTERISTICS OF THE TRPC WALL 971
10
102
10 20 30 40 50 607
8
9
10
11
12
13
14
15
tof
[ns]
]° [labξ
counts
1
10
102
-60 -40 -20 0 20 40 607
8
9
10
11
12
13
14
15
tof
[ns]
]° [ξ ∆
counts
1
10
102
100 200 300 400 500 600 700 800 900 10007
7.5
8
8.5
9
tof<8.5 ns, p>100 MeV
tof<8 ns, p>200 MeV
primary tracks- e+ e610
counts
p [MeV/c]
tof
[ns]
Figure 5.18: (Up-left) Time of ight of e+e− pairs as a fun tion of the proje ted anglein the `lab' system. (Up-right) Time of ight of e+e− pairs as a fun tion of the variationbetween the proje ted angle at the tRPC and vertex. (Down) Relation between time of ightand momentum for e+e− pairs.Finally, the plot 5.18 (down) shows the orrelation between tof and p fore+e− pairs (the two observed bran hes at low momentum orrespond to thedierent paths of e+ and e− within the spe trometer). The following obser-vations an be made: a) most of the leptons with momentum p > 100 MeVhave tof < 8.5 ns (not more than 1.1 ns later than the fastest lepton) while b)p > 200 MeV implies tof < 8.0 ns (less than 0.6 ns later than the fastest lepton).Fig. 5.18 has been obtained for the typi al eld applied in the spe trometer,but the relations a) and b) will also hold, in general, for lower elds.
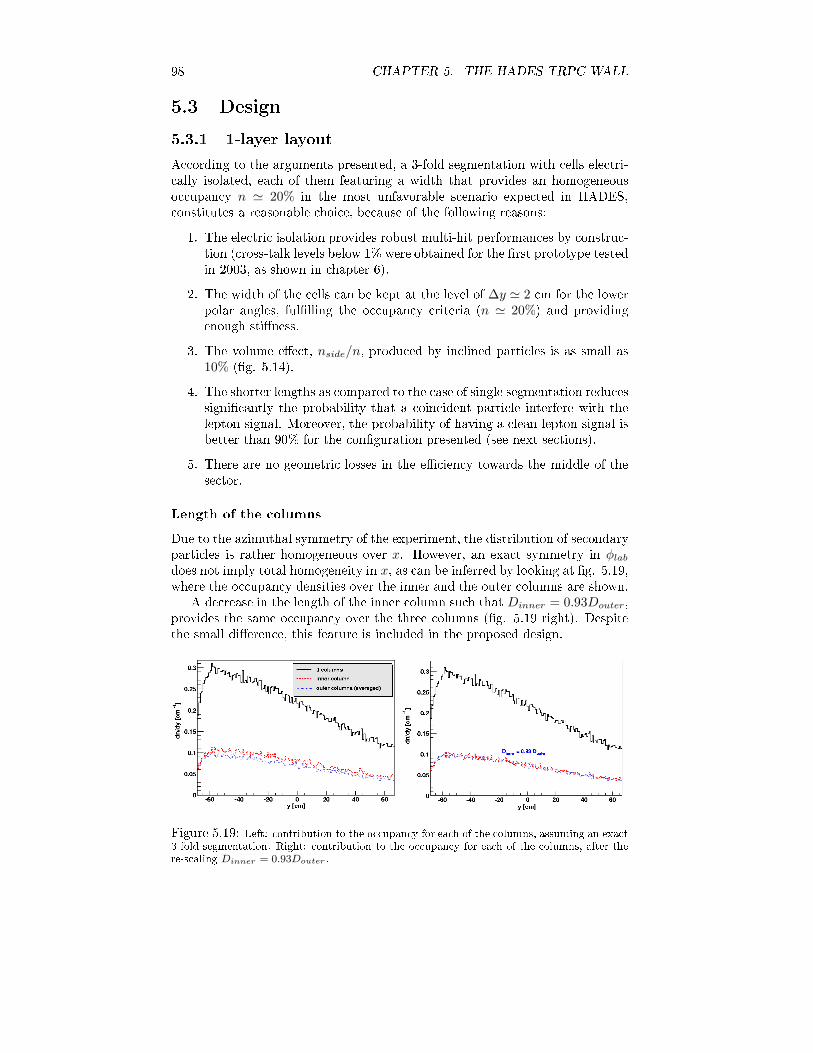
98 CHAPTER 5. THE HADES TRPC WALL5.3 Design5.3.1 1-layer layoutA ording to the arguments presented, a 3-fold segmentation with ells ele tri- ally isolated, ea h of them featuring a width that provides an homogeneouso upan y n ≃ 20% in the most unfavorable s enario expe ted in HADES, onstitutes a reasonable hoi e, be ause of the following reasons:1. The ele tri isolation provides robust multi-hit performan es by onstru -tion ( ross-talk levels below 1% were obtained for the rst prototype testedin 2003, as shown in hapter 6).2. The width of the ells an be kept at the level of ∆y ≃ 2 m for the lowerpolar angles, fullling the o upan y riteria (n ≃ 20%) and providingenough stiness.3. The volume ee t, nside/n, produ ed by in lined parti les is as small as10% (g. 5.14).4. The shorter lengths as ompared to the ase of single segmentation redu essigni antly the probability that a oin ident parti le interfere with thelepton signal. Moreover, the probability of having a lean lepton signal isbetter than 90% for the onguration presented (see next se tions).5. There are no geometri losses in the e ien y towards the middle of these tor.Length of the olumnsDue to the azimuthal symmetry of the experiment, the distribution of se ondaryparti les is rather homogeneous over x. However, an exa t symmetry in φlabdoes not imply total homogeneity in x, as an be inferred by looking at g. 5.19,where the o upan y densities over the inner and the outer olumns are shown.A de rease in the length of the inner olumn su h that Dinner = 0.93Douter,provides the same o upan y over the three olumns (g. 5.19 right). Despitethe small dieren e, this feature is in luded in the proposed design.
Figure 5.19: Left: ontribution to the o upan y for ea h of the olumns, assuming an exa t3-fold segmentation. Right: ontribution to the o upan y for ea h of the olumns, after there-s aling Dinner = 0.93Douter .

5.3. DESIGN 99Design parametersAs said, on e the o upan y is xed, the ell sizes an be obtained. A possible onguration is shown in g. 5.20, with the ell sizes hosen to fulll the o u-pan y requirements by means of ommer ially available aluminum proles (forinstan e, [146).
-60 -40 -20 0 20 40 60
2
2.5
3
3.5
4
4.5
5
cell
wid
th w
[cm
]
2.2 cm
2.7 cm
3.0 cm
3.8 cm
4.7 cm
2.5 cm×3
cell (width)
2.5 cm×4
2.5 cm×4
2.5 cm×5
2.5 cm×6
y [cm]
height)×shielding profile (width
-60 -40 -20 0 20 40 6010
15
20
25
30
35
40
45
50
y [cm]
cell
len
gth
[cm
]
1.09)×central column (side columns =
-60 -40 -20 0 20 40 60
1
1.5
2
2.5
3
y [cm]
sep
arat
ion
bet
wee
n a
ctiv
e re
gio
ns
[cm
]
Figure 5.20: Up: ell width as a fun tion of y for keeping the o upan y at 20%. Down-left: ell length for the entral olumn. Down-right: separation between the a tive region of the ells along the y dire tion.
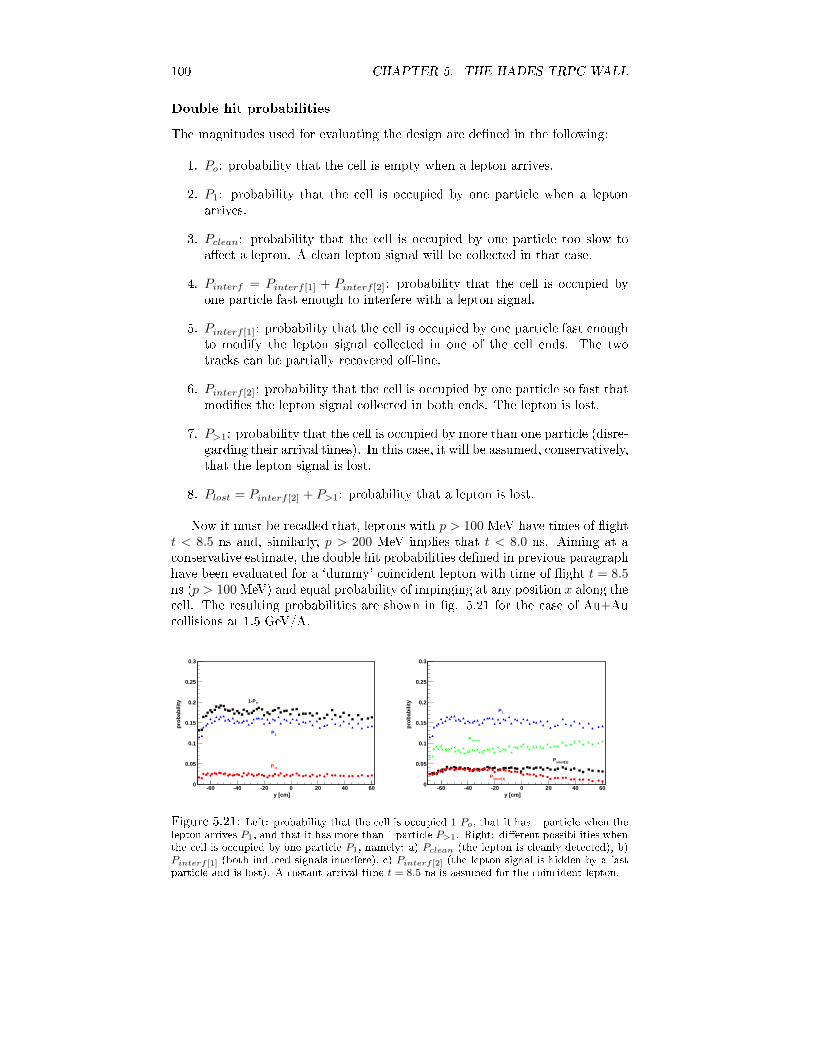
100 CHAPTER 5. THE HADES TRPC WALLDouble hit probabilitiesThe magnitudes used for evaluating the design are dened in the following:1. Po: probability that the ell is empty when a lepton arrives.2. P1: probability that the ell is o upied by one parti le when a leptonarrives.3. Pclean: probability that the ell is o upied by one parti le too slow toae t a lepton. A lean lepton signal will be olle ted in that ase.4. Pinterf = Pinterf [1] + Pinterf [2]: probability that the ell is o upied byone parti le fast enough to interfere with a lepton signal.5. Pinterf [1]: probability that the ell is o upied by one parti le fast enoughto modify the lepton signal olle ted in one of the ell ends. The twotra ks an be partially re overed o-line.6. Pinterf [2]: probability that the ell is o upied by one parti le so fast thatmodies the lepton signal olle ted in both ends. The lepton is lost.7. P>1: probability that the ell is o upied by more than one parti le (disre-garding their arrival times). In this ase, it will be assumed, onservatively,that the lepton signal is lost.8. Plost = Pinterf [2] + P>1: probability that a lepton is lost.Now it must be re alled that, leptons with p > 100 MeV have times of ightt < 8.5 ns and, similarly, p > 200 MeV implies that t < 8.0 ns. Aiming at a onservative estimate, the double hit probabilities dened in previous paragraphhave been evaluated for a `dummy' oin ident lepton with time of ight t = 8.5ns (p > 100 MeV) and equal probability of impinging at any position x along the ell. The resulting probabilities are shown in g. 5.21 for the ase of Au+Au ollisions at 1.5 GeV/A.
-60 -40 -20 0 20 40 600
0.05
0.1
0.15
0.2
0.25
0.3
o1-P
1P
>1P
y [cm]
pro
bab
ility
-60 -40 -20 0 20 40 600
0.05
0.1
0.15
0.2
0.25
0.3
1P
y [cm]
pro
bab
ility
cleanP
interf[1]P
interf[2]PFigure 5.21: Left: probability that the ell is o upied 1-Po, that it has 1 parti le when thelepton arrives P1, and that it has more than 1 parti le P>1. Right: dierent possibilities whenthe ell is o upied by one parti le P1, namely: a) Pclean (the lepton is leanly dete ted), b)Pinterf [1] (both indu ed signals interfere), ) Pinterf [2] (the lepton signal is hidden by a fastparti le and is lost). A ostant arrival time t = 8.5 ns is assumed for the oin ident lepton.
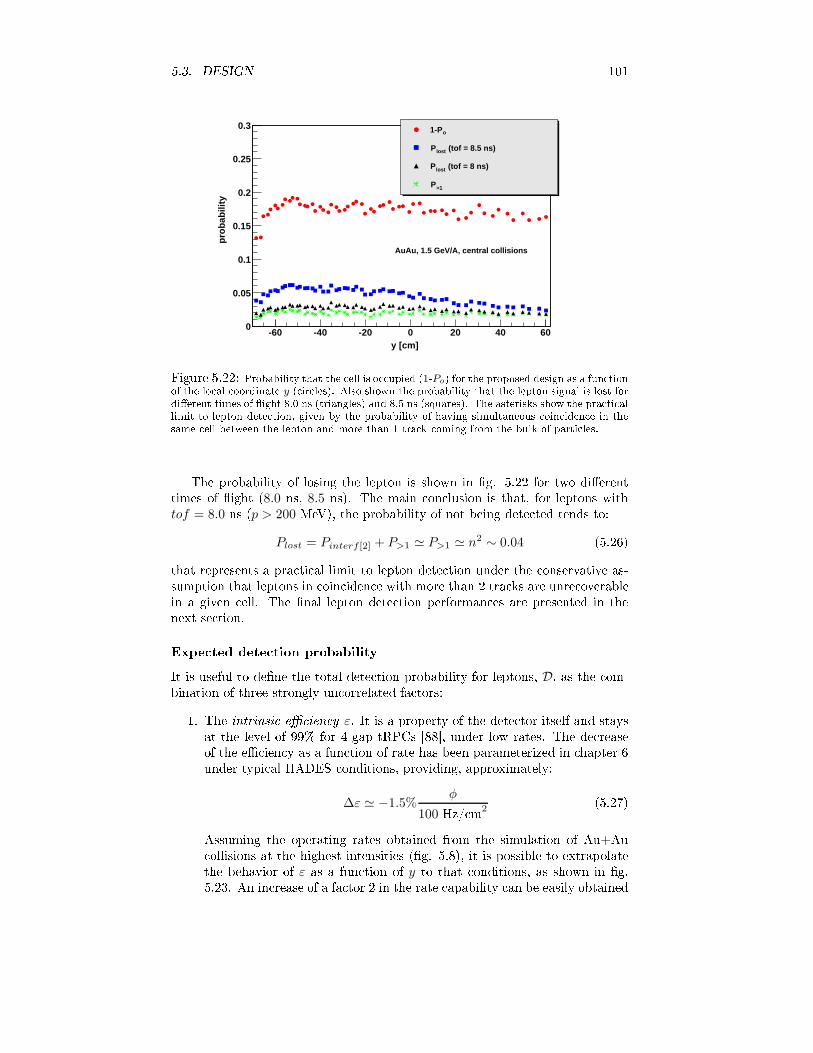
5.3. DESIGN 101
-60 -40 -20 0 20 40 600
0.05
0.1
0.15
0.2
0.25
0.3
y [cm]
pro
bab
ility
o1-P
(tof = 8.5 ns)lostP
(tof = 8 ns)lostP
>1P
AuAu, 1.5 GeV/A, central collisions
Figure 5.22: Probability that the ell is o upied (1-Po) for the proposed design as a fun tionof the lo al oordinate y ( ir les). Also shown the probability that the lepton signal is lost fordierent times of ight 8.0 ns (triangles) and 8.5 ns (squares). The asterisks show the pra ti allimit to lepton dete tion, given by the probability of having simultaneous oin iden e in thesame ell between the lepton and more than 1 tra k oming from the bulk of parti les.The probability of losing the lepton is shown in g. 5.22 for two dierenttimes of ight (8.0 ns, 8.5 ns). The main on lusion is that, for leptons withtof = 8.0 ns (p > 200 MeV), the probability of not being dete ted tends to:
Plost = Pinterf [2] + P>1 ≃ P>1 ≃ n2 ∼ 0.04 (5.26)that represents a pra ti al limit to lepton dete tion under the onservative as-sumption that leptons in oin iden e with more than 2 tra ks are unre overablein a given ell. The nal lepton dete tion performan es are presented in thenext se tion.Expe ted dete tion probabilityIt is useful to dene the total dete tion probability for leptons, D, as the om-bination of three strongly un orrelated fa tors:1. The intrinsi e ien y ε. It is a property of the dete tor itself and staysat the level of 99% for 4-gap tRPCs [88, under low rates. The de reaseof the e ien y as a fun tion of rate has been parameterized in hapter 6under typi al HADES onditions, providing, approximately:∆ε ≃ −1.5%
φ
100 Hz/ m2 (5.27)Assuming the operating rates obtained from the simulation of Au+Au ollisions at the highest intensities (g. 5.8), it is possible to extrapolatethe behavior of ε as a fun tion of y to that onditions, as shown in g.5.23. An in rease of a fa tor 2 in the rate apability an be easily obtained
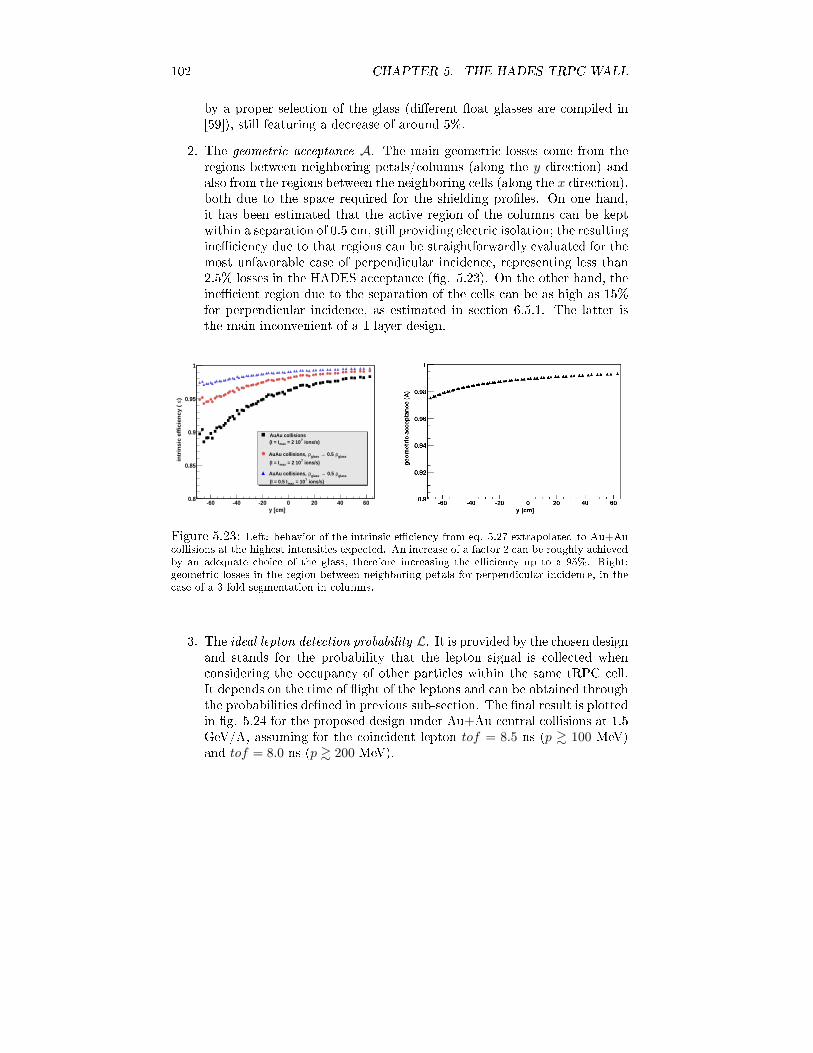
102 CHAPTER 5. THE HADES TRPC WALLby a proper sele tion of the glass (dierent oat glasses are ompiled in[59), still featuring a de rease of around 5%.2. The geometri a eptan e A. The main geometri losses ome from theregions between neighboring petals/ olumns (along the y dire tion) andalso from the regions between the neighboring ells (along the x dire tion),both due to the spa e required for the shielding proles. On one hand,it has been estimated that the a tive region of the olumns an be keptwithin a separation of 0.5 m, still providing ele tri isolation; the resultingine ien y due to that regions an be straightforwardly evaluated for themost unfavorable ase of perpendi ular in iden e, representing less than2.5% losses in the HADES a eptan e (g. 5.23). On the other hand, theine ient region due to the separation of the ells an be as high as 15%for perpendi ular in iden e, as estimated in se tion 6.5.1. The latter isthe main in onvenient of a 1-layer design.-60 -40 -20 0 20 40 60
0.8
0.85
0.9
0.95
1
y [cm]
AuAu collisions
glassρ 0.5 → glassρAuAu collisions,
glassρ 0.5 → glassρAuAu collisions,
ions/s)7 = 10max(I = 0.5 I
ions/s)7 = 2 10max(I = I
ions/s)7 = 2 10max(I = I
)εin
trin
sic
eff
icie
ncy (
Figure 5.23: Left: behavior of the intrinsi e ien y from eq. 5.27 extrapolated to Au+Au ollisions at the highest intensities expe ted. An in rease of a fa tor 2 an be roughly a hievedby an adequate hoi e of the glass, therefore in reasing the e ien y up to a 95%. Right:geometri losses in the region between neighboring petals for perpendi ular in iden e, in the ase of a 3-fold segmentation in olumns.3. The ideal lepton dete tion probability L. It is provided by the hosen designand stands for the probability that the lepton signal is olle ted when onsidering the o upan y of other parti les within the same tRPC ell.It depends on the time of ight of the leptons and an be obtained throughthe probabilities dened in previous sub-se tion. The nal result is plottedin g. 5.24 for the proposed design under Au+Au entral ollisions at 1.5GeV/A, assuming for the oin ident lepton tof = 8.5 ns (p & 100 MeV)and tof = 8.0 ns (p & 200 MeV).

5.3. DESIGN 103-60 -40 -20 0 20 40 60
0.7
0.75
0.8
0.85
0.9
0.95
1
y [cm]
L (
idea
l lep
ton
det
ecti
on
pro
bab
ility
)
the cell is occupied
the cell is occupied by a particle fast enough to interfere with the lepton
after recovering off-line interfering particles (double hits)
( tof = 8.5 ns )
-60 -40 -20 0 20 40 600.7
0.75
0.8
0.85
0.9
0.95
1
L (
idea
l lep
ton
det
ecti
on
pro
bab
ility
)
y [cm]
the cell is occupied
the cell is occupied by a particle fast enough to interfere with the lepton
after recovering off-line interfering particles (double hits)
( tof = 8 ns )Figure 5.24: Lepton dete tion probability, L, in ase of ideal dete tor response for dierenttimes of ight (8.5 ns and 8.0 ns), orresponding to momenta above 100 MeV and 200 MeV,respe tively. In more than 90% of the ases a lean signal is olle ted, while≃ 5% of the doublehits an be additionally re overed o-line with the pro edure des ribed in se tion 5.2.4.5.3.2 2-layer layoutAs said, a 1-layer layout onstituted by ele tri ally isolated ells requires somespa ing between the a tive volumes of ea h ell for pla ing the ne essary shield-ing. Su h an approa h has been implemented through the use of aluminumproles, and the results are shown in se tion 6; they indi ate that the loss ingeometri a eptan e an be almost 15% for perpendi ular in iden e, even inthe very tight onguration hosen, where the a tive regions were separated byonly 3 mm.The overlap between layersFor avoiding dead regions, the use of a double layer onguration is proposed.The overlap required is given by the angle of in iden e of the parti les at thetRPC position (see g. 5.25). It has to be taken into a ount that optimizingthe dete tor for ertain angles of in iden e will bias the sample of dete tedparti les, depending on their momentum. For avoiding this drawba k, a generalsolution is proposed: the overlap was determined in su h a way that all thepossible tra ks within the spe trometer that ome from the vertex and havea momentum between 100 MeV and 1000 MeV go through at least 4 tRPCgaps (providing ε & 99%). The distribution for generating all tra ks has beendes ribed in se tion 5.1.3, allowing to obtain all the possible angles of in iden eξ as a fun tion of the lo al oordinate y (g. 5.26). Therefore, the maximumand minimum angles ξ at ea h position y within the tRPC wall provide therequired overlap (see g. 5.25):
bdownwards(y) = (d + h) tan [ξmin(y)] (5.28)bupwards(y) = (d + h) tan [ξmax(y)] (5.29)where d is the a tive thi kness of the dete tor (region omprised between thetwo outermost gaps of ea h 4-gap ell, d = 0.72 m) and h the separationbetween a tive volumes of dierent layers (assumed to be 1 m due to me hani al onstraints).A y vs ξ s atter plot is shown in g. 5.26 (left) for all tra ks, ompared withthe distribution oming from Au+Au entral ollisions at 1.5 GeV/A (right),
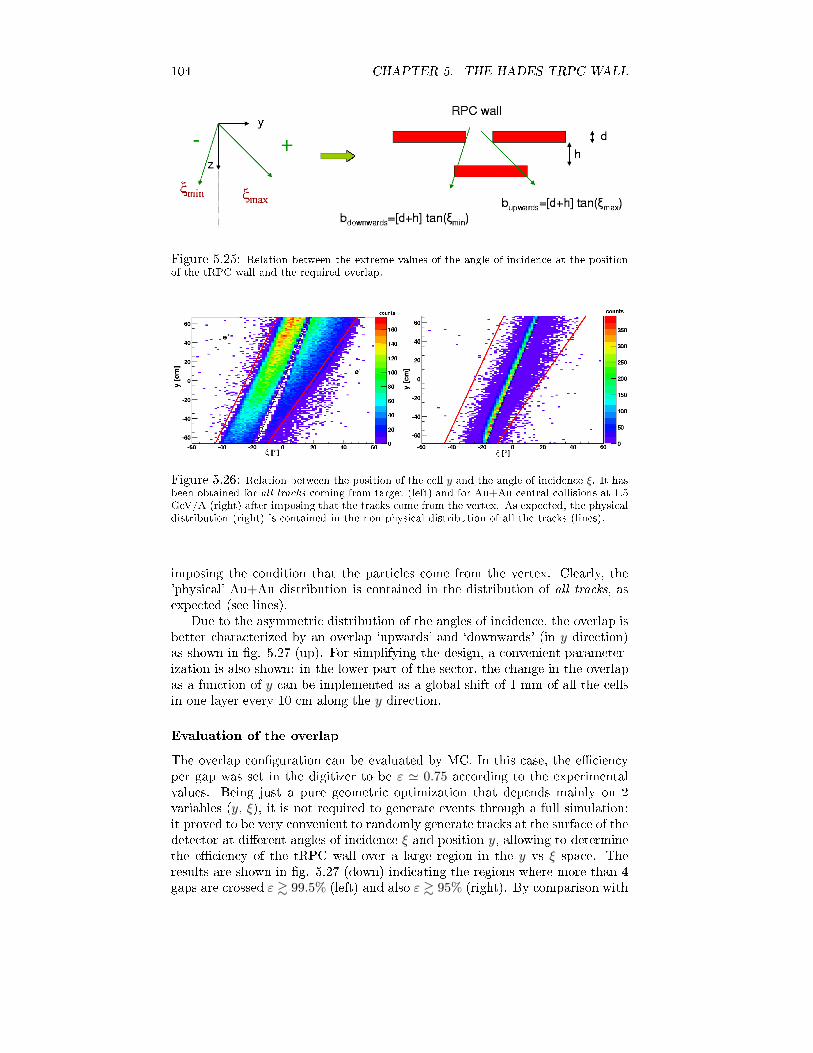
104 CHAPTER 5. THE HADES TRPC WALLFigure 5.25: Relation between the extreme values of the angle of in iden e at the positionof the tRPC wall and the required overlap.
Figure 5.26: Relation between the position of the ell y and the angle of in iden e ξ. It hasbeen obtained for all tra ks oming from target (left) and for Au+Au entral ollisions at 1.5GeV/A (right) after imposing that the tra ks ome from the vertex. As expe ted, the physi aldistribution (right) is ontained in the non-physi al distribution of all the tra ks (lines).imposing the ondition that the parti les ome from the vertex. Clearly, the'physi al' Au+Au distribution is ontained in the distribution of all tra ks, asexpe ted (see lines).Due to the asymmetri distribution of the angles of in iden e, the overlap isbetter hara terized by an overlap `upwards' and `downwards' (in y dire tion)as shown in g. 5.27 (up). For simplifying the design, a onvenient parameter-ization is also shown: in the lower part of the se tor, the hange in the overlapas a fun tion of y an be implemented as a global shift of 1 mm of all the ellsin one layer every 10 m along the y dire tion.Evaluation of the overlapThe overlap onguration an be evaluated by MC. In this ase, the e ien yper gap was set in the digitizer to be ε ≃ 0.75 a ording to the experimentalvalues. Being just a pure geometri optimization that depends mainly on 2variables (y, ξ), it is not required to generate events through a full simulation:it proved to be very onvenient to randomly generate tra ks at the surfa e of thedete tor at dierent angles of in iden e ξ and position y, allowing to determinethe e ien y of the tRPC wall over a large region in the y vs ξ spa e. Theresults are shown in g. 5.27 (down) indi ating the regions where more than 4gaps are rossed ε & 99.5% (left) and also ε & 95% (right). By omparison with

5.3. DESIGN 105
0.995
0.9955
0.996
0.9965
0.997
0.9975
0.998
0.9985
0.999
0.9995
-60 -40 -20 0 20 40 60
-60
-40
-20
0
20
40
60
>99.5%ε
counts
]° [ξ
y [c
m]
0.65
0.7
0.75
0.8
0.85
0.9
0.95
-60 -40 -20 0 20 40 60
-60
-40
-20
0
20
40
60counts
]° [ξ
y [c
m]
>95%ε
Figure 5.27: Up: overlap (downwards and upwards) as a fun tion of the lo al oordinatey, together with the very onvenient parameterization hosen. Emulated e ien y, showingthe 99.5% e ient region, orresponding to 4 gaps rossed (left) and 95%, orresponding toapproximately 3 gaps rossed (right).g. 5.26 (left), it an be seen that the region with ε > 99.5% in g. 5.27 (lines)is onservatively larger than the region of interest.E ien y performan esFrom the dis ussion of previous se tions, a onvenient design was made basedon gs. 5.20 ( ell dimensions) and 5.27 (overlap between layers), that is pre-sented in table 5.1. For illustration, the arrangement of the ells is shown onlyfor one of the six olumns/petals, taking as referen e the a eptan e of gure5.5; it orresponds to the olumn/petal pla ed in the se ond layer, right handviewed from the target. For simpli ity, the use of ommer ially available alu-minum proles was imposed, yielding only six groups of ell sizes. The other ve olumns/petals are analogous to the one in table 5.1, and the relative positioningof the two layers fullls the overlap determined in gure 5.27.
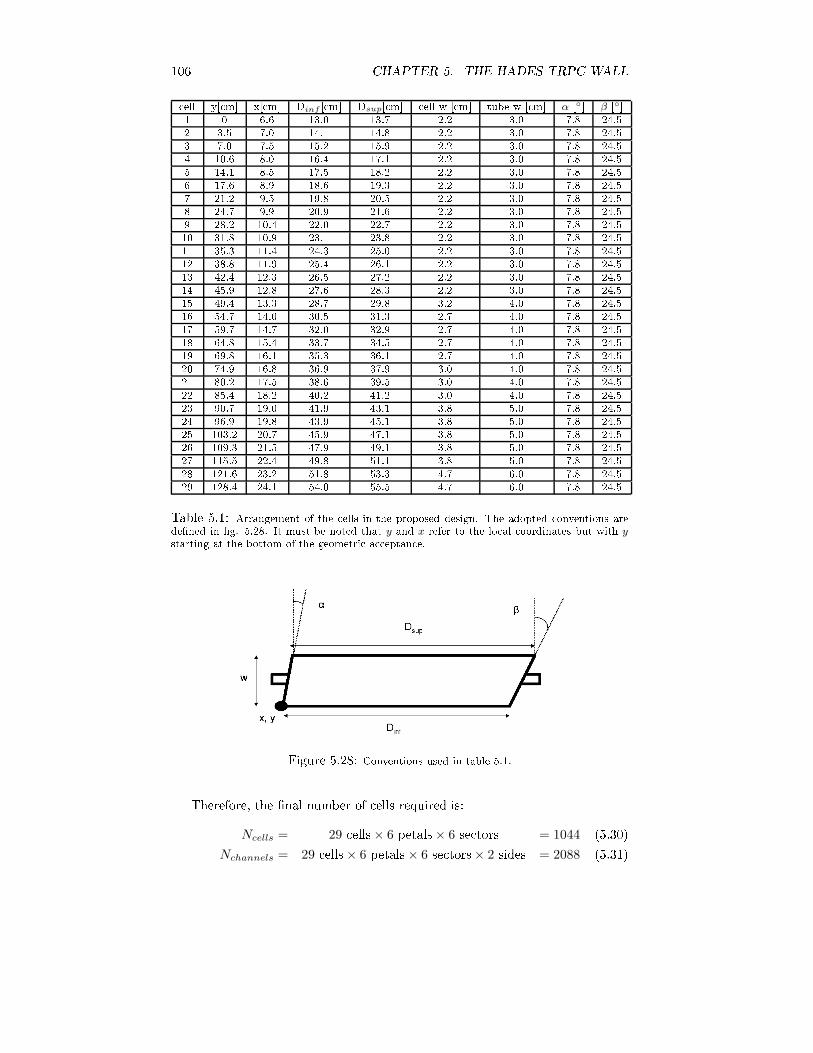
106 CHAPTER 5. THE HADES TRPC WALL ell y[ m x[ m Dinf [ m Dsup[ m ell w [ m tube w [ m α [ β [1 0 6.6 13.0 13.7 2.2 3.0 7.8 24.52 3.5 7.0 14.1 14.8 2.2 3.0 7.8 24.53 7.0 7.5 15.2 15.9 2.2 3.0 7.8 24.54 10.6 8.0 16.4 17.1 2.2 3.0 7.8 24.55 14.1 8.5 17.5 18.2 2.2 3.0 7.8 24.56 17.6 8.9 18.6 19.3 2.2 3.0 7.8 24.57 21.2 9.5 19.8 20.5 2.2 3.0 7.8 24.58 24.7 9.9 20.9 21.6 2.2 3.0 7.8 24.59 28.2 10.4 22.0 22.7 2.2 3.0 7.8 24.510 31.8 10.9 23.1 23.8 2.2 3.0 7.8 24.511 35.3 11.4 24.3 25.0 2.2 3.0 7.8 24.512 38.8 11.9 25.4 26.1 2.2 3.0 7.8 24.513 42.4 12.3 26.5 27.2 2.2 3.0 7.8 24.514 45.9 12.8 27.6 28.3 2.2 3.0 7.8 24.515 49.4 13.3 28.7 29.8 3.2 4.0 7.8 24.516 54.7 14.0 30.5 31.3 2.7 4.0 7.8 24.517 59.7 14.7 32.0 32.9 2.7 4.0 7.8 24.518 64.8 15.4 33.7 34.5 2.7 4.0 7.8 24.519 69.8 16.1 35.3 36.1 2.7 4.0 7.8 24.520 74.9 16.8 36.9 37.9 3.0 4.0 7.8 24.521 80.2 17.5 38.6 39.5 3.0 4.0 7.8 24.522 85.4 18.2 40.2 41.2 3.0 4.0 7.8 24.523 90.7 19.0 41.9 43.1 3.8 5.0 7.8 24.524 96.9 19.8 43.9 45.1 3.8 5.0 7.8 24.525 103.2 20.7 45.9 47.1 3.8 5.0 7.8 24.526 109.3 21.5 47.9 49.1 3.8 5.0 7.8 24.527 115.5 22.4 49.8 51.1 3.8 5.0 7.8 24.528 121.6 23.2 51.8 53.3 4.7 6.0 7.8 24.529 128.4 24.1 54.0 55.5 4.7 6.0 7.8 24.5Table 5.1: Arrangement of the ells in the proposed design. The adopted onventions aredened in g. 5.28. It must be noted that y and x refer to the lo al oordinates but with ystarting at the bottom of the geometri a eptan e.
Figure 5.28: Conventions used in table 5.1.Therefore, the nal number of ells required is:Ncells = 29 ells× 6 petals× 6 se tors = 1044 (5.30)
Nchannels = 29 ells× 6 petals× 6 se tors× 2 sides = 2088 (5.31)

5.3. DESIGN 107The lepton dete tion apabilities of the design an be evaluated: taking the onservative numbers for the intrinsi e ien y ε & 95% (worst s enario), thegeometri a eptan e A & 98% (worst s enario), and the design value L & 95%(p > 100 MeV), a value for the total lepton dete tion probability for leptonswith momentum above 100 MeV D(p > 100 MeV) an be obtained as:D = L×A× ε & 88.5% (5.32)and for the dete tion of lepton pairs:
D = (L ×A× ε)2 & 78.2% (5.33)determined for Au+Au entral ollisions, b < 4 fm and Ekin = 1.5 GeV/A 16.If further improvements related to the moderate in rease of the temperature ofthe glass are nally a omplished, ε ould be in reased up to a value lose to99% (see the en ouraging results [73, [59 and [1). On the other hand, theideal dete tion probability for leptons L, for p > 200 MeV, is at the level of97%, as long as double hits an be re overed with the algorithm proposed inse tion 5.2.4.First level trigger performan esThe rst level trigger performan es will be ae ted by the level of o upan yof the ells (some tra ks are lost) but also by the overlap (tra ks an produ emore than one valid signal). Both ee ts are taken into a ount by the digitizerand, therefore, the multipli ity measurements an be evaluated and omparedwith the true multipli ity. This is done in g. 5.29 for Au+Au entral ollisions(all se tors), indi ating that a small in rease with respe t to the true multi-pli ity takes pla e, indeed, at the level of 20%. Despite this, the ratio σN
/Nis roughly onstant and therefore the ee t an be orre ted by re-dening thetrigger ondition, without losing performan es. The result of g. 5.29 and theprevious remark point to the fa t that, in entral Au+Au ollisions, the initialu tuations due to the hara teristi s of the intera tion have a dominant role onthe multipli ity distribution measured, redu ing the impa t of design hoi es.5.3.3 3-D designA detailed pi ture of the 3D design orresponding to the lower polar angles isshown in g. 5.30, together with some of the ells that have been re ently testedin November 2005 [1. The asymmetri overlap is visible in the drawing. Thenatural way-out of the ables towards the FEE (pla ed at the sides of the gasbox) is summarized in g. 5.30 (down).16Also B = 0.72Bmax, point-like target at origin and ideal HADES geometry is assumed.

108 CHAPTER 5. THE HADES TRPC WALL
80 100 120 140 160 180 200 220 240 260 2800
5
10
15
20
25
30
35
40
45 mean = 172
= 27σ
mean=208
= 31σ
cou
nts
Multiplicity in the RPC wallFigure 5.29: Simulated multipli ity at the tRPC wall (all se tors) as expe ted for theproposed design (rightmost distribution), under entral Au+Au ollisions at 1.5 GeV/A. Thetrue multipli ity is given by the leftmost peak. Both distributions are tted to a Gaussian,showing a slight in rease in the rst ase due to the overlapping regions that produ e double- ounting.
Figure 5.30: Up: 3D drawing of a detail of the proposed design at low polar angles. In thelower part, the shielding proles that surround the dete tor ells are shown, indi ating alsothe distribution of the signal ables.
5.4. OTHER ISSUES 1095.4 Other issues5.4.1 Evaluation of the impa t over other dete torsGeometri onstraints17Geometri integration is a ru ial issue. Moreover, most of the details regard-ing the nal shape and dimensions of the gas box and also of the ele troni hannels, even the dimensions of the s rews or the thi kness of the gas box, thematerials used, et ... were dis ussed along ountless meetings of the membersof the ESTRELA proje t. A full des ription of all these topi s is out of thes ope of the present work. On the other hand, geometri integration onstitutesa boundary (or ompromise) between physi s requirements and pra ti al feasi-bility; therefore, a part of the arisen problems must be dis ussed, even if rathersuper ially, here. More on geometri integration an be found at [149.There are three major geometri onstraints:1. For not oming into oni t with MDC IV frame at the lower polar angles,the tRPC gas box must be not thi ker than 10 m. Fortunately, in theproposed 2-layer onguration, onstituted by 4-gap ells + shielding, thethi kness an be kept at the level of 8-10 m without big eort. Moreover,the proximity of the frame of the MDC IV and the tRPC gas box isnot likely to represent any potential me hani al problem, due to the highrobustness of both elements.2. There was a problem due to the high proximity between the TOF pho-tomultipliers and the tRPC gas box at intermediate polar angles (θlab ≃45). The two main alternatives onsidered for providing a safe separa-tion from them were: a) to perform a downstream displa ement of the settRPC+shower dete tor or b) to ut the gas box; both solutions result inthe de rease of the geometri a eptan e. The two possibilities were eval-uated based on CAD designs [149, that provided the spe i ations for theminimum ut and also the minimum displa ement required for over omingthe problem (g. 5.31).The a eptan e was estimated as des ribed in se tion 5.2.1 for both pro-posed solutions, yielding a similar loss in geometri a eptan e (evaluatedat the nominal tRPC position for easier omparison), at the level of 3-4%,distributed in the region of θlab = 40-45. Due to the similar onsequen esof both approa hes, it was de ided to ut the gas box be ause of pra ti alreasons. The ut gas box together with a CAD pi ture of the geometri integration in HADES are shown in g. 5.32.
17In ollaboration with H. Álvarez-Pol.

110 CHAPTER 5. THE HADES TRPC WALL10
-1
1
10
-80 -60 -40 -20 0 20 40 60 80-80
-60
-40
-20
0
20
40
60
80
x [cm]
y [c
m]
counts9 cm displaced downstream
10-1
1
10
-80 -60 -40 -20 0 20 40 60 80-80
-60
-40
-20
0
20
40
60
80
17.8 cm
9.2 cm
x [cm]
y [c
m]
countscut
Figure 5.31: Figures showing the losses in the a eptan e at the nominal tRPC position fortwo dierent approa hes: a) downstream displa ement of the set tRPC+shower dete tor (left),9 m along the dire tion of the rails where the frames are pla ed (this is the only movementallowed), and b) ut in the region where the TOF photomultipliers are present (right).
Figure 5.32: Up: gas box used in November 2005 tests, featuring a ut in the region loseto the TOF photomultipliers. Down: detail of the region where the gas box and the TOFphotomultipliers are loser. The ut in the gas box is needed for avoiding that the two dete torsystems are inter-penetrated.

5.4. OTHER ISSUES 1113. The room for the FEE ele troni s: FEE will be pla ed at a region thatis shadowed by the magnet oils. This region results from the proje tionof the oils over the tRPC position, and is of no interest from the pointof view of the a eptan e. However, after fullling all the me hani al onstraints18, the available room renders as small as V ≃ 4 × 3 × 1 m3per hannel. It was de ided to pla e the FEE board parallel to the slantingsides of the gas box, allowing for an easier ooling of the ele troni s19. Inthat ase, the available area per hannel is approximately 1×4 m2 in thelow polar angle region (see g. 5.33).
Figure 5.33: View of the tRPC ells, proje ted over one of the slanting sides of the se tor.The distribution of ells orresponds to the design proposed at the lower polar angles, wherethe density of hannels is higher.In order to t to the available spa e it was de ided to pla e some of thene essary ele troni omponents, as voltage regulators, DAC thresholds,test signals and trigger logi in a dierent board that is pla ed in anorthogonal fashion (g. 5.34) still pla ed mostly under the shadow of themagnet.The ele troni boards are denoted by DBO (Daughter board) and MBO(Mother board), respe tively. The rst performs ampli ation, dis rimina-tion and harge measurement20 while the se ond ensures the distributionand stabilization of the power supply, the distribution of the thresholds ofthe omparators and the test signals, and a basi trigger logi that mustbe used for the multipli ity trigger of the experiment. Details on thisapproa h an be found in [87.18Mainly arising from the sizes of the ltering apa itors and the ne essary stru ture forinterfa ing the signal to the FEE itself.19For example, with fans blowing from θlab = 12 to θlab = 45 or vi e-versa.20Through the time over threshold of the integrated signal.
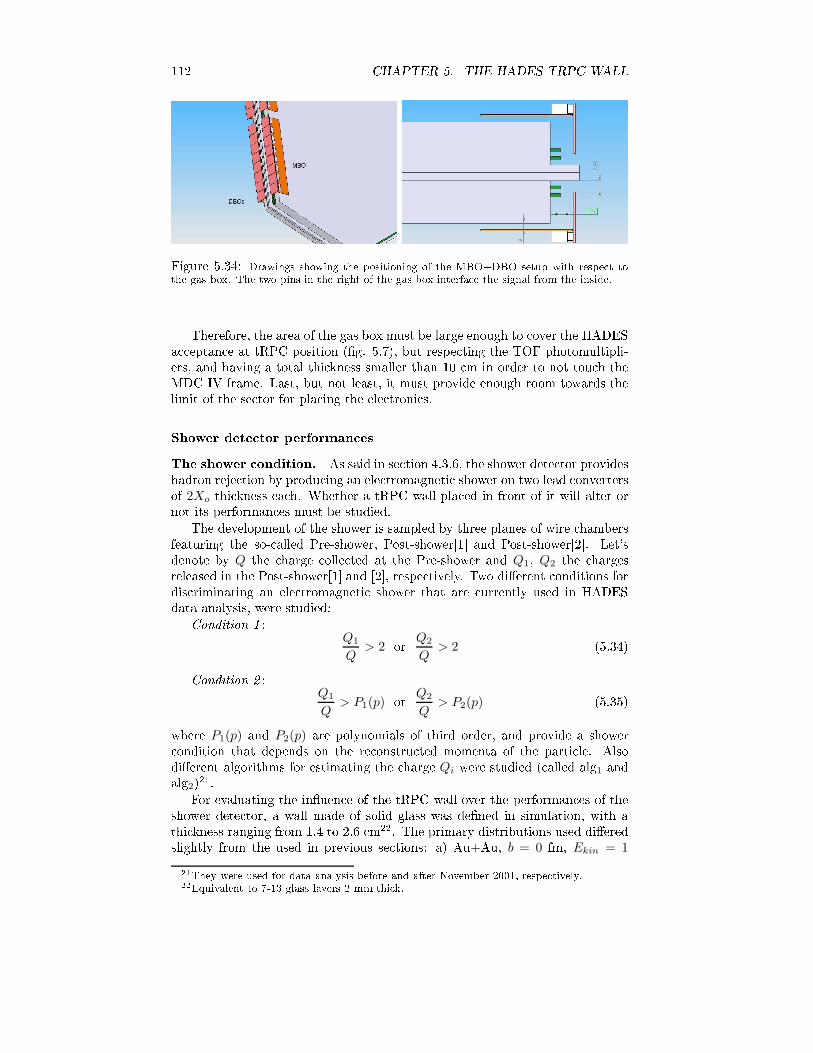
112 CHAPTER 5. THE HADES TRPC WALLFigure 5.34: Drawings showing the positioning of the MBO+DBO setup with respe t tothe gas box. The two pins in the right of the gas box interfa e the signal from the inside.Therefore, the area of the gas box must be large enough to over the HADESa eptan e at tRPC position (g. 5.7), but respe ting the TOF photomultipli-ers, and having a total thi kness smaller than 10 m in order to not tou h theMDC IV frame. Last, but not least, it must provide enough room towards thelimit of the se tor for pla ing the ele troni s.Shower dete tor performan esThe shower ondition. As said in se tion 4.3.6, the shower dete tor provideshadron reje tion by produ ing an ele tromagneti shower on two lead onvertersof 2Xo thi kness ea h. Whether a tRPC wall pla ed in front of it will alter ornot its performan es must be studied.The development of the shower is sampled by three planes of wire hambersfeaturing the so- alled Pre-shower, Post-shower[1 and Post-shower[2. Let'sdenote by Q the harge olle ted at the Pre-shower and Q1, Q2 the hargesreleased in the Post-shower[1 and [2, respe tively. Two dierent onditions fordis riminating an ele tromagneti shower that are urrently used in HADESdata analysis, were studied:Condition 1 :
Q1
Q> 2 or Q2
Q> 2 (5.34)Condition 2 :
Q1
Q> P1(p) or Q2
Q> P2(p) (5.35)where P1(p) and P2(p) are polynomials of third order, and provide a shower ondition that depends on the re onstru ted momenta of the parti le. Alsodierent algorithms for estimating the harge Qi were studied ( alled alg1 andalg2)21.For evaluating the inuen e of the tRPC wall over the performan es of theshower dete tor, a wall made of solid glass was dened in simulation, with athi kness ranging from 1.4 to 2.6 m22. The primary distributions used dieredslightly from the used in previous se tions: a) Au+Au, b = 0 fm, Ekin = 121They were used for data analysis before and after November 2001, respe tively.22Equivalent to 7-13 glass layers 2 mm thi k.

5.4. OTHER ISSUES 113GeV/A and b) isotropi distribution in the .o.m.23 of di-leptons oming fromthe de ay of the φ meson, boosted to a beam energy Ekin=1.5 GeV.The radiation length. Both the development of an ele tromagneti showerand the dee tion of a harged parti le due to multiple s attering in a mediumare related to the radiation length Xo. These two ee ts are expe ted to modifythe shower dete tor performan es, as a fun tion of the total number of radiationlengths of the material pla ed in front (x/Xo):1. If an important fra tion of the ele tromagneti shower development takespla e already at the tRPC wall, onditions 5.34 and 5.35 an hange.2. The nal distribution of angles after multiple (ele tromagneti ) s atteringis given, approximately, by a Gaussian distribution with sigma ∆θ givenby:∆θ =
13.6MeVβcp
√
x/Xo [1 + 0.038 ln(x/Xo)] (5.36)a ording to [3. If the number of radiation lengths in the tRPC wall isvery large, the s attered angle an result in a wrong estimate of the hargein the pads of the Post-shower dete tors and even the loss of the parti lewithin the a eptan e of the shower dete tor.The equivalent thi knesses in radiation lengths of the dete tors under study are,approximately:x
Xo
∣
∣
∣
∣
TOFino
≃ 0.5
42.4= 0.012 (5.37)
x
Xo
∣
∣
∣
∣
RPC
.2.6
12.3= 0.21 (5.38)
x
Xo
∣
∣
∣
∣
Post−shower
= 2 (5.39)(5.40)What matters for the following dis ussion are orders of magnitude: therefore,the aluminum used for the ele trodes (Xo ≃ 8.9 m) and the glass (Xo ≃ 12.3)are regarded as if they were the same material.There is a signi ant in rease in the fra tion of radiation lengths for thetRPC wall as ompared to the urrent TOFino wall (×20) but still mu h smallerthan the 2 radiation lengths of any of the Post-shower lead onverters. Thispoints to a small ee t over the shower onditions 5.34 and 5.35.On the other hand, larger s attered angles are also expe ted as omparedto the TOFino wall, but still at the level of ∆θ . 3.5 for p > 100 MeV (eq.5.36). This fa t, added to the high proximity between the shower dete tor andthe tRPC, suggests that the inuen e of the multiple s attering is small.Results. The PID apabilities are ompared in g. 5.35 for the presentTOFino wall (dashed) and a 1.8-2.6 m thi k wall made of glass. The result israther on lusive: the inuen e of the material budget in front of the shower23Center of mass frame.

114 CHAPTER 5. THE HADES TRPC WALLdete tor has little inuen e on its PID apabilities, despite a marginal worseningat low momenta for hadrons. This, in fa t, improves the situation, by redu ingthe amount of fakes.
Figure 5.35: Shower identi ation e ien y and fake probability (namely, shower PID apabilities) for leptons, pions and protons by using dierent algorithms for estimating the harge Q (alg1 or alg2) and also dierent `shower' onditions ( ond1 or ond2). The two linesshows the responses for the TOFino (dashed) and for a wall of glass 1.8 m thi k (thi k line).Also shown is the inuen e of a thi kness of 2.6 m on the proton fake probability (alg1, ond1), where a tiny ee t an be appre iated at low momenta.In g. 5.36 the fra tion of tra ks that rossed the tRPC but ould not bemat hed to any hit in the Pre-shower are shown, and ompared with the TOFino ase. The inuen e on the Pre-shower ine ien y for lepton dete tion is at thelevel of a few per ent.As a on lusion, the repla ement of the TOFino by the tRPC wall does notseem to perturb signi antly the performan es of the shower dete tor.
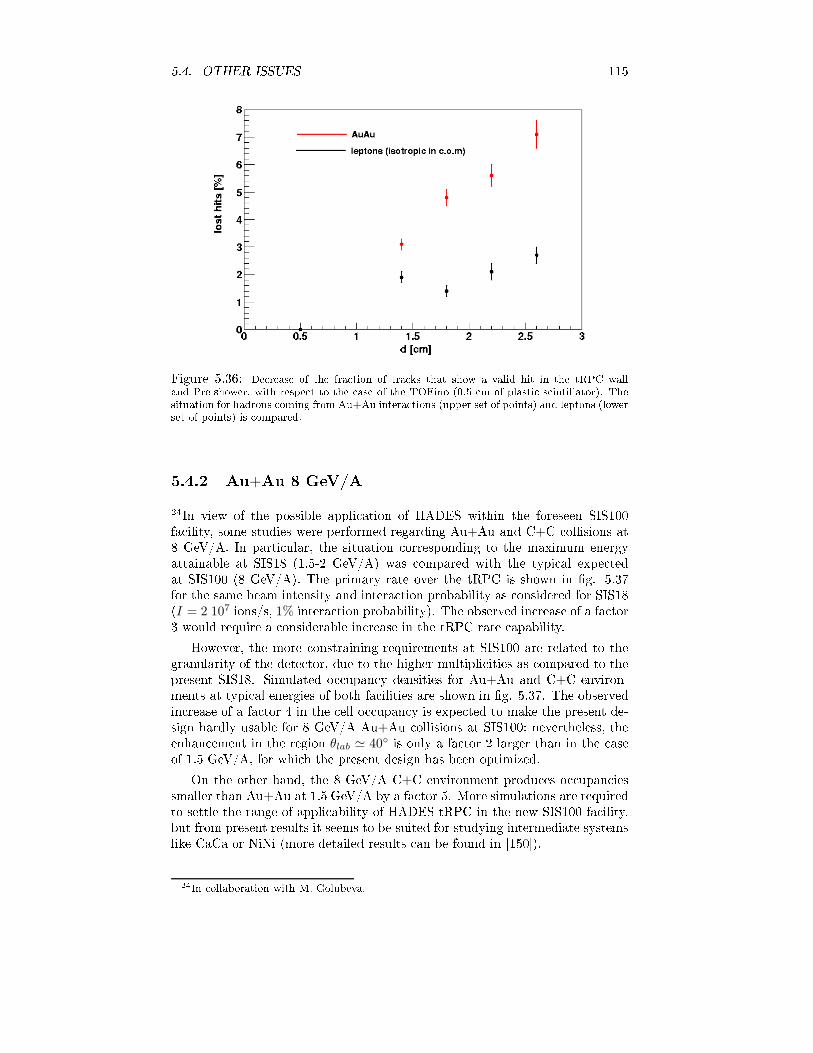
5.4. OTHER ISSUES 115
Figure 5.36: De rease of the fra tion of tra ks that show a valid hit in the tRPC walland Pre-shower, with respe t to the ase of the TOFino (0.5 m of plasti s intillator). Thesituation for hadrons oming from Au+Au intera tions (upper set of points) and leptons (lowerset of points) is ompared.5.4.2 Au+Au 8 GeV/A24In view of the possible appli ation of HADES within the foreseen SIS100fa ility, some studies were performed regarding Au+Au and C+C ollisions at8 GeV/A. In parti ular, the situation orresponding to the maximum energyattainable at SIS18 (1.5-2 GeV/A) was ompared with the typi al expe tedat SIS100 (8 GeV/A). The primary rate over the tRPC is shown in g. 5.37for the same beam intensity and intera tion probability as onsidered for SIS18(I = 2 107 ions/s, 1% intera tion probability). The observed in rease of a fa tor3 would require a onsiderable in rease in the tRPC rate apability.However, the more onstraining requirements at SIS100 are related to thegranularity of the dete tor, due to the higher multipli ities as ompared to thepresent SIS18. Simulated o upan y densities for Au+Au and C+C environ-ments at typi al energies of both fa ilities are shown in g. 5.37. The observedin rease of a fa tor 4 in the ell o upan y is expe ted to make the present de-sign hardly usable for 8 GeV/A Au+Au ollisions at SIS100; nevertheless, theenhan ement in the region θlab ≃ 40 is only a fa tor 2 larger than in the aseof 1.5 GeV/A, for whi h the present design has been optimized.On the other hand, the 8 GeV/A C+C environment produ es o upan iessmaller than Au+Au at 1.5 GeV/A by a fa tor 5. More simulations are requiredto settle the range of appli ability of HADES-tRPC in the new SIS100 fa ility,but from present results it seems to be suited for studying intermediate systemslike CaCa or NiNi (more detailed results an be found in [150).24In ollaboration with M. Golubeva.
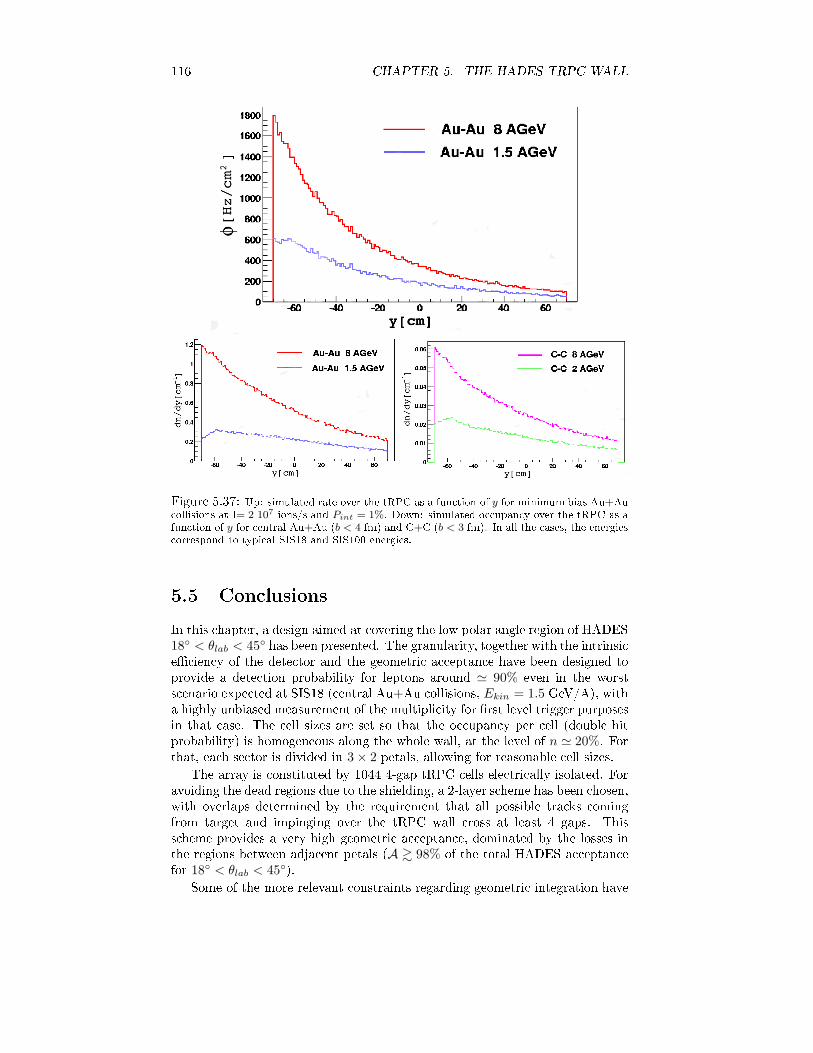
116 CHAPTER 5. THE HADES TRPC WALL
Figure 5.37: Up: simulated rate over the tRPC as a fun tion of y for minimum bias Au+Au ollisions at I= 2 107 ions/s and Pint = 1%. Down: simulated o upan y over the tRPC as afun tion of y for entral Au+Au (b < 4 fm) and C+C (b < 3 fm). In all the ases, the energies orrespond to typi al SIS18 and SIS100 energies.5.5 Con lusionsIn this hapter, a design aimed at overing the low polar angle region of HADES18 < θlab < 45 has been presented. The granularity, together with the intrinsi e ien y of the dete tor and the geometri a eptan e have been designed toprovide a dete tion probability for leptons around ≃ 90% even in the worsts enario expe ted at SIS18 ( entral Au+Au ollisions, Ekin = 1.5 GeV/A), witha highly unbiased measurement of the multipli ity for rst level trigger purposesin that ase. The ell sizes are set so that the o upan y per ell (double hitprobability) is homogeneous along the whole wall, at the level of n ≃ 20%. Forthat, ea h se tor is divided in 3 × 2 petals, allowing for reasonable ell sizes.The array is onstituted by 1044 4-gap tRPC ells ele tri ally isolated. Foravoiding the dead regions due to the shielding, a 2-layer s heme has been hosen,with overlaps determined by the requirement that all possible tra ks omingfrom target and impinging over the tRPC wall ross at least 4 gaps. Thiss heme provides a very high geometri a eptan e, dominated by the losses inthe regions between adja ent petals (A & 98% of the total HADES a eptan efor 18 < θlab < 45).Some of the more relevant onstraints regarding geometri integration have

5.5. CONCLUSIONS 117been dis ussed, together with the solutions for ea h ase.Preliminary studies on the feasibility of the present tRPC wall within theforth oming SIS100 a elerator have been dis ussed, suggesting that operationat intermediate nu lei masses is possible, but further simulations are required.The maximum expe ted rates at HADES in Au+Au ollisions at 1.5 GeV/A(Φ = 700 Hz/ m2) are slightly above the ones aordable by ordinary glass timingRPCs. A pra ti al solution to this potential problem, based on the moderatewarming of the glass, is given in hapter 8.A mu h more detailed do ument, in luding full me hani al integration anddetailed design, onstitutes the Te hni al Design Report of the ESTRELA-HADES proje t and it an be found elsewhere.


Chapter 6Performan e of HADEStRPCs6.1 Introdu tionA previous work of the group of P. Fonte [47 showed the viability of buildingtiming RPCs of large sizes (160 × 5 m2), with a time resolution in the range50-75 ps σ and an e ien y above 95% up to rates of 140 Hz/ m2, showinga reasonable homogeneity along the dete tor length. The performan es wereslightly worst than previous designs [46 based on small ells, possibly due tothe higher me hani omplexity and also to the in rease in the propagationdistan es. However, the overall performan es shown in [47 ould be onsideredas a proof of prin iple for a timing RPC wall based on long ells.It must be re alled that, for the measurements performed in [47, a pulsedmono hromati pion beam was used at CERN PS (0.3 s per spill, spa ed afew se onds) of Ekin = 3.5 GeV (γβ ≃ 30)1. Despite the relative su ess of thedevelopment, some drawba ks and questions were already posed by the authors:1. Cross-talk : ross-talk above 80% between neighboring ells was observed.2. Favorable environment : the tRPC operation was fa ilitated due to theuse of a mono-energeti beam. Typi al experiments in parti le and nu learphysi s deal with a broad range of energies and parti le spe ies, resulting indierent ionizations. This represents a potential sour e of problems, that ould result in an undesirable in rease of streamers or a lower e ien y,if not both2.3. Pulsed beam: the short duration of the beam spill (0.3 s) is smaller thanthe typi al time onstant of oat glass, τg ∼ s. It is shown in hapter 9how this fa t introdu es a bias in the observed performan es, impeding adire t extrapolation to equal instantaneous rates but longer spills3.1Above the MIP's dip. Due to the very slow growth of the Bethe-Blo h ionization urve,they are denoted as MIPs in [47.2An in rease in the fra tion of streamers would worsen the tRPC rate apability. Theproblem an be solved by de reasing the applied voltage but then the tRPC performan es arepartially sa ri ed.3Typi al spills in HADES are 5-10 s long.119
120 CHAPTER 6. PERFORMANCE OF HADES TRPCS6.1.1 Cross-talkA detailed study on ele tromagneti propagation on resistive plate hambers an be found in [65. There it is argued that, for high lengths, a tRPC ell an be onsidered as an inhomogeneous transmission line4. In su h a ase, ifthe pi k-up strips are not inter onne ted and a fast amplier with low inputresistan e is used, the modal dispersion of the signal propagated in reases withthe distan e from the amplier, resulting in a perfe tly bipolar ross-talk signal(zero indu ed harge). This observation is in agreement with the measurementsof [47 (D=160 m), where a large bipolarity is observed on the ross-talk signals,not transporting sizable harge.The ee t is dierent from the one observed in ongurations with segmentedele trodes, where the same avalan he indu es urrent (and net harge) overtwo or more pi k-up strips at the same time. In fa t, a general situation willhave ontributions with both origins (indu tion during avalan he formation andindu tion during signal propagation) .In [47, around 80-90% of the hits indu ed ross-talk on the neighboring ell. As a onsequen e, the ee tive o upan y of the system is in reased,rising doubts about the possibility of appli ation in a multi-hit environment5.For illustration, let's onsider the average number of hits in a ell per primaryintera tion (o upan y) to be n, and let's also assume that the distribution ofthe number of hits over the ell follows a Poisson distribution (see se tion 5.2.3),the ross-talk probability is denoted by Pcross and N is the number of neighborsper ell. Then, the probability that a ell is empty (able for dete tion) is givenby:P0 = e−n (6.1)If N neighbors are indu ing ross-talk with a probability Pcross, the ee tiveo upan y of the ell will in rease, yielding:
P0 = e−n(1+NPcross) (6.2)Typi al design riteria is n = 20% and N = 2 (see hapter 5). Therefore, for80% of ross-talk, a de rease in P0 from 82% to less than 60% will be expe ted.As said, the immediate ee t of ross-talk is to arti ially in rease the o - upan y. However, there is another more `subtle' ee t that takes pla e evenif ross-talk is not high enough to trigger the omparator. In that ase, theo upan y will not be in reased, but ross-talk will still introdu e u tuationson the signal base-line of the neighbor ell, possibly modifying the timing of ahit that arrives slightly after.A way to redu e ross-talk ee ts was suggested by FOPI ollaboration[86; they minimized the signal ree tions below 2% by setting the dete torimpedan e to 50 ± 1 Ω, exa tly as for the ele troni stage. Even if impedan emat hing does not make ross-talk disappear, it redu es its inuen e. However,impedan e mat hing is not an easy option in a situation where dierent ellwidths (namely, dierent impedan es) are involved.4I.e., the faster omponents of a signal indu ed on the tRPC ele trode have amplitudes hanging signi antly within a given propagation line of length D (i.e.: λ . D). In parti ular,for GHz omponents, and assuming a propagation velo ity vprop = 2/3c, the ell an be onsidered as a transmission line if D & 20 m.5I.e., several neighboring ells ring simultaneously within the same primary ollision.
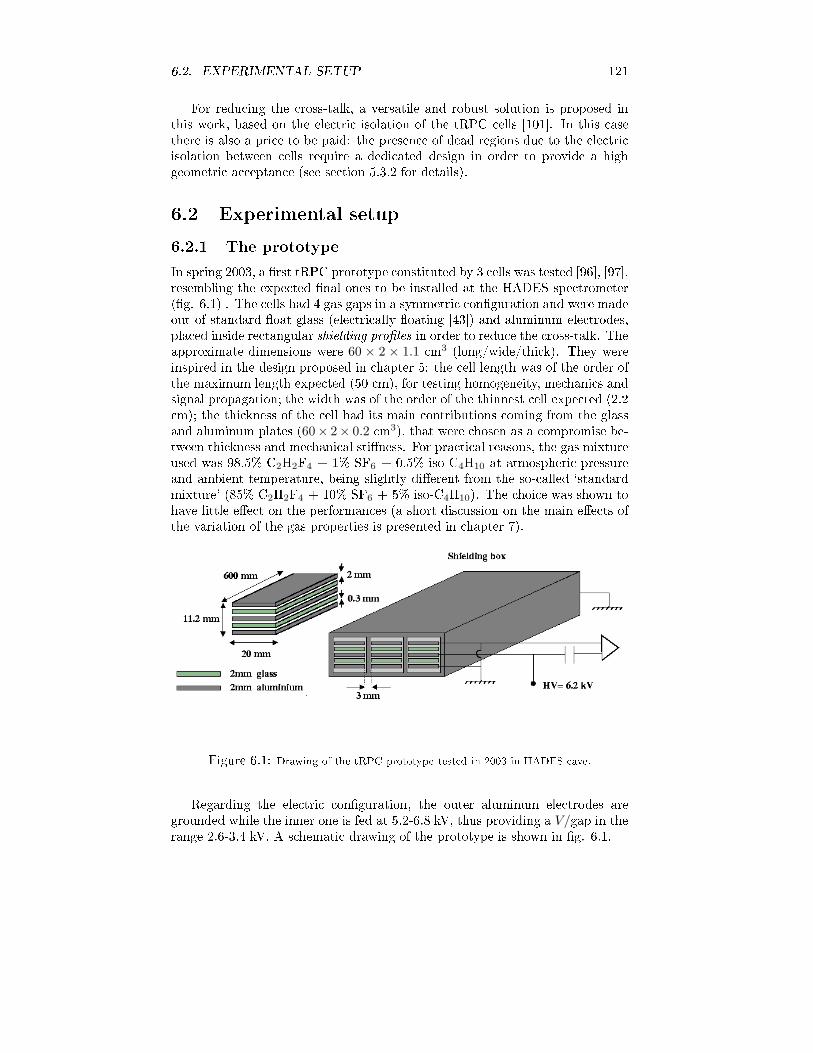
6.2. EXPERIMENTAL SETUP 121For redu ing the ross-talk, a versatile and robust solution is proposed inthis work, based on the ele tri isolation of the tRPC ells [101. In this asethere is also a pri e to be paid: the presen e of dead regions due to the ele tri isolation between ells require a dedi ated design in order to provide a highgeometri a eptan e (see se tion 5.3.2 for details).6.2 Experimental setup6.2.1 The prototypeIn spring 2003, a rst tRPC prototype onstituted by 3 ells was tested [96, [97,resembling the expe ted nal ones to be installed at the HADES spe trometer(g. 6.1) . The ells had 4 gas gaps in a symmetri onguration and were madeout of standard oat glass (ele tri ally oating [43) and aluminum ele trodes,pla ed inside re tangular shielding proles in order to redu e the ross-talk. Theapproximate dimensions were 60 × 2 × 1.1 m3 (long/wide/thi k). They wereinspired in the design proposed in hapter 5: the ell length was of the order ofthe maximum length expe ted (50 m), for testing homogeneity, me hani s andsignal propagation; the width was of the order of the thinnest ell expe ted (2.2 m); the thi kness of the ell had its main ontributions oming from the glassand aluminum plates (60× 2× 0.2 m3), that were hosen as a ompromise be-tween thi kness and me hani al stiness. For pra ti al reasons, the gas mixtureused was 98.5% C2H2F4 + 1% SF6 + 0.5% iso-C4H10 at atmospheri pressureand ambient temperature, being slightly dierent from the so- alled `standardmixture' (85% C2H2F4 + 10% SF6 + 5% iso-C4H10). The hoi e was shown tohave little ee t on the performan es (a short dis ussion on the main ee ts ofthe variation of the gas properties is presented in hapter 7).
Figure 6.1: Drawing of the tRPC prototype tested in 2003 in HADES ave.Regarding the ele tri onguration, the outer aluminum ele trodes aregrounded while the inner one is fed at 5.2-6.8 kV, thus providing a V/gap in therange 2.6-3.4 kV. A s hemati drawing of the prototype is shown in g. 6.1.
122 CHAPTER 6. PERFORMANCE OF HADES TRPCSThe previous des ription is general and does not in lude a number of smalldieren es between the 3 tRPC ells tested:1. tRPC I: glass ele trodes. 1.9 m wide.2. tRPC II: aluminum ele trodes. 1.7 m wide.3. tRPC III: aluminum ele trodes. Twi e the density of spa ers (test of theme hani s). 1.9 m wide.The ells were insulated from the walls of the shielding proles with PVCtape. For tRPC II (inner), a opper strip was interposed in a `sandwi h'tape+ opper+tape, whose read-out is shaped, amplied and sent to an ADC.The idea of this onguration was to estimate the ee t of the signal indu edto the walls as ompared with the indu tion over the ele trodes. This ee t is akind of `edge ee t' des ribed in [101 as loss of indu ed harges, and ould beof importan e when the avalan he is produ ed lose to the shielding walls (seese tion 6.6.1 for the analysis of these data).A front and side pi ture of the prototype is shown in g. 6.2. Ea h ell is arefully a ommodated inside the shielding prole to avoid unne essary stressover the glass. Inside the gas box, a apa itor of 1 nF is pla ed in order to lterthe signal indu ed, that is later on interfa ed to the outer part of the box, wherethe Front End Ele troni s (FEE) is dire tly atta hed.6.2.2 The a quisition systemThe des ription of the FEE stage is shown in g. 6.3 (more details an be foundelsewhere [151). The tRPC signal goes through 2 ampli ation stages and thenit is split for dis rimination (timing) and buering ( harge measurements).The FEE board is terminated at 50 Ω, and referred to the ground of thebox itself ( ommon ground). The double-end le ture (tL
= tLeft
, tR
= tRight
)allowed for a position independent estimate of the time of ight and position ofthe impinging parti le:t =
tL
+ tR
2− to (6.3)
x =t
L− t
R
2vprop (6.4)where vprop is the velo ity of the indu ed signal and to the referen e time.The FEE was pla ed at one end of the gas box, and the furthermost end ofthe ell delivered the signal through a long able up to the part where the FEEis pla ed6. The analog tRPC signal and the digital signal from the omparatorare then delivered to a 2249W Le roy ADC (200 ns window) and a fast 2228Le roy TDC (50 ps bin) based on the CAMAC standard.The ell is not adapted to the FEE ele troni stage, resulting in the ap-pearan e of ree tions with periodi ity 2D/vprop (D=60 m is the ell length),whi h are able to re-trigger the omparator several times before falling belowthreshold, therefore perturbing the system. For avoiding these spurious ontri-butions but also possible re-triggerings oming from the ion tail, a dead-timeof 1µs is implemented in the omparator. At the typi al operating voltages ofaround 3 kV/gap, the threshold of the omparator was set lose to 10 mV.6See hapter 5 for a des ription of the abling in the latest design.

6.2. EXPERIMENTAL SETUP 123
Figure 6.2: Front view of the 3- ell prototype. The left-most ell was repla ed by one havingglass ele trodes (RPC I). In the lower photograph the tRPC ells are shown before pla inginside the shielding prole.
Figure 6.3: Figure showing the full ele troni hain. Further details an be found in [151.

124 CHAPTER 6. PERFORMANCE OF HADES TRPCS6.2.3 The trigger system1. The position within the spe trometer : for this test, it was de ided to overa region at the lowest polar angles of the foreseen tRPC wall, be auseof the higher rates expe ted there (g. 5.8). A drawing showing theorientation of the experimental setup in HADES an be seen in g. 6.4;nally, the tRPC was pla ed at approximately 20 from the beam line,taking as referen e the nominal target position.2. The teles ope: the trigger line was dened with the help of two fast Bi rons intillators (BC-420) with dimensions 8×2×3 m3, pla ed orthogonally atboth sides of the tRPC gas box as shown in g. 6.4. They are denoted bys in1 (tRPC upstream, perpendi ular to it) and s in2 (tRPC downstream,parallel to it), dening a trigger area of, approximately, 2×2 m2. In orderto redu e the probability of random oin iden es, a third oin iden e witha s intillator of ylindri al shape and radius r = 1.25 m (s in3) wasrequired, providing the trigger ondition T :T = T1 ⊗ T2 ⊗ T3 (6.5)The referen e s intillators 1 and 2 allow to obtain a time resolution asgood as σ
T= 35 ps for MIPs [47, and they were pla ed in a symmetri onguration with respe t to the tRPC gas box, a de ision dis ussed alongthe following points.3. The on-line positioning : it was made use of a teles ope mount [152 whoseorientation ould be dened remotely by xing 2 angles (de lination andright as ension), that allow to dene a straight line for astronomi obser-vations. The setup was modied from its original purpose, as illustratedin g. 6.4 and 6.5, and the rotations along the 2 angles were used to denea trigger line pointing to the target. This situation, where the trigger linepoints to the target, was identied by hosing dierent orientations andlooking for that one yielding the maximum number of triggers.4. The referen e s intillators : for avoiding ee ts due to the time spreadof the bulk of parti les, the intrinsi time response of the two referen es intillators was estimated by pla ing them as lose as possible. It wasimposed a soft quality ut for sele ting `good s intillator events', namely uts 1 (position) and 2 ( harge) a ording to the onventions of se tion6.4.1. The s intillator time response obtained under these onditions isshown in g. 6.6, yielding a ombined resolution σ
T
∣
∣
scin= 50 ps (namely,
σT
∣
∣
scin=
√352 + 352 ps) in a ordan e with [47.

6.2. EXPERIMENTAL SETUP 125
Figure 6.4: Up: position of the setup relative to the HADES spe trometer. Down: s hemeof the dierent movements that are allowed within the setup used. `Global' stands for ommonmovements of the teles ope and the tRPC, whereas `RPC' stands for independent movementsof the tRPC.

126 CHAPTER 6. PERFORMANCE OF HADES TRPCS
Figure 6.5: tRPC gas box (left) and in-beam setup (right). In the latter, the teles opemount is shown, after adapted to handle the gas box and the trigger line dened by the refer-en e s intillators. Also shown the fast re tangular s intillators s in1 and s in2 (bla k, tRPCupstream) and the ylindri one s in3 (grey, tRPC downstream). In the nal ongurationthe fast s intillators were pla ed symmetri ally respe t to the gas box, as shown in g. 6.4.
−1000 −500 −300 0 300 500 100010
0
101
102
Time difference [ps]
Eve
nts
[in 1
0 ps
bin
]
σT = 49.5 ps
3−σ tails = 4.7%
300ps tails = 0.6%
Events = 6911
Figure 6.6: Time response of the referen e s intillators.

6.2. EXPERIMENTAL SETUP 1275. The time distribution of the bulk of parti les : a typi al tof distribution ofthe parti les impinging over the tRPC is shown in g. 6.7. It has beenobtained with the referen e s intillators, measuring over a distan e of 18 m between s intillator enters. The ondition of a valid hit in the tRPChas been also imposed.
-400 -200 0 200 400 600 800 10000
1000
2000
3000
4000
5000
6000
= 105 psTσ
L = 14 cm
time of flight [ps] (centered at zero)
cou
nts
[in
15
ps
bin
]
Figure 6.7: Time of ight spe trum measured with the referen e s intillators for a separationof 18 m between enters. The distribution has been shifted to have the zero at the positionof the peak.The time spread of the bulk of parti les was mu h larger than the intrin-si tRPC time response, requiring a dedi ated setup for the estimate ofthe timing performan es. For that purpose, a symmetri onguration is hosen, being the referen e s intillators pla ed symmetri ally at the samedistan e from the tRPC (making in total L = 18 m between enters).In that ase, the average tof between them an be ompared with thetof measured between one s intillator and the RPC, providing a highlyunbiased estimate of the time resolution:
∆tscin−RPC = (tRPC
− t1) −t2 − t1
2= t
RPC− t2 + t1
2(6.6)
σ2T
= σT
∣
∣
2
RP C+
1
4σ
T
∣
∣
2
scin(6.7)and the intrinsi time response of the tRPC, σ
T
∣
∣
RP C, an be determinedfrom the measured σ
Tand the ombined resolution of the referen e s in-tillators σ
T
∣
∣
scin= 50 ps.In the following se tions it is shown that the peak in g. 6.7 orresponds,a tually, to parti les traveling at the speed of light. Therefore, the times
128 CHAPTER 6. PERFORMANCE OF HADES TRPCSlower than zero must ome from the time resolution of the referen e s intil-lators. As indi ated in the gure, a value of σT≃ 100 ps is obtained froma dire t t, indi ating that some extra ontribution may be present in thetiming referen e, when measuring in that situation (L = 18 m between enters). When substituted in eq. 6.6, the dieren e between onsidering
σT
∣
∣
scin= 50 ps or σ
T
∣
∣
scin= 100 ps on the estimate of the tRPC resolutionis around 10-15 ps, for typi al measured values of σ
T= 85 ps7. In thefollowing, the onservative onvention of taking, as referen e, the nominals intillator resolution at zero distan e σ
T
∣
∣
scin= 50 ps (g. 6.6) will beadopted.6.3 The parti le environmentThe beam of primary nu lei was onstituted by C nu lei at Ekin = 1 GeV/A,expe ted to impinge over a C target with a thi kness equivalent to an intera tionprobability of 5%. However, a proper fo using of the beam over the target ouldnot be guaranteed.Measurements of the time distribution of the parti les were performed bypla ing the s intillators at dierent distan es (0, 4, 14, 20, 31 m), allowing foran estimate of the distribution of velo ities of the parti les. For that purpose,a Gaussian t at the maximum of the tof distribution was performed, and thetime at maximum and width of the distribution were represented in g. 6.8 as afun tion of the distan e between s intillators. Fig. 6.8 shows a linear trend, asexpe ted, indi ating that the Gaussian t provides a reasonable estimate of themaximum. Moreover, the t yielded a propagation velo ity of β = 0.97 ± 3 forthe parti les at the peak. It is also shown how the width of the s intillator timeresponse in reases fast with L (distan e of separation) from the value σ
T= 50ps, measured at L = 0 m, up to σ
T= 200 ps, at L = 30 m, due to the dierentparti le velo ities. This observation justies the use of a symmetri trigger, asdes ribed in previous se tion.6.3.1 β and γβ distributionsOn e β is estimated at maximum, it is possible to obtain the β distributionof all the parti les and ompare with the expe tations from simulation. Forthe latter, 3 s intillating plasti s of 3 m thi kness and an area of 40 × 40 m2were simulated at the position of the experimental setup, a ording to g. 6.4,with a separation of 18 m between enters. The large used areas provide highstatisti s over the region of interest, redu ing enormously the omputing time.For the generation of C+C ollisions at 1 GeV/A averaged over all possibleimpa t parameters, URQMD(1.2) was used [142. The distribution generatedwas propagated through the HADES geometry implemented with the transport ode HGeant/Geant [137, [138.The output of the simulation was evaluated for two s enarios:1. Distribution expe ted over the tRPC (minimum biased).7De reasing the ee t for higher values.

6.3. THE PARTICLE ENVIRONMENT 129
0 5 10 15 20 25 30 350
100
200
300
400
500
600
700
800
900
1000
1100
1200
Distance between scintillators [cm]
time
[ps]
time at maximumσ at maximum
βat maximum
= 0.97 ± 0.03
Figure 6.8: Time of ight at maximum as a fun tion of the distan e between the s intillatoredges. The time at zero distan e is dened as zero. From the slope of the t, the velo ityof propagation of the parti les populating the peak of the time distribution an be obtained.Squares show the width (σ) of the time distribution indi ating a broadening due to the dierentparti le velo ities.2. Distribution expe ted over the tRPC after fullling the trigger require-ments (valid signal in the three s intillating plasti s), and onvoluted witha s intillator time response of σT
∣
∣
scin= 50 ps.The omparison between data and simulation is shown in g. 6.9. The two urves to be dire tly ompared are the full and dashed ones. In the measureddata (full line) there is an ex ess towards β = 1, that an be attributed to leptonsfrom se ondary pro esses (as γ onversion), resulting from a bad fo using of thebeam. Some features are ommon to simulation and data: both distributionsare ut at β . 0.4 due to the energy lost in the rst two s intillators; on theother hand, a prominent peak is present at β ∼ 0.7 − 0.8 that is dominated byprotons a ording to simulation, and presumably also in data. In both ases, the orrelation observed between the harge released and the redu ed momentum
p/M = γβ is in qualitative agreement with a Bethe-Blo h distribution at lowvalues of γβ, as expe ted for heavy parti les (g. 6.10), while large values of βare mu h more s attered regarding energy deposition, suggesting that they aredominated by ele trons and positrons. The large population of leptons wouldalso point to the observation of rates higher than expe ted, an ee t dis ussedin the next se tion.It must be stressed that g. 6.9 also indi ates that there are dieren esbetween the minimum biased distribution of hits over the tRPC and the dis-tribution of triggered events. Whereas this fa t avoids to estimate the tRPCresponse for parti les with β < 0.4, it does not introdu e any important biasregarding the distribution of events that truly impinge over the tRPC. In other
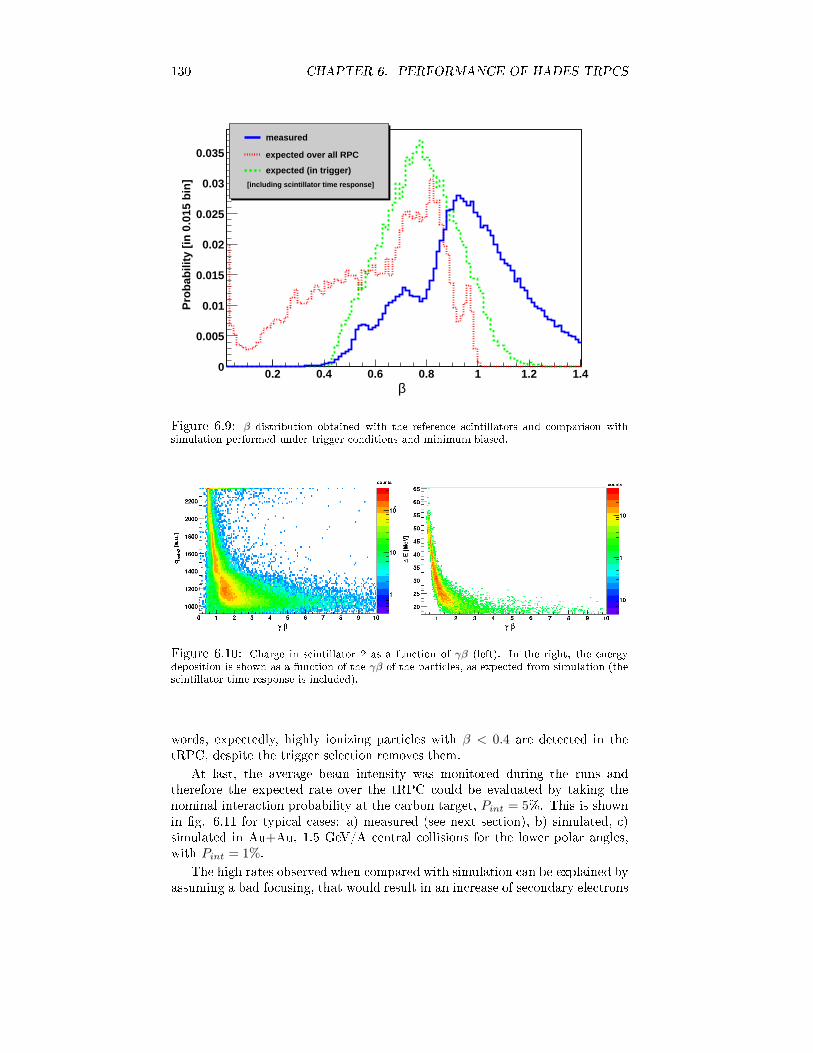
130 CHAPTER 6. PERFORMANCE OF HADES TRPCS
0.2 0.4 0.6 0.8 1 1.2 1.40
0.005
0.01
0.015
0.02
0.025
0.03
0.035measured
expected over all RPC
expected (in trigger)
[including scintillator time response]P
rob
abili
ty [
in 0
.015
bin
]
βFigure 6.9: β distribution obtained with the referen e s intillators and omparison withsimulation performed under trigger onditions and minimum biased.
Figure 6.10: Charge in s intillator 2 as a fun tion of γβ (left). In the right, the energydeposition is shown as a fun tion of the γβ of the parti les, as expe ted from simulation (thes intillator time response is in luded).words, expe tedly, highly ionizing parti les with β < 0.4 are dete ted in thetRPC, despite the trigger sele tion removes them.At last, the average beam intensity was monitored during the runs andtherefore the expe ted rate over the tRPC ould be evaluated by taking thenominal intera tion probability at the arbon target, Pint = 5%. This is shownin g. 6.11 for typi al ases: a) measured (see next se tion), b) simulated, )simulated in Au+Au, 1.5 GeV/A entral ollisions for the lower polar angles,with Pint = 1%.The high rates observed when ompared with simulation an be explained byassuming a bad fo using, that would result in an in rease of se ondary ele trons
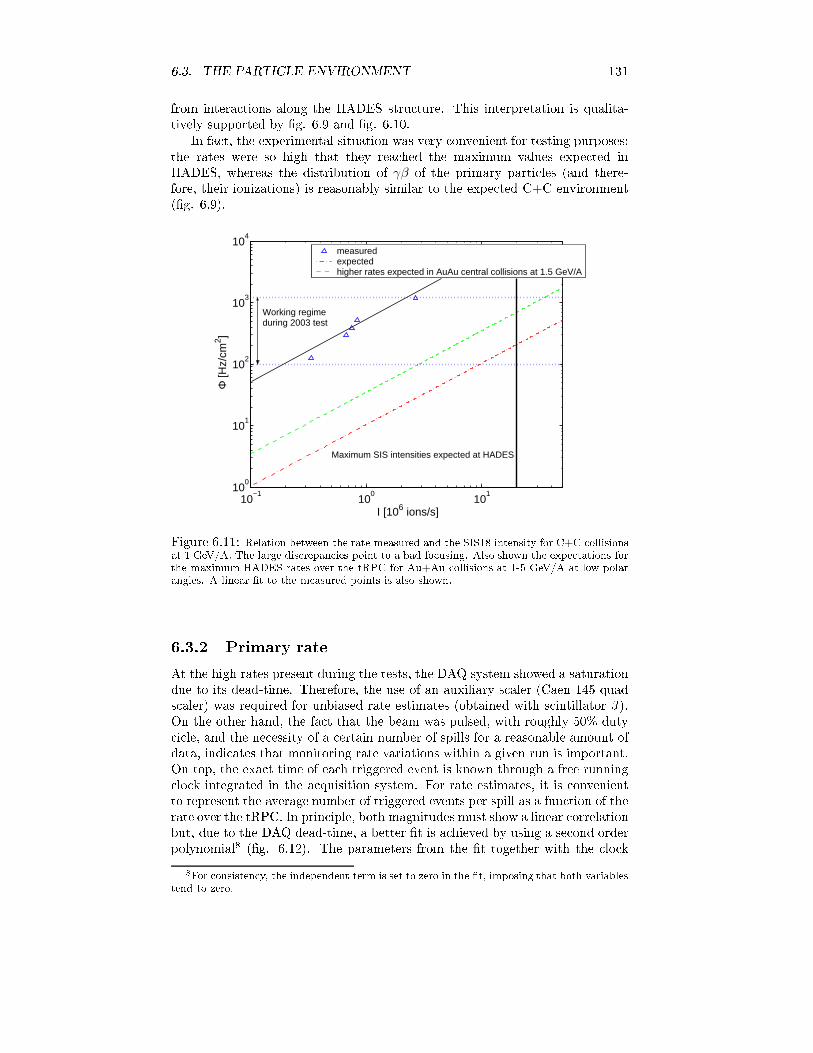
6.3. THE PARTICLE ENVIRONMENT 131from intera tions along the HADES stru ture. This interpretation is qualita-tively supported by g. 6.9 and g. 6.10.In fa t, the experimental situation was very onvenient for testing purposes:the rates were so high that they rea hed the maximum values expe ted inHADES, whereas the distribution of γβ of the primary parti les (and there-fore, their ionizations) is reasonably similar to the expe ted C+C environment(g. 6.9).
10−1
100
101
100
101
102
103
104
I [106 ions/s]
Φ [H
z/cm
2 ]
measuredexpectedhigher rates expected in AuAu central collisions at 1.5 GeV/A
Maximum SIS intensities expected at HADES
Working regime during 2003 test
Figure 6.11: Relation between the rate measured and the SIS18 intensity for C+C ollisionsat 1 GeV/A. The large dis repan ies point to a bad fo using. Also shown the expe tations forthe maximum HADES rates over the tRPC for Au+Au ollisions at 1-5 GeV/A at low polarangles. A linear t to the measured points is also shown.6.3.2 Primary rateAt the high rates present during the tests, the DAQ system showed a saturationdue to its dead-time. Therefore, the use of an auxiliary s aler (Caen 145 quads aler) was required for unbiased rate estimates (obtained with s intillator 3 ).On the other hand, the fa t that the beam was pulsed, with roughly 50% duty i le, and the ne essity of a ertain number of spills for a reasonable amount ofdata, indi ates that monitoring rate variations within a given run is important.On top, the exa t time of ea h triggered event is known through a free running lo k integrated in the a quisition system. For rate estimates, it is onvenientto represent the average number of triggered events per spill as a fun tion of therate over the tRPC. In prin iple, both magnitudes must show a linear orrelationbut, due to the DAQ dead-time, a better t is a hieved by using a se ond orderpolynomial8 (g. 6.12). The parameters from the t together with the lo k8For onsisten y, the independent term is set to zero in the t, imposing that both variablestend to zero.

132 CHAPTER 6. PERFORMANCE OF HADES TRPCS500 1000 1500 2000 2500 3000 3500
200
400
600
800
1000
1200
1400
events acquired per spill (average)
Φ [
Hz/
cm2 ]
0 5 10 15 20 250
200
400
600
800
1000
1200
1400
1600
1800
time [s]
Φ [H
z/cm
2 ]
Figure 6.12: Left: urve showing the orrelation between the average number of events perspill and the primary rate. Right: spill stru ture.allow to monitor the rate and spill stru ture within a given run, as shown in g.6.12 for one of the more intense illuminations (Φ = 1240 Hz/ m2 in average).The average spill duration is around 6 s.6.3.3 Spill time proleIt is important to understand the hara teristi s of the spill prole as a fun tionof time. The two more frequent ases are shown in g. 6.139.Both sets of data orrespond to an average rate of Φ ≃ 1200 Hz/ m2. Therst (left) shows a relatively uniform distribution of the spill while in the se ondthere is a rate redu tion with the spill time. Despite the dieren es, the analysisperformed in the following se tions has proved to be quite insensitive to theshape of the spill.445 450 455 460 465
0
100
200
300
400
500
600
700
800
time [s]
DA
Q c
ount
s [H
z]
0 5 10 15 20 250
100
200
300
400
500
600
700
800
900
1000
time [s]
DA
Q c
ount
s [H
z]
Figure 6.13: Two dierent spill proles for the same average primary rate of Φ ∼ 1200Hz/ m2.9Unstable runs with highly variable rates were also observed, standing for less than 5% ofthe total. They are disregarded.

6.4. ANALYSIS 1336.4 AnalysisAround 2 millions of events were taken under dierent onditions, and the inu-en e of the variables V (voltage), Φ (rate) and x (position) over the three tRPC ells was studied. Moreover, dedi ated runs with high statisti s were performedat xed values of these parameters, allowing studies on multi-hit apabilities,performan es for highly ionizing parti les, signal losses and self- alibration, thatare the subje t of some of the following se tions.Unless spe ied, the uts used are mainly related to the referen e s intil-lators, denoted as external uts (see next se tion). They must be performedin order to reje t random oin iden es, in lined parti les or edge ee ts, thatwould worsen the s intillator time response. These uts allow for the best tim-ing performan es of the referen e s intillators, yielding the distribution shownin g. 6.6, with σT
= 50 ps.Attention is fo used on the following observables: σT, 3-σ tails, ε, q
promptand Pstreamer (time resolution, events out of ±3σ from the time at maximum,e ien y, prompt harge in 200 ns and fra tion of streamers, respe tively).6.4.1 CutsExternal uts (referen e s intillators)1. Overows in the TDC as well as pedestals in the ADC for the signals ofany of the s intillators are removed.2. Parti les within ±2σ around the peak of the s intillator position distri-bution are sele ted, determined through the time dieren e between boths intillator ends. The ut redu es the fra tion of in lined tra ks (see g.6.14). In the following, y and x are used for referring to the position ins in1 and s in2, respe tively.3. Parti les within ±2σ around the peak of the harge distribution are se-le ted. The ut allows to get the best timing, allowing to redu e edgeee ts in the s intillators, that very likely produ e small amounts of light.See g. 6.14.Internal uts (tRPC)1. After external uts, the overows in the TDC and the harge pedestals inthe ADC ontribute to the measured ine ien y of the dete tor and theyare removed10.This set of uts is alled soft uts. An improvement was seen on timingproperties (spe ially a drasti redu tion in timing tails) by performing a ut inthe tRPC position at ±1σ around the peak. The improvement an be as ribedto the presen e of a small fra tion of in lined tra ks or random oin iden es inthe trigger. This set of soft- uts plus one on the tRPC position is denoted byhard uts ; the last are used only in se tion 6.6.2 in order to provide an idea ofthe nature of the tails.10The dieren e between time e ien y and harge e ien y was very small, having a ontribution oming from ross-talk events.

134 CHAPTER 6. PERFORMANCE OF HADES TRPCS
−10 −5 0 5 100
0.5
1
1.5
2
2.5
3
3.5
4
4.5
5x 10
4
y [cm]
coun
ts [i
n 0.
5 cm
bin
]
−10 −5 0 5 100
1
2
3
4
5
6
7x 10
4
x [cm]
coun
ts [i
n 0.
5 cm
bin
]
0 500 1000 1500 2000 25000
2000
4000
6000
coun
ts
0 500 1000 1500 2000 25000
2000
4000
6000
qscin2
[a.u.]
coun
ts
qscin1
[a.u.]
Figure 6.14: Up: quality uts performed on the s intillator position distribution (in on-tinuous line is the sele ted region). Down: quality uts performed on the s intillator hargedistribution (in ontinuous line the sele ted region). They are shown after the pedestal hasbeen subtra ted and the distributions re-s aled for showing an equivalent gain.
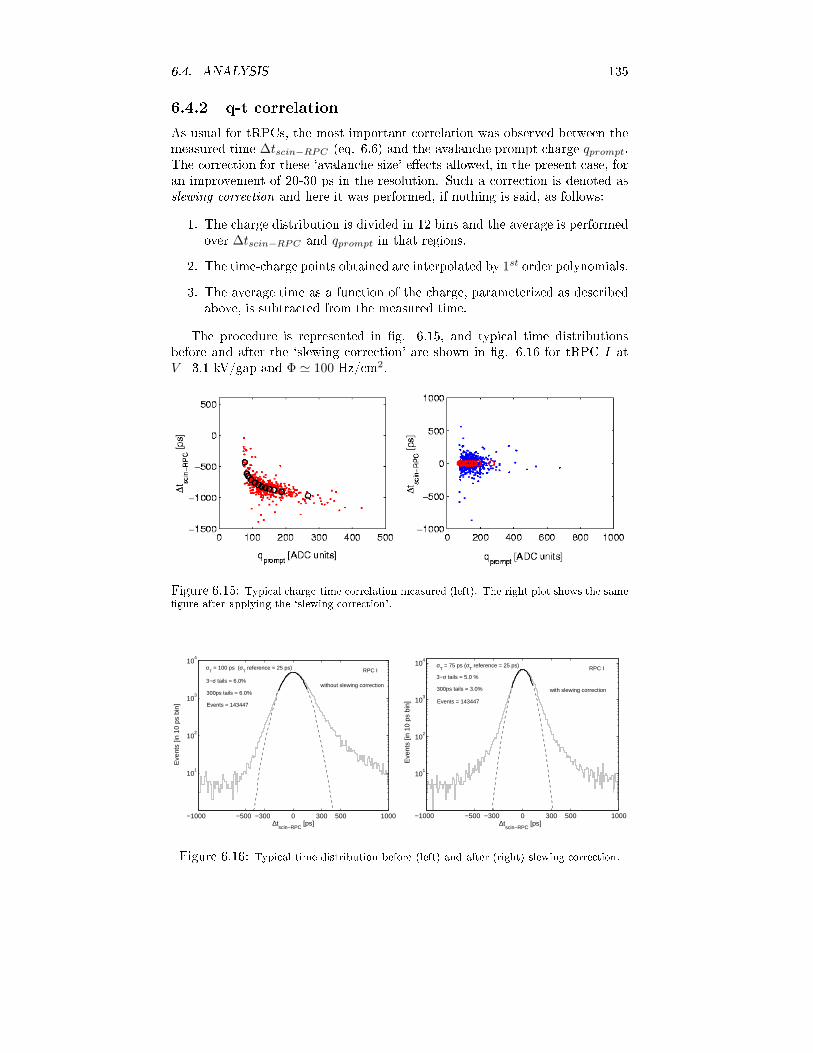
6.4. ANALYSIS 1356.4.2 q-t orrelationAs usual for tRPCs, the most important orrelation was observed between themeasured time ∆tscin−RPC (eq. 6.6) and the avalan he prompt harge qprompt.The orre tion for these `avalan he size' ee ts allowed, in the present ase, foran improvement of 20-30 ps in the resolution. Su h a orre tion is denoted asslewing orre tion and here it was performed, if nothing is said, as follows:1. The harge distribution is divided in 12 bins and the average is performedover ∆tscin−RPC and qprompt in that regions.2. The time- harge points obtained are interpolated by 1st order polynomials.3. The average time as a fun tion of the harge, parameterized as des ribedabove, is subtra ted from the measured time.The pro edure is represented in g. 6.15, and typi al time distributionsbefore and after the `slewing orre tion' are shown in g. 6.16 for tRPC I atV =3.1 kV/gap and Φ ≃ 100 Hz/ m2.
Figure 6.15: Typi al harge-time orrelation measured (left). The right plot shows the samegure after applying the `slewing orre tion'.
−1000 −500 −300 0 300 500 1000
101
102
103
104
∆tscin−RPC
[ps]
Eve
nts
[in 1
0 ps
bin
]
σT = 100 ps (σ
T reference = 25 ps)
3−σ tails = 6.0%
300ps tails = 6.0%
Events = 143447
without slewing correction
RPC I
−1000 −500 −300 0 300 500 1000
101
102
103
104
∆tscin−RPC
[ps]
Eve
nts
[in 1
0 ps
bin
]
σT = 75 ps (σ
T reference = 25 ps)
3−σ tails = 5.0 %
300ps tails = 3.0%
Events = 143447
with slewing correction
RPC I
Figure 6.16: Typi al time distribution before (left) and after (right) slewing orre tion.

136 CHAPTER 6. PERFORMANCE OF HADES TRPCS6.4.3 Time walksEle troni walks must be onveniently monitored for long term operation [153.In the present setup, runs were short enough so that the ee t of walks wasgenerally small and it was not ne essary to orre t for it. However, systemati shifts towards large times and small harges were observed, being orrelated withthe arrival of ea h spill (g. 6.17). The ee t is important for the higher ratesstudied, and it is shown in hapter 9 that it an be as ribed to the harging-uptime of the resistive plate, that takes pla e at the s ale of se onds.In identally, the orrelation appears in data also as a time- harge orrelationand its ee t is therefore redu ed after the `slewing orre tion' is performed.445 450 455 460 465
−1000
0
1000
time [s]
∆tsc
in−
RP
C [p
s]
445 450 455 460 4650
100
200
300
time [s]
q prom
pt [A
DC
uni
ts]
Figure 6.17: Ee t of the arrival of the spill over the harge and the time of ight measured,as a fun tion of the irradiation time. The average rate was Φ = 1200 Hz/ m2 and V = 3.1kV/gap.

6.5. DETECTOR PERFORMANCES 1376.5 Dete tor performan es6.5.1 Intrinsi e ien yFor a determination of the intrinsi tRPC e ien y, it is useful to study thebehavior of the e ien y as a fun tion of the position (x, y) in the referen es intillators. The study was performed for tRPC II, V =3.1 kV/gap, Φ ≃ 100Hz/ m2 (the lowest rates studied) without any ut. The 2-D prole of thetriggered events, together with the e ien y prole, are shown in g. 6.18. Thehigh statisti s of the run allow to state the following fa ts:1. Fig. 6.18 down: the proles of the three tRPCs an be learly seen inthe 2 dimensional s an, showing ine ient regions due to the shieldingbetween ells.2. Fig. 6.18 up: the trigger line was not rossing exa tly the enter of thetRPC II (as intended), but shifted around 1 m.3. Fig. 6.18 up: the position distribution of the triggered events had a major ontribution oming from a region A ≃ 2×2 m2, that would be expe tedif all the sele ted parti les travel in straight line and the position resolutionof the s intillator is not ontributing. The presen e of sizable tails out ofthese regions indi ates that, with some probability, in lined tra ks fullledthe trigger requirements.In g 6.19, an enlightening 1-D plot of the e ien y as a fun tion of theposition in s intillator 1 (y) is presented.From the entral peak, an intrinsi e ien y above ε = 95% per ell anbe inferred. The peaks with high dete tion probability out of the inner ±1 mare due to in lined tra ks that ross tRPC I or III ; on the other hand, thevalleys with e ien ies around ε = 60 − 70% are produ ed by the dead regionsof around 3 mm required for the shielding proles. It is observed that, due tothe presen e of in lined tra ks in the trigger, the ine ient region extends along≃ 2 m per side. If only straight tra ks were sele ted, the expe ted dead regionwould be as small as 3 mm (see g. 6.1), showing a lean zero value for thee ien y.Despite the large intrinsi e ien y, the overall tRPC e ien y obtained forall the triggered events is ε = 75%, dominated by the dead regions. Due tothe fa t that the ine ient regions are shared with the neighbors, the following onvention was adopted: the tRPC ell e ien y is estimated by onsideringonly the ontribution of one half of the ine ien y measured (in the absen e of uts). In this way, an estimate of the tRPC ell e ien y of ε ≃ 87%, in ludinggeometri ee ts, is obtained, as ompared with the intrinsi tRPC e ien yat the level of & 95%. The estimate of the intrinsi e ien y requires of enoughstatisti s to perform a meaningful study as a fun tion of the s intillator positionand, moreover, does not represent a true estimate of the e ien y of this tRPCsystem. Therefore, the tRPC ell e ien y is preferred in the following.The intrinsi e ien y determined is still smaller than the values lose to99% measured with similar dete tor ongurations ([153, for instan e). It mustbe re alled that, with the setup used and due to the presen e of a small fra tionof in lined tra ks, it was not possible to get an unbiased measurement of theintrinsi e ien y, but rather a lower limit.

138 CHAPTER 6. PERFORMANCE OF HADES TRPCS
0
50
100
150
200
250
300
350
-4 -3 -2 -1 0 1 2 3 4-4
-3
-2
-1
0
1
2
3
4y
[cm
]
x [cm]
events
0.4
0.5
0.6
0.7
0.8
0.9
1
-1.5 -1 -0.5 0 0.5 1
-4
-2
0
2
4RPC I
RPC III
RPC II
y [c
m]
x [cm]
eff
Figure 6.18: The upper pi ture shows the distribution of the triggered events as a fun tionof the position x (s intillator 2) and y (s intillator 1). In the lower pi ture, the e ien yprole is shown, suggesting the presen e of three tRPCs with dead regions between them.
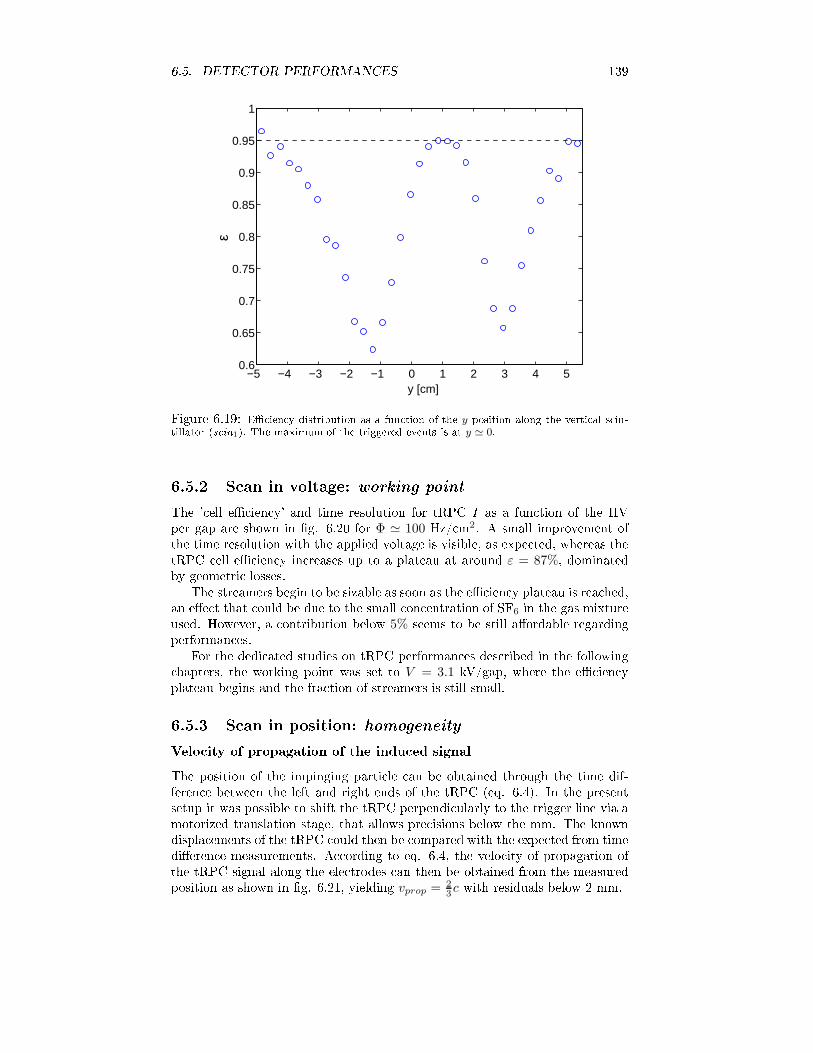
6.5. DETECTOR PERFORMANCES 139
−5 −4 −3 −2 −1 0 1 2 3 4 50.6
0.65
0.7
0.75
0.8
0.85
0.9
0.95
1
y [cm]
ε
Figure 6.19: E ien y distribution as a fun tion of the y position along the verti al s in-tillator (s in1). The maximum of the triggered events is at y ≃ 0.6.5.2 S an in voltage: working pointThe ' ell e ien y' and time resolution for tRPC I as a fun tion of the HVper gap are shown in g. 6.20 for Φ ≃ 100 Hz/ m2. A small improvement ofthe time resolution with the applied voltage is visible, as expe ted, whereas thetRPC ell e ien y in reases up to a plateau at around ε = 87%, dominatedby geometri losses.The streamers begin to be sizable as soon as the e ien y plateau is rea hed,an ee t that ould be due to the small on entration of SF6 in the gas mixtureused. However, a ontribution below 5% seems to be still aordable regardingperforman es.For the dedi ated studies on tRPC performan es des ribed in the following hapters, the working point was set to V = 3.1 kV/gap, where the e ien yplateau begins and the fra tion of streamers is still small.6.5.3 S an in position: homogeneityVelo ity of propagation of the indu ed signalThe position of the impinging parti le an be obtained through the time dif-feren e between the left and right ends of the tRPC (eq. 6.4). In the presentsetup it was possible to shift the tRPC perpendi ularly to the trigger line via amotorized translation stage, that allows pre isions below the mm. The knowndispla ements of the tRPC ould then be ompared with the expe ted from timedieren e measurements. A ording to eq. 6.4, the velo ity of propagation ofthe tRPC signal along the ele trodes an then be obtained from the measuredposition as shown in g. 6.21, yielding vprop = 23c with residuals below 2 mm.
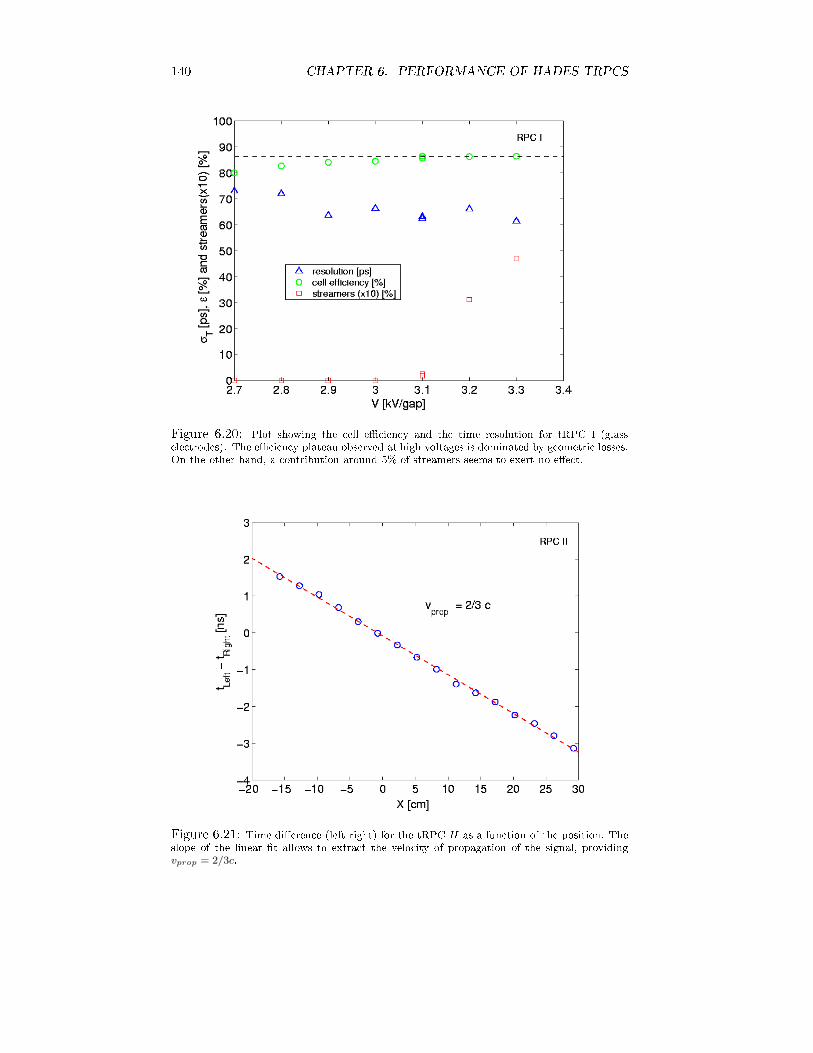
140 CHAPTER 6. PERFORMANCE OF HADES TRPCS
Figure 6.20: Plot showing the ell e ien y and the time resolution for tRPC I (glassele trodes). The e ien y plateau observed at high voltages is dominated by geometri losses.On the other hand, a ontribution around 5% of streamers seems to exert no ee t.
Figure 6.21: Time dieren e (left-right) for the tRPC II as a fun tion of the position. Theslope of the linear t allows to extra t the velo ity of propagation of the signal, providingvprop = 2/3c.
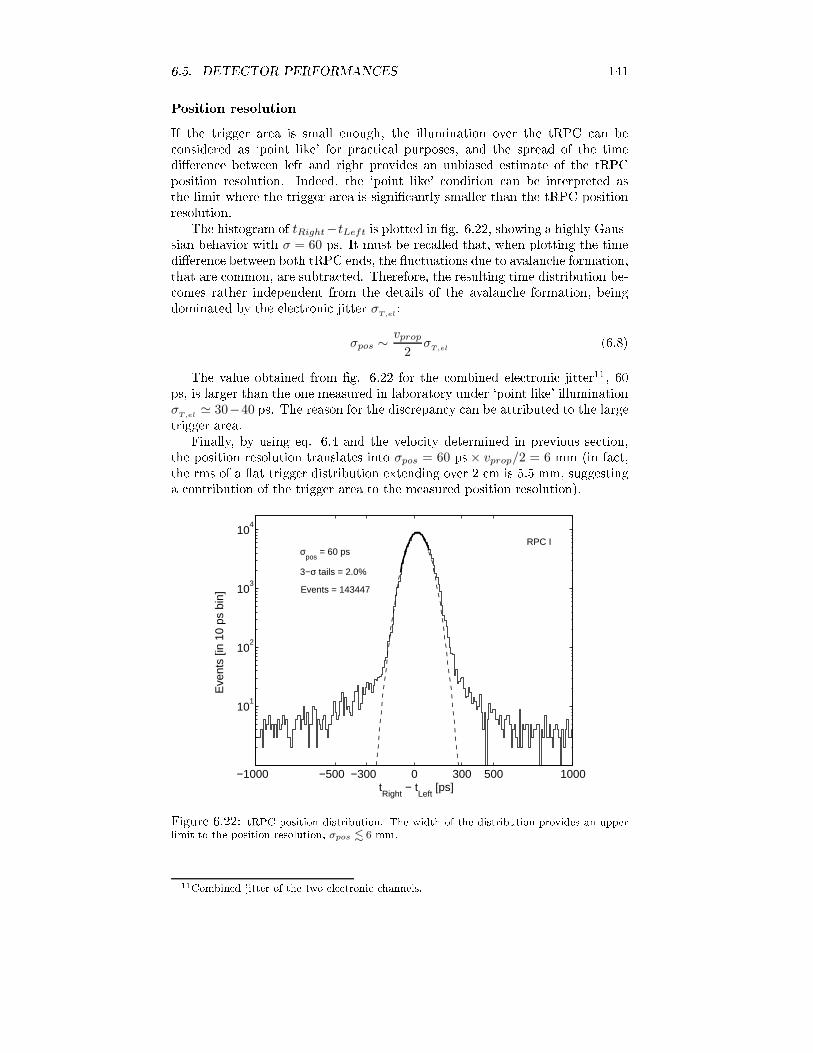
6.5. DETECTOR PERFORMANCES 141Position resolutionIf the trigger area is small enough, the illumination over the tRPC an be onsidered as `point like' for pra ti al purposes, and the spread of the timedieren e between left and right provides an unbiased estimate of the tRPCposition resolution. Indeed, the `point like' ondition an be interpreted asthe limit where the trigger area is signi antly smaller than the tRPC positionresolution.The histogram of tRight−tLeft is plotted in g. 6.22, showing a highly Gaus-sian behavior with σ = 60 ps. It must be re alled that, when plotting the timedieren e between both tRPC ends, the u tuations due to avalan he formation,that are ommon, are subtra ted. Therefore, the resulting time distribution be- omes rather independent from the details of the avalan he formation, beingdominated by the ele troni jitter σT,el
:σpos ∼ vprop
2σ
T,el(6.8)The value obtained from g. 6.22 for the ombined ele troni jitter11, 60ps, is larger than the one measured in laboratory under `point like' illumination
σT,el
≃ 30−40 ps. The reason for the dis repan y an be attributed to the largetrigger area.Finally, by using eq. 6.4 and the velo ity determined in previous se tion,the position resolution translates into σpos = 60 ps× vprop/2 = 6 mm (in fa t,the rms of a at trigger distribution extending over 2 m is 5.5 mm, suggestinga ontribution of the trigger area to the measured position resolution).
−1000 −500 −300 0 300 500 1000
101
102
103
104
tRight
− tLeft
[ps]
Eve
nts
[in 1
0 ps
bin
]
σpos
= 60 ps
3−σ tails = 2.0%
Events = 143447
RPC I
Figure 6.22: tRPC position distribution. The width of the distribution provides an upperlimit to the position resolution, σpos . 6 mm.11Combined jitter of the two ele troni hannels.
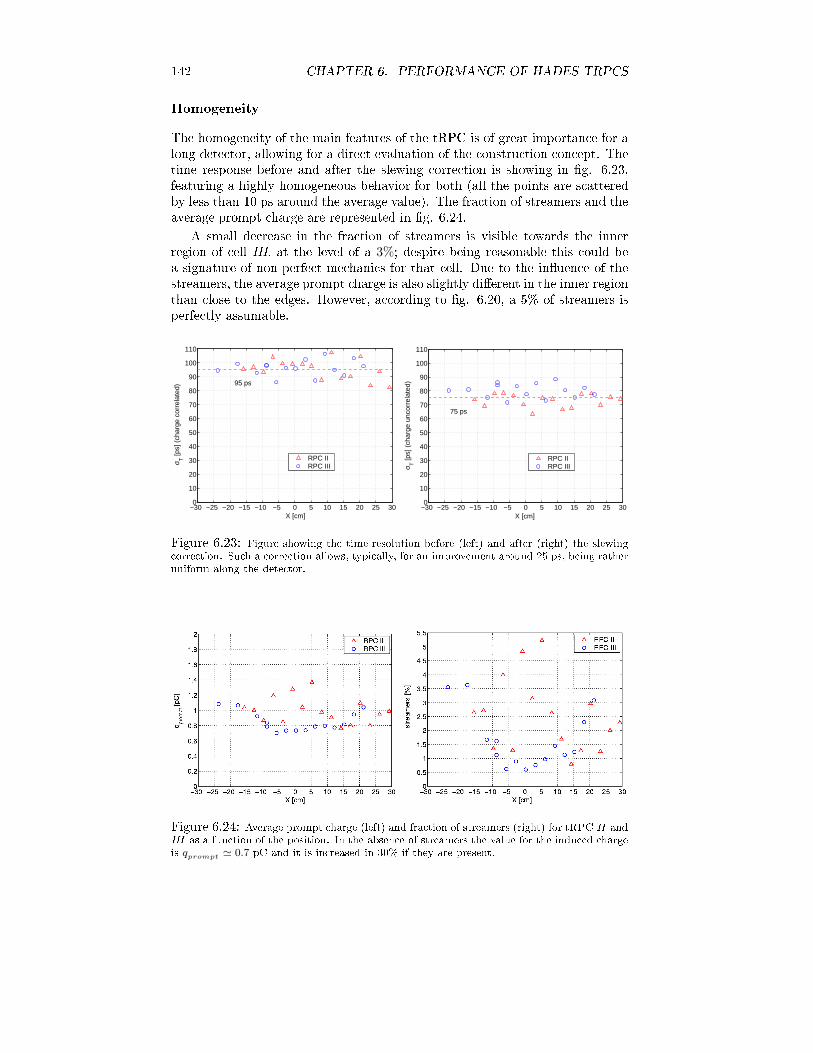
142 CHAPTER 6. PERFORMANCE OF HADES TRPCSHomogeneityThe homogeneity of the main features of the tRPC is of great importan e for along dete tor, allowing for a dire t evaluation of the onstru tion on ept. Thetime response before and after the slewing orre tion is showing in g. 6.23,featuring a highly homogeneous behavior for both (all the points are s atteredby less than 10 ps around the average value). The fra tion of streamers and theaverage prompt harge are represented in g. 6.24.A small de rease in the fra tion of streamers is visible towards the innerregion of ell III, at the level of a 3%; despite being reasonable this ould bea signature of non-perfe t me hani s for that ell. Due to the inuen e of thestreamers, the average prompt harge is also slightly dierent in the inner regionthan lose to the edges. However, a ording to g. 6.20, a 5% of streamers isperfe tly assumable.−30 −25 −20 −15 −10 −5 0 5 10 15 20 25 300
10
20
30
40
50
60
70
80
90
100
110
X [cm]
σ T [p
s] (
char
ge c
orre
late
d)
RPC IIRPC III
95 ps
−30 −25 −20 −15 −10 −5 0 5 10 15 20 25 300
10
20
30
40
50
60
70
80
90
100
110
X [cm]
σ T [p
s] (
char
ge u
ncor
rela
ted)
RPC IIRPC III
75 ps
Figure 6.23: Figure showing the time resolution before (left) and after (right) the slewing orre tion. Su h a orre tion allows, typi ally, for an improvement around 25 ps, being ratheruniform along the dete tor.
Figure 6.24: Average prompt harge (left) and fra tion of streamers (right) for tRPC II andIII as a fun tion of the position. In the absen e of streamers the value for the indu ed hargeis qprompt ≃ 0.7 pC and it is in reased in 30% if they are present.

6.5. DETECTOR PERFORMANCES 1436.5.4 S an in rate: robustnessThe degradation of the performan es, due to the a umulation of harge in theresistive plate, is a entral feature of tRPCs. For showing the ee t, all runs havebeen grouped together in g. 6.25, showing the ell e ien y ε, time resolutionσ
Tand 3-σ tails for dierent V = 3.1− 3.4 kV/gap. The performan es are alsorepresented as a fun tion of the equivalent rate in units of the maximum rateexpe ted in the HADES experiment (Φ = 700 Hz/ m2), that orresponds to thelower polar angles (see g. 5.8). Denoting by Φ the primary rate, the urves an be roughly parameterized as straight lines:
ε = 87%− 1.5%Φ
100 Hz/ m2 (6.9)σ
T= 67 ps + 4.7
Φ
100 Hz/ m2 (6.10)3-σ tails = 6.7% + 0.6%Φ
100 Hz/ m2 (6.11)A mu h more detailed analysis on rate ee ts, together with a theoreti alinterpretation an be found in hapter 9.
0 200 400 600 800 1000 1200 14000
20
40
60
80
100
120
140
160
180
200
0
10
20
30
40
50
60
70
80
90
100
0 0.2 0.4 0.6 0.8 1 1.2 1.4 1.6 1.8 2
tim
e [p
s]
%Time resolution [ps]
tails [%]σ3-
Efficiency [%] (geometric + intrinsic)
]2
[Hz/cmΦ
[times the maximum rate for AuAu at 1.5 GeV]ΦFigure 6.25: Behavior of the tRPC performan es as a fun tion of the primary rate. Alsoshown the equivalent rate in times the maximum rate expe ted in HADES at the tRPC wallposition.
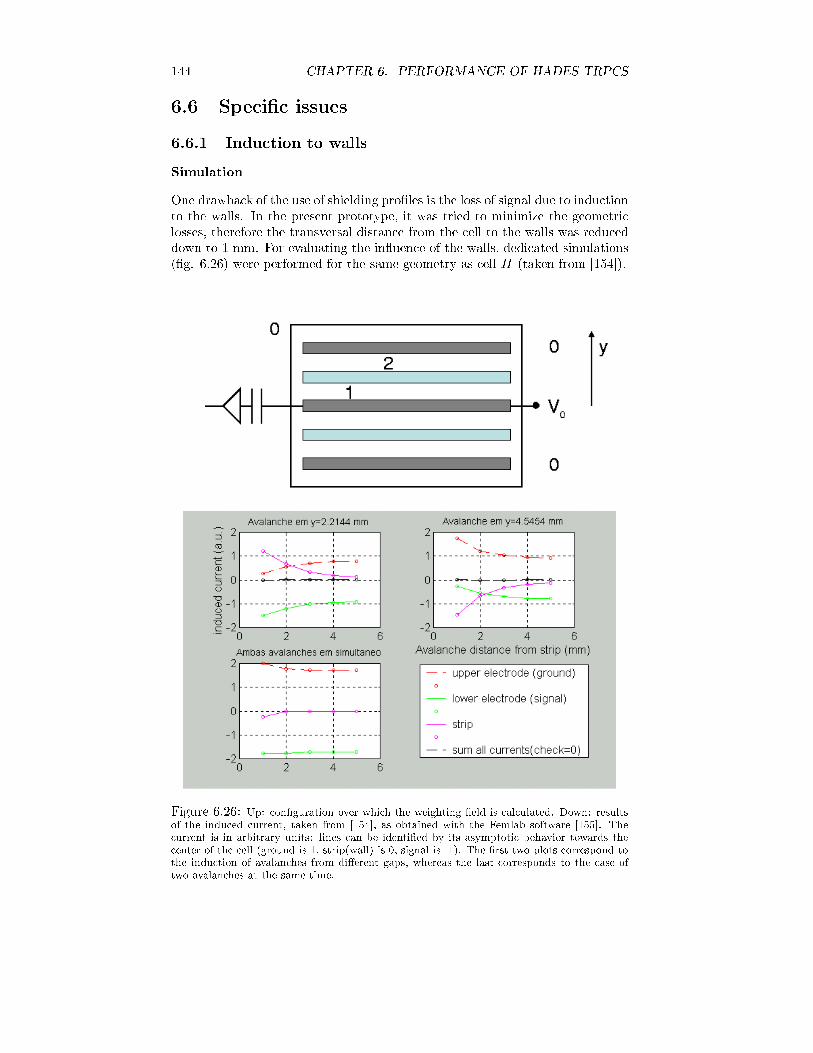
144 CHAPTER 6. PERFORMANCE OF HADES TRPCS6.6 Spe i issues6.6.1 Indu tion to wallsSimulationOne drawba k of the use of shielding proles is the loss of signal due to indu tionto the walls. In the present prototype, it was tried to minimize the geometri losses, therefore the transversal distan e from the ell to the walls was redu eddown to 1 mm. For evaluating the inuen e of the walls, dedi ated simulations(g. 6.26) were performed for the same geometry as ell II (taken from [154).
Figure 6.26: Up: onguration over whi h the weighting eld is al ulated. Down: resultsof the indu ed urrent, taken from [154, as obtained with the Femlab software [155. The urrent is in arbitrary units: lines an be identied by its asymptoti behavior towards the enter of the ell (ground is 1, strip(wall) is 0, signal is -1). The rst two plots orrespond tothe indu tion of avalan hes from dierent gaps, whereas the last orresponds to the ase oftwo avalan hes at the same time.
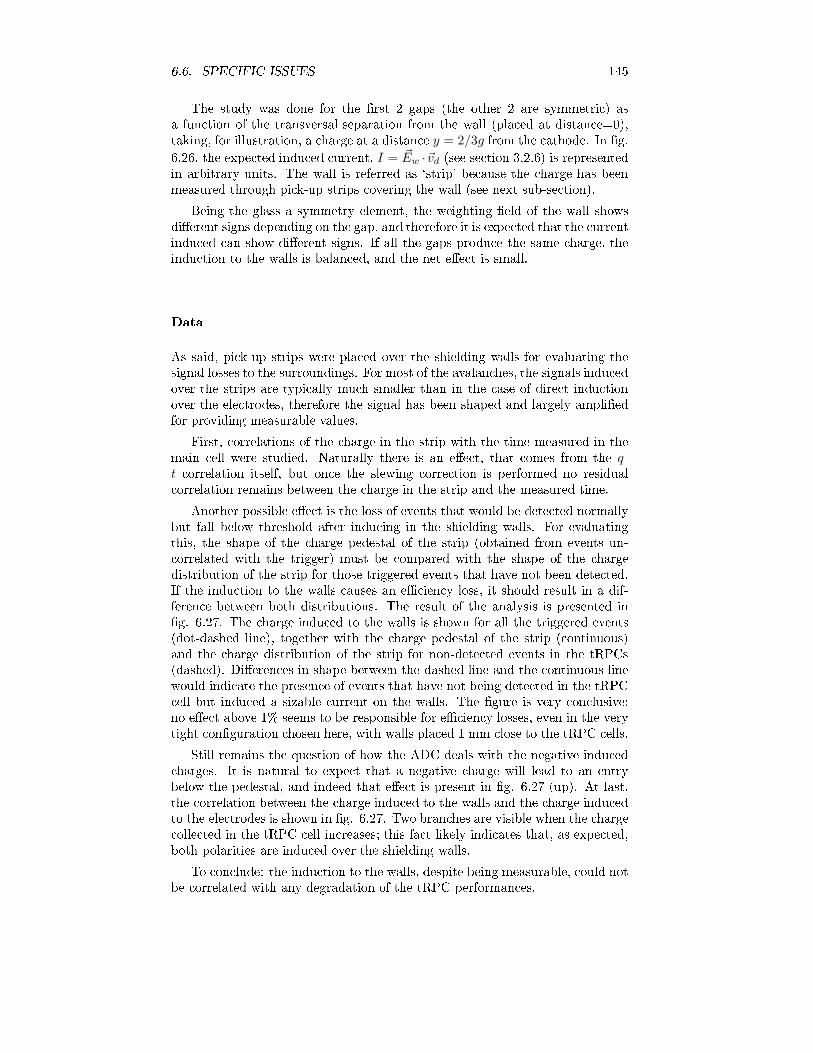
6.6. SPECIFIC ISSUES 145The study was done for the rst 2 gaps (the other 2 are symmetri ) asa fun tion of the transversal separation from the wall (pla ed at distan e=0),taking, for illustration, a harge at a distan e y = 2/3g from the athode. In g.6.26, the expe ted indu ed urrent, I = ~Ew ·~vd (see se tion 3.2.6) is representedin arbitrary units. The wall is referred as `strip' be ause the harge has beenmeasured through pi k-up strips overing the wall (see next sub-se tion).Being the glass a symmetry element, the weighting eld of the wall showsdierent signs depending on the gap, and therefore it is expe ted that the urrentindu ed an show dierent signs. If all the gaps produ e the same harge, theindu tion to the walls is balan ed, and the net ee t is small.DataAs said, pi k-up strips were pla ed over the shielding walls for evaluating thesignal losses to the surroundings. For most of the avalan hes, the signals indu edover the strips are typi ally mu h smaller than in the ase of dire t indu tionover the ele trodes, therefore the signal has been shaped and largely ampliedfor providing measurable values.First, orrelations of the harge in the strip with the time measured in themain ell were studied. Naturally there is an ee t, that omes from the q-t orrelation itself, but on e the slewing orre tion is performed no residual orrelation remains between the harge in the strip and the measured time.Another possible ee t is the loss of events that would be dete ted normallybut fall below threshold after indu ing in the shielding walls. For evaluatingthis, the shape of the harge pedestal of the strip (obtained from events un- orrelated with the trigger) must be ompared with the shape of the hargedistribution of the strip for those triggered events that have not been dete ted.If the indu tion to the walls auses an e ien y loss, it should result in a dif-feren e between both distributions. The result of the analysis is presented ing. 6.27. The harge indu ed to the walls is shown for all the triggered events(dot-dashed line), together with the harge pedestal of the strip ( ontinuous)and the harge distribution of the strip for non-dete ted events in the tRPCs(dashed). Dieren es in shape between the dashed line and the ontinuous linewould indi ate the presen e of events that have not being dete ted in the tRPC ell but indu ed a sizable urrent on the walls. The gure is very on lusive:no ee t above 1% seems to be responsible for e ien y losses, even in the verytight onguration hosen here, with walls pla ed 1 mm lose to the tRPC ells.Still remains the question of how the ADC deals with the negative indu ed harges. It is natural to expe t that a negative harge will lead to an entrybelow the pedestal, and indeed that ee t is present in g. 6.27 (up). At last,the orrelation between the harge indu ed to the walls and the harge indu edto the ele trodes is shown in g. 6.27. Two bran hes are visible when the harge olle ted in the tRPC ell in reases; this fa t likely indi ates that, as expe ted,both polarities are indu ed over the shielding walls.To on lude: the indu tion to the walls, despite being measurable, ould notbe orrelated with any degradation of the tRPC performan es.

146 CHAPTER 6. PERFORMANCE OF HADES TRPCS
0 50 100 150 200 250 300 350 400 450 500
10−4
10−3
10−2
qstrip
[ADC units]
Pro
babi
lity
[in 1
AD
C u
nit b
in]
Charge induced to the walls (measured in a copper strip)Charge induced to the walls by inefficient eventsStrip pedestal
1
10
102
103
0 50 100 150 200 250 300 350 400 450 500
200
400
600
800
1000
1200
1400
1600
1800
2000strip pedestal
counts
[ADC units]stripq
[A
DC
un
its]
RP
Cq
Figure 6.27: Up: harge indu ed to the walls by all the avalan hes (dot-dashed) and non-dete ted events in the tRPCs (dashed) together with the harge pedestal of the strip ( on-tinuous). Down: orrelation between the harge indu ed to the walls and the harge indu edto the ele trodes, showing two bran hes. This fa t an be onsidered as an indi ation of thepresen e of two dierent polarizations of the indu ed signal.
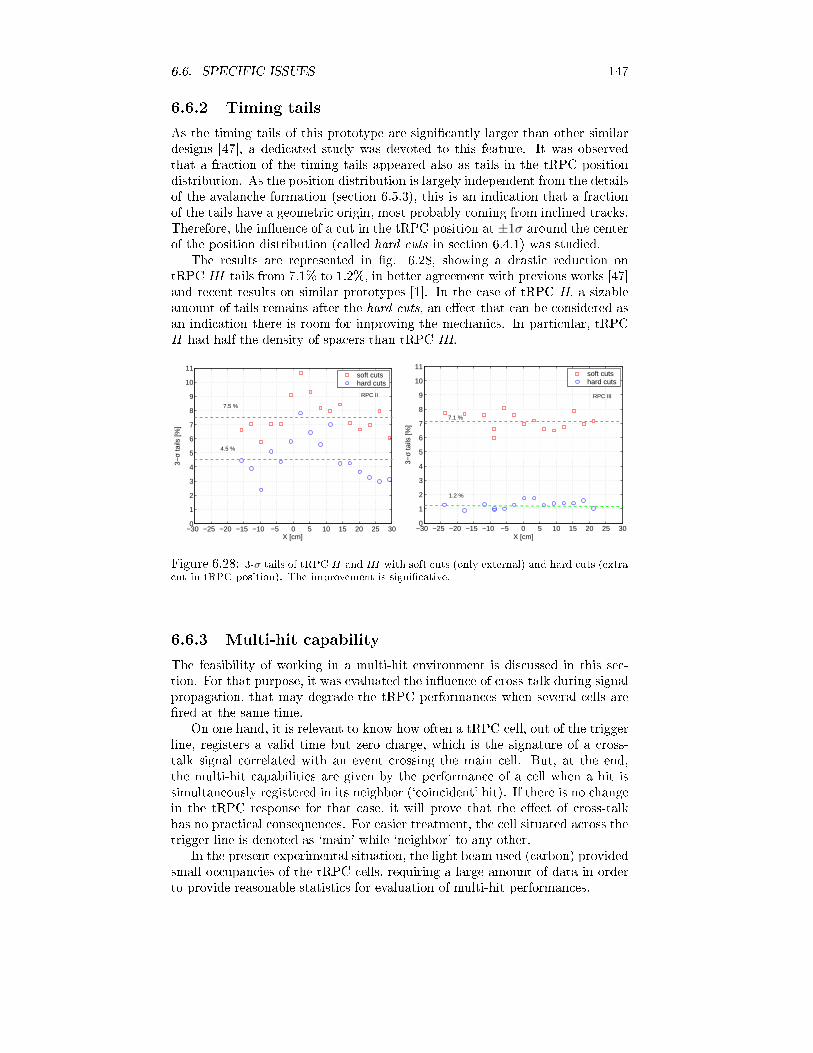
6.6. SPECIFIC ISSUES 1476.6.2 Timing tailsAs the timing tails of this prototype are signi antly larger than other similardesigns [47, a dedi ated study was devoted to this feature. It was observedthat a fra tion of the timing tails appeared also as tails in the tRPC positiondistribution. As the position distribution is largely independent from the detailsof the avalan he formation (se tion 6.5.3), this is an indi ation that a fra tionof the tails have a geometri origin, most probably oming from in lined tra ks.Therefore, the inuen e of a ut in the tRPC position at ±1σ around the enterof the position distribution ( alled hard uts in se tion 6.4.1) was studied.The results are represented in g. 6.28, showing a drasti redu tion ontRPC III tails from 7.1% to 1.2%, in better agreement with previous works [47and re ent results on similar prototypes [1. In the ase of tRPC II, a sizableamount of tails remains after the hard uts, an ee t that an be onsidered asan indi ation there is room for improving the me hani s. In parti ular, tRPCII had half the density of spa ers than tRPC III.−30 −25 −20 −15 −10 −5 0 5 10 15 20 25 300
1
2
3
4
5
6
7
8
9
10
11
X [cm]
3−σ
tails
[%]
soft cutshard cuts
7.5 %
4.5 %
RPC II
−30 −25 −20 −15 −10 −5 0 5 10 15 20 25 300
1
2
3
4
5
6
7
8
9
10
11
X [cm]
3−σ
tails
[%]
soft cutshard cuts
RPC III
7.1 %
1.2 % Figure 6.28: 3-σ tails of tRPC II and III with soft uts (only external) and hard uts (extra ut in tRPC position). The improvement is signi ative.6.6.3 Multi-hit apabilityThe feasibility of working in a multi-hit environment is dis ussed in this se -tion. For that purpose, it was evaluated the inuen e of ross-talk during signalpropagation, that may degrade the tRPC performan es when several ells arered at the same time.On one hand, it is relevant to know how often a tRPC ell, out of the triggerline, registers a valid time but zero harge, whi h is the signature of a ross-talk signal orrelated with an event rossing the main ell. But, at the end,the multi-hit apabilities are given by the performan e of a ell when a hit issimultaneously registered in its neighbor (` oin ident' hit). If there is no hangein the tRPC response for that ase, it will prove that the ee t of ross-talkhas no pra ti al onsequen es. For easier treatment, the ell situated a ross thetrigger line is denoted as `main' while `neighbor' to any other.In the present experimental situation, the light beam used ( arbon) providedsmall o upan ies of the tRPC ells, requiring a large amount of data in orderto provide reasonable statisti s for evaluation of multi-hit performan es.

148 CHAPTER 6. PERFORMANCE OF HADES TRPCSAs said, a ross-talk event is dened by the onditions q ≤ qpedestal (zero- harge) and t < toverflow (valid time). With the shielded onguration pro-posed, ross-talk is kept at a very low level of around 0.5% per neighbor. Inparti ular, the ross-talk of ell I over II is 0.16% whereas II over I is 0.4%and II over III is 1.1%, indi ating a slight asymmetry of the ee t.Looking at the time dieren es (left-right) in the `neighbor' ell, the positiondistribution of the indu ed ross-talk along the `neighbor' an be representedfor signals triggered at a xed position position in the `main' ell ( enter), asshown in g. 6.29 (left). The distribution of the ross-talk indu ed extendsup to twi e the dete tor length (±60 m) that ould be due to ree tions inthe dete tor. Also, in g. 6.29 (right) the fra tion of ross-talk for dierentpositions of the trigger along the `main' ell is represented. Within the poorstatisti al signi an e of the gure (less than 20 events ontribute per point) itseems that a slight in rease is seen, in fa t, towards the enter of the ell as itwould be qualitatively expe ted from the al ulations of [65.−250 −200 −150 −100 −50 0 50 100 150 200 250 300
0
5
10
15
20
25
30
35
40
45
50
55
X [cm]
Eve
nts
[in 1
0 cm
bin
]
neighbour cell (main: RPC I)
−30 −25 −20 −15 −10 −5 0 5 10 15 20 25 300
0.5
1
1.5
2
2.5
3
X [cm]
cros
s−ta
lk [%
]
neighbour cell (main: RPC II)
0.5 % Figure 6.29: Position distribution of the ross-talk indu ed, obtained through to the timedieren e at the `neighbor' ell (left). In the right, the ross-talk probability is shown as afun tion of the position in the `main' ell.For a better understanding of ross-talk, the harge spe tra in the `main' ell is shown in g. 6.30, together with the ` oin ident' hit probability and the` ross-talk' probability as a fun tion of harge.The study is performed at V = 3.1 kV/gap and Φ ≃ 100 Hz/ m2 for tRPC ell I and II as the `main' ell and II and I the `neighbors', respe tively. Itis learly seen a high orrelation of the ross-talk with large harge events inthe `main' ell (in reasing from 0.1% to 10% with the harge of the avalan he).As expe ted, the ` oin ident' hit probability does not depend on the hargein the `main' ell. A slight asymmetry on the dete tor gain is also apparent,being the presen e of streamers more likely in ell II, but still below 1%. This an be as ribed to the fa t that tRPC I has glass ele trodes while tRPC IIhas metalli ones, being the rst more sensitive to rate ee ts, due to the largertotal resistan e. Su h an ee t would result in a de rease of the ee tive voltagein the gap and, therefore, a lower gain.At last, the performan es are evaluated for the ase where two hits arepresent simultaneously in the `main' and `neighbor' ell12 (` oin ident' hit). In12`Simultaneously' must be understood in the sense of `within the TDC time window' (1µs).
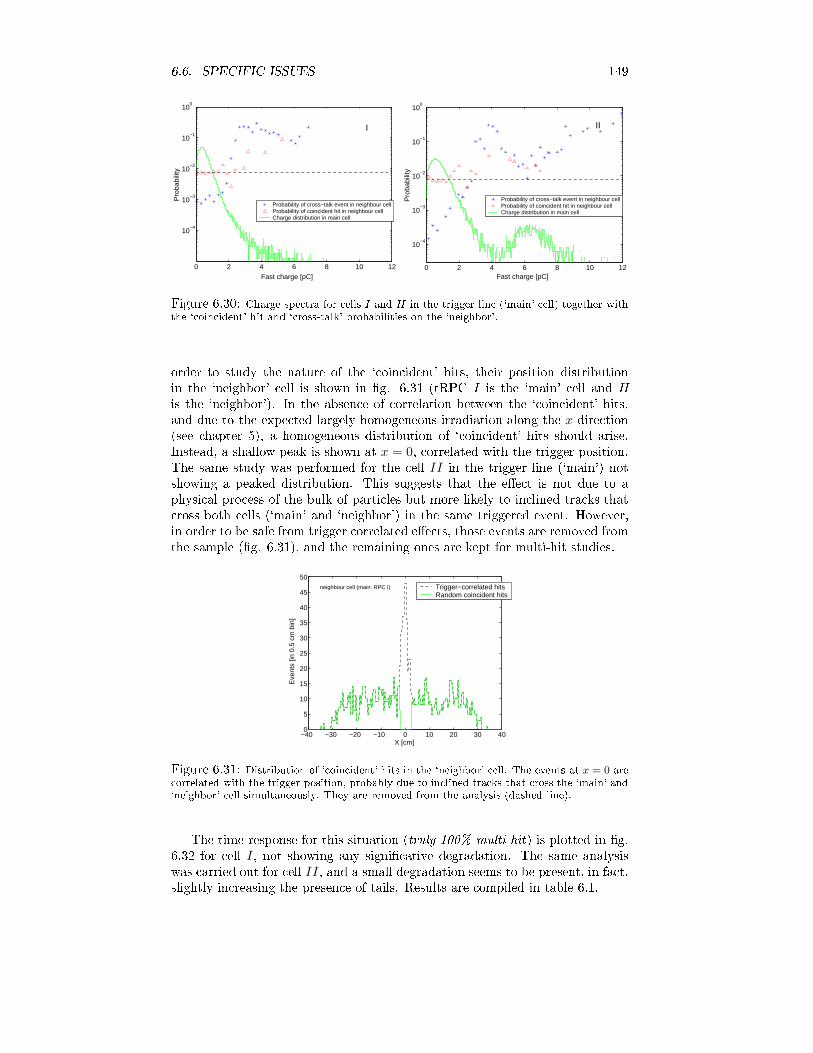
6.6. SPECIFIC ISSUES 1490 2 4 6 8 10 12
10−4
10−3
10−2
10−1
100
Fast charge [pC]
Pro
babi
lity
Probability of cross−talk event in neighbour cellProbability of coincident hit in neighbour cell Charge distribution in main cell
I
0 2 4 6 8 10 12
10−4
10−3
10−2
10−1
100
Fast charge [pC]
Pro
babi
lity
Probability of cross−talk event in neighbour cellProbability of coincident hit in neighbour cellCharge distribution in main cell
II
Figure 6.30: Charge spe tra for ells I and II in the trigger line (`main' ell) together withthe ` oin ident' hit and ` ross-talk' probabilities on the `neighbor'.order to study the nature of the ` oin ident' hits, their position distributionin the `neighbor' ell is shown in g. 6.31 (tRPC I is the `main' ell and IIis the `neighbor'). In the absen e of orrelation between the ` oin ident' hits,and due to the expe ted largely homogeneous irradiation along the x dire tion(see hapter 5), a homogeneous distribution of ` oin ident' hits should arise.Instead, a shallow peak is shown at x = 0, orrelated with the trigger position.The same study was performed for the ell II in the trigger line (`main') notshowing a peaked distribution. This suggests that the ee t is not due to aphysi al pro ess of the bulk of parti les but more likely to in lined tra ks that ross both ells (`main' and `neighbor') in the same triggered event. However,in order to be safe from trigger orrelated ee ts, those events are removed fromthe sample (g. 6.31), and the remaining ones are kept for multi-hit studies.−40 −30 −20 −10 0 10 20 30 400
5
10
15
20
25
30
35
40
45
50
X [cm]
Eve
nts
[in 0
.5 c
m b
in]
Trigger−correlated hitsRandom coincident hits
neighbour cell (main: RPC I)
Figure 6.31: Distribution of ` oin ident' hits in the `neighbor' ell. The events at x = 0 are orrelated with the trigger position, probably due to in lined tra ks that ross the `main' and`neighbor' ell simultaneously. They are removed from the analysis (dashed line).The time response for this situation (truly 100% multi-hit) is plotted in g.6.32 for ell I, not showing any signi ative degradation. The same analysiswas arried out for ell II, and a small degradation seems to be present, in fa t,slightly in reasing the presen e of tails. Results are ompiled in table 6.1.
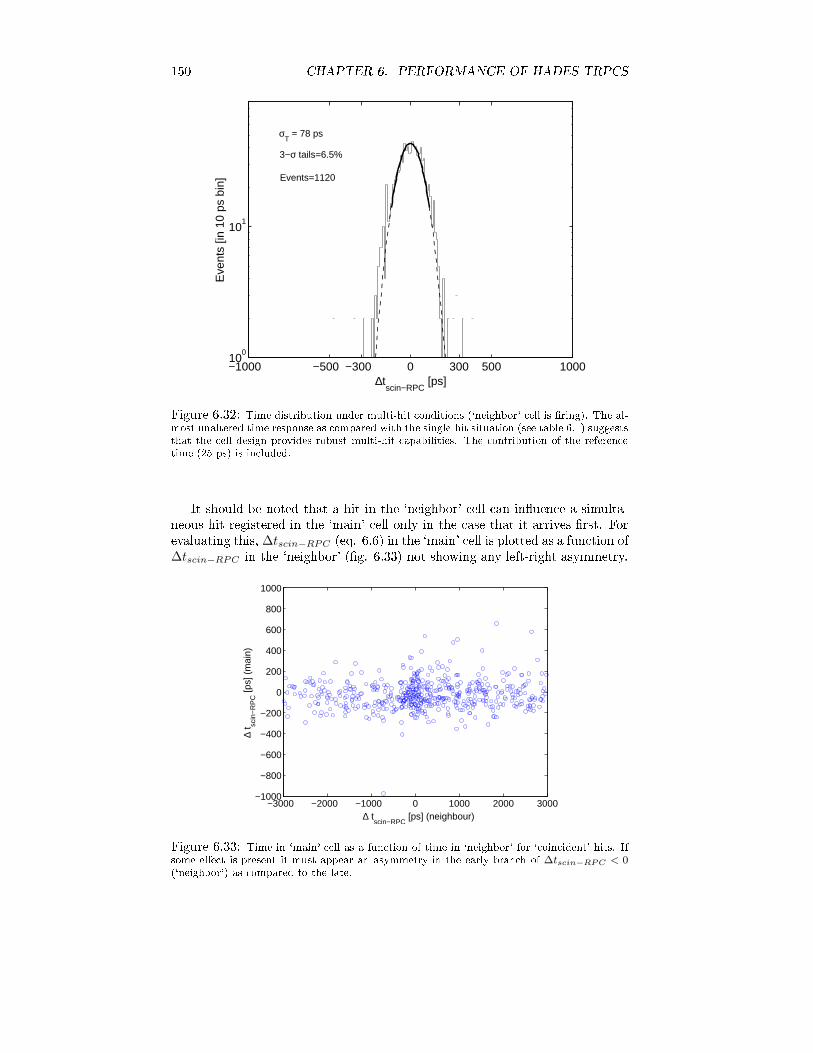
150 CHAPTER 6. PERFORMANCE OF HADES TRPCS
−1000 −500 −300 0 300 500 100010
0
101
∆tscin−RPC
[ps]
Eve
nts
[in 1
0 ps
bin
]
σT = 78 ps
3−σ tails=6.5%
Events=1120
Figure 6.32: Time distribution under multi-hit onditions (`neighbor' ell is ring). The al-most unaltered time response as ompared with the single-hit situation (see table 6.1) suggeststhat the ell design provides robust multi-hit apabilities. The ontribution of the referen etime (25 ps) is in luded.It should be noted that a hit in the `neighbor' ell an inuen e a simulta-neous hit registered in the `main' ell only in the ase that it arrives rst. Forevaluating this, ∆tscin−RPC (eq. 6.6) in the `main' ell is plotted as a fun tion of∆tscin−RPC in the `neighbor' (g. 6.33) not showing any left-right asymmetry.
−3000 −2000 −1000 0 1000 2000 3000−1000
−800
−600
−400
−200
0
200
400
600
800
1000
∆ tscin−RPC
[ps] (neighbour)
∆ t sc
in−
RP
C [p
s] (
mai
n)
Figure 6.33: Time in `main' ell as a fun tion of time in `neighbor' for ` oin ident' hits. Ifsome ee t is present it must appear an asymmetry in the early bran h of ∆tscin−RPC < 0(`neighbor') as ompared to the late.
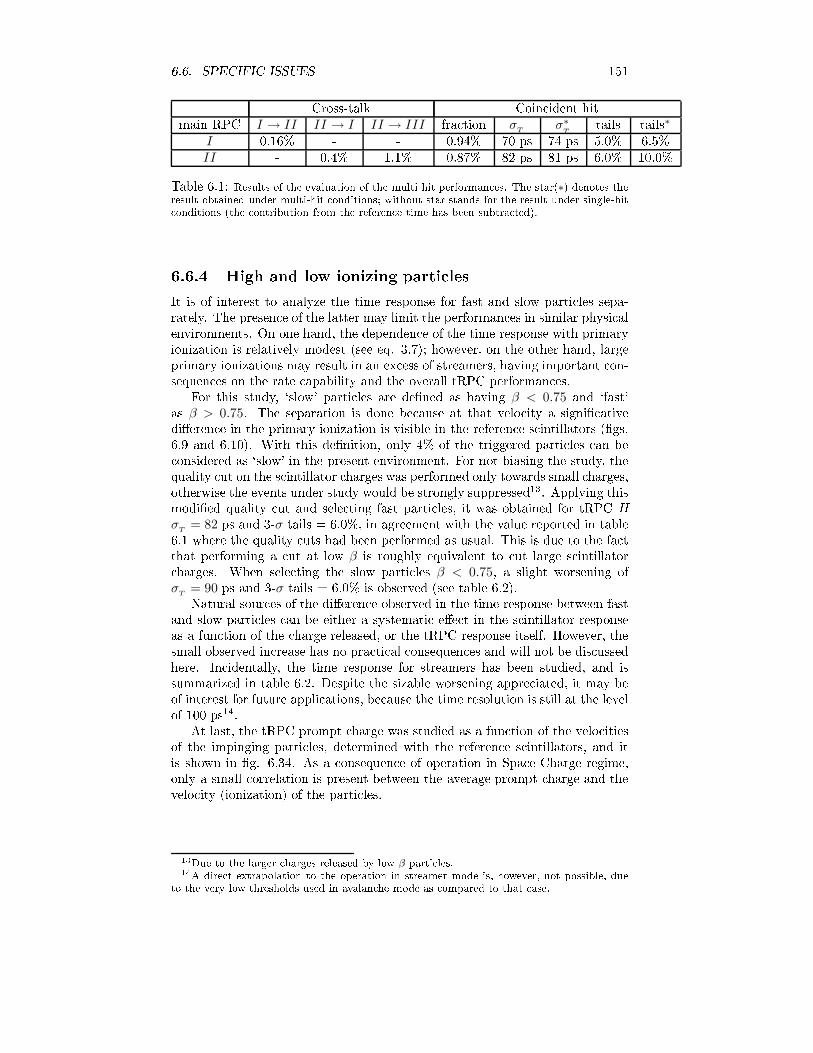
6.6. SPECIFIC ISSUES 151Cross-talk Coin ident hitmain RPC I → II II → I II → III fra tion σT
σ∗T
tails tails∗I 0.16% - - 0.94% 70 ps 74 ps 5.0% 6.5%II - 0.4% 1.1% 0.87% 82 ps 81 ps 6.0% 10.0%Table 6.1: Results of the evaluation of the multi-hit performan es. The star(∗) denotes theresult obtained under multi-hit onditions; without star stands for the result under single-hit onditions (the ontribution from the referen e time has been subtra ted).6.6.4 High and low ionizing parti lesIt is of interest to analyze the time response for fast and slow parti les sepa-rately. The presen e of the latter may limit the performan es in similar physi alenvironments. On one hand, the dependen e of the time response with primaryionization is relatively modest (see eq. 3.7); however, on the other hand, largeprimary ionizations may result in an ex ess of streamers, having important on-sequen es on the rate apability and the overall tRPC performan es.For this study, `slow' parti les are dened as having β < 0.75 and `fast'as β > 0.75. The separation is done be ause at that velo ity a signi ativedieren e in the primary ionization is visible in the referen e s intillators (gs.6.9 and 6.10). With this denition, only 4% of the triggered parti les an be onsidered as `slow' in the present environment. For not biasing the study, thequality ut on the s intillator harges was performed only towards small harges,otherwise the events under study would be strongly suppressed13. Applying thismodied quality ut and sele ting fast parti les, it was obtained for tRPC II
σT
= 82 ps and 3-σ tails = 6.0%, in agreement with the value reported in table6.1 where the quality uts had been performed as usual. This is due to the fa tthat performing a ut at low β is roughly equivalent to ut large s intillator harges. When sele ting the slow parti les β < 0.75, a slight worsening ofσ
T= 90 ps and 3-σ tails = 6.0% is observed (see table 6.2).Natural sour es of the dieren e observed in the time response between fastand slow parti les an be either a systemati ee t in the s intillator responseas a fun tion of the harge released, or the tRPC response itself. However, thesmall observed in rease has no pra ti al onsequen es and will not be dis ussedhere. In identally, the time response for streamers has been studied, and issummarized in table 6.2. Despite the sizable worsening appre iated, it may beof interest for future appli ations, be ause the time resolution is still at the levelof 100 ps14.At last, the tRPC prompt harge was studied as a fun tion of the velo itiesof the impinging parti les, determined with the referen e s intillators, and itis shown in g. 6.34. As a onsequen e of operation in Spa e-Charge regime,only a small orrelation is present between the average prompt harge and thevelo ity (ionization) of the parti les.13Due to the larger harges released by low β parti les.14A dire t extrapolation to the operation in streamer mode is, however, not possible, dueto the very low thresholds used in avalan he mode as ompared to that ase.

152 CHAPTER 6. PERFORMANCE OF HADES TRPCS
1
10
102
0.4 0.6 0.8 1 1.2 1.40
2
4
6
8
10
12
[p
C]
pro
mp
tq
βFigure 6.34: Prompt harge as a fun tion of the parti le velo ities, determined with thereferen e s intillators. The streamer region appears as a dis onne ted region at qprompt > 4pC.As said, more riti al would be that the large primary ionizations result inan ex ess of streamers. This is studied in g. 6.35, indi ating that, in fa t, anoti eable in rease of the fra tion of streamers is present towards small valuesof β, but still reasonable.
0.6 0.8 1 1.2 1.40.02
0.025
0.03
0.035
0.04
0.045
0.05
0.055
0.06
β
stre
amer
pro
babi
lity
Figure 6.35: Fra tion of streamers in the tRPC as a fun tion of the parti le velo ities,determined with the referen e s intillators. The in rease towards low velo ities is apparent.
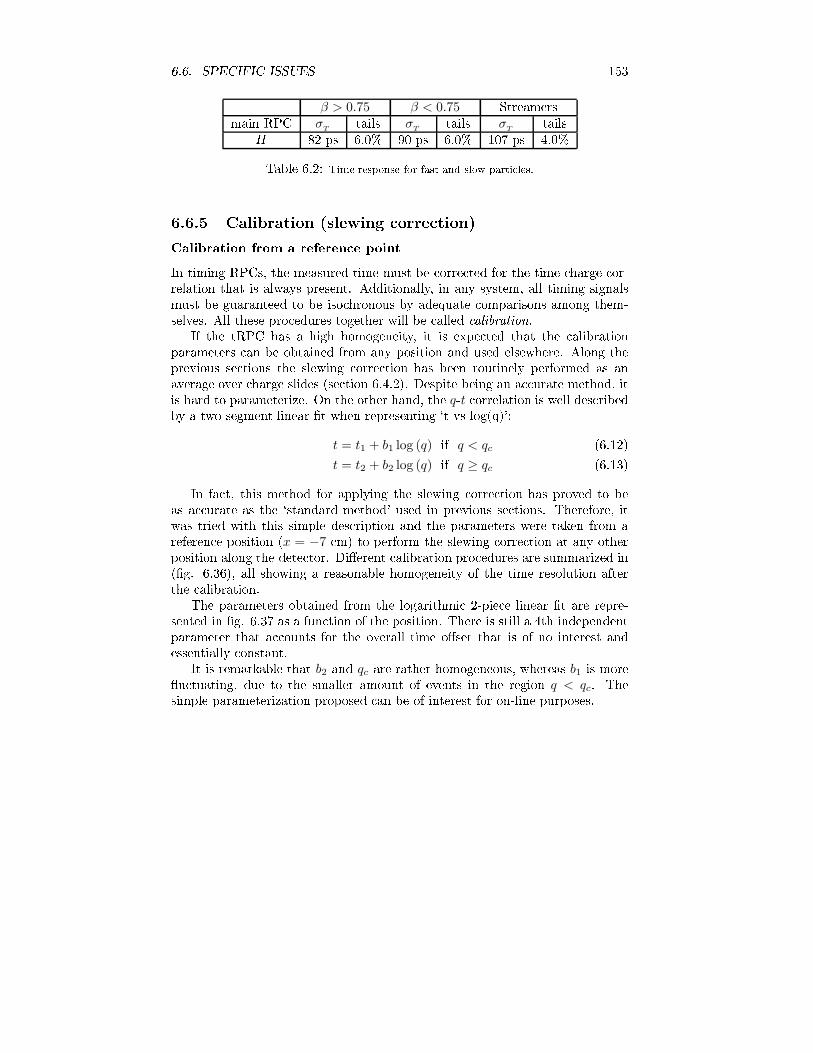
6.6. SPECIFIC ISSUES 153β > 0.75 β < 0.75 Streamersmain RPC σT
tails σT
tails σT
tailsII 82 ps 6.0% 90 ps 6.0% 107 ps 4.0%Table 6.2: Time response for fast and slow parti les.6.6.5 Calibration (slewing orre tion)Calibration from a referen e pointIn timing RPCs, the measured time must be orre ted for the time- harge or-relation that is always present. Additionally, in any system, all timing signalsmust be guaranteed to be iso hronous by adequate omparisons among them-selves. All these pro edures together will be alled alibration.If the tRPC has a high homogeneity, it is expe ted that the alibrationparameters an be obtained from any position and used elsewhere. Along theprevious se tions the slewing orre tion has been routinely performed as anaverage over harge slides (se tion 6.4.2). Despite being an a urate method, itis hard to parameterize. On the other hand, the q-t orrelation is well des ribedby a two-segment linear t when representing `t vs log(q)':t = t1 + b1 log (q) if q < qc (6.12)t = t2 + b2 log (q) if q ≥ qc (6.13)In fa t, this method for applying the slewing orre tion has proved to beas a urate as the `standard method' used in previous se tions. Therefore, itwas tried with this simple des ription and the parameters were taken from areferen e position (x = −7 m) to perform the slewing orre tion at any otherposition along the dete tor. Dierent alibration pro edures are summarized in(g. 6.36), all showing a reasonable homogeneity of the time resolution afterthe alibration.The parameters obtained from the logarithmi 2-pie e linear t are repre-sented in g. 6.37 as a fun tion of the position. There is still a 4th independentparameter that a ounts for the overall time oset that is of no interest andessentially onstant.It is remarkable that b2 and qc are rather homogeneous, whereas b1 is moreu tuating, due to the smaller amount of events in the region q < qc. Thesimple parameterization proposed an be of interest for on-line purposes.

154 CHAPTER 6. PERFORMANCE OF HADES TRPCS
−30 −25 −20 −15 −10 −5 0 5 10 15 20 25 300
10
20
30
40
50
60
70
80
90
100
110
X [cm]
σ T [p
s]
σ charge correlatedσ uncorrelated (standard)σ uncorrelated (2 piece−linear)σ uncorrelated (2 piece−linear with parameters from X = −7 cm)
75 ps
RPC II
95 ps
Figure 6.36: Time resolution before and after alibration. There are shown dierent ap-proa hes that lead to similar results.
−30 −25 −20 −15 −10 −5 0 5 10 15 20 25 300
50
100
150
200
250
300
350
400
450
500
550
600
X [cm]
valu
e of
par
amet
er
b1 [ps]
b2 [ps]
qc [ADC units]
RPC II
Figure 6.37: Calibration parameters as a fun tion of the position.
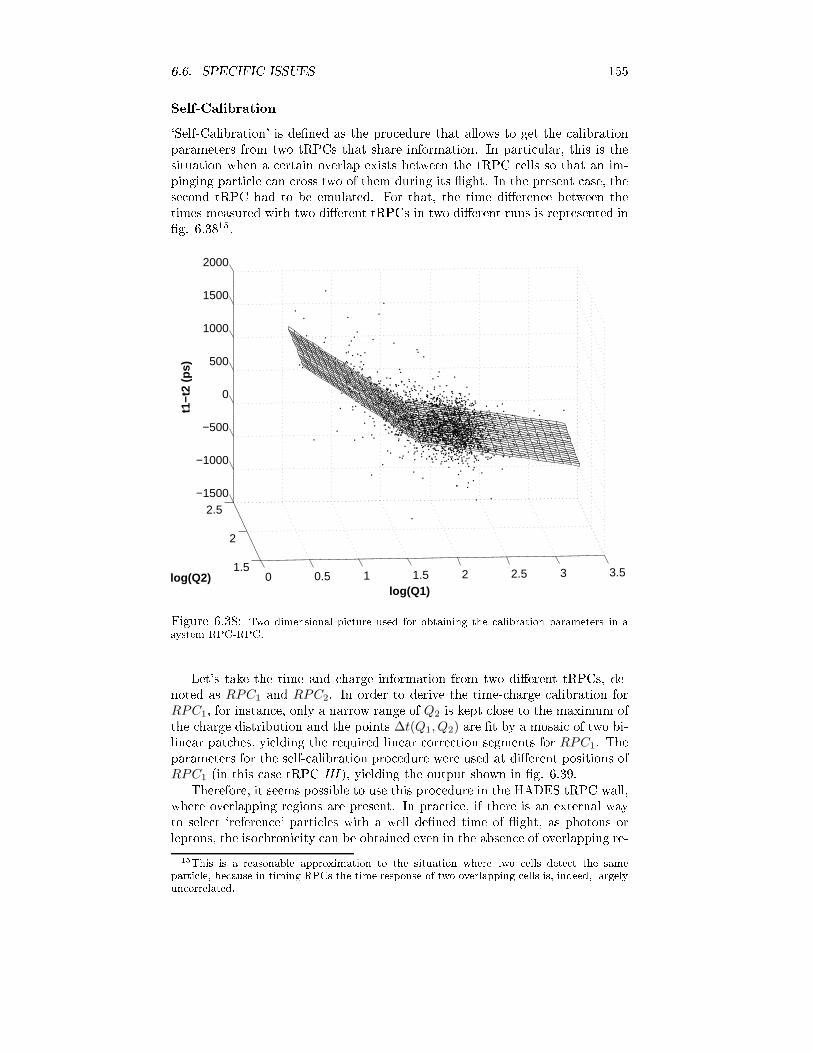
6.6. SPECIFIC ISSUES 155Self-Calibration`Self-Calibration' is dened as the pro edure that allows to get the alibrationparameters from two tRPCs that share information. In parti ular, this is thesituation when a ertain overlap exists between the tRPC ells so that an im-pinging parti le an ross two of them during its ight. In the present ase, these ond tRPC had to be emulated. For that, the time dieren e between thetimes measured with two dierent tRPCs in two dierent runs is represented ing. 6.3815.
0 0.5 1 1.5 2 2.5 3 3.51.5
2
2.5−1500
−1000
−500
0
500
1000
1500
2000
log(Q1)log(Q2)
t1−t
2 (p
s)
Figure 6.38: Two dimensional pi ture used for obtaining the alibration parameters in asystem RPC-RPC.Let's take the time and harge information from two dierent tRPCs, de-noted as RPC1 and RPC2. In order to derive the time- harge alibration forRPC1, for instan e, only a narrow range of Q2 is kept lose to the maximum ofthe harge distribution and the points ∆t(Q1, Q2) are t by a mosai of two bi-linear pat hes, yielding the required linear orre tion segments for RPC1. Theparameters for the self- alibration pro edure were used at dierent positions ofRPC1 (in this ase tRPC III ), yielding the output shown in g. 6.39.Therefore, it seems possible to use this pro edure in the HADES tRPC wall,where overlapping regions are present. In pra ti e, if there is an external wayto sele t `referen e' parti les with a well dened time of ight, as photons orleptons, the iso hroni ity an be obtained even in the absen e of overlapping re-15This is a reasonable approximation to the situation where two ells dete t the sameparti le, be ause in timing RPCs the time response of two overlapping ells is, indeed, largelyun orrelated.

156 CHAPTER 6. PERFORMANCE OF HADES TRPCS
−30 −25 −20 −15 −10 −5 0 5 10 15 20 25 300
10
20
30
40
50
60
70
80
90
100
110
X [cm]
σ T [p
s]
σ charge correlatedσ charge uncorrelated (standard)σ charge uncorrelated (’self calibrated’)
81 ps
RPC III
95 ps
Figure 6.39: Result of the self- alibration pro edure for tRPC III.gions. The proposed method is, however, straightforward, having the advantageof being ompletely stand-alone.6.7 Con lusionsThe feasibility of operating a timing RPC wall in a multi-hit environment, withse ondaries oming from nu lear ollisions has been shown. The timing resolu-tion of the prototype was at the level of σT
= 75 − 85 ps, featuring an intrinsi e ien y above 95% and a robust design, with high homogeneity of the timingproperties.The prototype allows for operation at the higher rates expe ted in HADESwith 10% degradation in e ien y and 25 ps worsening in time resolution. How-ever, further developments, as proposed in hapter 8, are expe ted to improvethe behavior at the highest rates.Timing tails at the level of 6% are present mostly towards delayed times,not representing a problem for lepton identi ation in HADES. A study hasbeen performed on the nature of the tails, suggesting that the situation an beimproved in the future, redu ing them down to 1-2%.The presen e of shielded ells is a robust solution, redu ing the ross-talk toless than 1%, mainly triggered by streamers. The ne essary shielding requiresthe presen e of geometri voids that redu ed the e ien y down to 87% forperpendi ular in iden e. It is be ause of this reason that, aiming for a ompletegeometri overage, the nal design will have 2 layers (se tion 5.3.2).

Chapter 7Measurement of the growth oe ient7.1 Introdu tionAs mentioned in se tion 3.2.2, the available models for des ribing RPC timeresponse agree in that it is governed by the growth oe ient S = α∗ve [55,[66. The star stands for `ee tive', being α∗ = α − η, i.e., the rst Townsend oe ient after orre ted for ele tron atta hment, and ve is the ele tron driftvelo ity. S depends only on the properties of the gas and the applied voltage,and it is hen e an intrinsi time s ale dire tly determined by the growth dy-nami s of the avalan he. In fa t, before Spa e-Charge starts to inuen e themultipli ation pro ess, the number of primary arriers grows, in average, as:Ne(t) = Noe
St (7.1)where No is the number of primary ele trons that ontributed to the avalan he.The larger the oe ient is, the faster the avalan he grows and the earlier itrea hes the threshold of the FEE omparator. In identally (as intuitive) thefaster an RPC is (in the sense of S being large) the narrower its time responsefun tion and so the better the timing. This assertion is dis ussed in detail in hapter 9.For an adequate interpretation of a part of the results dis ussed in thisthesis, it was ne essary to determine the behavior of S as a fun tion of theapplied voltage for a number of mixtures. Two ways for doing it an be foundin literature:1. The values of α∗ and ve are obtained from simulation pa kages, as forexample MAGBOLTZ [15 (ve) and IMONTE [16 (α, η).2. Using the fa t that a linear ele troni system does not ae t the growth oe ient of an exponential signal [151, S an be measured after theampli ation stage just by setting two thresholds at dierent voltages andmeasuring the delay between the outgoing digital signals. The methodrequires that Spa e-Charge is not important at the level of the omparator.157
158 CHAPTER 7. MEASUREMENT OF THE GROWTH COEFFICIENTIt must be said that urrently a ontroversy exists regarding some of theparameters of the swarm obtained from simulation and data [57.An elegant, although indire t, way of evaluating the timing properties of anRPC onsists in studying the behavior of the time resolution σTas a fun tion ofthe peak delay to of the time distribution [156, [157. It is natural to expe t thatboth magnitudes are related as, in fa t, the urrently available models suggest[156; therefore the σ
Tvs to plots allow to evaluate the RPC time response withsome independen e of the parameters of the swarm. A typi al σ
Tvs to plot isused, for example, in hapter 8, where the relation is expe ted to be independentfrom the value of S. The main short- oming of the approa h is that it requiresto know the overall oset of to and, for this, an estimate of S is ne essary tosome extent.7.2 The experimental te hniqueFor the measurements, two fast ampliers and two omparators were requiredand, therefore, they were retrieved from the FEE des ribed in se tion 8.2.2.The RPC signal was split and delivered to two ele troni hannels with omparator thresholds set at dierent levels. If the signal is dis riminated inthe exponential regime, it is then veried that:
mt1 = NoeSt1 (7.2)
mt2 = NoeSt2 (7.3)
ln(mt1/mt2) = S(t1 − t2) (7.4)For simpli ity, mt1 = 2 mt2 was hosen and a fa tor ln 2 is regained. The setupused onsisted in an UV lamp illuminating the athode of a 1-gap RPC (0.3 mmwide) through a quartz ber (g. 7.1). For redu ing the internal ree tions,the impedan e of the dete tor was mat hed to the impedan e of the FEE. Itis very important to ensure that the intensity of the lamp is not high enoughto perturb signi antly the eld in the region of the gap under illumination.In order to eliminate any dynami ee t, S was measured at xed voltage as afun tion of the intensity of the lamp: when the value stabilizes, it indi ates thatthe perturbation of the eld produ ed by previous avalan hes is negligible.An overall oset due to abling is present, being required to periodi allydetermine it by setting both thresholds to the same value. This is the moredeli ate point: if there is some environmental noise or walks in the hannels,the oset may hange within the same run, making di ult to get a pre isemeasurement. Su h instabilities were observed.The distribution of t1-t2 measured was re orded with a fast TDS7104 os- illos ope (Tektronix), and the average extra ted. This is done several times,aiming for an estimate of the error of the measurement.

7.3. RESULTS 159
Figure 7.1: Setup used for the measurement of S. The light from the lamp is olle ted withthe guide and driven to the RPC athode.7.3 ResultsThe proposed study onsists in determining the growth parameter S for dierentgas mixtures as a fun tion of the applied voltage. Two of the mixtures onsideredhad been previously used for the studies presented in hapters 8 (Freon/SF6,80/20) and 6, 9 (Freon/SF6/iso-C4 H10, 98.5/1/0.5) but also Freon/SF6 at 90/10and pure iso-butane were measured for omparison. Results are shown in g.7.2.It was observed that above a ertain eld, owing to the appearan e of stream-ers, the drop in the resistive plates prevents further growth of S. Therefore, thevalues of S are represented up to the point where the voltage drop starts tobe important, showing a roughly linear behavior. It must be stressed that thelargest a hievable value of S represents an important quality gure for a timinggas.
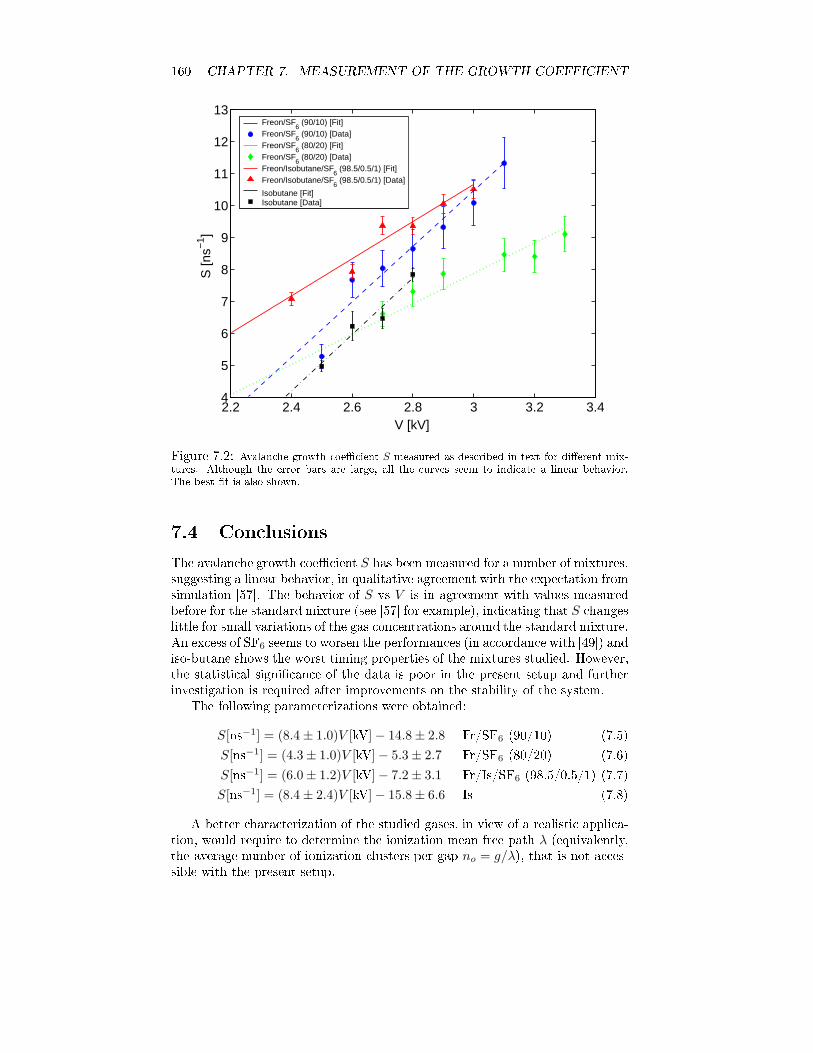
160 CHAPTER 7. MEASUREMENT OF THE GROWTH COEFFICIENT
2.2 2.4 2.6 2.8 3 3.2 3.44
5
6
7
8
9
10
11
12
13
V [kV]
S [n
s−1 ]
Freon/SF6 (90/10) [Fit]
Freon/SF6 (90/10) [Data]
Freon/SF6 (80/20) [Fit]
Freon/SF6 (80/20) [Data]
Freon/Isobutane/SF6 (98.5/0.5/1) [Fit]
Freon/Isobutane/SF6 (98.5/0.5/1) [Data]
Isobutane [Fit]Isobutane [Data]
Figure 7.2: Avalan he growth oe ient S measured as des ribed in text for dierent mix-tures. Although the error bars are large, all the urves seem to indi ate a linear behavior.The best t is also shown.7.4 Con lusionsThe avalan he growth oe ient S has been measured for a number of mixtures,suggesting a linear behavior, in qualitative agreement with the expe tation fromsimulation [57. The behavior of S vs V is in agreement with values measuredbefore for the standard mixture (see [57 for example), indi ating that S hangeslittle for small variations of the gas on entrations around the standard mixture.An ex ess of SF6 seems to worsen the performan es (in a ordan e with [49) andiso-butane shows the worst timing properties of the mixtures studied. However,the statisti al signi an e of the data is poor in the present setup and furtherinvestigation is required after improvements on the stability of the system.The following parameterizations were obtained:S[ns−1] = (8.4 ± 1.0)V [kV] − 14.8 ± 2.8 Fr/SF6 (90/10) (7.5)S[ns−1] = (4.3 ± 1.0)V [kV] − 5.3 ± 2.7 Fr/SF6 (80/20) (7.6)S[ns−1] = (6.0 ± 1.2)V [kV] − 7.2 ± 3.1 Fr/Is/SF6 (98.5/0.5/1) (7.7)S[ns−1] = (8.4 ± 2.4)V [kV] − 15.8 ± 6.6 Is (7.8)A better hara terization of the studied gases, in view of a realisti appli a-tion, would require to determine the ionization mean free path λ (equivalently,the average number of ionization lusters per gap no = g/λ), that is not a es-sible with the present setup.

Chapter 8In rease of rate apabilitywith T8.1 RPC behavior at high rates8.1.1 The DC modelIt is well known that the rate limitation of RPCs is related to the total resistan eof the plates. Roughly speaking this means that, when an avalan he is produ edinside the dete tor, the eld is lo ally perturbed during a hara teristi timeτg ∼ RC (R and C are the resistan e and apa ity of the plates, respe tively).The perturbation ae ts the forth oming avalan hes, and mimi s, in average,a situation where the ele tri eld is lower than the applied one. It has beenshown in the introdu tion (se tion 3.2.7) that, in a rst approa h, it is enoughfor des ribing rate ee ts to onsider the average ohmi drop in the resistiveplates, a ording to the Ohm's law [158:
Vgap = V − IR (8.1)that an be rewritten as:I = Agεφiq (8.2)
φi stands for the irradiation over the RPC in units of [L−2[T−1, ε is theprobability of indu ing an avalan he per in oming parti le, Ag is the illuminatedarea and q the average harge released per avalan he1.When working with MIPs, ε is lose to 100%. However, in the parti ular ase of illumination with 1 MeV γ photons it is typi ally as small as 1% [158.Besides that, the hara teristi harge spe tra of γ's for multi-gap RPCs doesnot exhibit a shallow peak as in the ase of MIPs, being rather exponentialinstead (g. 8.4). As the minimum threshold rea hable in the omparator islimited by the noise level, it is di ult to avoid that an important fra tion ofthe avalan he spe tra is not dete table in that ase.The remark is important be ause quite often, and in parti ular for the mea-surements performed along this hapter, Na22 or Co60 γ-emitters are used for1For simpli ity, the total harge is denoted just by q and the prompt harge by qp in thefollowing. 161
162 CHAPTER 8. INCREASE OF RATE CAPABILITY WITH Ttesting RPCs. It is not the purpose of this hapter to provide an estimate for ε,thus the impinging rate times the e ien y is simply re-dened as the primaryrate over the RPC φp = εφi, i.e., able to produ e an avalan he:I = Agφpq (8.3)So, eq. 8.1 an be expressed as:
Vgap = V − φpρdq (8.4)where d is the resistive plate thi kness per gap and ρ its resistivity.On the other hand, in the absen e of dynami ee ts in the plates and on ethe properties of the gas (P , T , gas admixture) and the size of the gap are xed,the average harge is related to the voltage in the gap through a hara teristi urve:q = F (Vgap) (8.5)that an be extrapolated to a dynami situation as:q ≃ F (Vgap) (8.6)This relation establishes a `feedba k' in the drop pro ess given by eq. 8.4. Let'sassume for illustration that V is onstant and the only free parameters are ρ,
φp and d. Therefore, working on expression 8.4:Vgap = V − φpρdF (Vgap) (8.7)V − Vgap
F (Vgap)= G(Vgap) = φpρd (8.8)
Vgap = G−1(φpρd) = f(φpρd) (8.9)As a on lusion, if the performan e of the RPC is ruled by the averageee tive eld Vgap, then any RPC observable O is just a fun tion of φpρd for a onstant applied eld: O|V
= O|V(φpρd). This is denoted as the DC model.As the rates attainable are imposed by ea h parti ular appli ation, the onlyquantity left for optimization is the ` olumn resistivity' ρd. Therefore, to operatean RPC at high rates requires to redu e ρd as mu h as possible within pra ti allimitations (for a omplete dis ussion on what `pra ti al' means see, for instan e,[98).It is onvenient to dene the relative rate apability as κ = ρodo
ρd so thatO|
V= O|
V(φp/κ): if κ is in reased by a fa tor N , then the RPC an work at Ntimes the nominal operating rate with equivalent performan es (this is, indeed,a natural denition for the relative rate apability).Unfortunately, the simple DC model ould be not everything. An RPCobservable may be also sensible to the u tuations of the eld in the gap, i.e.to rms
Vgap[60, [61. This represents a deli ate point, as the time resolution isa se ond moment and therefore a dire t estimate of the u tuations.Along the present hapter, the RPC behavior is studied by assuming thatthe DC model is a urate enough to reprodu e the observables, and a dedi atedstudy of the u tuations is given separately in hapter 9. In order to apply theDC model it will be useful to follow the des riptions of [54 and [58 for trigger

8.1. RPC BEHAVIOR AT HIGH RATES 163RPCs, and the observations on timing RPCs [56, [68, and therefore assumethat the ` hara teristi urve' q vs Vgap of a tRPC under strong Spa e-Chargeis reasonably well des ribed by a linear trend:q = a(Vgap − Vth) (8.10)
Vth stands for the voltage at whi h Spa e-Charge starts to dominate; below it,the RPC enters in the proportional regime, so the gain goes exponentially tozero and the RPC is `swit hed o'. Inserting the relation 8.10 in eq. 8.7:q
a+ Vth = V − φpρdq (8.11)and solving the equation:
q =a(V − Vth)
1 + aφpρd=
q(V, φp = 0)
1 + aφpρd(8.12)inspired by G. Carboni et al. [58.8.1.2 RPC behavior under temperature variationsIt is known that the resistivity of many ion ondu tors follows the Arrhenius-Ras h-Hinri hsen law [74:
ln ρ = a +b
T(8.13)whi h an be onveniently represented for narrow temperature ranges as:
ρ = ρTo
10(To−T )/∆T (8.14)In parti ular, the relation has been proved for glasses that ontain a ertainfra tion of some alkali metal [74. It is expe ted that standard oat glass showsan ion ondu tivity related to the ux of Na+ ions. They are present in theform of NaO2 (sodium dioxide or soda) with typi al on entrations of 15% (SiO2(75%) + NaO2 (15%) + CaO and others (10%))[74. As expe ted, the glass usedfor the onstru tion of the tRPCs tested along this hapter has a resistivity thatfollows the law 8.14, as shown in g. 8.1 (taken from [59).A ording to the ideas developed in previous se tions, it seems that it an bemade use of the exponential de rease of the resistivity with the temperature toexponentially in rease the rate apability κ = ρodo
ρd . This fa t has been alreadydemonstrated by C. Gustavino et al. [73, in the ase of trigger RPCs workingwith MIPs ( osmi rays) over 16 C variation, showing no aging up to 30 Cvariation. In this work, an extension to timing RPCs of this earlier work isproposed, varying the temperature in 42 C.It must be taken into a ount that, when hanging moderately the temper-ature or pressure of a gas, its density s ales as:η ∝ P
T(8.15)On the other hand, the properties of ionized gases are known to depend onthe redu ed ele tri eld E/η (see hapter 2). For oping with hanges of thedensity of the gas, the redu ed voltage is dened as:
V ∗ = Vη
o
η= V
Po
P
T
To(8.16)
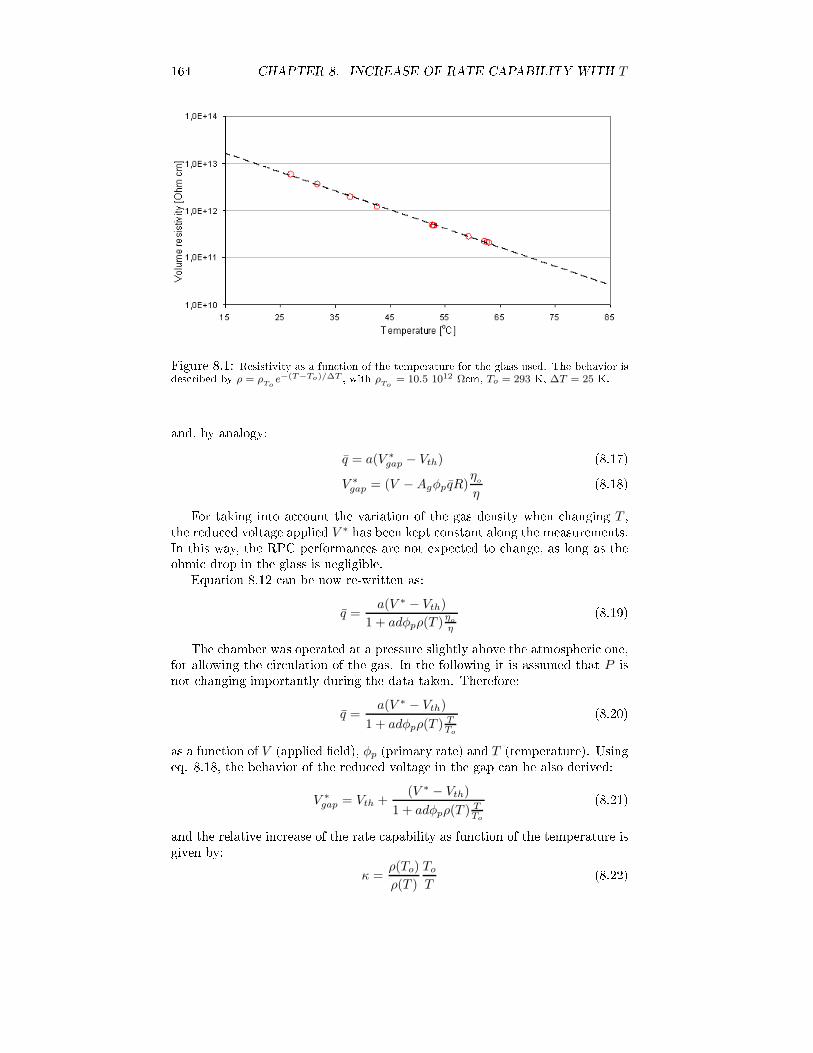
164 CHAPTER 8. INCREASE OF RATE CAPABILITY WITH T
Figure 8.1: Resistivity as a fun tion of the temperature for the glass used. The behavior isdes ribed by ρ = ρTo
e−(T−To)/∆T , with ρTo
= 10.5 1012 Ω m, To = 293 K, ∆T = 25 K.and, by analogy:q = a(V ∗
gap − Vth) (8.17)V ∗
gap = (V − AgφpqR)η
o
η(8.18)For taking into a ount the variation of the gas density when hanging T ,the redu ed voltage applied V ∗ has been kept onstant along the measurements.In this way, the RPC performan es are not expe ted to hange, as long as theohmi drop in the glass is negligible.Equation 8.12 an be now re-written as:
q =a(V ∗ − Vth)
1 + adφpρ(T )ηo
η
(8.19)The hamber was operated at a pressure slightly above the atmospheri one,for allowing the ir ulation of the gas. In the following it is assumed that P isnot hanging importantly during the data taken. Therefore:q =
a(V ∗ − Vth)
1 + adφpρ(T ) TTo
(8.20)as a fun tion of V (applied eld), φp (primary rate) and T (temperature). Usingeq. 8.18, the behavior of the redu ed voltage in the gap an be also derived:V ∗
gap = Vth +(V ∗ − Vth)
1 + adφpρ(T ) TTo
(8.21)and the relative in rease of the rate apability as fun tion of the temperature isgiven by:κ =
ρ(To)
ρ(T )
To
T(8.22)
8.2. THE EXPERIMENT 1658.2 The experiment8.2.1 GoalMerging the ideas dis ussed in previous se tions, one ould aim to des ribe thebehavior of a timing RPC under temperature variations of some tens of degrees,and he k that the in rease in the rate apability mat hes the expe ted from themeasured behavior of the glass resistivity (g. 8.1). The observables studiedare the time resolution σT, peak time to, e ien y ε, prompt harge q
promptanddark ounting rate. The time dieren e between both ends of the dete tor allowsfor a dire t determination of the position x, that is also used in the following.The ultimate goal is to show that the operation of a timing RPC undermodest variations of the temperature is feasible and that an improvement on therate apability up to an order of magnitude in 25 C an be a hieved (a ordingto g. 8.1), while keeping unaltered the performan es.8.2.2 SetupThe tRPC hamber was des ribed in se tion 6.2.1, in parti ular tRPC I (glassele trodes) has been used. The HV s heme is shown in g. 6.1, varying from 2.6-3.2 kV/gap, and the gas mixture was onstituted by C2H2F4 and SF6 (80/20).The FEE boards were developed in the framework of the HADES experiment[159, and they were put at both ends of the ell for providing the position andthe time of ight of the impinging parti les.The main dieren es between the FEE used here and previous designs [151,were that a) the dead-time of 1 µs at the level of the omparator was imple-mented through 2 ip-ops and a digital delay, b) the ele troni omponentshad been also updated to a Philips BGA-2712 pre-amplier and a dual om-parator AD96685, ) the topology was ompletely dierent owing to HADESspa e onstraints. A pi ture of the FEE board is shown in g. 8.2 and details an be found in [159.The analog signal was buered after ampli ation and later shaped beforegoing to a 2249W Le roy ADC that provided the harge integrated over 200 ns.For the digital part, a 2228 Le roy TDC with 50 ps bin width was used. Allmodules are CAMAC based. The threshold of the omparator was set to 10mV.The tRPC gas box was pla ed inside a sleeve that ould be heated at will.For providing an adequate and ontrolled heating system it was made use ofthe well known PT100 sensors (Platinum Resistan e Thermometers). They areaordable, easy to use, and allow to measure temperature variations in the s aleof a fra tion of degree, as it was required. A pi ture of the setup is shown ing. 8.3.High primary rates over the tRPC were a hieved by illumination with aNa22 sour e together with a Co60 sour e of similar intensity, both `point-like'.A ording to [160 Na22 de ays in a β+ pro ess, following:Na22 → Ne∗22
+ e+ + νe (8.23)Ne∗22 → Ne22 + γ(1.274) (8.24)and the resulting γ spe trum ontains photons oming from positron annihila-tion (E = 0.511 MeV) and from Neon de-ex itation (E = 1.274 MeV).

166 CHAPTER 8. INCREASE OF RATE CAPABILITY WITH T
Figure 8.2: Pi ture showing a 2- hannel board as the one used for these tests. The larger omponent is the digital delay, regulators are visible in the lower-right part. The small hipstowards the left of the board (input signal) are the ampliers.
Figure 8.3: S heme showing the experimental setup. It allows for a measurement in self-trigger mode (for e ien y) or in oin iden e mode (for timing) using as referen e a fasts intillator with a resolution of 110 ps σ for 1 MeV γ-photons.
8.2. THE EXPERIMENT 167Co60 is a β− sour e whose daughter nu lei de ays through a double transitionwith almost 100% bran hing ratio. The emited photons are not ompletely olinear but follow an angular distribution peaked at 180 [160:Co60 → Ni∗60+ e− + νe (8.25)Ni∗60 → Ni60 + γ(1.173) + γ(1.332) (8.26)Four dierent sour es with dierent a tivities A and distan es L to the tRPCwere used:1. Sour e 1: A = 0.61 mC (Co60) + 0.46 mC (Na22), L ≃ 5 m.2. Sour e 2: A = 0.61 mC (Co60) + 0.46 mC (Na22), L ≃ 5 m + 2.5 m.3. Sour e 3: A = 0.46 mC (Na22), L ≃ 5 m.4. Sour e 4: A = 0.046 mC (Na22), L ≃ 5 m.Due to the exponential harge spe trum observed (g. 8.4), it was notpossible to rea h an e ien y plateau. This must be ompared with the ase ofMIPs where, in 4-gap tRPCs, a shallow peak is visible in the harge distributionand the e ien y `plateau' is well dened (see [68 and also hapter 6).It must be said that, for the ase of 1 MeV γ-photons, the tRPC e ien yis related to the ele tron extra tion probability (mainly Compton) from theele trode, that brings the following onsequen es:1. The angular and energy distributions of the eje ted ele trons give an extra ontribution to the time jitter, whi h is not present in the ase of MIPs[161, suggesting that:
σT (γs) > σ
T (mips) (8.27)2. The absolute e ien y is dominated by the extra tion probability in theele trode and not by the ionization probability in the gas. This implies:ε(γs) ≪ ε(mips) (8.28)3. Due to the low energy of the extra ted Compton ele tron, it will be verylikely stopped before rossing the following gap. On the other hand, understrong Spa e-Charge, the olle ted harge q is rather independent from theprimary ionization. Therefore, for a 4-gap tRPC:q(γs) ∼
1
4q(mips) (8.29)

168 CHAPTER 8. INCREASE OF RATE CAPABILITY WITH T
500 1000 1500 200010
0
101
102
103
Prompt charge [ADC units]
coun
ts [i
n 10
AD
C u
nits
bin
]
2.6 kV/gap
3.0 kV/gap
3.2 kV/gap
Figure 8.4: Charge spe tra for dierent applied voltages and φp < 20 Hz/ m2 (V ∗
gap ≃ V ∗).The t is performed over the rst 600 ADC hannels. The exponential t des ribes very wellthe observed spe tra (note that the s ale is logarithmi ); however, for high voltages, a smallpopulation of streamers an be observed. At qth=30 a peak is present, aused by the thresholdof the omparator.8.2.3 Data a quired55 dierent runs were performed in order to study the ee ts of rate, temper-ature and voltage over the redu ed average voltage in the gap V ∗gap or, equiva-lently, the dete tor gain. These runs are grouped as follows:
• 4 sets of runs for every sour e (1, 2, 3, 4) at a xed redu ed voltageV ∗ = 3.2 kV/gap for 7 temperatures (21, 27, 33, 37, 43, 55, 63 C). 28runs.
• 3 sets of runs for 2 dierent sour es (3, 4) at 9 values of the redu ed voltageV ∗ (2.6, 2.7, 2.8, 2.9, 3.0, 3.1, 3.2, 3.3, 3.4 kV/gap) and 2 temperatures(21, 33 C). 27 runs.The urrent was monitored after any temperature variation, for guaranteeingthat the thermal equilibrium was rea hed (the urrent stabilizes). It ould beestimated that the thermal equilibrium was rea hed at a short time s ale ofminutes. However, it is known that some onditioning is needed at the times ale of hours [162 that redu es the ontribution of parasiti urrents. Owingto pra ti al limitations, the studies are restri ted to the thermal equilibriumstage and it was not tried to rea h a full onditioning of the tRPC. In any ase,the dark rate estimated in the absen e of a full onditioning represents an upper

8.2. THE EXPERIMENT 169limit to the dark rate, being still mu h smaller than the typi al working rates(see se tion 8.3.4).−5 0 5
0
0.5
1
1.5
Position [cm]
Sin
gle
rate
[kH
z/cm
2 ]
−5 0 50
10
20
30
40
50
60
70
80
Position [cm]Ave
rage
pro
mpt
cha
rge
[AD
C u
nits
]
−5 0 50
0.02
0.04
0.06
0.08
0.1
Position [cm]
Sin
gle
rate
[kH
z/cm
2 ]
−5 0 510
20
30
40
50
60
70
80
Position [cm]
Ave
rage
pro
mpt
cha
rge
[AD
C u
nits
]2.6 kV*2.7 kV*2.8 kV*2.9 kV*3.0 kV*3.1 kV*3.2 kV*
21 oC27 oC33 oC38 oC44 oC54 oC
Figure 8.5: Data taken for sour e 1 (more intense) at V ∗ = 3.2 kV/gap at dierent temper-atures: rate (up left) and prompt harge (up right). Also shown the data for sour e 4 (lessintense) at T=21 C and dierent voltages: rate (down left) and prompt harge (down right).Examples of the data taken are shown in gs. 8.5 and 8.6. The `single' ratestands for the rate in self-trigger mode (the tRPC is triggered by any avalan hethat res the threshold of the omparator). The tRPC ell was 60 m long, sothat its position distribution extended up to roughly ± 30 m (see for instan eg. 8.14); however, only the inner region (± 7.5 m), where the un ertaintieson the primary rate are smaller, was studied in the following. It is shown ing. 8.5 how the ee t of the in rease in temperature is huge for the single rate(in sour e 1, a fa tor 15 re overy is seen in the ounting rate when going from21 to 54 C); however, the variations in the average prompt harge are rathermodest (around a fa tor 2). The explanation for this apparent in onsisten ylays in the fa t that the shape of the harge distribution is exponential and, asa onsequen e, the e ien y is very sensitive to even very small variations ofthe gain.In g. 8.5, some entral features are illustrated: when looking at sour e 1 atxed temperature, a dip around the position of the sour e (x=0) is seen; thisis not strange if the eld is signi antly redu ed due to the drop in the glassplates. When the temperature is in reased, the eld in the gap starts to re over,and both the single rate and average prompt harge grow. Also by looking at

170 CHAPTER 8. INCREASE OF RATE CAPABILITY WITH T
−1000 −500 −300 0 300 500 100010
0
101
102
Time difference [ps]
Eve
nts
[in 3
0ps
bin]
σT (RPC) = (1452 − 1102)0.5 = 95 ps
3−σ tails = 3.1%
Events = 2958
σT (combined) = 145 ps
Figure 8.6: Typi al time of ight distribution obtained using a s intillator referen e of 110ps σ. The time- harge orre tion has been already applied. As ompared to MIPs ( hapter6) the σ of the distribution is signi antly larger (around 90-100 ps). The distribution shown orresponds to V ∗ = 3.2 kV/gap, T=21 C, sour e 4 (low rate).sour e 4 (less intense, V ∗gap ≃ V ∗) it an be realized that the harge and singlerate in rease at on e as a fun tion of the redu ed voltage V ∗, as expe ted.It has to be noted that, for some of the runs, the position distribution ap-peared globally shifted by 1-2 m, typi ally. This orresponds to a dieren e intime of 100-200 ps between hannels and an be as ribed to ele troni walks. Itwas subtra ted after imposing that all the distributions were entered at x = 0.Fig. 8.6 shows the typi al time resolution obtained in ase of illuminationwith 1 MeV γ photons by using a referen e s intillator with a time responsewidth of 110 ps. The resulting tRPC response is at the level of 90-100 ps σ.8.3 Single rate8.3.1 Determination of the primary rate proleDue to the absen e of a `plateau', the e ien y was dened by using as referen ethe ounting rate observed at a ertain operating voltage, in the limit V ∗
gap ≃ V ∗(low drop). For this purpose, the weaker sour e, 4, at V ∗ = 3.2 kV/gap wasused. However, it was required to make a partial use of the ee t to be measured,be ause even for the sour e 4 the voltage drop in the plates was not negligible.So, the temperature was in reased up to rea h a situation where the observedrate be omes independent from it, that an be onsidered as an indi ation thatthe drop in the plates is not ae ting the measurements (V ∗gap ≃ V ∗), and theobserved prole was taken as referen e.
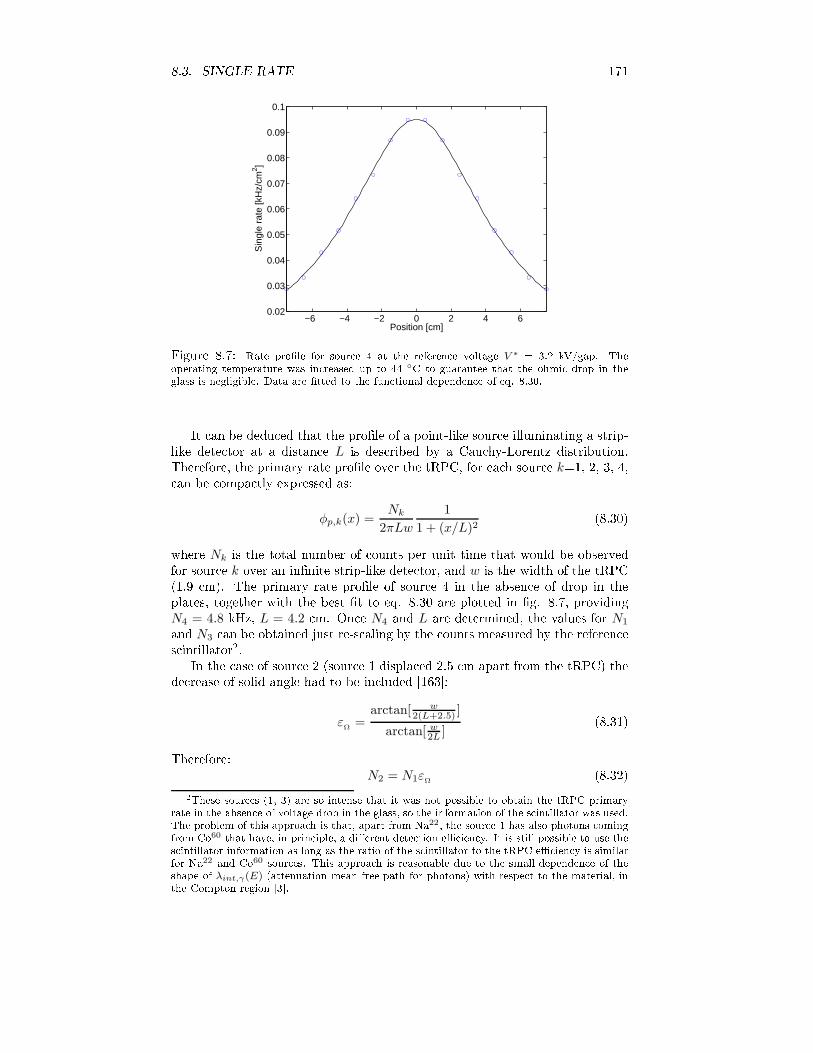
8.3. SINGLE RATE 171
−6 −4 −2 0 2 4 60.02
0.03
0.04
0.05
0.06
0.07
0.08
0.09
0.1
Position [cm]
Sin
gle
rate
[kH
z/cm
2 ]
Figure 8.7: Rate prole for sour e 4 at the referen e voltage V ∗ = 3.2 kV/gap. Theoperating temperature was in reased up to 44 C to guarantee that the ohmi drop in theglass is negligible. Data are tted to the fun tional dependen e of eq. 8.30.It an be dedu ed that the prole of a point-like sour e illuminating a strip-like dete tor at a distan e L is des ribed by a Cau hy-Lorentz distribution.Therefore, the primary rate prole over the tRPC, for ea h sour e k=1, 2, 3, 4, an be ompa tly expressed as:φp,k(x) =
Nk
2πLw
1
1 + (x/L)2(8.30)where Nk is the total number of ounts per unit time that would be observedfor sour e k over an innite strip-like dete tor, and w is the width of the tRPC(1.9 m). The primary rate prole of sour e 4 in the absen e of drop in theplates, together with the best t to eq. 8.30 are plotted in g. 8.7, providing
N4 = 4.8 kHz, L = 4.2 m. On e N4 and L are determined, the values for N1and N3 an be obtained just re-s aling by the ounts measured by the referen es intillator2.In the ase of sour e 2 (sour e 1 displa ed 2.5 m apart from the tRPC) thede rease of solid angle had to be in luded [163:εΩ
=arctan[ w
2(L+2.5) ]
arctan[ w2L ]
(8.31)Therefore:N2 = N1εΩ (8.32)2These sour es (1, 3) are so intense that it was not possible to obtain the tRPC primaryrate in the absen e of voltage drop in the glass, so the information of the s intillator was used.The problem of this approa h is that, apart from Na22, the sour e 1 has also photons omingfrom Co60 that have, in prin iple, a dierent dete tion e ien y. It is still possible to use thes intillator information as long as the ratio of the s intillator to the tRPC e ien y is similarfor Na22 and Co60 sour es. This approa h is reasonable due to the small dependen e of theshape of λint,γ(E) (attenuation mean free path for photons) with respe t to the material, inthe Compton region [3.

172 CHAPTER 8. INCREASE OF RATE CAPABILITY WITH TSour e Nk[kHz L[ m εΩ1 90 4.2 12 57 6.7 0.633 46 4.2 14 4.8 4.2 1Table 8.1: Sour es used, together with its normalization fa tor, distan es to the tRPC andgeometri orre tion.DAQ dead-timeThe rates studied were so high that the DAQ system was limited by its dead-time. To over ome the problem an external referen e, a Caen 145 quad s aler,was used for translating from the DAQ ounting rate to the real tRPC ountingrate.FEE dead-timeThere is still a tiny ee t to be a ounted for: the tRPC ounting rate in thes aler is slightly biased by the dead-time of the FEE itself (1µs). A orre tionmust be applied by following [12:Nreal =
N
1 − Nτ(8.33)being N the frequen y of events measured by the s aler and τ the dead-time ofthe FEE. This expression is exa t for a non-paralyzable measuring devi e [12,as is the ase for the dead time of the omparator3. The orre tion given by eq.8.33 is in pra ti e not larger than 5% for the highest rates.The values nally obtained for Nk are summarized in table 8.1 and theprimary rate proles for ea h sour e are shown in g. 8.8, together with thedata taken at dierent temperatures.8.3.2 A model for the e ien y to γ raysIt an be developed a simple model that ontains all the relevant features ofa timing RPC irradiated with γ photons, based on the assumptions des ribednext:1. The DC model des ribes the behavior of q, qp and ε.2. In the regime studied, the average total harge q is proportional to theredu ed voltage in the gap V ∗
gap.3. The prompt harge spe trum dNdqp
is well des ribed by an exponential:dN
dqp
=1
qp
e−
qpqp (8.34)3Non-paralyzable means that the dete tion devi e is not registering any other event duringa xed dead-time after the rst event arrives.
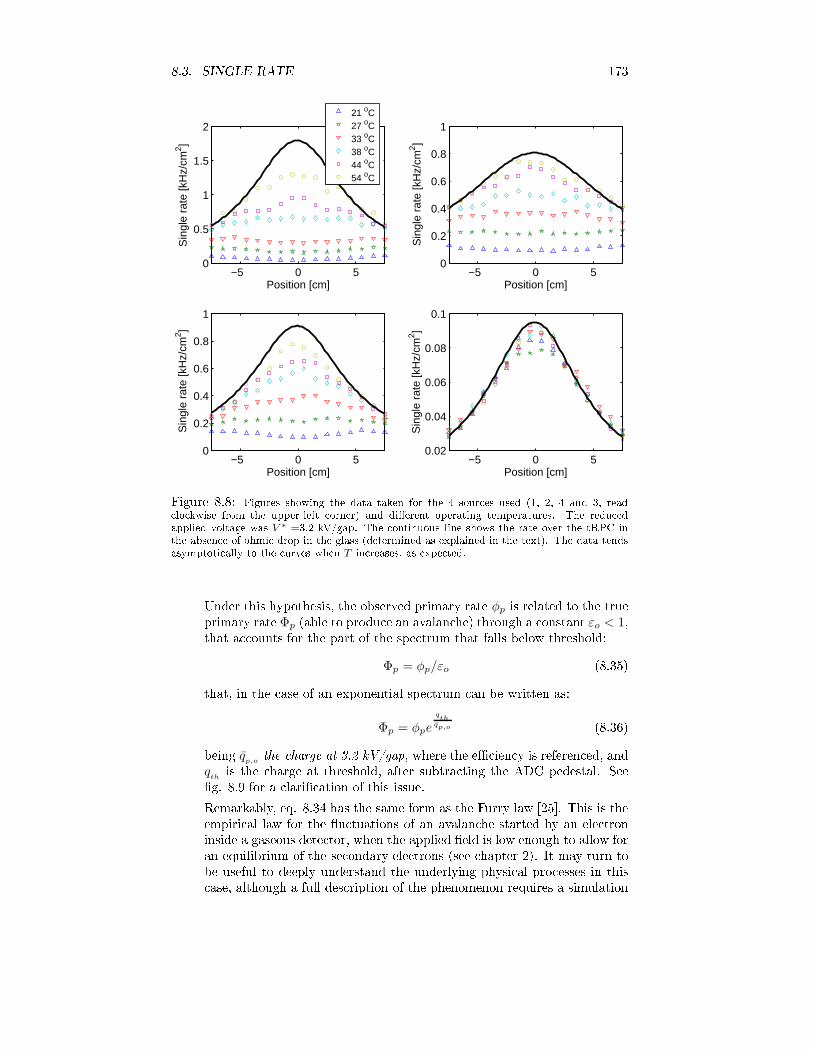
8.3. SINGLE RATE 173
−5 0 50
0.5
1
1.5
2
Position [cm]
Sin
gle
rate
[kH
z/cm
2 ]
−5 0 50
0.2
0.4
0.6
0.8
1
Position [cm]
Sin
gle
rate
[kH
z/cm
2 ]
−5 0 50
0.2
0.4
0.6
0.8
1
Position [cm]
Sin
gle
rate
[kH
z/cm
2 ]
−5 0 50.02
0.04
0.06
0.08
0.1
Position [cm]
Sin
gle
rate
[kH
z/cm
2 ]
21 oC27 oC33 oC38 oC44 oC54 oC
Figure 8.8: Figures showing the data taken for the 4 sour es used (1, 2, 4 and 3, read lo kwise from the upper-left orner) and dierent operating temperatures. The redu edapplied voltage was V ∗ =3.2 kV/gap. The ontinuous line shows the rate over the tRPC inthe absen e of ohmi drop in the glass (determined as explained in the text). The data tendsasymptoti ally to the urves when T in reases, as expe ted.Under this hypothesis, the observed primary rate φp is related to the trueprimary rate Φp (able to produ e an avalan he) through a onstant εo < 1,that a ounts for the part of the spe trum that falls below threshold:Φp = φp/εo (8.35)that, in the ase of an exponential spe trum an be written as:
Φp = φpeqth
qp,o (8.36)being qp,o
the harge at 3.2 kV/gap, where the e ien y is referen ed, andq
this the harge at threshold, after subtra ting the ADC pedestal. Seeg. 8.9 for a lari ation of this issue.Remarkably, eq. 8.34 has the same form as the Furry law [25. This is theempiri al law for the u tuations of an avalan he started by an ele troninside a gaseous dete tor, when the applied eld is low enough to allow foran equilibrium of the se ondary ele trons (see hapter 2). It may turn tobe useful to deeply understand the underlying physi al pro esses in this ase, although a full des ription of the phenomenon requires a simulation
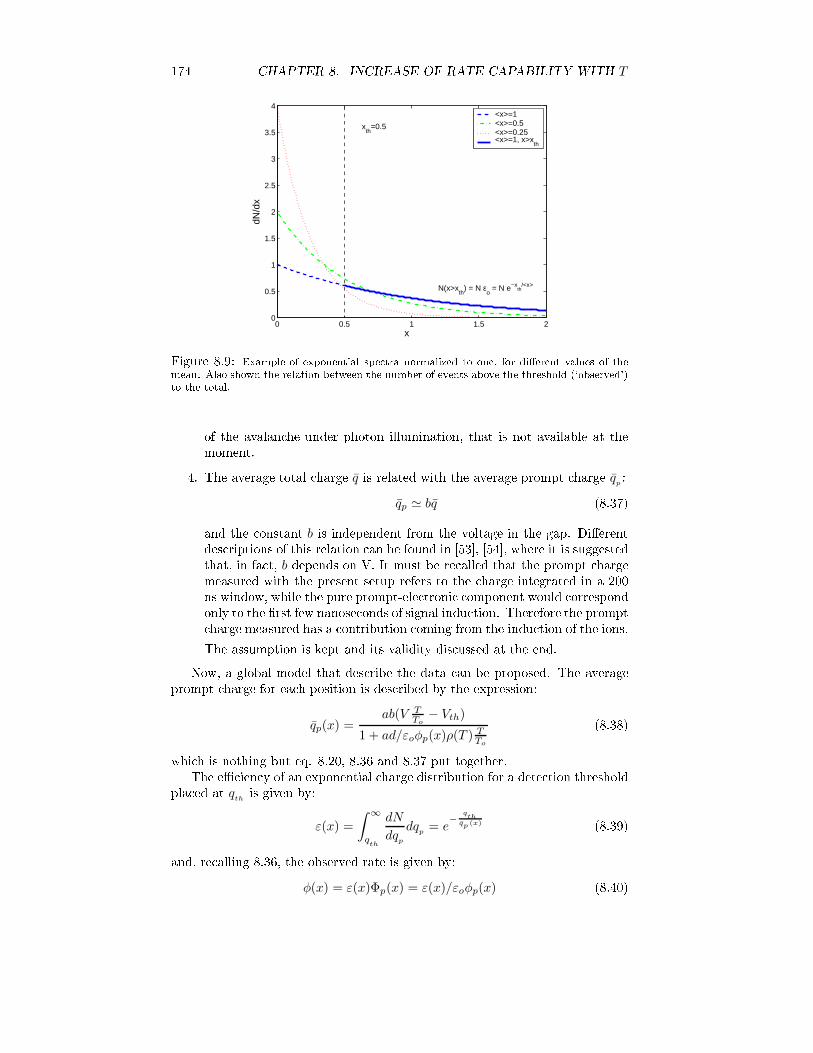
174 CHAPTER 8. INCREASE OF RATE CAPABILITY WITH T
0 0.5 1 1.5 20
0.5
1
1.5
2
2.5
3
3.5
4
x
dN/d
x
<x>=1<x>=0.5<x>=0.25<x>=1, x>x
th
xth
=0.5
N(x>xth
) = N εo = N e−x
th/<x>Figure 8.9: Example of exponential spe tra normalized to one, for dierent values of themean. Also shown the relation between the number of events above the threshold (`observed')to the total.of the avalan he under photon illumination, that is not available at themoment.4. The average total harge q is related with the average prompt harge q
p:
qp ≃ bq (8.37)and the onstant b is independent from the voltage in the gap. Dierentdes riptions of this relation an be found in [53, [54, where it is suggestedthat, in fa t, b depends on V. It must be re alled that the prompt hargemeasured with the present setup refers to the harge integrated in a 200ns window, while the pure prompt-ele troni omponent would orrespondonly to the rst few nanose onds of signal indu tion. Therefore the prompt harge measured has a ontribution oming from the indu tion of the ions.The assumption is kept and its validity dis ussed at the end.Now, a global model that des ribe the data an be proposed. The averageprompt harge for ea h position is des ribed by the expression:qp(x) =
ab(V TTo
− Vth)
1 + ad/εoφp(x)ρ(T ) TTo
(8.38)whi h is nothing but eq. 8.20, 8.36 and 8.37 put together.The e ien y of an exponential harge distribution for a dete tion thresholdpla ed at qth
is given by:ε(x) =
∫ ∞
qth
dN
dqp
dqp
= e−
qth
qp (x) (8.39)and, re alling 8.36, the observed rate is given by:φ(x) = ε(x)Φp(x) = ε(x)/εoφp(x) (8.40)

8.3. SINGLE RATE 175The required fun tional dependen es for the model are given by eq. 8.30(observed primary rate φp), eq. 8.38 (average prompt harge qp) and eq. 8.40(observed rate φ).The free parameters are p= ab, Vth, a/εoρ(T ), i.e., 2+6 (one for ea htemperature studied) = 8 parameters. They were obtained from a global t to45 urves, ex luding those runs at T > 55C (the dark ounting rate be omesimportant) and V ∗ > 3.2 kV (the fra tion of streamers be omes important). A
χ2 minimization of the following fun tional was performed:χ2(q
ik, φ
ik, p) =
∑
k
∑
i
[(q
ik− q(p)
wq, ik
)2 + (φ
ik− φ(p)
wφ, ik
)2] (8.41)where qik
and φik
are, respe tively, the prompt harge and observed rate forea h position i and run k. q(p) and φ(p) are the expe tations of the model as afun tion of the set of parameters p. The average harge qikis obtained from anexponential t in ea h of the position slides within the rst 600 ADC hannels(g. 8.4). The weights used were the pure Poissonian weights in the ase of
wφ, ik
(square root of the number of ounts), and the un ertainty obtained fromthe exponential t in the ase of wq. It was seen that to multiply wq by 2improves the des ription of the prompt harge data; due to the dierent natureof the errors this seems to be reasonable.The t to the model, together with the data, are shown in gs. 8.10 and 8.11.The overall agreement suggests an adequate interpretation of the underlyingphysi al pro esses. A detailed evaluation of the results is given in the nextse tion.8.3.3 Interpretation of the resultsOf the eight parameters of the t p=ab, Vth, a/εoρ(T ), 6 an be dire tlyinterpreted:• The in rease on the rate apability κ is related to the parameters g(T ) =
a/εoρ(T ). In parti ular, κ an be referred to To=21 C, thus providingκ = T
To
ρ(To)ρ(T ) = T
To
g(To)g(T ) (eq. 8.22).
• The voltage at whi h Spa e-Charge starts, Vth, is obtained dire tly fromthe t.The other two parameters, a′ = ab and g(To) = a/εoρ(To), are not relevantfor the purposes of this work and hardly omparable with known data. How-ever, a rough estimation of a an be provided, by taking the value of ρ(To)from g. 8.1 and assuming an exponential behavior of the primary spe trumbelow threshold (for estimating εo), yielding a = 1.144 pC/kV, whi h is notunreasonable. Further omparisons on this issue require an improved setup.

176 CHAPTER 8. INCREASE OF RATE CAPABILITY WITH T
−5 0 50
0.5
1
1.5
2
Position [cm]
Sin
gle
rate
[kH
z/cm
2 ]
−5 0 50
0.2
0.4
0.6
0.8
1
Position [cm]
Sin
gle
rate
[kH
z/cm
2 ]−5 0 5
0
0.2
0.4
0.6
0.8
1
Position [cm]
Sin
gle
rate
[kH
z/cm
2 ]
−5 0 50.02
0.04
0.06
0.08
0.1
Position [cm]S
ingl
e ra
te [k
Hz/
cm2 ]
21 oC27 oC33 oC38 oC44 oC54 oC
−5 0 50
20
40
60
Position [cm]
Ave
rage
pro
mpt
cha
rge
[AD
C u
nits
]
−5 0 50
20
40
60
Ave
rage
pro
mpt
cha
rge
[AD
C u
nits
]
Position [cm]
−5 0 50
20
40
60
Position [cm]
Ave
rage
pro
mpt
cha
rge
[AD
C u
nits
]
−5 0 50
20
40
60
Position [cm]Ave
rage
pro
mpt
cha
rge
[AD
C u
nits
]
21 oC27 oC33 oC38 oC44 oC54 oC
Figure 8.10: Comparison between model and data for dierent temperatures (21 C ·-, 27C ··, 33 C - -, 38 C ·-, 44 C ··, 54 C - -). The study was done for dierent sour es (1, 2,4 and 3 lo kwise from up-left orner) and the redu ed voltage was kept onstant at a valueV ∗ = 3.2 kV/gap.
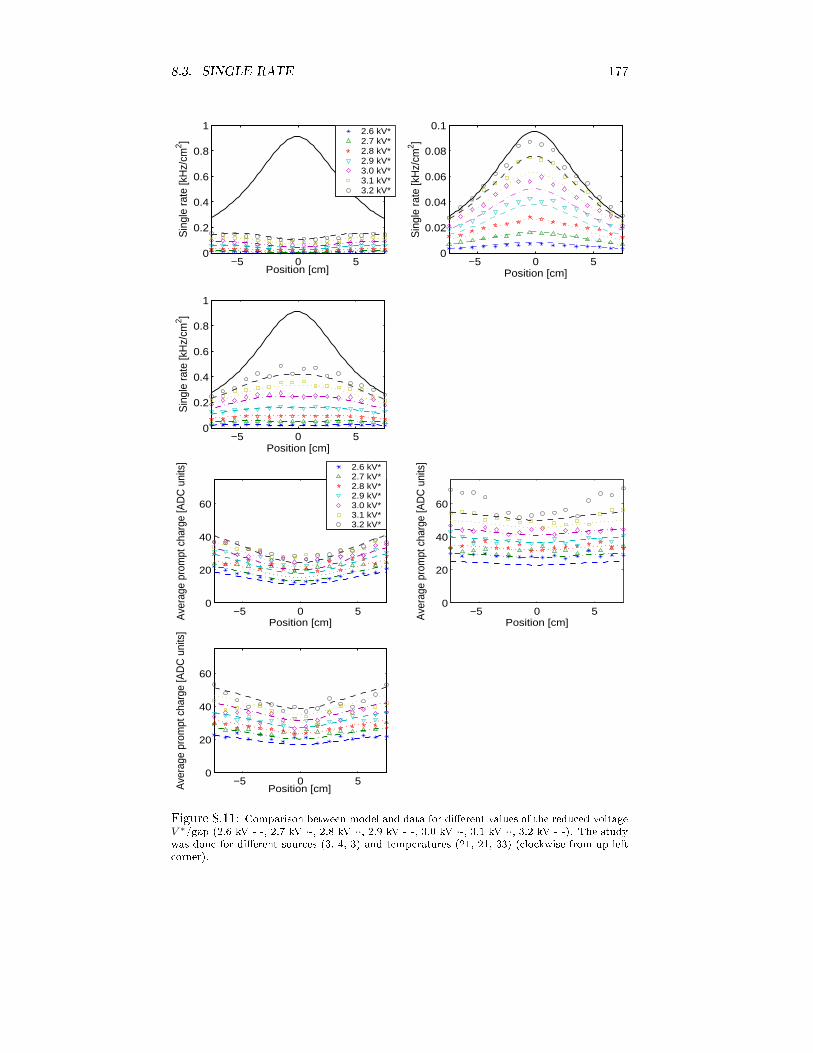
8.3. SINGLE RATE 177−5 0 5
0
0.2
0.4
0.6
0.8
1
Position [cm]
Sin
gle
rate
[kH
z/cm
2 ]
−5 0 50
0.02
0.04
0.06
0.08
0.1
Position [cm]
Sin
gle
rate
[kH
z/cm
2 ]
−5 0 50
0.2
0.4
0.6
0.8
1
Position [cm]
Sin
gle
rate
[kH
z/cm
2 ]
2.6 kV*2.7 kV*2.8 kV*2.9 kV*3.0 kV*3.1 kV*3.2 kV*
−5 0 50
20
40
60
Position [cm]Ave
rage
pro
mpt
cha
rge
[AD
C u
nits
]
−5 0 50
20
40
60
Position [cm]Ave
rage
pro
mpt
cha
rge
[AD
C u
nits
]
−5 0 50
20
40
60
Position [cm]Ave
rage
pro
mpt
cha
rge
[AD
C u
nits
]
2.6 kV*2.7 kV*2.8 kV*2.9 kV*3.0 kV*3.1 kV*3.2 kV*
Figure 8.11: Comparison between model and data for dierent values of the redu ed voltageV ∗/gap (2.6 kV - -, 2.7 kV ·-, 2.8 kV ··, 2.9 kV - -, 3.0 kV ·-, 3.1 kV ··, 3.2 kV - -). The studywas done for dierent sour es (3, 4, 3) and temperatures (21, 21, 33) ( lo kwise from up-left orner).

178 CHAPTER 8. INCREASE OF RATE CAPABILITY WITH T
20 25 30 35 40 45 5010
0
101
Temperature [oC]
Rat
e ca
pabi
lity
(κ)
Figure 8.12: Comparison between the behavior of the rate apability from independentmeasurements of the resistivity (eq. 8.1) in dashed line, and the output of the model (dots).The ontinuous line is the best t to the points.The in rease of rate apability relative to To = 21C is shown in g. 8.12together with the expe tations from laboratory measurements of the glass re-sistivity (g. 8.1, [164). From the t, the oe ient ∆T that regulates thebehavior of the resistivity (eq. 8.14) an be obtained. The result of the tis ∆Tfit= 24.5±1.5 to be ompared with the value obtained in the laboratory∆Tlab= 25.0±0.3 (g. 8.1). Therefore, it seems to be strongly supported bythe data the fa t that the in rease of the rate apability is ompatible with thein rease of the glass ondu tivity, as expe ted from the DC model.On the other hand, the value obtained for Vth is 2.15 kV/gap, that is inqualitative agreement with the measurements of [68 for the standard mixture.For an easier interpretation of the model, it is better to group all the urvesin two `Universal urves' of e ien y and harge as a fun tion of φp/κ (seese tion 8.1.1). By looking at g. 8.13 it is possible to interpret the results:
• As expe ted from eq. 8.9, all the points for dierent temperatures ni elysuperimpose, onrming that the model proposed provides the `in reaseon rate apability' κ. Complementary, g. 8.12 onrms that, indeed, therate apability is proportional to the glass ondu tivity.• The fa t that the urve is not reprodu ing exa tly the behavior of dataindi ates:

8.3. SINGLE RATE 1790 0.2 0.4 0.6 0.8 1 1.2 1.4 1.6 1.8
0
0.2
0.4
0.6
0.8
1
1.2
1.4
Φ [kHz/cm2]
effic
ienc
y (ε
)
0 0.2 0.4 0.6 0.8 1 1.2 1.4 1.6 1.80
0.2
0.4
0.6
0.8
1
1.2
1/κ(T) × Φ [kHz/cm2]
effic
ienc
y (ε
)
0 0.2 0.4 0.6 0.8 1 1.2 1.4 1.6 1.80
20
40
60
80
Φ [kHz/cm2]
Aver
age
prom
pt c
harg
e [A
DC
uni
ts]
0 0.2 0.4 0.6 0.8 1 1.2 1.4 1.6 1.80
20
40
60
80
1/κ(T) × Φ [kHz/cm2]
Aver
age
prom
pt c
harg
e [A
DC
uni
ts]
Figure 8.13: Figures for evaluating the goodness of the t in a global view. It is shownthe behavior of the e ien y and prompt harge at V ∗=3.2 kV/gap as a fun tion of ratefor dierent temperatures (21, 27, 33, 38, 44, 54 C from bottom to top). Also shown thebehavior of the same magnitudes when all the urves are fused in a single one, after re-s alingthe primary rate by 1/κ.

180 CHAPTER 8. INCREASE OF RATE CAPABILITY WITH T Deviations in the e ien y plot ould indi ate deviations from theexponential law of the harge spe trum (in parti ular a small ee tis seen for the lower rates). Deviations in the harge plot ould indi ate that some of the hypoth-esis are wrong in the derivation of the fun tional dependen e of theprompt harge. In parti ular they an be due to the fa t that b (thatrelates the prompt and the total harge) is not exa tly a onstant butdepends on V ∗gap and therefore on rate. A wrong des ription of the harge will also be related to a wrong des ription of the e ien y.Despite the dis repan ies between data and model, the t is generally betterthan 10% and not worser than 30% for any point.8.3.4 Dark rateAn anomalous in rease of the dark ounting rate has been observed at 63 C,resulting in a deterioration of the tRPC performan es. The ee t is visible evenwhen the sour e is illuminating the tRPC (g. 8.14).The observed dark ounting rate is plotted in g. 8.15 for sour e 3, showingan ee t similar to the reported for trigger RPCs [165, i.e., a linear in reasefollowed by an exponential in rease. The dieren e is that here the transitionis observed at 55 C while in [165 it was seen at 30 C. When looking atthe fra tion of streamers, an in rease with the temperature is apparent. Thisis expe ted be ause the eld in the gap is re overing, and a ertain level ofstreamers was present in the absen e of voltage drop in the plates. This explainsthe behavior up to 55 C, where the fra tion of streamers is similar to the valueobtained for the sour e 4 at V ∗
gap ≃ 3.2 kV/gap, being approximately 5% of theevents. However, above 55 C, the fra tion of streamers doubles, suggestingthat a dierent pro ess starts in the gap.
−4000 −3000 −2000 −1000 0 1000 2000 3000 40000
0.1
0.2
0.3
0.4
0.5
0.6
0.7
0.8
Position [mm]
Sin
gle
rate
[kH
z/cm
2 ]
T=21 oC, source 3, V* = 3.2 kV/gapT=54 oC, source 3, V* = 3.2 kV/gapT=63 oC, source 3, V* = 3.2 kV/gap
Figure 8.14: Position distribution of hits over the tRPC. There are two main ee ts above54 C: a) the rate at maximum de reases, indi ating that some kind of saturation ee t ispresent, likely related to the in rease in the dark rate, b) the distribution lose to the ends ofthe dete tor shows peaks that are not related to the sour e.

8.4. TIME RESPONSE 18120 30 40 50 60 70
100
101
102
T [oC]
Dar
k ra
te [H
z/cm
2 ]
20 30 40 50 60 700.02
0.03
0.04
0.05
0.06
0.07
0.08
0.09
0.1
T [oC]
Fra
ctio
n of
str
eam
ers
Figure 8.15: The left-most gure shows the dark ounting rate at V ∗ ≃ V ∗
gap = 3.2 kV/gap.Two separated regions are seen: one, up to 50 C, where the variations are very small, andthen a sudden in rease up to 2 orders of magnitude. In the right, the fra tion of streamers isshown as a fun tion of T for sour e 3, at V ∗ = 3.2 kV/gap.8.4 Time responseFor measuring the tRPC time response as a fun tion of temperature variations,one of the fast referen e s intillators already des ribed in se tion 6.2.3 has beenused, yielding a time resolution of σT
= 110 ps for 1 MeV γ photons (andGaussian response). Both the Na22 and Co60 sour es produ e anti-parallel si-multaneous photons and the time dieren e between them, being xed, an beused for time resolution estimates. Therefore, as shown in g. 8.3, for the pur-pose of timing measurements the sour e has been pla ed in between the tRPCand the referen e s intillator.A oin iden e was dened by two signals arriving within a time windowTw=200 ns, oming from one end of the tRPC and one end of the s intillator.The time width of the distribution has been hara terized by performing aGaussian t in an interval of ± 1.5σ around the enter of the distribution, asdes ribed in [47.8.4.1 S intillator time response to photonsThe referen e s intillator used for timing provides a resolution of σ
T= 35 ps forionizing parti les. The smaller amount of light typi ally olle ted in the aseof illumination with photons does not allow for a very good timing, yielding
σT
= 110 ps.As argued in se tion 8.2.2, the tRPC time response under 1 MeV γ illumi-nation is typi ally worst than in the ase of ionizing parti les. For example, atypi al value of σT≃ 90 ps has been already measured under similar onditions[161, as ompared with σ
T≃ 50− 80 ps for similar dete tors when illuminatedwith ionizing parti les.The setup used for determining the s intillator time resolution onsistedin two identi al s intillators pla ed perpendi ularly and 20 m apart. A Na22sour e is pla ed in between, sti ked to one of the dete tors. The signals produ ed

182 CHAPTER 8. INCREASE OF RATE CAPABILITY WITH Tare dis riminated through a Philips 715 CFD4.For a hieving the best resolution, it is ne essary to apply a ut in eventsthat produ e `enough light'. This ondition is shown in g. 8.16 and it anbe translated roughly as a ut at the 60% of the Compton edge for photonannihilation. This ut mainly reje ts the intera tions lose to any of the edgesof the s intillator that are likely to produ e small amounts of light and thereforelarger time u tuations. A region of ±2.5 m around the peak of the positiondistribution was also sele ted. The time spe tra obtained after the uts is shownin g. 8.17, yielding a hara teristi time resolution σT
= 110 ps.
500 1000 1500 20000
200
400
600
800
1000
1200
1400
1600
1800
charge in scintillator [ADC units]
even
ts [i
n 10
AD
C u
nits
bin
]cut
Compton edge (0.511 MeV)
Compton edge (1.2 MeV)
Figure 8.16: Charge distribution observed in the referen e s intillators when illuminatedwith a Na22 sour e. A peak an be seen at low harges and also the Compton edge for photons oming from positron annihilation. The rst peak has an un lear origin and the best timingrequires to ut it. At high harges the ontribution of the 1.2 MeV photon is also visible.
−1000 −500 −300 0 300 500 100010
0
101
102
Time difference [ps]
Eve
nts
[in 3
0ps
bin]
σcombined
= 152 ps
σ = 152/1.41 = 108 ps
Events = 1207
Figure 8.17: Time dieren e between the referen e s intillators. After quality uts in hargeand position, the best timing is a hieved, providing σT = 110 ps.4Constant Fra tion Dis riminator.

8.4. TIME RESPONSE 1838.4.2 Cuts and data analysisAfter the external uts are applied to the referen e s intillators (previous se -tion), the internal uts and the more important orrelations observed must bedis ussed:1. A region of ±1 m was sele ted around the maximum of the tRPC positiondistribution. This eliminates the jitter due to the dierent path lengths,that an be estimated from g. 8.18 to be less than:∆t = tmax − tmin = 26 ps (8.42)being essentially invisible when ompared with the 110 ps of the referen es intillator.
Figure 8.18: Two geometri ee ts are des ribed: in the left, the maximum geometri jitter expe ted after the ut in tRPC position. In the right, the gure shows how the timedistributions of sour es ontaining Na22 and Co60 are displa ed by 70 ps due to me hani al onstraints, ae ting the peak of the time distribution (to).The ut also guarantees that the primary rate over the tRPC is reasonably onstant in the region of study (see in g. 8.10 the primary rate prole),allowing for a leaner interpretation of the results.2. In the ase of sour es 3 and 4, most of the events are below the Comptonedge for annihilation, but oin iden es with 1.2 MeV photons from Ne22de-ex itation may also take pla e (g. 8.16). Due to the fast de ay of Ne22(3.7 ps, see [160), and the typi al delay times for positron annihilation (atthe level of hundred ps), it is possible that the presen e of this photon inthe trigger introdu es a ertain time jitter. It is re alled that the presen eof the 1.2 MeV photon was highly suppressed under trigger onditions dueto its isotropi hara ter. In order to evaluate the ee t, its presen e wasenhan ed on purpose by sele ting large harge events in one of the s intil-lators, and it did not exert any ee t over the time resolution. Therefore,no extra ut is performed for removing 1.2 MeV photons.3. The geometry of the sour es 1 and 2, that ontain Co60, is slightly dierentfrom 3 and 4. In sour es 1 and 2, Co60 and Na22 are both present, andseparated by ∆y = 1 m, i.e., ∆t = 2∆y/c = 70 ps at the speed of light.
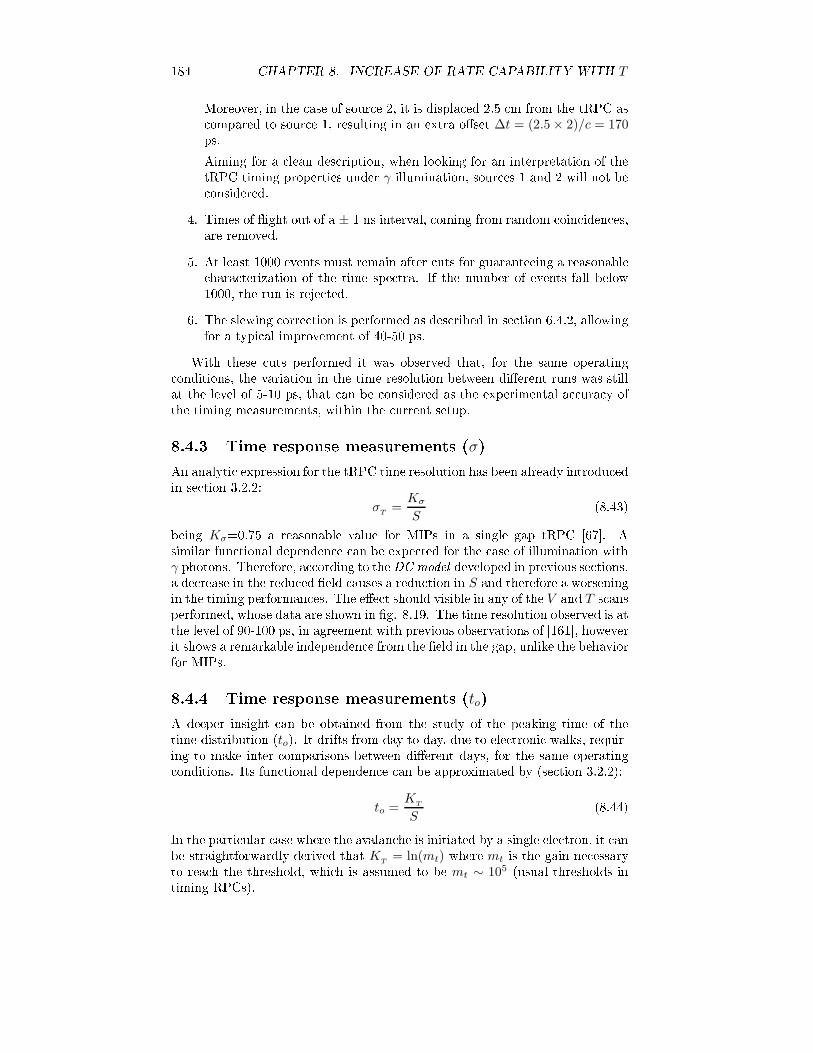
184 CHAPTER 8. INCREASE OF RATE CAPABILITY WITH TMoreover, in the ase of sour e 2, it is displa ed 2.5 m from the tRPC as ompared to sour e 1, resulting in an extra oset ∆t = (2.5 × 2)/c = 170ps.Aiming for a lean des ription, when looking for an interpretation of thetRPC timing properties under γ illumination, sour es 1 and 2 will not be onsidered.4. Times of ight out of a ± 1 ns interval, oming from random oin iden es,are removed.5. At least 1000 events must remain after uts for guaranteeing a reasonable hara terization of the time spe tra. If the number of events fall below1000, the run is reje ted.6. The slewing orre tion is performed as des ribed in se tion 6.4.2, allowingfor a typi al improvement of 40-50 ps.With these uts performed it was observed that, for the same operating onditions, the variation in the time resolution between dierent runs was stillat the level of 5-10 ps, that an be onsidered as the experimental a ura y ofthe timing measurements, within the urrent setup.8.4.3 Time response measurements (σ)An analyti expression for the tRPC time resolution has been already introdu edin se tion 3.2.2:σ
T=
Kσ
S(8.43)being Kσ=0.75 a reasonable value for MIPs in a single gap tRPC [67. Asimilar fun tional dependen e an be expe ted for the ase of illumination with
γ photons. Therefore, a ording to the DC model developed in previous se tions,a de rease in the redu ed eld auses a redu tion in S and therefore a worseningin the timing performan es. The ee t should visible in any of the V and T s ansperformed, whose data are shown in g. 8.19. The time resolution observed is atthe level of 90-100 ps, in agreement with previous observations of [161, howeverit shows a remarkable independen e from the eld in the gap, unlike the behaviorfor MIPs.8.4.4 Time response measurements (to)A deeper insight an be obtained from the study of the peaking time of thetime distribution (to). It drifts from day to day, due to ele troni walks, requir-ing to make inter- omparisons between dierent days, for the same operating onditions. Its fun tional dependen e an be approximated by (se tion 3.2.2):to =
KT
S(8.44)In the parti ular ase where the avalan he is initiated by a single ele tron, it anbe straightforwardly derived that K
T= ln(mt) where mt is the gain ne essaryto rea h the threshold, whi h is assumed to be mt ∼ 105 (usual thresholds intiming RPCs).

8.4. TIME RESPONSE 18520 25 30 35 40 45 50 550
20
40
60
80
100
120
140
T [oC]
σ T [p
s]
source 1, V*=3.2 kVsource 2, V*=3.2 kVsource 3, V*=3.2 kVsource 4, V*=3.2 kV
2.7 2.8 2.9 3 3.1 3.2 3.3 3.4 3.50
20
40
60
80
100
120
V* [kV]
σ T [p
s]
source 3, T= 22 oCsource 4, T= 25 oCsource 3, T= 32 oCFigure 8.19: Figures showing the behavior of the time resolution as a fun tion of voltageand temperature. The behavior is essentially at at the level of 90 ps.
20 25 30 35 40 45 50 550.9
1
1.1
1.2
1.3
1.4
1.5
1.6
T [oC]
t o [ns]
source 1, V*=3.2 kVsource 2, V*=3.2 kVsource 3, V*=3.2 kVsource 4, V*=3.2 kV
2.6 2.8 3 3.2 3.4 3.60.9
1
1.1
1.2
1.3
1.4
1.5
1.6
V* [kV]
t o [ns]
source 3, T= 22 oCsource 4, T= 25 oCsource 3, T= 32 oC
Figure 8.20: Figures showing the behavior of the peak time as a fun tion of voltage andtemperature. It behaves as expe ted, de reasing with the in rease of V ∗ and T , indi atingthat the eld in the gap is also in reasing.Being pre ise, to refers to the distribution of times from the avalan he for-mation until the threshold of the omparator is rea hed. However, the timemeasured ontains a ertain oset tOF F
that omes from the geometry, ablesand ele troni s. Therefore, the measurements of to are shown in g. 8.20,with a time oset tOF F
arbitrarily set to 1 ns for V ∗gap = 3.2 kV; the properdetermination of the oset is postponed.The behavior observed in g. 8.20 is in qualitative agreement with expression8.44: when the eld in the gap in reases, also S does, and to be omes smaller(the dete tor faster). However, no signi ative ee t is seen over the timeresolution (see g. 8.21).

186 CHAPTER 8. INCREASE OF RATE CAPABILITY WITH T
0 0.5 1 1.5 20
0.01
0.02
0.03
0.04
0.05
0.06
0.07
t [ns] (with arbitrary global offset)
prob
abili
ty [i
n 30
ps
bin]
source 3, V*=3.2 kV, T=21 oCsource 3, V*=3.2 kV, T=38 oCsource 3, V*=3.2 kV, T=53 oC
Figure 8.21: Time spe tra for the sour e 3 at three dierent temperatures. The time s alehas an arbitrary oset. The pi ture shows how the time distribution is shifted by almost halfa nanose ond without showing any signi ative ee t in its shape.8.4.5 σ vs toIt is arguable that the analyti expression 8.43 must be applied by keeping the harge-time orrelation that may be intrinsi of the dete tor [55. Therefore theun orre ted time resolution is also studied in the plot σTvs to shown in g.8.22. Both time resolutions show a at behavior as a fun tion of to.
0.9 1 1.1 1.2 1.3 1.4 1.50
20
40
60
80
100
120
140
160
to [ns] (arbitrary offset)
σ T [p
s]
uncorrectedcorrectedFigure 8.22: Plot showing the time resolution as a fun tion of the peak time for all the runsanalyzed. The plot is onsistent with a at behavior both for the orre ted and un orre tedresolutions, in disagreement with the simple des ription proposed.
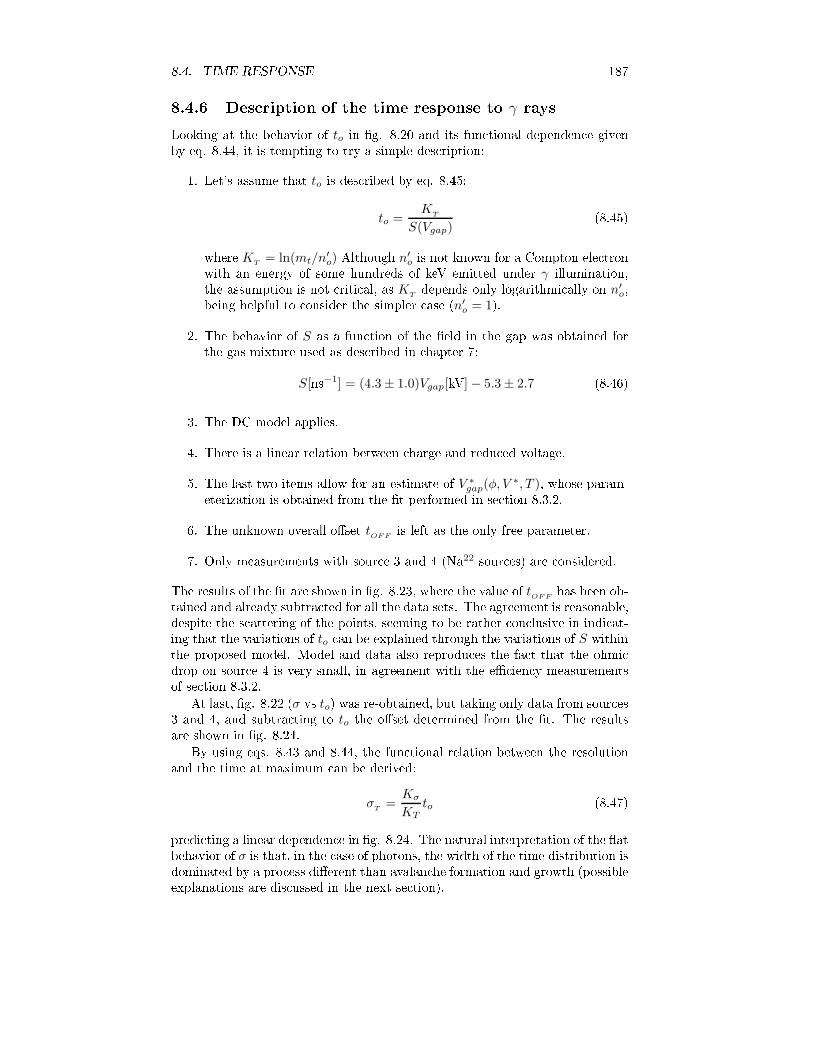
8.4. TIME RESPONSE 1878.4.6 Des ription of the time response to γ raysLooking at the behavior of to in g. 8.20 and its fun tional dependen e givenby eq. 8.44, it is tempting to try a simple des ription:1. Let's assume that to is des ribed by eq. 8.45:to =
KT
S(Vgap)(8.45)where K
T= ln(mt/n′
o) Although n′o is not known for a Compton ele tronwith an energy of some hundreds of keV emitted under γ illumination,the assumption is not riti al, as KTdepends only logarithmi ally on n′
o,being helpful to onsider the simpler ase (n′o = 1).2. The behavior of S as a fun tion of the eld in the gap was obtained forthe gas mixture used as des ribed in hapter 7:
S[ns−1] = (4.3 ± 1.0)Vgap[kV] − 5.3 ± 2.7 (8.46)3. The DC model applies.4. There is a linear relation between harge and redu ed voltage.5. The last two items allow for an estimate of V ∗gap(φ, V ∗, T ), whose param-eterization is obtained from the t performed in se tion 8.3.2.6. The unknown overall oset t
OF Fis left as the only free parameter.7. Only measurements with sour e 3 and 4 (Na22 sour es) are onsidered.The results of the t are shown in g. 8.23, where the value of t
OF Fhas been ob-tained and already subtra ted for all the data sets. The agreement is reasonable,despite the s attering of the points, seeming to be rather on lusive in indi at-ing that the variations of to an be explained through the variations of S withinthe proposed model. Model and data also reprodu es the fa t that the ohmi drop on sour e 4 is very small, in agreement with the e ien y measurementsof se tion 8.3.2.At last, g. 8.22 (σ vs to) was re-obtained, but taking only data from sour es3 and 4, and subtra ting to to the oset determined from the t. The resultsare shown in g. 8.24.By using eqs. 8.43 and 8.44, the fun tional relation between the resolutionand the time at maximum an be derived:
σT
=Kσ
KTto (8.47)predi ting a linear dependen e in g. 8.24. The natural interpretation of the atbehavior of σ is that, in the ase of photons, the width of the time distribution isdominated by a pro ess dierent than avalan he formation and growth (possibleexplanations are dis ussed in the next se tion).

188 CHAPTER 8. INCREASE OF RATE CAPABILITY WITH T
20 25 30 35 40 45 50 551.3
1.4
1.5
1.6
1.7
1.8
1.9
2
T [oC]
t o[ns]
source 3, V*=3.2 kVsource 4, V*=3.2 kV
2.7 2.8 2.9 3 3.1 3.2 3.3 3.4
1.3
1.4
1.5
1.6
1.7
1.8
1.9
2
V [kV]
t o[ns]
source 3, 21 oCsource 4, 21 oCsource 3, 33 oCFigure 8.23: Comparison between model and data from sour es 3 and 4. It shows a reason-able agreement, suggesting that the behavior of to is onne ted to the behavior of S.
1.4 1.5 1.6 1.7 1.8 1.90
20
40
60
80
100
120
140
160
to [ns]
σ T [p
s]
uncorrectedcorrected
Figure 8.24: Plot showing the time resolution as a fun tion of the peak time for all the runs orresponding to sour es 3 and 4. The time oset tOF F
has been already subtra ted. Thebehavior is onsistent with a at trend both for the orre ted and un orre ted resolutions.

8.5. CONCLUSIONS 1898.5 Con lusions1. The in rease of the operating temperature of a timing RPC in 25 C isnot high enough to modify signi antly the properties of the gas, apartfrom the expe ted hange in density that an be ompensated by keeping onstant the redu ed voltage V ∗ = V T/To. This fa t an be seen byexamining the ase of sour e 4, where V ∗ ≃ V ∗gap, and the observables ε,
σTand to are not depending on the temperature.2. On the other hand, the in rease of the temperature auses an exponentialin rease of the glass ondu tivity, allowing for a faster re overy of theplates. The ee t an be quantied by dening the relative rate apability
κ = ρ(To)ρ(T )
To
T . For the glass used, an in rease of the rate apability in afa tor 10 over 25 degrees was demonstrated.3. The behavior of qp (average prompt harge) and ε (e ien y) as a fun -tion of the applied eld V , primary rate φp and temperature T , an bedes ribed within the following hypotheses:(a) Both magnitudes depend on the average redu ed voltage V ∗gap (DCmodel).(b) For strong Spa e-Charge ee t, the relation between average hargeand the redu ed voltage in the gap is reasonably well des ribed by astraight line.( ) The harge spe trum hara teristi of illumination by 1 MeV γ pho-tons is well des ribed by an exponential.4. The behavior of the peak-time to as a fun tion of V , T and φ an beinterpreted as the result of the variation of S = α∗ve with the eld in thegap. However, under the same onditions, no variation was observed in thetime resolution both for the orre ted and un orre ted time distributions.This suggests that the time resolution an not be as ribed to the avalan hepro ess, as in the ase of to, but is probably shadowed by another sour eof u tuations. Natural sour es of this extra jitter ould be:(a) Positron annihilation delay: if the `parasiti ' 1.2 MeV photon omingfrom the almost instantaneous de ay of Ne22 (3.7 ps) enters in thetrigger, it will be sensitive to the variations in the positron annihila-tion delay (taken as referen e), introdu ing a time jitter. Despite thisphoton is geometri ally disfavored due to the isotropy of Ne22 emis-sion, they an be sele ted from the s intillator harge distribution,showing the same time response as for annihilation photons.(b) Compton ele tron delay: the Compton ele tron produ ed in the ele -trode is moderately relativisti so that it an spend some time beforeleaving it, depending on its energy and point of emission. PreliminaryGeant simulations indi ate that the jitter oming from this ee t isat the level of 10 ps [166.( ) In the ase of illumination with photons over a 4-gap tRPC withmetalli ele trodes, the pro ess of extra tion of the ele tron shows anasymmetry. It means that the ele tron an be emitted either from a
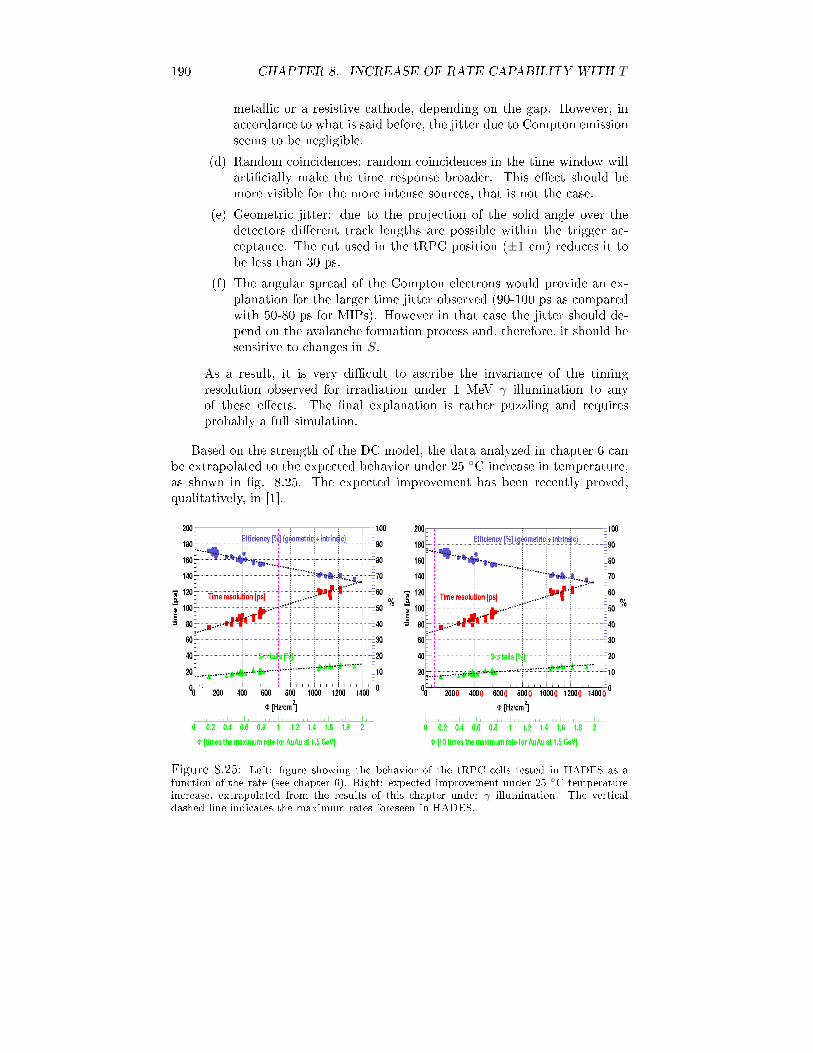
190 CHAPTER 8. INCREASE OF RATE CAPABILITY WITH Tmetalli or a resistive athode, depending on the gap. However, ina ordan e to what is said before, the jitter due to Compton emissionseems to be negligible.(d) Random oin iden es: random oin iden es in the time window willarti ially make the time response broader. This ee t should bemore visible for the more intense sour es, that is not the ase.(e) Geometri jitter: due to the proje tion of the solid angle over thedete tors dierent tra k lengths are possible within the trigger a - eptan e. The ut used in the tRPC position (±1 m) redu es it tobe less than 30 ps.(f) The angular spread of the Compton ele trons would provide an ex-planation for the larger time jitter observed (90-100 ps as omparedwith 50-80 ps for MIPs). However in that ase the jitter should de-pend on the avalan he formation pro ess and, therefore, it should besensitive to hanges in S.As a result, it is very di ult to as ribe the invarian e of the timingresolution observed for irradiation under 1 MeV γ illumination to anyof these ee ts. The nal explanation is rather puzzling and requiresprobably a full simulation.Based on the strength of the DC model, the data analyzed in hapter 6 anbe extrapolated to the expe ted behavior under 25 C in rease in temperature,as shown in g. 8.25. The expe ted improvement has been re ently proved,qualitatively, in [1.
Figure 8.25: Left: gure showing the behavior of the tRPC ells tested in HADES as afun tion of the rate (see hapter 6). Right: expe ted improvement under 25 C temperaturein rease, extrapolated from the results of this hapter under γ illumination. The verti aldashed line indi ates the maximum rates foreseen in HADES.

8.5. CONCLUSIONS 191As a summary: it has been shown that timing RPCs an be operated undermodest variations of the temperature up to 25 degrees, without loss of theperforman es. Moreover, the heating of the glass allows for an in rease in therate apability of a fa tor 10. Under γ illumination, the observables to, ε, qp, arewell des ribed by assuming that they depend on the average redu ed voltagein the gap (DC model), with ex eption of the time resolution, that remainsunaltered.A worsening in the performan es is observed above 25 C in rease, onne tedto an `anomalous' exponential in rease of dark ounting rate and streamers withtemperature. A similar ee t has been also reported for trigger RPCs, despitethere is no explanation for it available at the moment.

Chapter 9Analyti des ription of rateee tsAiming for a general des ription of the RPC time resolution in a dynami situa-tion, like the one taking pla e under high irradiation, it is ne essary to a ountnot only for the average drop of the ele tri eld (DC model), but also for itsu tuations. The treatment proposed in the following se tions was introdu edin [61 and developed in [62; it lays on the fa t that the avalan he time t anbe fa tored out as t = τ/S [55, [67. On one hand, the non-dimensional time τdepends on primary and multipli ation statisti s, whereas S is the growth o-e ient of the gas, that depends on the ele tri eld. Hen e it is expe ted thatthe u tuations of the eld in the gap ae t the time response mainly throughthe variations of S.9.1 An analyti model for the RPC time responseThe model developed through [55 and [67 mainly by P. Fonte, A. Gobbi and A.Mangiarotti is summarized here. It aims to des ribe the RPC timing properties,based on a set of assumptions:1. The number of ee tive primary lusters k reated inside the gap followsa Poisson distribution with average n′o:
P (k) =(n′
o)k
(en′
o − 1)k!(9.1)where n′
o is related to the dete tion e ien y:n′
o = − ln(1 − ε) (9.2)2. The avalan hes are initiated, in rst approximation, by a single ele tron,and the multipli ation statisti s follows the Furry law.3. The urrent indu ed over the pi k-up ele trode by the movement of theele trons is:i(t) = Niee
St (9.3)193

194 CHAPTER 9. ANALYTIC DESCRIPTION OF RATE EFFECTSbeing ie the urrent indu ed by a single ele tron and N the number ofele trons estimated in previous items, where all the u tuations belongingto the avalan he pro ess are already in luded.4. An exponential signal delivered through a linear ele troni network doesnot experien e any hange on its growth oe ient (S for the present ase)[151 but just on its amplitude. Therefore, the threshold voltage at the omparator is related to an equivalent threshold urrent at the amplierinput.5. In the proposed derivation, it is impli itly assumed that the avalan hegrowth is not ae ted by Spa e-Charge below the level of the omparator.In this sense, for the timing properties, the signals are regarded as if theywere produ ed under a proportional regime.An extensive dis ussion on this assumption an be found in [56, where itis shown how, even if Spa e-Charge is present already at the level of the omparator, the feedba k me hanism hara teristi of the multipli ationpro ess will preserve the time resolution unaltered, making the presentdes ription still valid. The on lusion from [56 is in agreement with thedetailed simulations from [57.By using these assumptions, it is possible to obtain the distribution ofavalan he times, i.e., time that takes from the luster formation up to whenthe threshold of the omparator is red:ρ
τ(τ) =
n′o
en′
o − 1
e(τth−τ)−exp(τth−τ)
√
n′oe
(τth−τ)I1
(
2√
n′oe
(τth−τ)
) (9.4)being τ = tS a non-dimensional time in units of 1/S, I1 the modied Besselfun tion and τth = ln[mt(1 − η/α)]. The last is dened as a fun tion of thethreshold mt and the multipli ation and atta hment oe ients, α and η, re-spe tively.The rms of the distribution of non-dimensional times τ given by eq. 9.4 wasobtained in [67 as an analyti fun tion of the ee tive number of lusters n′o,denoted by K(n′
o) within this work. Therefore, the nal time resolution an beexpressed as: rmsT
=K(n′
o)
S(9.5)Sin e n′
o is given by the dete tor e ien y, it is possible to relate K(n′o), theintrinsi time resolution in units of 1/S, to the e ien y of the dete tor, in asingle `universal' urve, that is shown in g. 9.1.9.1.1 Conditions for omparison with dataFor an appropriate omparison of the model with data, the following points haveto be stated:1. The pdf1 9.4 is not Gaussian, having tails towards delayed times. Theusual experimental pro edure of tting in an interval of ±1.5σ around1Probability Distribution Fun tion.
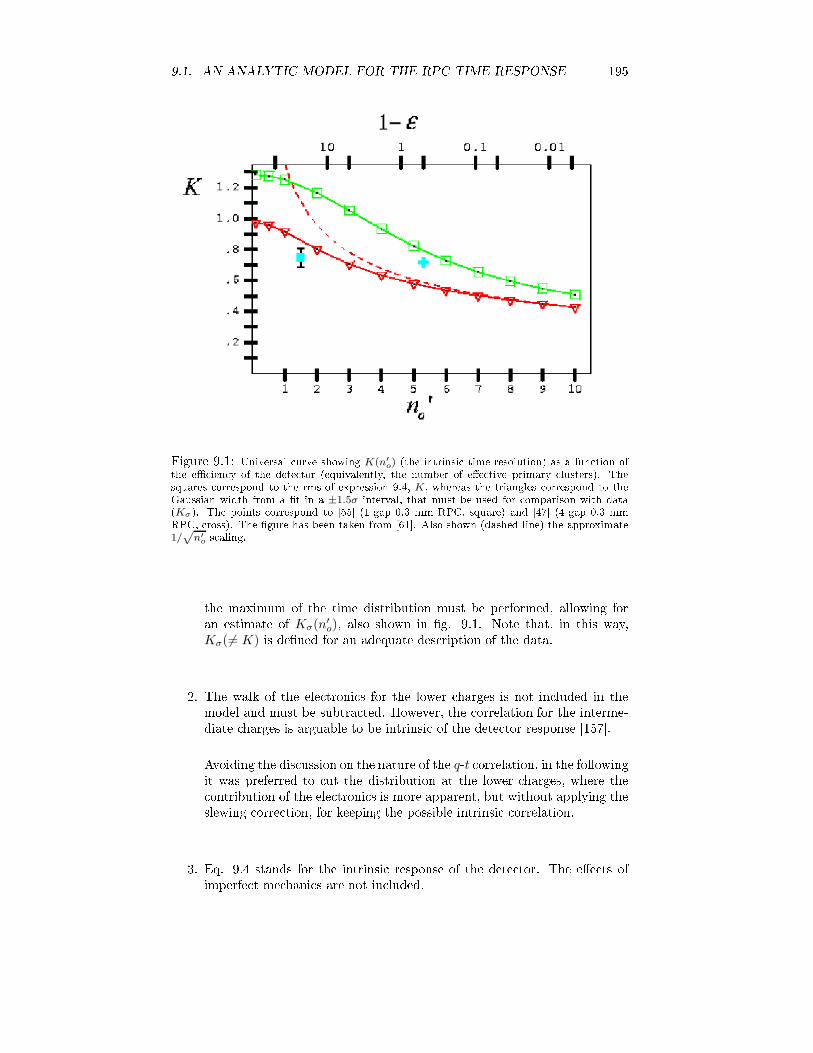
9.1. AN ANALYTIC MODEL FOR THE RPC TIME RESPONSE 195
Figure 9.1: Universal urve showing K(n′
o) (the intrinsi time resolution) as a fun tion ofthe e ien y of the dete tor (equivalently, the number of ee tive primary lusters). Thesquares orrespond to the rms of expression 9.4, K, whereas the triangles orrespond to theGaussian width from a t in a ±1.5σ interval, that must be used for omparison with data(Kσ). The points orrespond to [55 (1-gap 0.3 mm RPC, square) and [47 (4-gap 0.3 mmRPC, ross). The gure has been taken from [61. Also shown (dashed line) the approximate1/
p
n′
o s aling.the maximum of the time distribution must be performed, allowing foran estimate of Kσ(n′o), also shown in g. 9.1. Note that, in this way,
Kσ(6= K) is dened for an adequate des ription of the data.2. The walk of the ele troni s for the lower harges is not in luded in themodel and must be subtra ted. However, the orrelation for the interme-diate harges is arguable to be intrinsi of the dete tor response [157.Avoiding the dis ussion on the nature of the q-t orrelation, in the followingit was preferred to ut the distribution at the lower harges, where the ontribution of the ele troni s is more apparent, but without applying theslewing orre tion, for keeping the possible intrinsi orrelation.3. Eq. 9.4 stands for the intrinsi response of the dete tor. The ee ts ofimperfe t me hani s are not in luded.
196 CHAPTER 9. ANALYTIC DESCRIPTION OF RATE EFFECTS9.2 Data analysis9.2.1 Data setThe attention was fo used on the data analyzed in hapter 6 for ionizing parti- les. Data olle ted with tRPC II (inner), made of aluminum-glass-aluminumin a symmetri onguration (see g. 6.2) was hosen be ause several rate andvoltage ombinations were available.A total of 35 dierent runs were sele ted, orresponding to a s an in ratefrom 100 Hz/ m2 to 1300 Hz/ m2 at 4 dierent voltages (3.1-3.4 kV/gap). Theobservables ε, to, σTand q
prompt(e ien y, time at maximum, resolution, av-erage prompt harge in 200 ns) were studied. The e ien y was obtained after orre tion for the geometri losses estimated in hapter 6.The statisti s were large enough to allow for a division of ea h run in smallsub-runs, providing an estimate of the un ertainty of the observables. If onlyone run is available for a ertain set of operating onditions, this is the morereasonable way for estimating the error. The minimum sub-run onsideredstatisti ally signi ative must ontain at least 1000 events, otherwise it wasreje ted. The un ertainty of the observables under these onditions in a singlerun was determined to be around ±3 ps for time measurements and ±0.5% fore ien y estimates, aused by the TDC/ADC binning.The nal value of a given observable was obtained from the average of allthe runs/sub-runs with similar operating onditions. The 68% onden e levelswere obtained from the standard deviation of the average value, after addingquadrati ally the ee t of the TDC/ADC binning. It was assumed that all theerrors have a Gaussian origin and a orre tion for small number of events wasapplied [167:
σ∣
∣
x(68% C.L.) = σ
∣
∣
xtp (9.6)Namely, the 68% onden e bounds for the average value x, obtained over Nmeasurements of the magnitude x, are given by the estimator of the un ertaintyof x after multipli ation by the orre tion fa tor tp; the last depends on thenumber of measurements (degrees of freedom) that ontribute [167, be oming1 when N → ∞.After this analysis is performed, the initial set of data was redu ed to 18points with their orresponding un ertainties.9.2.2 Cuts appliedExternal (Referen e s intillators):1. Time overows in any hannel of the referen e s intillators are removed.2. Parti les with β < 0.75 are eliminated, being β determined as shownin hapter 6. In this way, parti les with similar energy depositions aresele ted, lose to the MIP dip (g. 6.9).3. Charges in the referen e s intillators within ±2σ around the value or-responding to the most probable energy deposition were sele ted. Thisavoids edge ee ts due to in lined tra ks.4. Position in the referen e s intillators was sele ted within ±2σ around themaximum. This ut redu es the presen e of in lined tra ks also.
9.3. DC DESCRIPTION 197Internal (tRPC):1. Measured times orresponding to the TDC overow as well as harges ompatible with the ADC pedestal were ut. They ontribute to thedete tor ine ien y, dened before the external uts have been applied.2. A ut of ± 1σ around the maximum of the tRPC position distributionwas performed. This has a slight ee t over the time response, redu ingthe fra tion of in lined tra ks.3. Events with a registered harge lower than 200 fC were purged. This utredu es the inuen e of the ele troni s in the time response (q-t orrela-tion), leaving the intrinsi tRPC time response.4. After a sudden high irradiation, it takes a ertain time before the glassplate rea hes a stationary situation, of the order of its relaxation time,indeed. Although this ee t is of pra ti al importan e, it was skipped inorder to allow for a lean omparison with the model, and will be dis ussedat the end. It was he ked that it is enough to ut the rst 2 s of ea h spillfor guaranteeing that the plate is reasonably stationary. The mentionedee t is shown in g. 9.2 for Φ = 1200 Hz/ m2 and a voltage V = 3.2kV/gap, together with the behavior of the average harge. It must besaid that qprompt
in the absen e of rate ee ts was around 150 ADC units;therefore, the harging-up time is a phenomenon relatively fast for thea quisition system and only the latest stages of the pro ess (from q ∼ 50to q ∼ 15 ADC units) an be leanly elu idated.5. Cut in `spill quality'. The stability within a spill was reasonable but stillsome runs show dierent spill proles. However, no signi ant dieren eswere appre iated on the observables obtained under illumination with dif-ferent kind of spills (see g. 6.13 for illustration). A marginal numberof runs showed instabilities from one spill to the next; they are ex ludedfrom the analysis.Spurious orrelations1. After all the uts are performed, the possible walks of the FEE ele troni swere studied for the time distribution measured (g. 9.3). In the following,∆tscin−RPC denotes the measured s intillator time minus the tRPC time(eq. 6.6), that was used to evaluate the timing performan es. It is shownthat, after a ut in the rst 2 se onds in-spill, the ee t of the harging-upof the plate is mostly eliminated, and the resulting ut distribution doesnot show any systemati ee t, indi ating that the presen e of drifts ofele troni origin is small within the same run.9.3 DC des ription9.3.1 Time at maximum (to) and e ien y (ε)The main problem for evaluating the time resolution using the model des ribedin eqs. 9.4 and 9.5 is to obtain the true voltage in the gap as a fun tion of the
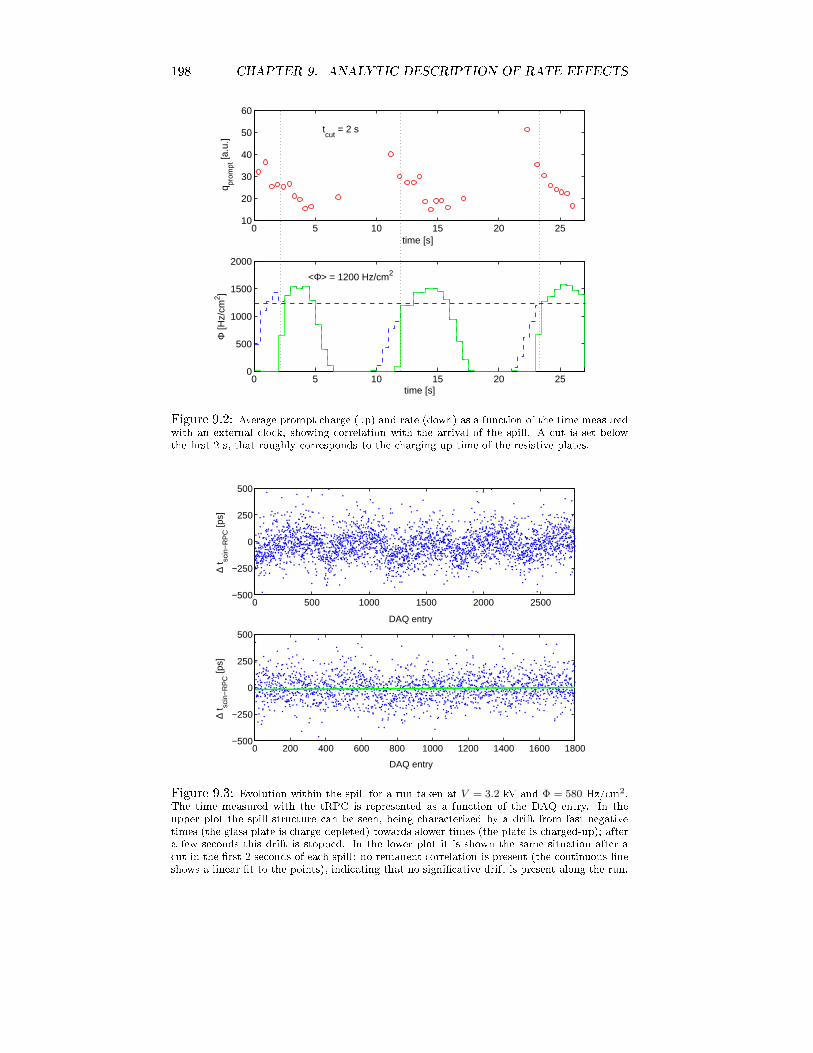
198 CHAPTER 9. ANALYTIC DESCRIPTION OF RATE EFFECTS0 5 10 15 20 25
10
20
30
40
50
60
time [s]
q prom
pt [a
.u.]
0 5 10 15 20 250
500
1000
1500
2000
time [s]
Φ [H
z/cm
2 ]
tcut
= 2 s
<Φ> = 1200 Hz/cm2
Figure 9.2: Average prompt harge (up) and rate (down) as a fun tion of the time measuredwith an external lo k, showing orrelation with the arrival of the spill. A ut is set belowthe rst 2 s, that roughly orresponds to the harging-up time of the resistive plates.0 500 1000 1500 2000 2500
−500
−250
0
250
500
DAQ entry
∆ t sc
in−
RP
C [p
s]
0 200 400 600 800 1000 1200 1400 1600 1800−500
−250
0
250
500
DAQ entry
∆ t sc
in−
RP
C [p
s]
Figure 9.3: Evolution within the spill for a run taken at V = 3.2 kV and Φ = 580 Hz/ m2.The time measured with the tRPC is represented as a fun tion of the DAQ entry. In theupper plot the spill stru ture an be seen, being hara terized by a drift from fast-negativetimes (the glass plate is harge depleted) towards slower times (the plate is harged-up); aftera few se onds this drift is stopped. In the lower plot it is shown the same situation after a ut in the rst 2 se onds of ea h spill: no remanent orrelation is present (the ontinuous lineshows a linear t to the points), indi ating that no signi ative drift is present along the run.
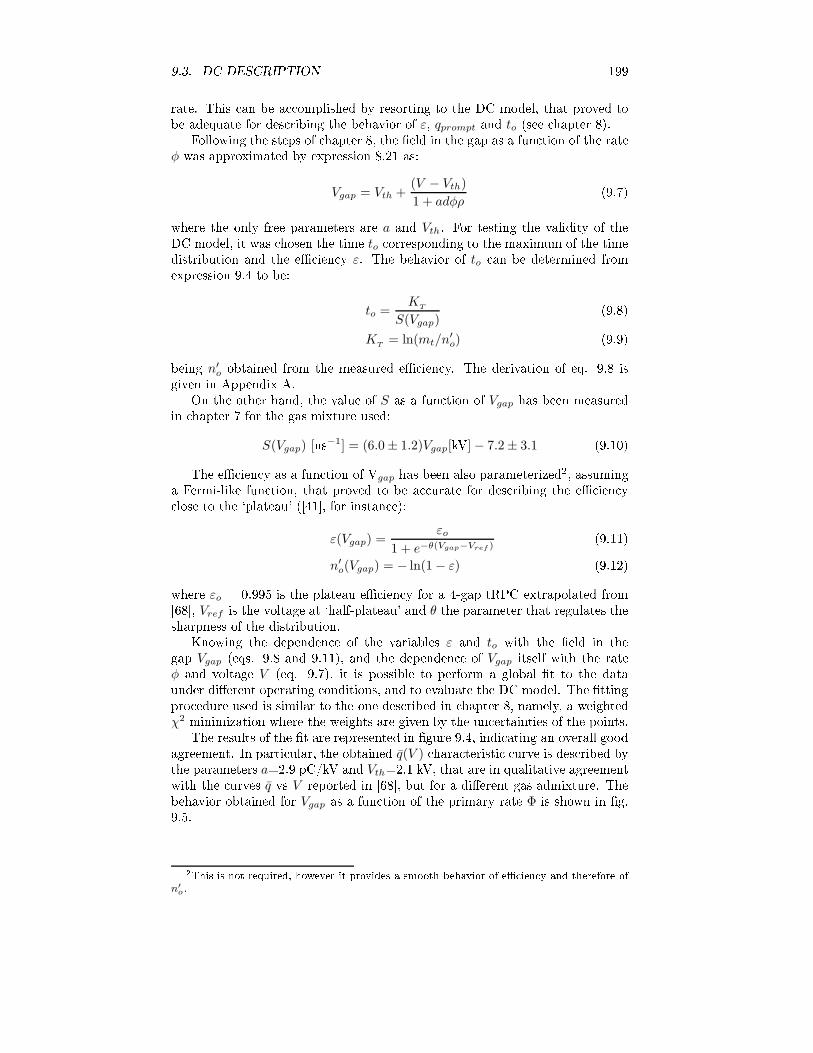
9.3. DC DESCRIPTION 199rate. This an be a omplished by resorting to the DC model, that proved tobe adequate for des ribing the behavior of ε, qprompt and to (see hapter 8).Following the steps of hapter 8, the eld in the gap as a fun tion of the rateφ was approximated by expression 8.21 as:
Vgap = Vth +(V − Vth)
1 + adφρ(9.7)where the only free parameters are a and Vth. For testing the validity of theDC model, it was hosen the time to orresponding to the maximum of the timedistribution and the e ien y ε. The behavior of to an be determined fromexpression 9.4 to be:
to =K
T
S(Vgap)(9.8)
KT
= ln(mt/n′o) (9.9)being n′
o obtained from the measured e ien y. The derivation of eq. 9.8 isgiven in Appendix A.On the other hand, the value of S as a fun tion of Vgap has been measuredin hapter 7 for the gas mixture used:S(Vgap) [ns−1] = (6.0 ± 1.2)Vgap[kV] − 7.2 ± 3.1 (9.10)The e ien y as a fun tion of Vgap has been also parameterized2, assuminga Fermi-like fun tion, that proved to be a urate for des ribing the e ien y lose to the `plateau' ([41, for instan e):
ε(Vgap) =εo
1 + e−θ(Vgap−Vref )(9.11)
n′o(Vgap) = − ln(1 − ε) (9.12)where εo = 0.995 is the plateau e ien y for a 4-gap tRPC extrapolated from[68, Vref is the voltage at `half-plateau' and θ the parameter that regulates thesharpness of the distribution.Knowing the dependen e of the variables ε and to with the eld in thegap Vgap (eqs. 9.8 and 9.11), and the dependen e of Vgap itself with the rate
φ and voltage V (eq. 9.7), it is possible to perform a global t to the dataunder dierent operating onditions, and to evaluate the DC model. The ttingpro edure used is similar to the one des ribed in hapter 8, namely, a weightedχ2 minimization where the weights are given by the un ertainties of the points.The results of the t are represented in gure 9.4, indi ating an overall goodagreement. In parti ular, the obtained q(V ) hara teristi urve is des ribed bythe parameters a=2.9 pC/kV and Vth=2.1 kV, that are in qualitative agreementwith the urves q vs V reported in [68, but for a dierent gas admixture. Thebehavior obtained for Vgap as a fun tion of the primary rate Φ is shown in g.9.5.2This is not required, however it provides a smooth behavior of e ien y and therefore ofn′
o.

200 CHAPTER 9. ANALYTIC DESCRIPTION OF RATE EFFECTS
0.1 0.5 1 1.50.9
1
1.1
1.2
1.3
1.4
1.5
1.6
Φ [kHz/cm2]
t o [ns]
3.1 kV/gap [data]3.2 kV/gap [data]3.3 kV/gap [data]3.4 kV/gap [data]3.1 kV/gap [model]3.2 kV/gap [model]3.3 kV/gap [model]3.4 kV/gap [model]
0.1 0.5 1 1.50.7
0.75
0.8
0.85
0.9
0.95
1
Φ [kHz/cm2]
ε
3.1 kV/gap [data]3.2 kV/gap [data]3.3 kV/gap [data]3.4 kV/gap [data]3.1 kV/gap [model]3.2 kV/gap [model]3.3 kV/gap [model]3.4 kV/gap [model]
Figure 9.4: Results of the DC model applied to the des ription of to and ε for 4 dierentoperating voltages (3.1 kV ( ir les), 3.2 kV (up-triangles), 3.3 kV (squares), 3.4 kV (left-triangles)). Un ertainty bars stand for 68% CL (Conden e Level) bounds.

9.3. DC DESCRIPTION 201
0.1 0.5 1 1.52.3
2.4
2.5
2.6
2.7
2.8
2.9
3
3.1
3.2
Φ [kHz/cm2]
Vga
p [kV
]
3.1 kV/gap3.2 kV/gap3.3 kV/gap3.4 kV/gap
Figure 9.5: Behavior of the average voltage as a fun tion of the rate is shown, obtainedfrom the DC model.9.3.2 Time resolution (σT)On e the parameters of the DC model are determined, the analyti expressionfor the time resolution 9.5 (repla ing K by Kσ) an be evaluated.The time resolution is a deli ate observable, more sensitive than to to in-spill ee ts, environmental u tuations or small variations on timing tails. Asa onsequen e, the un ertainty bars obtained are larger than in the ase of toand ε. For providing a statisti ally signi ant set of data, some of the pointswere grouped and those where less than two runs had been used for determiningthe CL were negle ted. This redu ed set of data (7 points) provides reasonablysmall 68% CL bounds and is ompared in g. 9.6 with the expe tation from theDC model.It is remarkable that the lines in g. 9.6, orresponding to the predi tion ofthe DC model, are independent from any parameter (they were obtained fromthe t to ε and to). The good des ription indi ates that at high rates the mainee t on the time resolution omes from the ohmi drop in the resistive plates.The points (open) without applying a ut in the rst 2 s in-spill are also shown:this indi ates that the ohmi drop is the dominant ee t over an innite timeduration spill, but, due to the nite harging-up time of the plate, the situationis more ompli ated in general.For better evaluating the onsequen es of the dominan e of the ohmi dropand the ee t of the harging-up time of the plate, it was developed a formalismthat starts from the individual avalan he shots over the plate towards the naldistribution of instantaneous elds on the gap, whose average value is given bythe DC model. The following se tions are dedi ated to this study.

202 CHAPTER 9. ANALYTIC DESCRIPTION OF RATE EFFECTS
0.1 0.5 1 1.550
60
70
80
90
100
110
120
130
140
Φ [kHz/cm2]
σ T [p
s]
3.1 kV/gap [data]3.2 kV/gap [data]3.3 kV/gap [data]3.4 kV/gap [data]3.1 kV/gap [model]3.2 kV/gap [model]3.3 kV/gap [model]3.4 kV/gap [model]
0.1 0.5 1 1.550
60
70
80
90
100
110
120
130
140
Φ [kHz/cm2]
σ T [p
s]
3.1 kV/gap [data]3.2 kV/gap [data]3.3 kV/gap [data]3.3 kV/gap [uncut data]3.1 kV/gap [model]3.2 kV/gap [model]3.3 kV/gap [model]
Figure 9.6: Up: time resolution Kσ/S obtained from the DC model, for the entire set ofdata. Points and model orrespond to 3.1 kV ( ir les, full line), 3.2 kV (triangles, dashed line),3.3 kV (squares, dash-dotted line), 3.4 kV (left triangles, dotted line). Un ertainty bars standfor 68% CL bounds. Down: set of data with improved statisti al signi an e, as des ribed intext. Also shown (open squares) the points at 3.3 kV without utting the ontribution omingfrom the harging-up time of the plate.

9.4. FLUCTUATIONS IN THE TIME RESPONSE 2039.4 Flu tuations in the time response9.4.1 Stati non-uniformity of the ele tri eldIt is said `stati ' for referring to u tuations that are always present, as it isthe ase for variations in the gap size due to, for example, spa ers, me hani stress, edges, rugosity of the plates or dust. This study is, in prin iple, of nobig interest for our present purposes; however, the problem has a relatively easytreatment, that allows to introdu e the formalism required for dealing with theu tuations of the eld in a dynami situation.In a parallel-plate geometry, the variations of the gap size are dire tly relatedto the u tuations in the eld: rmsE
E=
rmsg
g(9.13)being g the gap size. As the avalan he time is given by:
t =τ
S(9.14)the extra time jitter oming from the u tuations of the gap size an be derivedfrom eq. 9.5, following the standard `error propagation' formula:rms2
T=
[
K2
S2+
τ2
S2
(
E
τ
dτ
dn′o
dn′o
dE− E
S
dS
dE
)2(rms
E
E
)2]
E=Egap
(9.15)where Egap is the average eld a ross the gap, τ the average intrinsi time andall the other magnitudes have been already dened. Eq. 9.15 applies if theu tuations of the eld are relatively small, but the exa t derivation of theformula an be found in Appendix A. It an be seen that, for typi al values ofthe parameters, the se ond term in the right hand side is very small as omparedto the third, indi ating that the relative variation of the intrinsi average timeτ with the eld is mu h smaller than the relative variation of S3. Therefore:rms2
T=
[
K2
S2+
τ2
S2
(
E
S
dS
dE
)2( rms
E
E
)2]
E=Egap
(9.16)In the ase where u tuations have a me hani origin, it is natural to on-sider that the average eld Egap in eq. 9.16 is given by the applied voltage(Egap = V/d). By re alling eq. 9.13, the formula an be evaluated for dierent ongurations as a fun tion of the u tuations in the gap size, as shown in g.9.7.It is remarkable that 4% inhomogeneities in the gap size orresponds toa worsening of 20% in the resolution of a 1-gap timing RPCs for the usualthreshold mt = 105 (15 fC). The result gives a tight limit for the toleran esrequired on the surfa es that fa e the gap.A rst attempt to generalize the result to the multi-gap ase is devised.It must be noted that there is no formalism available that allows to study the3A qualitative argument an be provided by realizing that τ (the average time in unitsof 1/S) is well des ribed by expression 9.9, showing a logarithmi fun tional dependen e, as ompared with the linear dependen e of S.

204 CHAPTER 9. ANALYTIC DESCRIPTION OF RATE EFFECTS0 1 2 3 4 5 6 7 8 9 10
0
0.2
0.4
0.6
0.8
1
1.2
1.4
1.6
1.8
2
2.2
2.4
2.6
2.8
3
rmsg/g [%]
K [1
/S u
nits
]
resolution for mt=104
resolution for mt=105
resolution for mt=106
intrinsic resolution
1−gap RPC
0 1 2 3 4 5 6 7 8 9 100
0.2
0.4
0.6
0.8
1
1.2
1.4
1.6
rmsg/g [%]
K [1
/S u
nits
]
resolution for mt=104
resolution for mt=105
resolution for mt=106
intrinsic resolution
4−gap RPC Figure 9.7: Pi tures showing the expe ted worsening of the time resolution in units of 1/Sfor dierent values of the threshold mt = 106 (dashed line), mt = 105 (full), mt = 104 (dot-dashed). The behavior for 1-gap (left) and 4-gap (right) tRPCs is ompared. Also shown theintrinsi ontribution (dotted) and the ontribution owing to me hani s (straight lines).u tuations on ea h gap in an independent way; therefore the following approa his proposed: a) the N gaps ontribute in a similar way to the time resolution, b)the u tuations are independent gap to gap and ) reasonably Gaussian. Underthese assumptions, the ontribution of the u tuations is expe ted to de reasewith √N : rms2
T,N=
[
K2N
S2+
1
N
τ2
S2
(
E
S
dS
dE
)2(rms
E
E
)2]
E=Egap
(9.17)and τ stands again for the average time asso iated to the single gap. As KNshows also a 1/
√N s aling for large number of gaps, the relative ontribution ofthe me hani s is, in a rst approa h, not depending on N . However, the absolute ontribution of the me hani s is expe ted to be smaller for the multi-gap. Theexpe tations of the proposed des ription are shown in g. 9.7.9.4.2 Dynami non-uniformity of the eldThis se tion is entral for the des ription of rate ee ts. First of all, let us notethat eq. 9.16 is general enough to ope with dynami ee ts (rate ee ts). Thisis so be ause the hara teristi time s ales of the u tuations of S (se onds) and
τ (nanose onds) are 9 orders of magnitude apart, so that their variations anbe onsidered as de oupled4. Therefore, expression 9.16 still holds in a dynami situation.The development of an analyti model for dealing with the u tuations underthese onditions is the subje t of the following hapter. The harder step to bea omplished onsists in developing a general expression for rmsVgap
, that willbe ruled as natural, by the harge spe tra of the avalan hes and their timeinterval distribution.4In the situation dis ussed S hanges at the s ale of the relaxation time of the glass.

9.4. FLUCTUATIONS IN THE TIME RESPONSE 205
Figure 9.8: Pi ture showing the region onsidered for modeling the behavior of the tRPC.Introdu tion to noise theoryThe problem of the u tuations in the eld is studied by resorting to the wellestablished theory of noise in ele troni devi es [168, [169. In a ertain sense,the harge released by the avalan he produ ed in the dete tor an be treatedas if it were an instantaneous shot at the surfa e of the resistive plate. Thisis so, again, due to the fa t that the diusion through the plates, that is thepro ess to be hara terized, takes pla e at a time s ale mu h larger than theavalan he formation. The main strength of the approa h lays in the possibilityof a ounting for the u tuations through related magnitudes, not requiring adetailed des ription of the harge spe tra of the `noise'. At rst sight, the esti-mate of the u tuations in the eld requires to know the shape of the avalan he harge spe tra: for ea h avalan he, there is a probability that the nal hargetakes any value from the harge distribution; depending on its value, the eld inthe gap will be ae ted in a dierent way and so the harge of the forth omingavalan hes. It will be shown how to obtain rmsVas a fun tion of q and rmsqtogether with the shot rate φ, without requiring to know the exa t shape of theavalan he harge spe tra.Ele tri modelThe inuen ed region per avalan he is approximated by a ylinder of area A,with typi al dimensions of the order of square mm following M. Abbres ia [60.The sele ted ell A an be represented by the equivalent ele troni ir uit shownin 9.9, allowing for the adoption of te hniques used in ele tri noise analysis.In order to ompare with the data from hapter 6, the ase where one of theele trodes is metalli needs to be onsidered.DenitionsSome of the ne essary theorems that an be found in [168, [169 will be brieyintrodu ed here without proof, for the sake of onsisten y:
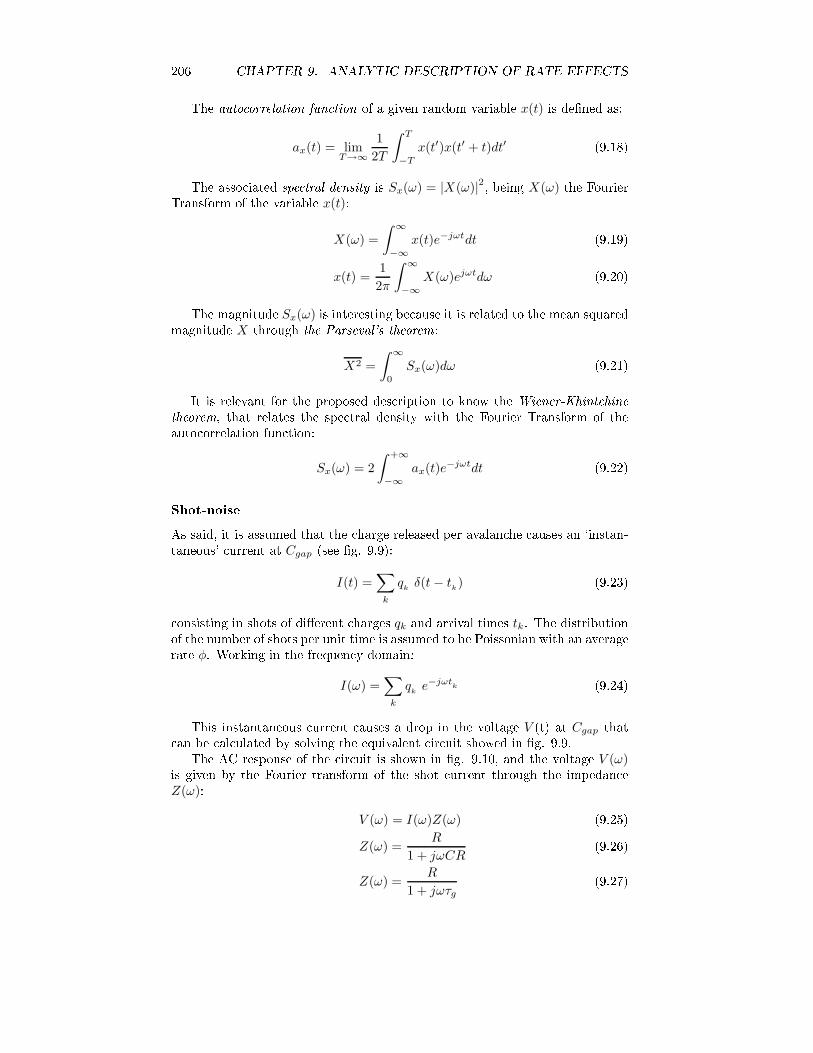
206 CHAPTER 9. ANALYTIC DESCRIPTION OF RATE EFFECTSThe auto orrelation fun tion of a given random variable x(t) is dened as:ax(t) = lim
T→∞
1
2T
∫ T
−T
x(t′)x(t′ + t)dt′ (9.18)The asso iated spe tral density is Sx(ω) = |X(ω)|2, being X(ω) the FourierTransform of the variable x(t):X(ω) =
∫ ∞
−∞
x(t)e−jωtdt (9.19)x(t) =
1
2π
∫ ∞
−∞
X(ω)ejωtdω (9.20)The magnitude Sx(ω) is interesting be ause it is related to the mean squaredmagnitude X through the Parseval's theorem:X2 =
∫ ∞
0
Sx(ω)dω (9.21)It is relevant for the proposed des ription to know the Wiener-Khint hinetheorem, that relates the spe tral density with the Fourier Transform of theauto orrelation fun tion:Sx(ω) = 2
∫ +∞
−∞
ax(t)e−jωtdt (9.22)Shot-noiseAs said, it is assumed that the harge released per avalan he auses an `instan-taneous' urrent at Cgap (see g. 9.9):I(t) =
∑
k
qk
δ(t − tk) (9.23) onsisting in shots of dierent harges qk and arrival times tk. The distributionof the number of shots per unit time is assumed to be Poissonian with an averagerate φ. Working in the frequen y domain:
I(ω) =∑
k
qk
e−jωtk (9.24)This instantaneous urrent auses a drop in the voltage V (t) at Cgap that an be al ulated by solving the equivalent ir uit showed in g. 9.9.The AC response of the ir uit is shown in g. 9.10, and the voltage V (ω)is given by the Fourier transform of the shot urrent through the impedan e
Z(ω):V (ω) = I(ω)Z(ω) (9.25)Z(ω) =
R
1 + jωCR(9.26)
Z(ω) =R
1 + jωτg(9.27)
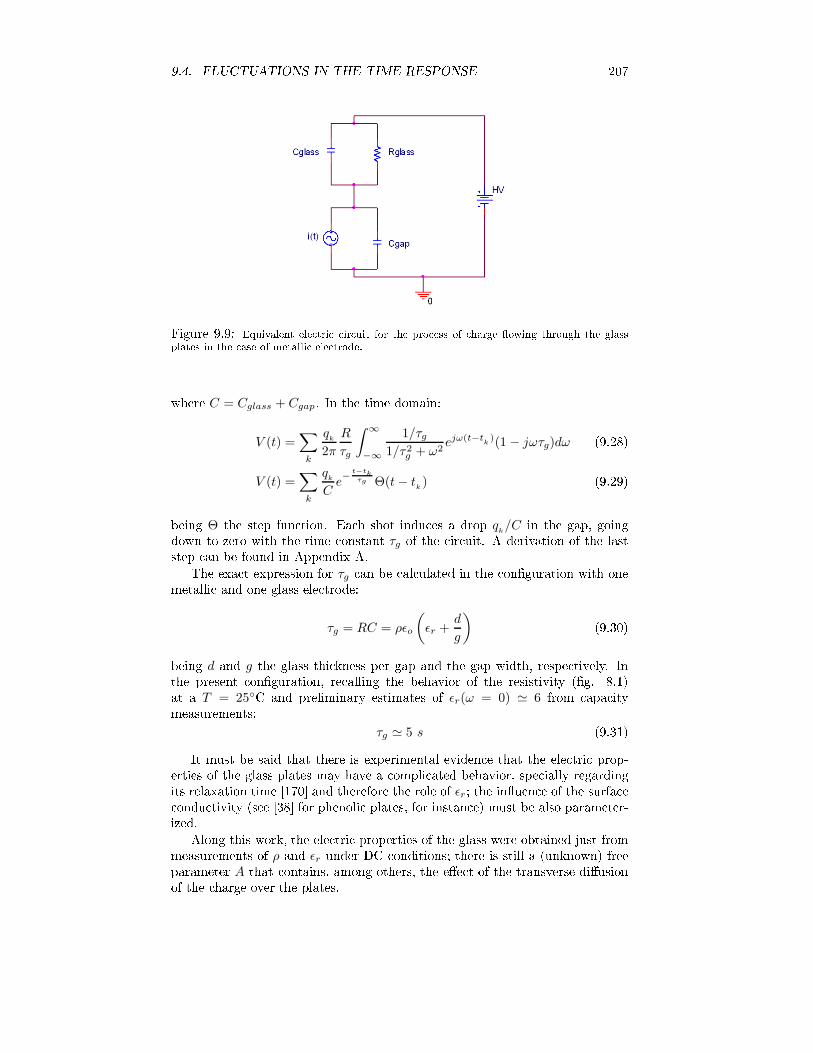
9.4. FLUCTUATIONS IN THE TIME RESPONSE 207
Figure 9.9: Equivalent ele tri ir uit for the pro ess of harge owing through the glassplates in the ase of metalli ele trode.where C = Cglass + Cgap. In the time domain:V (t) =
∑
k
qk
2π
R
τg
∫ ∞
−∞
1/τg
1/τ2g + ω2
ejω(t−tk)(1 − jωτg)dω (9.28)
V (t) =∑
k
qk
Ce−
t−tkτg Θ(t − t
k) (9.29)being Θ the step fun tion. Ea h shot indu es a drop q
k/C in the gap, goingdown to zero with the time onstant τg of the ir uit. A derivation of the laststep an be found in Appendix A.The exa t expression for τg an be al ulated in the onguration with onemetalli and one glass ele trode:
τg = RC = ρǫo
(
ǫr +d
g
) (9.30)being d and g the glass thi kness per gap and the gap width, respe tively. Inthe present onguration, re alling the behavior of the resistivity (g. 8.1)at a T = 25C and preliminary estimates of ǫr(ω = 0) ≃ 6 from apa itymeasurements:τg ≃ 5 s (9.31)It must be said that there is experimental eviden e that the ele tri prop-erties of the glass plates may have a ompli ated behavior, spe ially regardingits relaxation time [170 and therefore the role of ǫr; the inuen e of the surfa e ondu tivity (see [38 for phenoli plates, for instan e) must be also parameter-ized.Along this work, the ele tri properties of the glass were obtained just frommeasurements of ρ and ǫr under DC onditions; there is still a (unknown) freeparameter A that ontains, among others, the ee t of the transverse diusionof the harge over the plates.

208 CHAPTER 9. ANALYTIC DESCRIPTION OF RATE EFFECTSFigure 9.10: AC response of ir uit 9.9. The instantaneous drop V (t) is aused by the shotI(t).Un orrelated shot-noise modelThe ase of harge shots that are not orrelated in magnitude is treated rst,sin e it an be dealt with analyti ally. The validity of the assumption is dis- ussed at the end.In the absen e of event-by-event orrelations, the auto orrelation fun tionof I(t) an be al ulated following eq. 9.18 as:
aI(t) = lim
T→∞
1
2T
∫ T
−T
I(t′)I(t′ + t)dt′ = Aφq2δ(t) (9.32)and the derivation is addressed in Appendix A. Note that φ is the rate in unitsof [T−1][L−2] so that φA is the frequen y of events in the ell. The spe traldensity SI an be derived by using the Wiener-Khint hine theorem (eq. 9.22):
SI(ω) = 2
∫ +∞
−∞
aI(t)e−jωtdt = 2Aφq2 (9.33)whi h does not depend on the frequen y (white noise), showing that no orre-lation is present. In order to obtain the u tuation of the voltage, the urrentmust be onverted to voltage in the frequen y domain through the ompleximpedan e, Z(ω) (eq. 9.25). Using the Parseval's theorem (eq. 9.21):
SV(ω) = S
I(ω) |Z(ω)|2 (9.34)rms2
Vgap=
1
2π
∫ ∞
o
SI(ω) |Z(ω)|2 dω (9.35)
=R2
πAφq2
∫ ∞
o
dω
1 + ω2τ2g
(9.36)=
R2
2τgAφq2 (9.37)As a fun tion of fundamental quantities, the last expression an be rewrittenas: rms2
Vgap=
ρ2d2
2τg
φ
Aq2
(
1 +rms2qq2
) (9.38)whi h is a form of the Campbel theorem [168 for un orrelated shot-noise. Fol-lowing the Campbel theorem, the ee t of the harge spe tra over rmsVgap
isparameterized trough q, rmsq and φ.
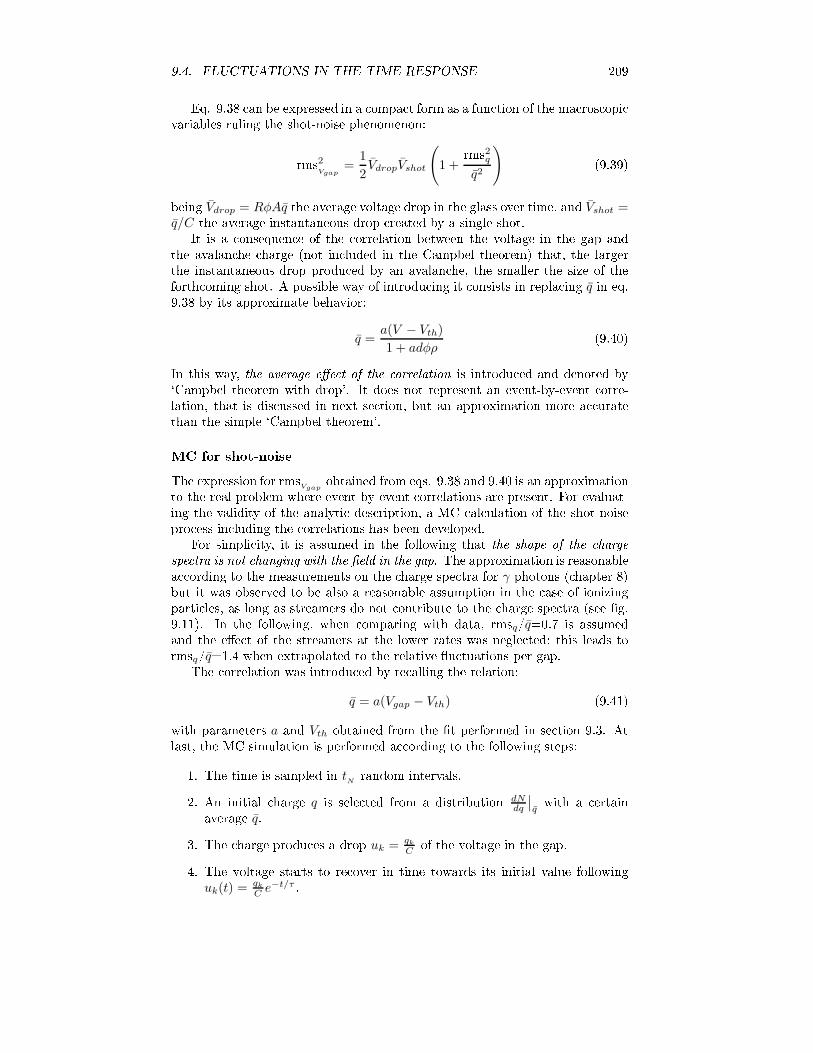
9.4. FLUCTUATIONS IN THE TIME RESPONSE 209Eq. 9.38 an be expressed in a ompa t form as a fun tion of the ma ros opi variables ruling the shot-noise phenomenon:rms2Vgap
=1
2VdropVshot
(
1 +rms2qq2
) (9.39)being Vdrop = RφAq the average voltage drop in the glass over time, and Vshot =q/C the average instantaneous drop reated by a single shot.It is a onsequen e of the orrelation between the voltage in the gap andthe avalan he harge (not in luded in the Campbel theorem) that, the largerthe instantaneous drop produ ed by an avalan he, the smaller the size of theforth oming shot. A possible way of introdu ing it onsists in repla ing q in eq.9.38 by its approximate behavior:
q =a(V − Vth)
1 + adφρ(9.40)In this way, the average ee t of the orrelation is introdu ed and denoted by`Campbel theorem with drop'. It does not represent an event-by-event orre-lation, that is dis ussed in next se tion, but an approximation more a uratethan the simple `Campbel theorem'.MC for shot-noiseThe expression for rms
Vgapobtained from eqs. 9.38 and 9.40 is an approximationto the real problem where event-by-event orrelations are present. For evaluat-ing the validity of the analyti des ription, a MC al ulation of the shot-noisepro ess in luding the orrelations has been developed.For simpli ity, it is assumed in the following that the shape of the hargespe tra is not hanging with the eld in the gap. The approximation is reasonablea ording to the measurements on the harge spe tra for γ photons ( hapter 8)but it was observed to be also a reasonable assumption in the ase of ionizingparti les, as long as streamers do not ontribute to the harge spe tra (see g.9.11). In the following, when omparing with data, rmsq/q=0.7 is assumedand the ee t of the streamers at the lower rates was negle ted; this leads tormsq/q=1.4 when extrapolated to the relative u tuations per gap.The orrelation was introdu ed by re alling the relation:
q = a(Vgap − Vth) (9.41)with parameters a and Vth obtained from the t performed in se tion 9.3. Atlast, the MC simulation is performed a ording to the following steps:1. The time is sampled in tNrandom intervals.2. An initial harge q is sele ted from a distribution dN
dq
∣
∣
qwith a ertainaverage q.3. The harge produ es a drop uk = qk
C of the voltage in the gap.4. The voltage starts to re over in time towards its initial value followinguk(t) = qk
C e−t/τ .
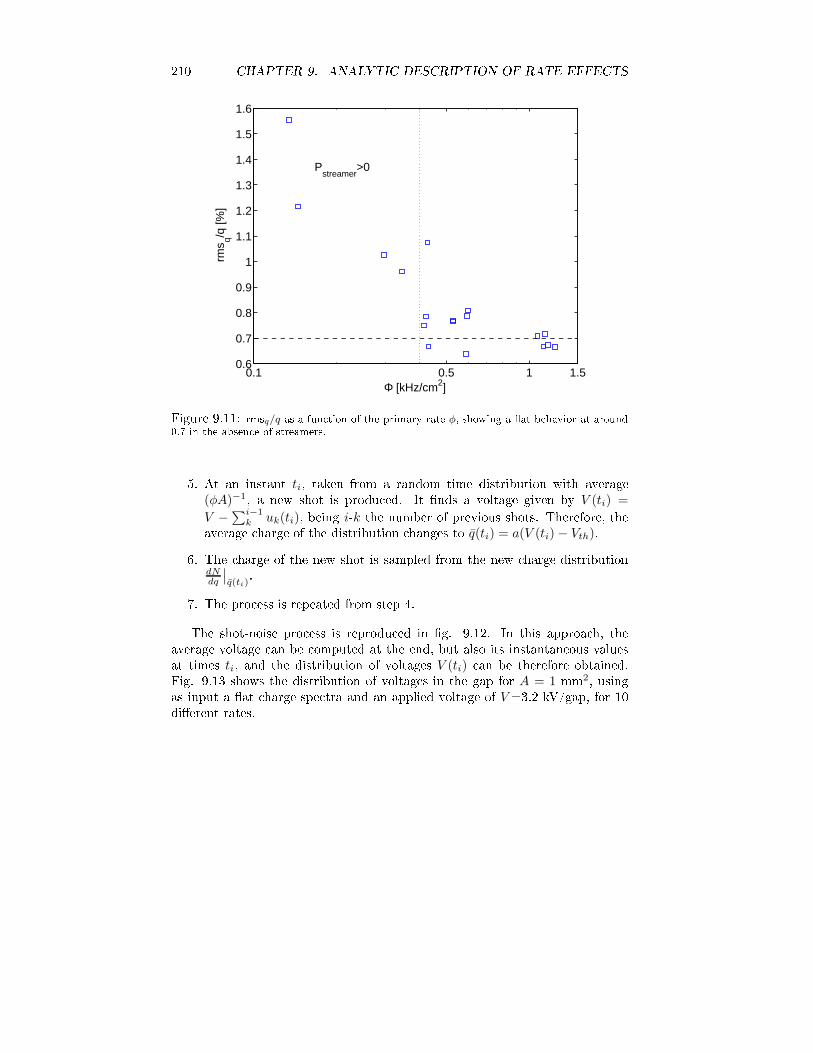
210 CHAPTER 9. ANALYTIC DESCRIPTION OF RATE EFFECTS
0.1 0.5 1 1.50.6
0.7
0.8
0.9
1
1.1
1.2
1.3
1.4
1.5
1.6
Φ [kHz/cm2]
rms q/q
[%]
Pstreamer
>0
Figure 9.11: rmsq/q as a fun tion of the primary rate φ, showing a at behavior at around0.7 in the absen e of streamers.5. At an instant ti, taken from a random time distribution with average(φA)−1, a new shot is produ ed. It nds a voltage given by V (ti) =
V −∑i−1k uk(ti), being i-k the number of previous shots. Therefore, theaverage harge of the distribution hanges to q(ti) = a(V (ti) − Vth).6. The harge of the new shot is sampled from the new harge distribution
dNdq
∣
∣
q(ti).7. The pro ess is repeated from step 4.The shot-noise pro ess is reprodu ed in g. 9.12. In this approa h, theaverage voltage an be omputed at the end, but also its instantaneous valuesat times ti, and the distribution of voltages V (ti) an be therefore obtained.Fig. 9.13 shows the distribution of voltages in the gap for A = 1 mm2, usingas input a at harge spe tra and an applied voltage of V =3.2 kV/gap, for 10dierent rates.
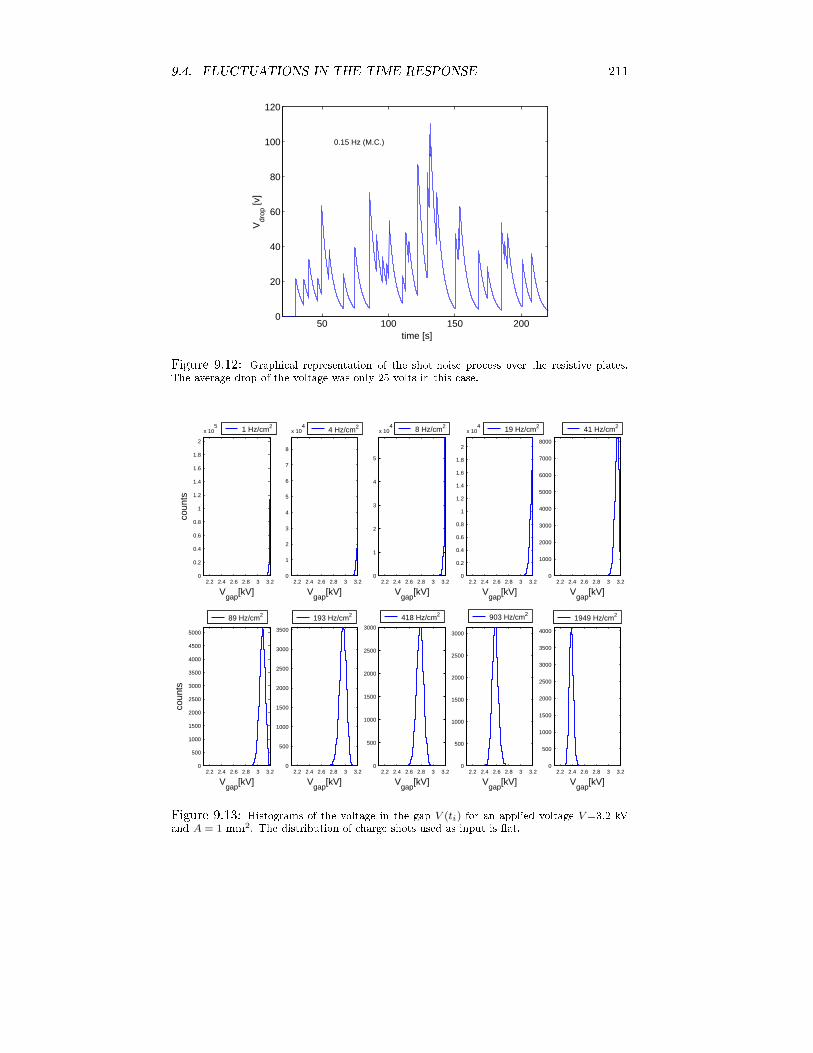
9.4. FLUCTUATIONS IN THE TIME RESPONSE 211
50 100 150 2000
20
40
60
80
100
120
time [s]
Vdr
op [v
]
0.15 Hz (M.C.)
Figure 9.12: Graphi al representation of the shot-noise pro ess over the resistive plates.The average drop of the voltage was only 25 volts in this ase.
2.2 2.4 2.6 2.8 3 3.20
0.2
0.4
0.6
0.8
1
1.2
1.4
1.6
1.8
2
x 105
coun
ts
Vgap
[kV]2.2 2.4 2.6 2.8 3 3.2
0
1
2
3
4
5
6
7
8
x 104
Vgap
[kV]
4 Hz/cm2
2.2 2.4 2.6 2.8 3 3.20
1
2
3
4
5
x 104
Vgap
[kV]
8 Hz/cm2
2.2 2.4 2.6 2.8 3 3.20
0.2
0.4
0.6
0.8
1
1.2
1.4
1.6
1.8
2
x 104
Vgap
[kV]
19 Hz/cm2
2.2 2.4 2.6 2.8 3 3.20
1000
2000
3000
4000
5000
6000
7000
8000
Vgap
[kV]
41 Hz/cm2
2.2 2.4 2.6 2.8 3 3.20
500
1000
1500
2000
2500
3000
3500
4000
4500
5000
coun
ts
Vgap
[kV]2.2 2.4 2.6 2.8 3 3.2
0
500
1000
1500
2000
2500
3000
3500
Vgap
[kV]
193 Hz/cm2
2.2 2.4 2.6 2.8 3 3.20
500
1000
1500
2000
2500
3000
Vgap
[kV]
418 Hz/cm2
2.2 2.4 2.6 2.8 3 3.20
500
1000
1500
2000
2500
3000
Vgap
[kV]
903 Hz/cm2
2.2 2.4 2.6 2.8 3 3.20
500
1000
1500
2000
2500
3000
3500
4000
Vgap
[kV]
1949 Hz/cm2
1 Hz/cm2
89 Hz/cm2
Figure 9.13: Histograms of the voltage in the gap V (ti) for an applied voltage V =3.2 kVand A = 1 mm2. The distribution of harge shots used as input is at.

212 CHAPTER 9. ANALYTIC DESCRIPTION OF RATE EFFECTSThe time to rea h equilibrium, teqThe rst observation that an be made with the MC is that it takes a nitetime to rea h the stationary situation, where the resistive plate is ` harged-up'(g. 9.14). The on ept has been rst introdu ed in se tion 9.2.2 and it mustbe onsidered for a orre t interpretation of data (see gs. 9.2 and 9.3). Thetime to rea h equilibrium an be dened in a general ontext: assuming thatthere are innite ells of area A per dete tor, the average voltage drop on thedete tor plates as a fun tion of the time of illumination is given by:Vdrop(t) = lim
N→∞
1
N
N∑
i=1
Vcell,i(t) (9.42)where Vcell is the voltage drop in a single ell as a fun tion of time, obtainedfrom the MC.0 1 2 3 4 5 6 7 8 9 10
0
100
200
300
400
500
600
700
800
time [s]
Vdr
op [v
]
Φ = 1200 Hz/cm2
V = 3.2 kV/gap
A = 1 mm2
Vdrop
= 700 volts
[M.C.]
0 1 2 3 4 5 6 7 8 9 100
100
200
300
400
500
600
700
800
time [s]
Vdr
op [v
]
A = 0.25 mm2
A = 1 mm2
A = 5 mm2
τg
[M.C.] (averaged over cells)
Vdrop
= 700 volts
Φ = 1200 Hz/cm2
Figure 9.14: Charging-up time of the ell (left) at high rates. In the right the averagebehavior of the voltage drop as a fun tion of time is shown (integrated over a large number of ell histories), for three dierent values of the area of inuen e of the avalan he. The urvesare rather independent from that parameter and show a typi al stabilization time of the orderof the relaxation time of the tRPC.Vdrop(t) is represented in g. 9.14 (right) for three values of the inuen edarea and Φ=1200 Hz/ m2. The gure an be also interpreted as what one maysee by monitoring the urrent driven by the tRPC as a fun tion of time, as
Vdrop(t) = I(t)R. It is remarkable that the stabilization time does not dependon the inuen ed area. In parti ular it takes a value lose to the relaxation timeτg. The stabilization time teq an be dened from eq. 9.42 as the time it takesto rea h a ertain fra tion f of the average drop orresponding to the stationarysituation Vdrop:
Vdrop(teq) = limN→∞
1
N
N∑
i=1
Vcell,i(teq) = fVdrop (9.43)In the limit of low rates (and low drop), only one shot per ell ontributesto the innite sum in 9.43, and it an be re-expressed in a simple way as:Vdrop(teq) = AΦ
∫ teq
0
Vshot,oe−(teq−t′)/τgdt′ (9.44)
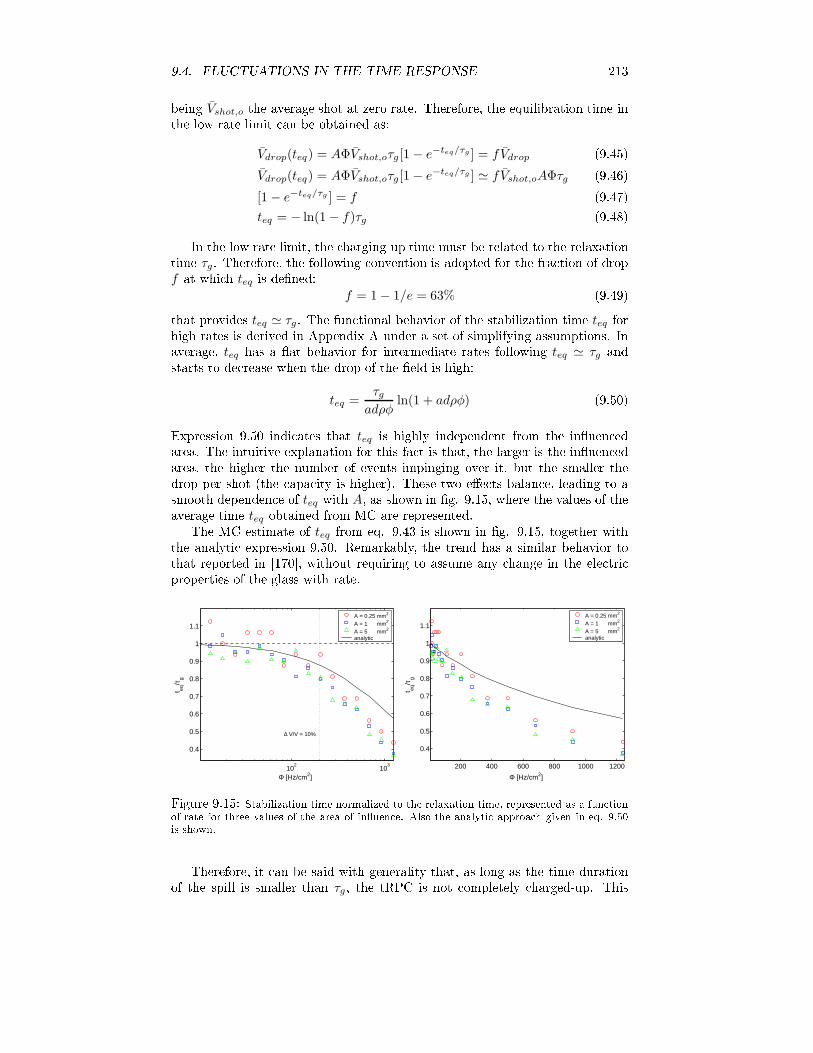
9.4. FLUCTUATIONS IN THE TIME RESPONSE 213being Vshot,o the average shot at zero rate. Therefore, the equilibration time inthe low rate limit an be obtained as:Vdrop(teq) = AΦVshot,oτg[1 − e−teq/τg ] = fVdrop (9.45)Vdrop(teq) = AΦVshot,oτg[1 − e−teq/τg ] ≃ fVshot,oAΦτg (9.46)[1 − e−teq/τg ] = f (9.47)teq = − ln(1 − f)τg (9.48)In the low rate limit, the harging-up time must be related to the relaxationtime τg. Therefore, the following onvention is adopted for the fra tion of drop
f at whi h teq is dened:f = 1 − 1/e = 63% (9.49)that provides teq ≃ τg. The fun tional behavior of the stabilization time teq forhigh rates is derived in Appendix A under a set of simplifying assumptions. Inaverage, teq has a at behavior for intermediate rates following teq ≃ τg andstarts to de rease when the drop of the eld is high:
teq =τg
adρφln(1 + adρφ) (9.50)Expression 9.50 indi ates that teq is highly independent from the inuen edarea. The intuitive explanation for this fa t is that, the larger is the inuen edarea, the higher the number of events impinging over it, but the smaller thedrop per shot (the apa ity is higher). These two ee ts balan e, leading to asmooth dependen e of teq with A, as shown in g. 9.15, where the values of theaverage time teq obtained from MC are represented.The MC estimate of teq from eq. 9.43 is shown in g. 9.15, together withthe analyti expression 9.50. Remarkably, the trend has a similar behavior tothat reported in [170, without requiring to assume any hange in the ele tri properties of the glass with rate.
102
103
0.4
0.5
0.6
0.7
0.8
0.9
1
1.1
Φ [Hz/cm2]
t eq/τ
g
A = 0.25 mm2
A = 1 mm2
A = 5 mm2
analytic
∆ V/V = 10%
200 400 600 800 1000 1200
0.4
0.5
0.6
0.7
0.8
0.9
1
1.1
Φ [Hz/cm2]
t eq/τ
g
A = 0.25 mm2
A = 1 mm2
A = 5 mm2
analytic
Figure 9.15: Stabilization time normalized to the relaxation time, represented as a fun tionof rate for three values of the area of inuen e. Also the analyti approa h given in eq. 9.50is shown.Therefore, it an be said with generality that, as long as the time durationof the spill is smaller than τg, the tRPC is not ompletely harged-up. This

214 CHAPTER 9. ANALYTIC DESCRIPTION OF RATE EFFECTSee t leads to an over-estimation of the e ien y apabilities (as shown in [71,for instan e) and has to be taken into a ount when omparing between sets ofdata that are measured at dierent spill lengths.On e the urve Vdrop(t) is obtained (g. 9.14) from MC, the expe ted behav-ior of observables like to(t) an be evaluated. Due to the small dependen e of theinuen ed area on the harging-up pro ess, the estimate of to(t) is essentiallyparameter-free (A = 1 mm2 has been taken, for instan e). The omparison isshown in g. 9.16 and the estimate of to in data was obtained as the averageover time intervals ontaining 200 events. For an adequate des ription of data,a value of ǫ ≃ 2.5 must be assumed, resulting in a relaxation time twi e smallerthan the measured in DC (eq. 9.31). The des ription obtained in this way israther reasonable, although an a urate determination of to as a fun tion of thespill time requires mu h higher statisti s than presently available. As in the ase of the average harge (g. 9.2), the small fra tion of triggered events as ompared to the total allows to observe the harging pro ess only at its nalstage.
5 10 15 20 25 30 35 40 45 50−400
−350
−300
−250
−200
−150
−100
−50
0
50
100
time [s]
t o [ps]
(ar
bitr
ary
offs
et)
data model
o
Φ = 580 Hz/cm2 V = 3.3 kV/gap
[εr ∼ 1/3 ε
r(DC)]
Figure 9.16: Example of the harging-up pro ess observed from data ( ir les) and ompar-ison with the shot-noise model developed.After the good des ription obtained in g. 9.16 for the harging-up pro ess,it is tempting to extrapolate the RPC behavior to short spills (as CERN-PS,for example). For that, the average drop Vdrop(t) at the end of the spill isrepresented in g. 9.17, and ompared with the stationary situation. The MCdes ription points to a high over-estimation on e ien y and timing apabilitieswhen testing at CERN-PS, oming from the fa t that less than 1/3 of the drop
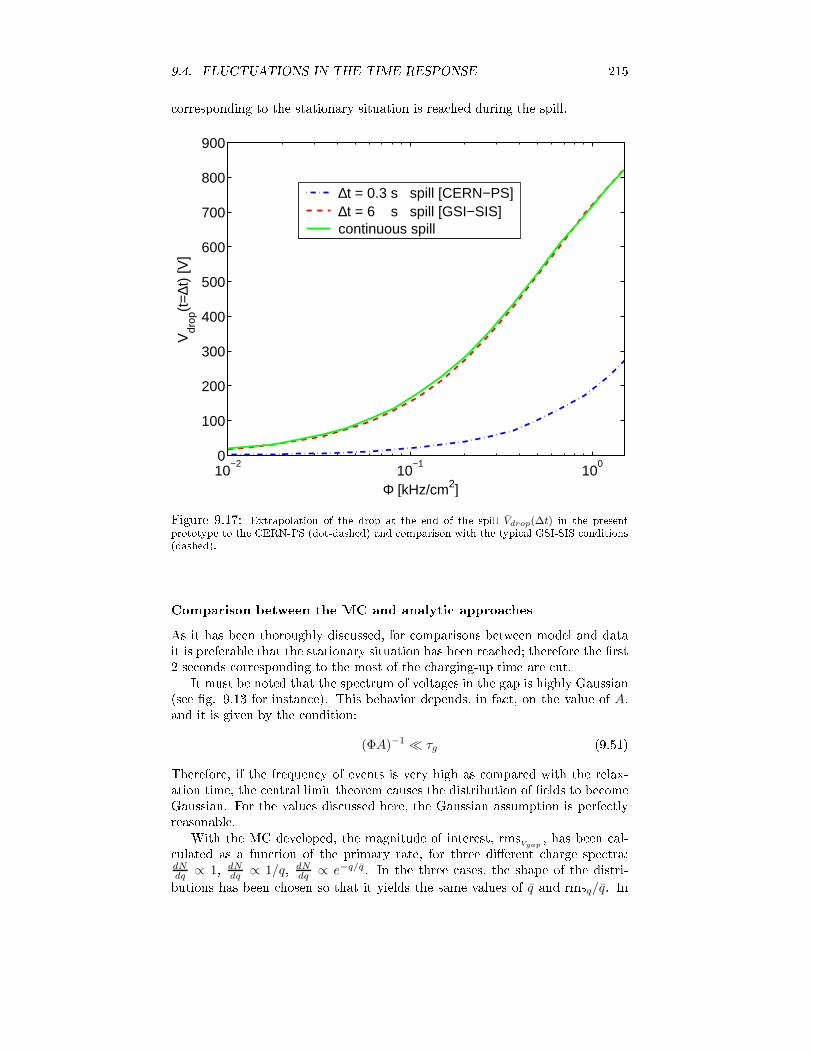
9.4. FLUCTUATIONS IN THE TIME RESPONSE 215 orresponding to the stationary situation is rea hed during the spill.
10−2
10−1
100
0
100
200
300
400
500
600
700
800
900
Φ [kHz/cm2]
Vdr
op(t
=∆t
) [V
]∆t = 0.3 s spill [CERN−PS]∆t = 6 s spill [GSI−SIS]continuous spill
Figure 9.17: Extrapolation of the drop at the end of the spill Vdrop(∆t) in the presentprototype to the CERN-PS (dot-dashed) and omparison with the typi al GSI-SIS onditions(dashed).Comparison between the MC and analyti approa hesAs it has been thoroughly dis ussed, for omparisons between model and datait is preferable that the stationary situation has been rea hed; therefore the rst2 se onds orresponding to the most of the harging-up time are ut.It must be noted that the spe trum of voltages in the gap is highly Gaussian(see g. 9.13 for instan e). This behavior depends, in fa t, on the value of A,and it is given by the ondition:(ΦA)−1 ≪ τg (9.51)Therefore, if the frequen y of events is very high as ompared with the relax-ation time, the entral limit theorem auses the distribution of elds to be omeGaussian. For the values dis ussed here, the Gaussian assumption is perfe tlyreasonable.With the MC developed, the magnitude of interest, rms
Vgap, has been al- ulated as a fun tion of the primary rate, for three dierent harge spe tra:
dNdq ∝ 1, dN
dq ∝ 1/q, dNdq ∝ e−q/q. In the three ases, the shape of the distri-butions has been hosen so that it yields the same values of q and rmsq/q. In

216 CHAPTER 9. ANALYTIC DESCRIPTION OF RATE EFFECTS
0 20 40 60 80 100 1200
0.005
0.01
0.015
0.02
0.025
0.03
0.035
0.04
0.045
0.05
Vshot
[v]
dN/d
Vsh
ot [
in 1
vol
t bin
]
for dN/dq ∼ e−q
for dN/dq ∼ 1for dN/dq ∼ 1/q
Figure 9.18: The distribution of harges (shots) used in the MC al ulation. They arenatural hoi es for testing the analyti des ription of shot-noise: 1/q is expe ted for an uniformdistribution of the rst luster in the gap [51, e−q is the Furry law, and `at' is a reasonableapproximation if Spa e-Charge is important [53.parti ular, their average orresponds to the value determined at V =3.2 kV/gap(re alling eq. 9.40) with rmsq/q = 1/√
3 ≃ 0.6, that is the value orrespondingto a at spe trum extending from zero.The studied spe tra of shots are plotted in g. 9.18. The upper and lowerlimits of the distributions are dened to provide the same q and rmsq/q.The results of the MC are represented, together with the Campbel theorems,in gure 9.19. The following on lusions an be drawn:1. For low drops in the eld, the Campbel theorem 9.38 reprodu es the data,indi ating that orrelation is still not important.2. The Campbel theorem is ompletely wrong if the drop of the eld is high.3. The `Campbel theorem with drop' (9.38 and 9.40) over-estimates the truermsVgap
by a fa tor 2 at the higher rates onsidered. Despite this, thebehavior is reasonably similar to MC.4. The results for the rmsVgap
are independent from the shape of the hargedistribution as long as the rmsq and q are the same. This indi ates thatan extension of the Campbel theorem to the ase where the events are orrelated may be a hievable.Looking at g. 9.19 and having in mind the fun tional behavior of theCampbel theorem (eq. 9.38), it is reasonable to think that rmsVgap
(φ) dependsonly on the area A inuen ed per avalan he on e the parameters rmsq and qof the harge distribution are xed. Therefore, the relative ontribution of theu tuations an be studied for dierent sizes of the inuen ed region A, withthe values rmsq and q xed from data. This is done in g. 9.20, where thebehavior of rmsVgap
Vdropis plotted as a fun tion of φ. In fa t, from eq. 9.39 it an
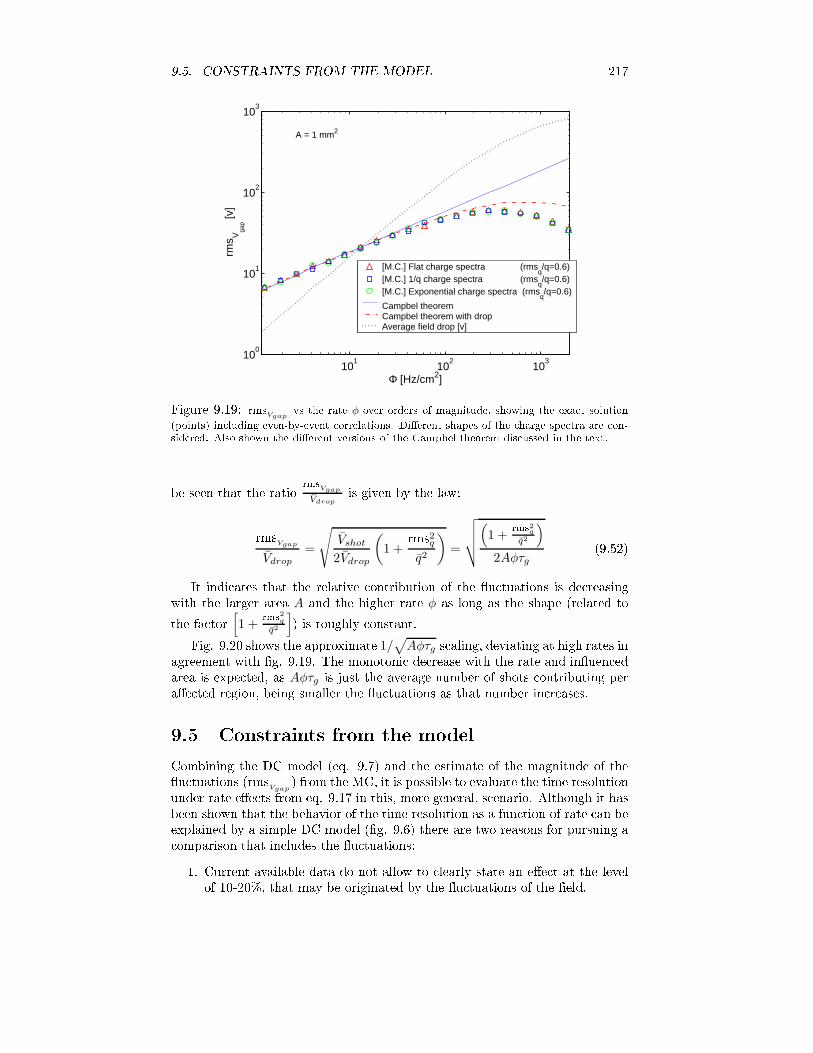
9.5. CONSTRAINTS FROM THE MODEL 217
101
102
103
100
101
102
103
Φ [Hz/cm2]
rms V
gap [v
]
[M.C.] Flat charge spectra (rmsq/q=0.6)
[M.C.] 1/q charge spectra (rmsq/q=0.6)
[M.C.] Exponential charge spectra (rmsq/q=0.6)
Campbel theoremCampbel theorem with dropAverage field drop [v]
A = 1 mm2
Figure 9.19: rmsVgapvs the rate φ over orders of magnitude, showing the exa t solution(points) in luding even-by-event orrelations. Dierent shapes of the harge spe tra are on-sidered. Also shown the dierent versions of the Campbel theorem dis ussed in the text.be seen that the ratio rms
Vgap
Vdropis given by the law:rms
Vgap
Vdrop=
√
Vshot
2Vdrop
(
1 +rms2qq2
)
=
√
√
√
√
(
1 +rms2qq2
)
2Aφτg(9.52)It indi ates that the relative ontribution of the u tuations is de reasingwith the larger area A and the higher rate φ as long as the shape (related tothe fa tor [1 +
rms2qq2
]) is roughly onstant.Fig. 9.20 shows the approximate 1/√
Aφτg s aling, deviating at high rates inagreement with g. 9.19. The monotoni de rease with the rate and inuen edarea is expe ted, as Aφτg is just the average number of shots ontributing perae ted region, being smaller the u tuations as that number in reases.9.5 Constraints from the modelCombining the DC model (eq. 9.7) and the estimate of the magnitude of theu tuations (rmsVgap
) from the MC, it is possible to evaluate the time resolutionunder rate ee ts from eq. 9.17 in this, more general, s enario. Although it hasbeen shown that the behavior of the time resolution as a fun tion of rate an beexplained by a simple DC model (g. 9.6) there are two reasons for pursuing a omparison that in ludes the u tuations:1. Current available data do not allow to learly state an ee t at the levelof 10-20%, that may be originated by the u tuations of the eld.

218 CHAPTER 9. ANALYTIC DESCRIPTION OF RATE EFFECTS
100
101
102
103
10−2
10−1
100
101
Φ [Hz/cm2]
rms V
gap /
Vdr
op
A = 0.25 mm2 [M.C.]A = 1 mm2 [M.C.]A = 5 mm2 [M.C.]
Analytic model
Figure 9.20: Relative ontributions of the u tuations with respe t to the average ohmi drop in the glass as a fun tion of the rate for three dierent areas of the avalan he. Theapproximate 1/√
Aφ s aling des ribed in text is also shown.2. Instead, it is possible to set upper bounds to the parameters that governthose u tuations.The starting point is the generalized version of eq. 9.17, in luding dynami (rate) and stati (me hani s) ee ts. For simpli ity, the average time τ/S pergap is approximated by the peaking time to (see Appendix A), and written, inthe following as:rms2T
=
[
K2N
S2+
t2oN
(
E
S
dS
dE
)2( rms2
E
E2
∣
∣
∣
∣
static
+rms2
E
E2
∣
∣
∣
∣
dynamic
)]
E=Egap
(9.53)As the eld is dropping with the rate, it is natural to expe t that the ontri-bution of the me hani s be omes smaller at high rates. Knowing the dependen eof the eld in the gap with rate from eq. 9.7, it is straightforward to derive that:rmsEgap
∣
∣
static=
rmsE
∣
∣
static
1 + adφρ(9.54)It is also interesting to evaluate the quantity rms
Egap
Edrop:rms
Egap
Edrop
∣
∣
∣
∣
static
=rmsg
g
V
(V − Vth)adρφ∼ 1
φ(9.55)where g is the gap width. This must be ompared with the approximate s aling
1/√
φ for the dynami ontribution (eq. 9.52). Therefore, it is expe ted thatat high rates, the u tuations due to rate ee ts dominate over those due tome hani s.As said, in the situations onsidered, it is reasonable to assume that thedynami u tuations are Gaussian at high rates. For omparison with data is
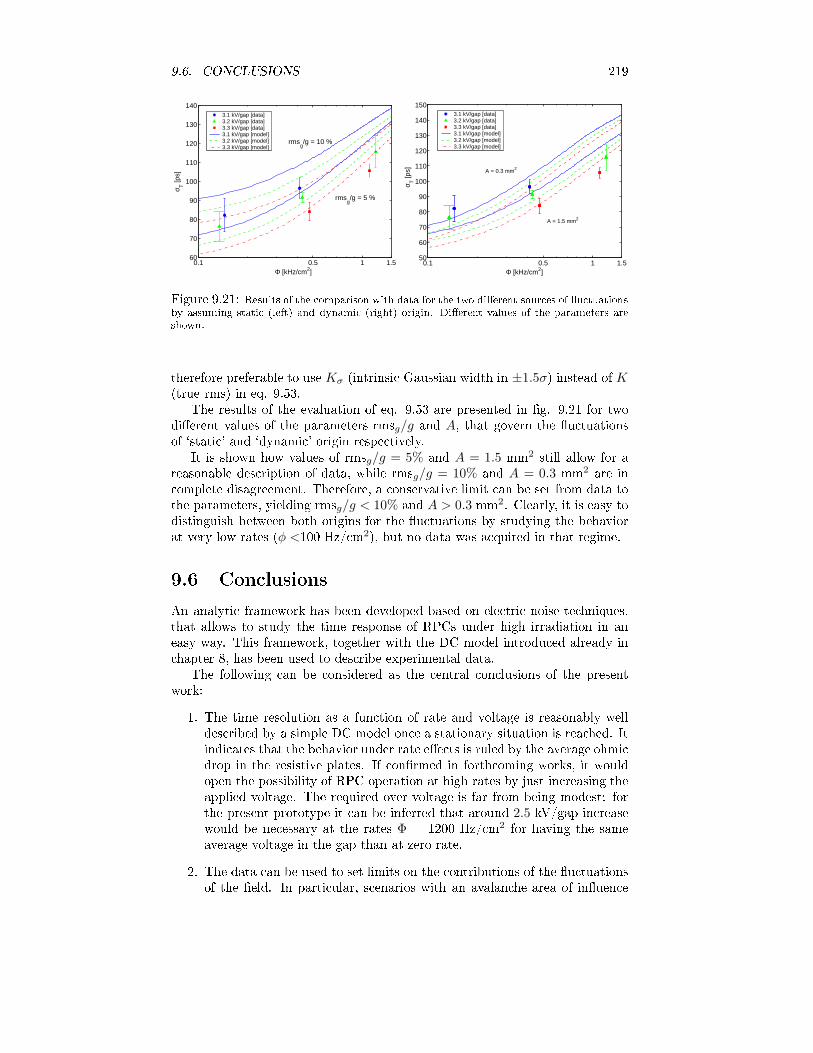
9.6. CONCLUSIONS 2190.1 0.5 1 1.5
60
70
80
90
100
110
120
130
140
Φ [kHz/cm2]
σ T [p
s]
3.1 kV/gap [data]3.2 kV/gap [data]3.3 kV/gap [data]3.1 kV/gap [model]3.2 kV/gap [model]3.3 kV/gap [model]
rmsg/g = 10 %
rmsg/g = 5 %
0.1 0.5 1 1.550
60
70
80
90
100
110
120
130
140
150
Φ [kHz/cm2]
σ T [p
s]
3.1 kV/gap [data]3.2 kV/gap [data]3.3 kV/gap [data]3.1 kV/gap [model]3.2 kV/gap [model]3.3 kV/gap [model]
A = 0.3 mm2
A = 1.5 mm2
Figure 9.21: Results of the omparison with data for the two dierent sour es of u tuationsby assuming stati (left) and dynami (right) origin. Dierent values of the parameters areshown.therefore preferable to use Kσ (intrinsi Gaussian width in ±1.5σ) instead of K(true rms) in eq. 9.53.The results of the evaluation of eq. 9.53 are presented in g. 9.21 for twodierent values of the parameters rmsg/g and A, that govern the u tuationsof `stati ' and `dynami ' origin respe tively.It is shown how values of rmsg/g = 5% and A = 1.5 mm2 still allow for areasonable des ription of data, while rmsg/g = 10% and A = 0.3 mm2 are in omplete disagreement. Therefore, a onservative limit an be set from data tothe parameters, yielding rmsg/g < 10% and A > 0.3 mm2. Clearly, it is easy todistinguish between both origins for the u tuations by studying the behaviorat very low rates (φ <100 Hz/ m2), but no data was a quired in that regime.9.6 Con lusionsAn analyti framework has been developed based on ele tri noise te hniques,that allows to study the time response of RPCs under high irradiation in aneasy way. This framework, together with the DC model introdu ed already in hapter 8, has been used to des ribe experimental data.The following an be onsidered as the entral on lusions of the presentwork:1. The time resolution as a fun tion of rate and voltage is reasonably welldes ribed by a simple DC model on e a stationary situation is rea hed. Itindi ates that the behavior under rate ee ts is ruled by the average ohmi drop in the resistive plates. If onrmed in forth oming works, it wouldopen the possibility of RPC operation at high rates by just in reasing theapplied voltage. The required over-voltage is far from being modest: forthe present prototype it an be inferred that around 2.5 kV/gap in reasewould be ne essary at the rates Φ = 1200 Hz/ m2 for having the sameaverage voltage in the gap than at zero rate.2. The data an be used to set limits on the ontributions of the u tuationsof the eld. In parti ular, s enarios with an avalan he area of inuen e

220 CHAPTER 9. ANALYTIC DESCRIPTION OF RATE EFFECTSA < 0.3 mm2 an be ex luded.In fa t, present estimates of this magnitude based on ele trostati onsid-erations [63 and luster size measurements [148 point to values at thes ale of mm2.3. A general limit to the degree of gap uniformity required for operatingtiming RPCs has been set: an uniformity better than a 4% is required foran ee t smaller than 20% on the time resolution.4. The ontribution of the dynami u tuations has been a ounted by a MCthat follows ea h harge shot individually. The analyti model proposed(denoted as `Campbel theorem with drop') shows an a ura y below afa tor 2 for the higher rates onsidered, but possesses s aling propertiessimilar to the MC.5. It has been pointed out that a time lose to the relaxation time τg isrequired in order that the RPC arrives to a stationary situation. If theduration of the spill is smaller, the glass is not fully harged-up and thenet result ould be an over-estimation of the rate apabilities, spe ially re-garding e ien y measurements, an ee t that has been already reportedin literature [71. This stabilization time produ ed, onversely, a worsen-ing in the timing performan es in the present situation. However, it willresult also in an over-estimation if tspill ≪ τg.6. Remarkably, the predi ted stabilization time is in reasonable agreementwith the one estimated from resistivity and permittivity measurementsin lab under DC onditions. However, the best des ription is obtainedassuming a value for ǫr that is 2.4 times smaller than the measured one,providing τg = 2.5 s.7. The ontribution of the u tuations respe t to the average drop of theeld s ales as 1/
√
Aφτg . This is natural, sin e the average number ofshots ontributing per ell is N = Aφτg . The larger the number of shotsper inuen ed region, the smaller the u tuations of the eld around itsmean value.8. From the previous point it an be on luded, in general, that the largerthe area ae ted per shot, the smaller the u tuations and the better thebehavior. This ould be ounter-intuitive, but ertainly the larger areaimplies also a lower drop of the eld per harge shot and, therefore, forthe same average ohmi drop the u tuations will be smaller. Anyhow,for the ase of timing RPCs the ee t of the u tuations seems to have aminor role in the performan e at high rates.9. The available data allows for an estimate of a lower bound on A, butbetter data is required in luding improved statisti s, absolute e ien ymeasurements and urrent monitoring; regarding the model used, an im-proved study of the multi-gap is still la king.

Chapter 10Con lusions and outlookAs ea h of the hapters of this thesis has its own set of on lusions, only themore relevant features will be mentioned here.The main ontribution of the present work is to develop a robust on eptof a timing RPC wall for the HADES experiment at GSI, based on the ele tri isolation of the ells. The design predi ts dete tion e ien ies for leptons loseto 90% with highly unbiased rst level trigger performan es, even in the worsts enario expe ted in HADES under urrent SIS18. By onstru tion, multi-hit apabilities were expe ted and later onrmed on a realisti prototype, due tothe very low levels of ross-talk.For providing su ient rate apability, the pra ti al possibility of a moderatewarming of the dete tor has been explored, allowing for an in rease of one orderof magnitude in the rate apability ea h 25 C, by using still standard oatglass.The ultimate possibilities of improvements on RPC rate apability were ex-plored by following an analyti model that in ludes expli itly the ee t of theu tuations of the eld in the gap over the time resolution. The formalismallows to isolate the main variables ruling the u tuations.The pro ess of harging-up of the resistive plates has been des ribed in aneasy way and ompared with data, providing a simple explanation for the over-estimation observed on rate apabilities for short spills. This harging-up pro- ess takes pla e, in a natural way, at the s ale of the relaxation time of theglass.
221

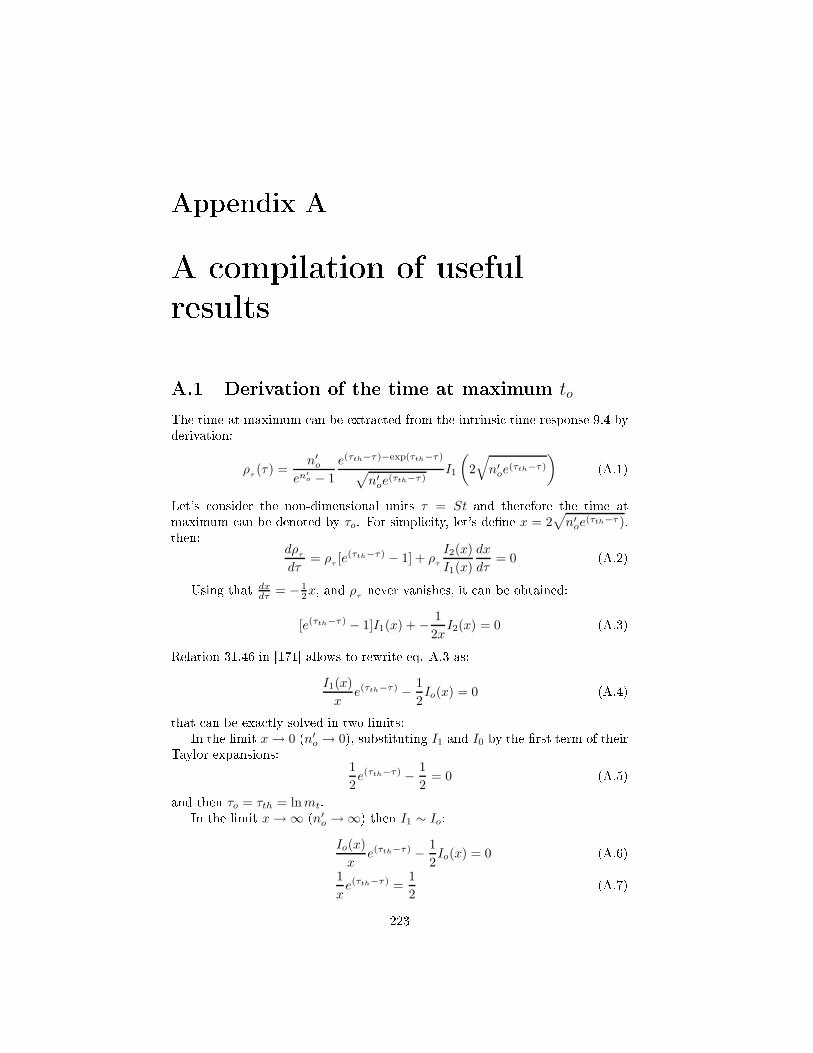
Appendix AA ompilation of usefulresultsA.1 Derivation of the time at maximum toThe time at maximum an be extra ted from the intrinsi time response 9.4 byderivation:ρ
τ(τ) =
n′o
en′
o − 1
e(τth−τ)−exp(τth−τ)
√
n′oe
(τth−τ)I1
(
2√
n′oe
(τth−τ)
) (A.1)Let's onsider the non-dimensional units τ = St and therefore the time atmaximum an be denoted by τo. For simpli ity, let's dene x = 2√
n′oe
(τth−τ ),then:dρ
τ
dτ= ρ
τ[e(τth−τ) − 1] + ρ
τ
I2(x)
I1(x)
dx
dτ= 0 (A.2)Using that dx
dτ = − 12x, and ρ
τnever vanishes, it an be obtained:
[e(τth−τ) − 1]I1(x) + − 1
2xI2(x) = 0 (A.3)Relation 31.46 in [171 allows to rewrite eq. A.3 as:
I1(x)
xe(τth−τ) − 1
2Io(x) = 0 (A.4)that an be exa tly solved in two limits:In the limit x → 0 (n′
o → 0), substituting I1 and I0 by the rst term of theirTaylor expansions:1
2e(τth−τ) − 1
2= 0 (A.5)and then τo = τth = lnmt.In the limit x → ∞ (n′
o → ∞) then I1 ∼ Io:Io(x)
xe(τth−τ) − 1
2Io(x) = 0 (A.6)
1
xe(τth−τ) =
1
2(A.7)223

224 APPENDIX A. A COMPILATION OF USEFUL RESULTS
Figure A.1: Behavior of the ratio I1(x)I0(x)
as a fun tion of x.whose solution is τo = lnmt − lnn′o, that is used in text. The a ura y of theexpression depends on the ondition I1 ∼ Io. For evaluating the ee t, it isplotted the ratio I1/Io as a fun tion of the independent variable x in g. A.1.It is shown that the a ura y of the approximation is above an 80% if x ∼
2n′o > 3. This orresponds to n′
o > 1.5, i.e., ε & 80%.A.2 Inuen e of the dead regionA ording to [67, if the dead region is very large, the assumption that theee tive number of lusters follows a Poisson distribution is not true anymore,and an extra orre tion must be added to the time response. Following [67, the orre tion for a dead region smaller than 70% is still around 10% on the timeresolution K(n′o). Taking the value of λ−1 = 9 lusters/mm from [66 and theminimum e ien y observed in the present data ε = 75%, the dead region xt an be estimated to be, in the worst ase:
xt
g=
n′o
no=
− ln (1 − 0.75)
0.3λ−1≃ 85% (A.8)There is no available analyti expression of the time response for in luding theee ts of the dead region, but the observables K(n′o) (intrinsi time resolution)and τ(n′
o) (intrinsi average time) an be evaluated with the series given in[67. Here these magnitudes are used to estimate the ee t over the observablesof interest τo(n′o) (intrinsi time at maximum) and Kσ(n′
o) (intrinsi Gaussianwidth).Fig. A.2 shows the omparison. In the ase of the average time, no signi antee t is seen beyond 10%, while the parameterization of the time at maximum
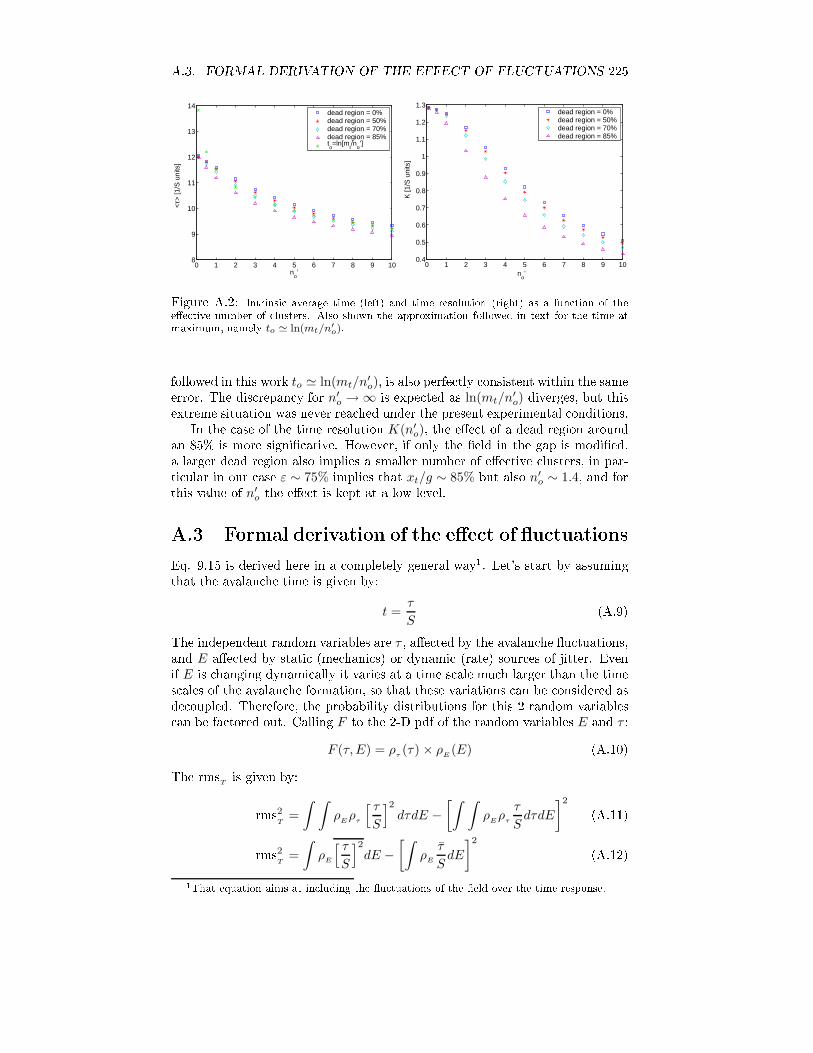
A.3. FORMAL DERIVATION OF THE EFFECT OF FLUCTUATIONS 2250 1 2 3 4 5 6 7 8 9 10
8
9
10
11
12
13
14
no’
<τ>
[1/S
uni
ts]
dead region = 0%dead region = 50%dead region = 70%dead region = 85%to=ln[m
t/n
o’]
0 1 2 3 4 5 6 7 8 9 100.4
0.5
0.6
0.7
0.8
0.9
1
1.1
1.2
1.3
no’
K [1
/S u
nits
]
dead region = 0%dead region = 50%dead region = 70%dead region = 85%
Figure A.2: Intrinsi average time (left) and time resolution (right) as a fun tion of theee tive number of lusters. Also shown the approximation followed in text for the time atmaximum, namely to ≃ ln(mt/n′
o).followed in this work to ≃ ln(mt/n′o), is also perfe tly onsistent within the sameerror. The dis repan y for n′
o → ∞ is expe ted as ln(mt/n′o) diverges, but thisextreme situation was never rea hed under the present experimental onditions.In the ase of the time resolution K(n′
o), the ee t of a dead region aroundan 85% is more signi ative. However, if only the eld in the gap is modied,a larger dead region also implies a smaller number of ee tive lusters, in par-ti ular in our ase ε ∼ 75% implies that xt/g ∼ 85% but also n′o ∼ 1.4, and forthis value of n′
o the ee t is kept at a low level.A.3 Formal derivation of the ee t of u tuationsEq. 9.15 is derived here in a ompletely general way1. Let's start by assumingthat the avalan he time is given by:t =
τ
S(A.9)The independent random variables are τ , ae ted by the avalan he u tuations,and E ae ted by stati (me hani s) or dynami (rate) sour es of jitter. Evenif E is hanging dynami ally it varies at a time s ale mu h larger than the times ales of the avalan he formation, so that these variations an be onsidered asde oupled. Therefore, the probability distributions for this 2 random variables an be fa tored out. Calling F to the 2-D pdf of the random variables E and τ :
F (τ, E) = ρτ(τ) × ρ
E(E) (A.10)The rms
Tis given by:rms2
T=
∫ ∫
ρEρ
τ
[ τ
S
]2
dτdE −[∫ ∫
ρEρ
τ
τ
SdτdE
]2 (A.11)rms2T
=
∫
ρE
[ τ
S
]2
dE −[∫
ρE
τ
SdE
]2 (A.12)1That equation aims at in luding the u tuations of the eld over the time response.

226 APPENDIX A. A COMPILATION OF USEFUL RESULTSτ and S are expanded in Taylor series around the average value of the eld Eo.Calling ∆E to E − Eo it is obtained, up to se ond order in the expansion:
1
S=
1
So− 1
S2o
dS
dE
∣
∣
∣
∣
Eo
∆E +
(
1
S3o
dS
dE
∣
∣
∣
∣
2
Eo
− 1
2S2o
d2S
dE2
∣
∣
∣
∣
Eo
)
∆2E (A.13)
1
S2=
1
S2o
− 2
S3o
dS
dE
∣
∣
∣
∣
Eo
∆E +
(
3
S4o
dS
dE
∣
∣
∣
∣
2
Eo
− 1
S3o
d2S
dE2
∣
∣
∣
∣
Eo
)
∆2E (A.14)
τ = τo +dτ
dE
∣
∣
∣
∣
Eo
∆E +d2τ
dE2
∣
∣
∣
∣
Eo
∆2E (A.15)
τ2 = τ2o + 2τo
dτ
dE
∣
∣
∣
∣
Eo
∆E +
(
dτ
dE
∣
∣
∣
∣
2
Eo
+ τod2τ
dE2
∣
∣
∣
∣
Eo
)
∆2E (A.16)The last expression is obtained under the assumption that dK
dE ≃ 02 being K =rmsτ . The expansions allow to al ulate τS and τ2
S2 that an be substituted intoeq. A.12 and the integral performed. The linear terms in ∆E goes to zero afterthe integration. Doing some algebra, the following expression an be obtained:rms2T
=
[
K2
S2+
(
τ
S2
dS
dE− 1
S
dτ
dE
)2 rms2E]E=Eo
+
[
3 rms2EK2
S4
(
dS
dE
)2]
E=Eo
−
[ rms2EK2
S3
d2S
dE2
]
E=Eo
(A.17)The following fa ts an be appre iated:1. The rst row is the result expe ted from the standard error propagation,that essentially keeps the rst order in the derivatives and u tuations(rms), and is the result already dis ussed in hapter 9.2. The se ond row is still rst order in derivatives but se ond in the u tu-ations, so it goes to zero as long as they are not very large.3. The third row in ludes the se ond order derivatives, a term that is verysmall in general, due to the linear behavior of S(E) for the elds of interest.2In an exa t way, it is ne essary to assume that all the derivatives of K respe t to theapplied eld E are small. The assumption that the intrinsi width K is very slightly depen-dent on the eld E is reasonable, as this dependen e is related to the dependen e of n′
o or,equivalently, to the e ien y. Therefore, as long as the e ien y is not hanging enormouslythe approximation mentioned is valid.
A.4. DERIVATION OF THE INSTANTANEOUS OHMIC DROP V (T) 227A.4 Derivation of the instantaneous ohmi dropV (t)Let's take the expression of the Fourier transform of V (ω) as the starting point.This expression has been derived in se tion 9.4.2:V (t) =
∑
k
qk
2π
R
τg
∫ ∞
−∞
1/τg
1/τ2g + ω2
ejω(t−tk)(1 − jωτg)dω (A.18)It remains to solve the proposed integral. For that it is ne essary to use theFourier Transform of an exponential fun tion:
e−a|x| =1
2π
∫ +∞
−∞
2a
p2 + a2eipxdp (A.19)Therefore, the rst part of the integral is immediate:
V (t) =∑
k
qkR
τg
[
1
2e−|t−t
k |τg − 1
2π
∫ ∞
−∞
1/τg
1/τ2g + ω2
ejω(t−tk)jωτgdω
] (A.20)that an be rewritten as:V (t) =
∑
k
qkR
τg
[
1
2e−|t−t
k |τg − τg
2π
d
dt
∫ ∞
−∞
1/τg
1/τ2g + ω2
ejω(t−tk)dω
] (A.21)The Fourier transform is again immediate:V (t) =
∑
k
qkR
τg
[
1
2e−|t−t
k |τg − τg
2
d
dte−|t−t
k |τg
] (A.22)V (t) =
∑
k
qkR
τg
[
1
2e−|t−t
k |τg +
1
2e−|t−t
k |τg
] (A.23)V (t) =
∑
k
qk
Ce−|t−t
k |τg (A.24)that is the result used in se tion 9.4.2.A.5 Derivation of the auto orrelation fun tion forwhite noiseLet's assume a shot-noise urrent of the form:
I(t) =∑
k
qk
δ(t − tk) (A.25)
228 APPENDIX A. A COMPILATION OF USEFUL RESULTSand the magnitude of the shots qkis not onstant in general. The auto orrelationfun tion is given by:
aI(t) = lim
T→∞
1
T
∫ T/2
T/2
∑
K
∑
K′
qK
qK′
δ(t′ − tK
)δ(t′ − tK′
+ t)dt′ (A.26)= lim
T→∞
1
T
∑
K
∑
K′
qK
qK′
δ(tK− t
K′+ t) (A.27)
= limT→∞
1
T
∑
K
q2K
δ(t) +∑
K
∑
K′ 6=K
qK
qK′
δ(tK− t
K′+ t)
(A.28)The se ond term, when the Fourier transform is al ulated, leads to a sum ofrandom phases with zero result in the limit of many pulses (i.e. T → ∞).Therefore, the only relevant term is the rst one, leading to:a
I(t) = Aφq2δ(t) (A.29)being r = Aφ the frequen y of events, A the inuen ed area per avalan he and
φ the primary rate.A.6 Derivation of the stabilization time teqA simple des ription of the RPC harging-up pro ess is devised here. Let'sassume a train of k shots arriving at dierent times. Ea h shot takes an averagevalue from the instantaneous value of the eld Vo − V (t) (applied eld minusdrop of the eld):Vshot(t) =
a
C(Vo − V (t) − Vth) (A.30)The number of shots k ne essary to rea h a ertain value of the average drop
Vdrop an be al ulated. For this, it is taken into a ount that, the larger thevalue of V , the smaller the next shot:Vshot,o =
a
C(Vo − Vth) (A.31)
Vshot,1 =a
C(Vo − Vshot,o − Vth) = Vshot,o
[
1 − a
C
] (A.32)Vshot,n = Vshot,o
[
1 − a
C
]n (A.33)where the exponential de ay of the equivalent RC ir uit has been negle ted forthe sake of simpli ity. The ondition required is:Vdrop =
k∑
i=0
Vshot,o
[
1 − a
C
]i
= Vshot,o
1 − (1 − aC )k
a/C(A.34)that an be rewritten as:
k =ln(1 − Vdrop
Vshot,o
aC )
ln(1 − aC )
(A.35)

A.6. DERIVATION OF THE STABILIZATION TIME TEQ 229The number of shots k ne essary to rea h Vdrop is nothing else than:k = φAteq (A.36)therefore:
teq =1
φA
ln(1 − Vdrop
Vshot,o
aC )
ln(1 − aC )
(A.37)For the values used here it is reasonable to assume that aC is small so that:
teq =C
aAφln[(1 − Vdrop
Vshot,o
a
C)−1] (A.38)At last, the expression for Vdrop from eq. 9.7 is used:
Vdrop = Vo − Vth +(Vo − Vth)
1 + aAφC τg
(A.39)arriving to:teq =
C
aAφln(1 +
aAφ
Cτg) (A.40)
teq =τg
adρφln(1 + adρφ) (A.41)being τg = RC.The ondition for appli ability of eq. A.40 is that the average drop indu edper shot is below the average drop. This ondition is equivalent to ask for k > 1(more than one shot). It an be written as:
Vshot,o < Vdrop (A.42)a
C(Vo − Vth) < (Vo − Vth)
[
1 − 1
1 + aAφR
] (A.43)a
C<
aAφR
1 + aAφR(A.44)and nally:
1
Aφ< τg(1 − a
C) (A.45)as said, a/C is signi antly lower than one for the values onsidered here. There-fore, it is enough to onsider, in a rst approa h, that:
1
Aφ< τg (A.46)

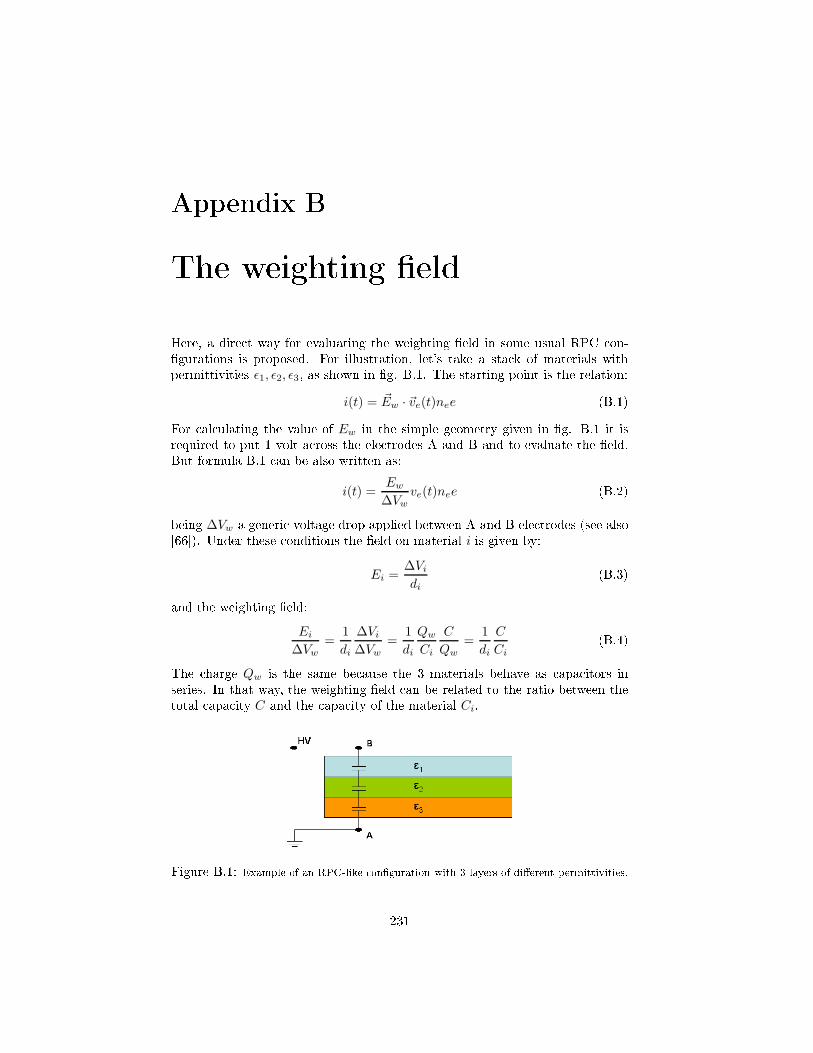
Appendix BThe weighting eldHere, a dire t way for evaluating the weighting eld in some usual RPC on-gurations is proposed. For illustration, let's take a sta k of materials withpermittivities ǫ1, ǫ2, ǫ3, as shown in g. B.1. The starting point is the relation:i(t) = ~Ew · ~ve(t)nee (B.1)For al ulating the value of Ew in the simple geometry given in g. B.1 it isrequired to put 1 volt a ross the ele trodes A and B and to evaluate the eld.But formula B.1 an be also written as:i(t) =
Ew
∆Vwve(t)nee (B.2)being ∆Vw a generi voltage drop applied between A and B ele trodes (see also[66). Under these onditions the eld on material i is given by:
Ei =∆Vi
di(B.3)and the weighting eld:
Ei
∆Vw=
1
di
∆Vi
∆Vw=
1
di
Qw
Ci
C
Qw=
1
di
C
Ci(B.4)The harge Qw is the same be ause the 3 materials behave as apa itors inseries. In that way, the weighting eld an be related to the ratio between thetotal apa ity C and the apa ity of the material Ci.
Figure B.1: Example of an RPC-like onguration with 3 layers of dierent permittivities.231

232 APPENDIX B. THE WEIGHTING FIELDUsing eq. B.4 and integrating eq. B.2 in time, the relation between the harge released and the harge indu ed during the drift through material i anbe extra ted:q
induced=
C
Ciq (B.5)as is used in text. For the parti ular ase of material 2, the evaluation of theweighting eld gives:
Ci =ǫiA
di(B.6)
Ew2 =1
d2
C
C2(B.7)
Ew2 =ǫ1ǫ3
ǫ1ǫ2d3 + ǫ1ǫ3d2 + ǫ2ǫ3d1(B.8)Exa tly as derived in [64. Eq. B.7 an be extended to an arbitrary number oflayers with permittivities ǫ1 . . . ǫn.

Appendix CResumoC.1 Introdu iónO desenvolvimento das ámaras de pla as paralelas resistivas (RPCs) no ano1981 [33 abriu a posibilidade de operar dete tores gaseosos de xeometrías para-lelas a ampos elé tri os tan altos omo 100 kV/ m [45. A prin ipal vantaxe onrespe to á te noloxía de pla as paralelas onven ionais (PPC) é que alqueirapro eso que pre ise do forne emento dunha grande antidade de arga, omo porexemplo des argas ontinuadas ou faís as, non poderá ter lugar dentro dunhaRPC, na que a taxa de forne emento de arga (ou orrente), está limitada polaresistividade das pla as. Ó mesmo tempo, a elevada resistividade dos mate-riais fre uentemente utilizados (ρ ∼ 109 − 1012 Ω m) non afe ta á indu iónde sinal nin á físi a das avalan has produ idas, fenómenos respe to ós ales aRPC é equivalente a unha PPC. Unha ara terísti a habitualmente atribuída ásRPCs é a presen ia de 'UV-quen hers' ou atenuadores de fotóns ultravioleta, os ales poderían levar á delo aliza ión transversal da avalan ha de modo similar a omo a onte e nun dete tor Geiger. Mentres que a delo aliza ión transversal éun efe to a eptado, a rela ión dos fotóns UV de pequeno per urso os hamados`streamers'1 atódi os [28 pre isa, nembargantes, de ser veri ada experimen-talmente. En xeral, o uso de mesturas baseadas en molé ulas omplexas, omoé de praxe omún en RPCs, poderá ser parti ularmente favorable en vistas áredu ión destes efe tos.Pou o a pou o estase estable endo que, o feito da multipli a ión ter lugarinmediatamente despois da primeira ioniza ión, representa unha diferen ia esen- ial da xeometría paralela en ompara ión oa xeometría ilíndri a empregadaa otío en dete tores propor ionais. É por isto que se a ostuma de ir que asu tua ións na resposta temporal do dete tor veñen determinadas úni amentepolas u tua ións no pro eso de forma ión e multipli a ión de arga (avalan ha)[55.A observa ión, no ano 2000, da extrema importan ia da boa deni ión dadistan ia de separa ión entre ele trodos, permitiu mellorar as resolu ións tem-porais ata o nivel dos 50 ps, resultando as RPCs ompetitivas os entelladoresmais rápidos do momento e tendo ademais a grande vantaxe de propor ionar un1Grandes avalan has que transportan argas 10-100 ve es maiores que unha avalan hanormal e que unen os ele trodos a través dun lamento luminoso.233

234 APPENDIX C. RESUMOpre io por anle moito menor, sendo asimesmo máis robustas frente a amposmagnéti os elevados.Hai numerosos traballos que mostran que a opera ión de RPCs, en alqueradas súas ongura ións máis usuais, ten lugar baixo un grande efe to Espa io-Carga [56 debido a intera ión entre as pares ión-ele trón liberados e o propio ampo da avalan ha. Existe un argumento lási o debido a Raether que predíunha forte rela ión entre o Espa io-Carga e a apari ión de `streamers' [29. No aso das RPCs tal vín ulo pare e ser máis feble, sendo posible atinxir valoreselevados do ampo para os que o efe to de Espa io-Carga e importante maisnon hai a penas `streamers'. Este efe to é parti ularmente bene ioso, pois apresen ia destes últimos resulta nun empeoramento da apa idade de taxa daRPC, limitando por tanto a máxima tensión atinxible en moitas apli a ións.Unha expli a ión ade uada da orixe dos streamers non existe aínda.Como a onte era no aso das RPCs standard on resolu ións temporais aonivel de 1 ns, desenvolvidas nos anos 80, a introdu ión das RPCs de tempode voo ou 'timing RPCs' no ano 2000, a adando resolu ións abaixo dos 100 ps,ten aberto a posibilidade de apli a ión en diversos experimentos de físi a departí ulas a enerxías altas e intermedias [89.O traballo re ollido nesta tese representa unha pequena parte dun grandeproxe to que pretende ubrir a rexión interna (baixos ángulos) do espe trómetroHADES2 no entro GSI en Darmstadt, Alemaña. O tal muro RPC representaunha mellora do espe trómetro a tual, que permitirá estudar olisións de iónspesados ata Au+Au a enerxías inéti as por volta de 1 GeV/A, aumentando onoso oñe emento das propiedades da materia hadróni a a densidades máis dedúas ve es superiores ás presentes na materia nu lear ordinaria.O proxe to dun muro de RPCs para HADES tense baseado en re entes de-senvolvimentos de on eptos e apli a ións similares, pero in orporando aquelesdetalles que fan de HADES un entorno singular. Os requerimentos máis esixen-tes in lúen unha alta apa idade multi-traza para taxas er anas a 1 kHz/ m2,xunto unha resolu ión temporal homoxénea á volta de 100 ps unha presen iamoderada de audas. HADES foi on ebido para sondar materia nu lear densaa través de pares de di-leptóns pro edentes do de aemento de mesóns ve toriaislixeiros. A pequena probabilidade de dito pro eso (10−5-10−4) require dunhaelevada e ien ia de dete ión e a eptan ia xeométri a, para propo ionar unhaestatísti a razoabel.En vistas ao re ente interese por a adar taxas ada vez máis elevadas, unhaparte da tese esta adi ada ao desenvolvimento dunha te noloxía que permiteextender a taxa de ontaxe nunha orde de magnitude, sempre empregando vidronormal de ventana. Nesa dire ión, proponse neste traballo unha des ri iónteóri a dos efe tos de taxa neste tipo de dete tores, que vai alén dunha simpledes ri ión DC, e permite introdu ir explí itamente na resposta temporal o efe todas u tua ións do ampo elé tri o orixinadas polo arga depositada no vidro.O hamado proxe to ESTRELA (`Ele tri ally Shielded Timing RPCs En-semble for Low Angles', tradu ido: sistema de RPCs te tempo de voo isoladaselé tri amente para baixos ángulos) evolúe on rapidez, e unha parte deste tra-ballo ten sido inevitabelmente superada, mesmo se o espíritu ini ial ontinúavixente.2High A eptan e Di-Ele tron Spe trometer: espe trómetro de alta a eptan ia para di-ele tróns.

C.2. DESEÑO 235
Figure C.1: Detalle do muro ESTRELA a baixos ángulos polares, deseño 3D (arriba) edisposi ión das eldas na aixa de gas (abaixo). As liñas vermellas representan o amiño dos abos que re ollen a sinal.A presente tese tamén pretende propor ionar unha visión xeral do ambiante ampo das RPCs desde o punto de vista do autor, o al poderá ser utilizado omoreferen ia, pero non onsiderado máis alá dunha simple des ri ión da situa ióna tual, a espera de novos avan es e desenrolos que están xa a vir.C.2 DeseñoO muro de RPCs ESTRELA foi optimizado para propor ionar unha probabi-lidade total de dete ión da orde do 90% para leptóns pro edentes do blan o,tendo ao mesmo tempo unha grande a eptan ia xeométri a. A prin ipal ara -terísti a do muro é o isolamento elé tri o das eldas, o al pretende propor ionarboas presta ións no aso de existir trazas simultáneas en eldas próximas (en-torno multi-traza). A proposta natural para propor ionar a blindaxe ne esaria onsiste en olo ar as eldas no interior de perfís re tangulares, segundo semostra na gura C.1. Debido ao espazo morto reado polos perfís, foi propostaunha xeometría en dous pisos (na gura C.1 móstrase un detalle do muro nazona de baixo ángulo) e o solape é xado de maneira que todas as trazas deinterese pro edentes do blan o atravesan polo menos 4 o os de gas, garantindoe ien ias intrínse as preto do 99% [68.Resulta útil denir a e ien ia do dete tor para leptóns, D, en base a tres

236 APPENDIX C. RESUMOmagnitudes independentes:1. A e ien ia intrínse a ε. É unha propiedade do propio dete tor, sendopreto do 99% para RPCs de 4 o os [88, a taxas baixas.2. A a eptan ia xeométri a A. Unha vez o solape é es ollido ade uadamente,as zonas ine ientes permane en por debaixo dun 2% para in iden ia per-pendi ular.3. A probabilidade de dete ión ideal para leptóns L. Fi a xada polo deseño.Refírese á probabilidade de que o sinal indu ido polo leptón sexa re ollidopola ele tróni a, tendo en onta a probabilidade de o upa ión da elda poroutras trazas dentro do mesmo evento. Para esta estimativa onsiderousea situa ión máis desfavorable esperada en HADES, isto é, olisións deAu+Au a 1.5 GeV/A. O resultado estimado é D > 95% para momentosdo ele trón maiores que 100 MeV.A probabilidade de dete tión esperada para pares e+/e− ven dada poloprodu to destes 3 fa tores independentes, resultando para o deseño proposto:D = L×A× ε > 88.5% (C.1)C.3 Veri a ión do on eptoNa primavera do ano 2003 foi probado na averna de HADES baixo un feixede Carbono a 1 GeV/A un novo on epto de muro tRPC baseado en eldaselé tri amente isoladas [96, [97. A nalidade do teste foi avaliar o on eptodesde o punto de vista me áni o xunto oa posibilidade de operar tRPCs nunentorno multi-traza on partí ulas de diferentes velo idades e espe ies e, portanto, diferentes probabilidades de perda de enerxía dentro do dete tor. Asdimensións das tres eldas estudadas foron de 2× 60 m2, inspiradas no deseñodenitivo, e móstranse na gura C.2.Ademáis de veri ar a posibilidade de opera ión do dete tor on normalidadepara tensións da orde de 3 kV/gap, a demostra ión denitiva das apa idades'multi-traza' onsistiu en estimar a resposta temporal para aqueles asos nos queexistía unha traza simultáneamente en algunha das eldas ve iñas. O resultadodeste estudio móstrase na gura C.3. O que é mellor, foi veri ado que o ` ross-talk'3 entre eldas ve iñas estaba abaixo dun 1%, aumentando oa arga dosinal.Non puido ser feita unha medida absoluta da e ien ia do dete tor, debido ápresen ia de trazas in linados entre os sele ionados para o estudo, pero puidodeterminarse que era superior ao 95% ara o entro do dete tor.
3Indu ión de orixe ele tromagnéti o que ten lugar entre ondu tores que están próximos ando se apli a un ampo elé tri o sobre un de eles.

C.3. VERIFICACIÓN DO CONCEPTO 237
Figure C.2: Vista dianteira do prototipo oas tres eldas no seu interior. A elda máis ara á esquerda foi substituída por outra de ele trodos de vidro. Na fotografía de embaixomóstrase unha das eldas RPC antes de ser introdu ida na blindaxe.
−1000 −500 −300 0 300 500 100010
0
101
∆tscin−RPC
[ps]
Eve
nts
[in 1
0 ps
bin
]
σT = 78 ps
3−σ tails=6.5%
Events=1120
Figure C.3: Distribu ión temporal baixo ondi ións multi-traza (a elda ve iña tamén re-xistrou unha traza dentro dese mesmo evento). A distribu ión observada é esen ialmente amesma que no aso de úni a-traza, suxerindo que o deseño propor iona apa idades multi-traza moi robustas.
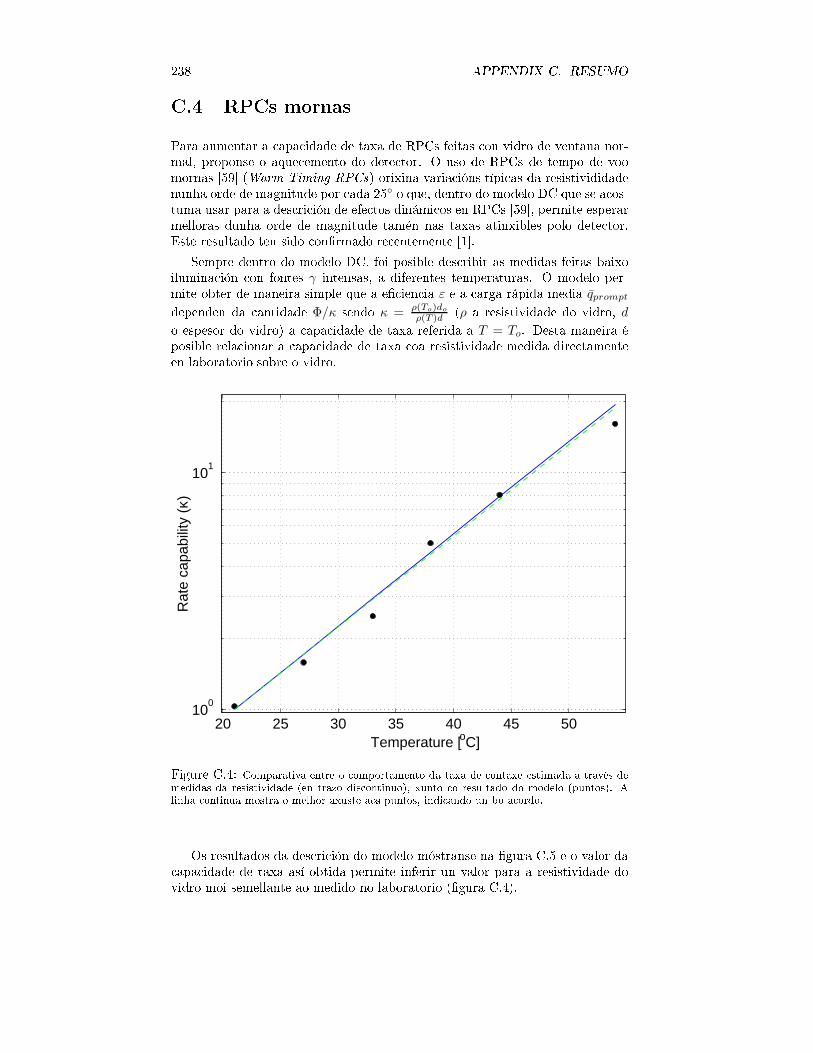
238 APPENDIX C. RESUMOC.4 RPCs mornasPara aumentar a apa idade de taxa de RPCs feitas on vidro de ventana nor-mal, proponse o aque emento do dete tor. O uso de RPCs de tempo de voomornas [59 (Warm Timing RPCs) orixina varia ións típi as da resistivididadenunha orde de magnitude por ada 25 o que, dentro do modelo DC que se a os-tuma usar para a des ri ión de efe tos dinámi os en RPCs [59, permite esperarmelloras dunha orde de magnitude tamén nas taxas atinxibles polo dete tor.Este resultado ten sido onrmado re entemente [1.Sempre dentro do modelo DC, foi posible des ribir as medidas feitas baixoilumina ión on fontes γ intensas, a diferentes temperaturas. O modelo per-mite obter de maneira simple que a e ien ia ε e a arga rápida media qpromptdependen da antidade Φ/κ sendo κ = ρ(To)do
ρ(T )d (ρ a resistividade do vidro, do espesor do vidro) a apa idade de taxa referida a T = To. Desta maneira éposible rela ionar a apa idade de taxa oa resistividade medida dire tamenteen laboratorio sobre o vidro.
20 25 30 35 40 45 5010
0
101
Temperature [oC]
Rat
e ca
pabi
lity
(κ)
Figure C.4: Comparativa entre o omportamento da taxa de ontaxe estimada a través demedidas da resistividade (en trazo dis ontinuo), xunto o resultado do modelo (puntos). Alinha ontinua mostra o melhor axuste aos puntos, indi ando un bo a ordo.Os resultados da des ri ión do modelo móstranse na gura C.5 e o valor da apa idade de taxa así obtida permite inferir un valor para a resistividade dovidro moi semellante ao medido no laboratorio (gura C.4).
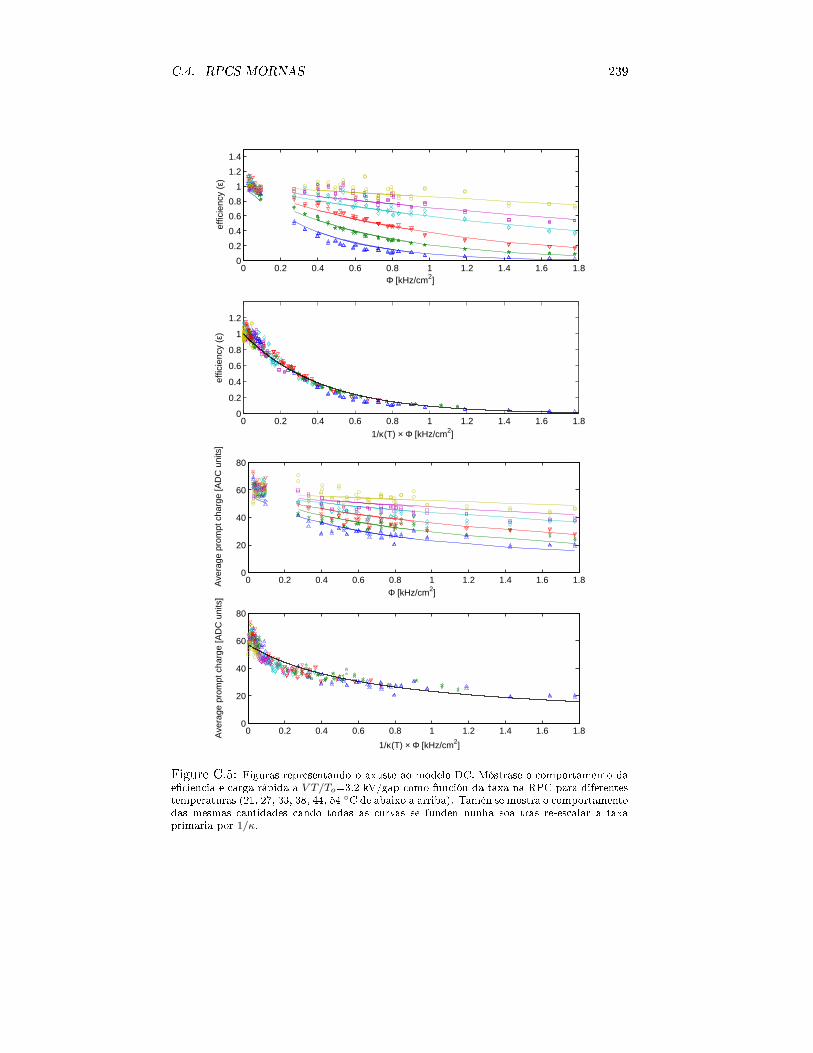
C.4. RPCS MORNAS 2390 0.2 0.4 0.6 0.8 1 1.2 1.4 1.6 1.8
0
0.2
0.4
0.6
0.8
1
1.2
1.4
Φ [kHz/cm2]
effic
ienc
y (ε
)
0 0.2 0.4 0.6 0.8 1 1.2 1.4 1.6 1.80
0.2
0.4
0.6
0.8
1
1.2
1/κ(T) × Φ [kHz/cm2]
effic
ienc
y (ε
)
0 0.2 0.4 0.6 0.8 1 1.2 1.4 1.6 1.80
20
40
60
80
Φ [kHz/cm2]
Ave
rage
pro
mpt
cha
rge
[AD
C u
nits
]
0 0.2 0.4 0.6 0.8 1 1.2 1.4 1.6 1.80
20
40
60
80
1/κ(T) × Φ [kHz/cm2]
Ave
rage
pro
mpt
cha
rge
[AD
C u
nits
]
Figure C.5: Figuras representando o axuste ao modelo DC. Móstrase o omportamento dae ien ia e arga rápida a V T/To=3.2 kV/gap omo fun ión da taxa na RPC para diferentestemperaturas (21, 27, 33, 38, 44, 54 C de abaixo a arriba). Tamén se mostra o omportamentodas mesmas antidades ando todas as urvas se funden nunha soa tras re-es alar a taxaprimaria por 1/κ.

240 APPENDIX C. RESUMOC.5 Un tratamento analíti o das u tua iónsNeste traballo ten sido proposta unha extensión analíti a do modelo DC que per-mite introdu ir na resposta temporal da RPC o efe to das u tua ións do ampoelé tri o debido ao pro eso de ondu ión no vidro [61, [62. É mostrado quea importan ia das u tua ións depende ríti amente da antidade Aτg, sendoA a rexión afe tada por avalan ha e τg o tempo de relaxa ión da RPC. O re-sultado analíti o obtido para as u tua ións do ampo aproxima a orrela iónentre su esivas avalan has de forma promediada, o al ausa diferen ias da ordedun fa tor 2 on respe to ao ál ulo M.C. que des ribe o mesmo pro eso. Nem-bargantes, ambas des ri ións presentan omportamentos similares en fun ióndo número promedio de avalan has na zona afe tada do vidro (N = AτgΦ), naforma: rms
V
Vdrop=
√
√
√
√
(
1 +rms2qq2
)
2N(C.2)sendo rms
V
Vdropa razón das u tua ións na tensión no gas respe to ao valor promedioda aída de tensión no gas. A des ri ión proposta foi omparada os datos de[96, [97 na gura C.6, dentro do modelo DC, mostrando un bo a ordo.
0.1 0.5 1 1.550
60
70
80
90
100
110
120
130
140
Φ [kHz/cm2]
σ T [p
s]
3.1 kV/gap [data]3.2 kV/gap [data]3.3 kV/gap [data]3.3 kV/gap [uncut data]3.1 kV/gap [model]3.2 kV/gap [model]3.3 kV/gap [model]
Figure C.6: Resolu ión temporal obtida a partir do modelo DC para todo o onxuntode datos. Os puntos e o modelo orresponden a 3.1 kV ( ír ulos, liña ontinua), 3.2 kV(triángulos, liña a trazos), 3.3 kV ( adrados, liña a puntos e trazos). As barras de errorefírense aos intervalos de onanza do 68%. Tamén se mostran ( adros baleiros) os puntos a3.3 kV antes de ortar a ontribu ión debida ao tempo de arga do vidro.
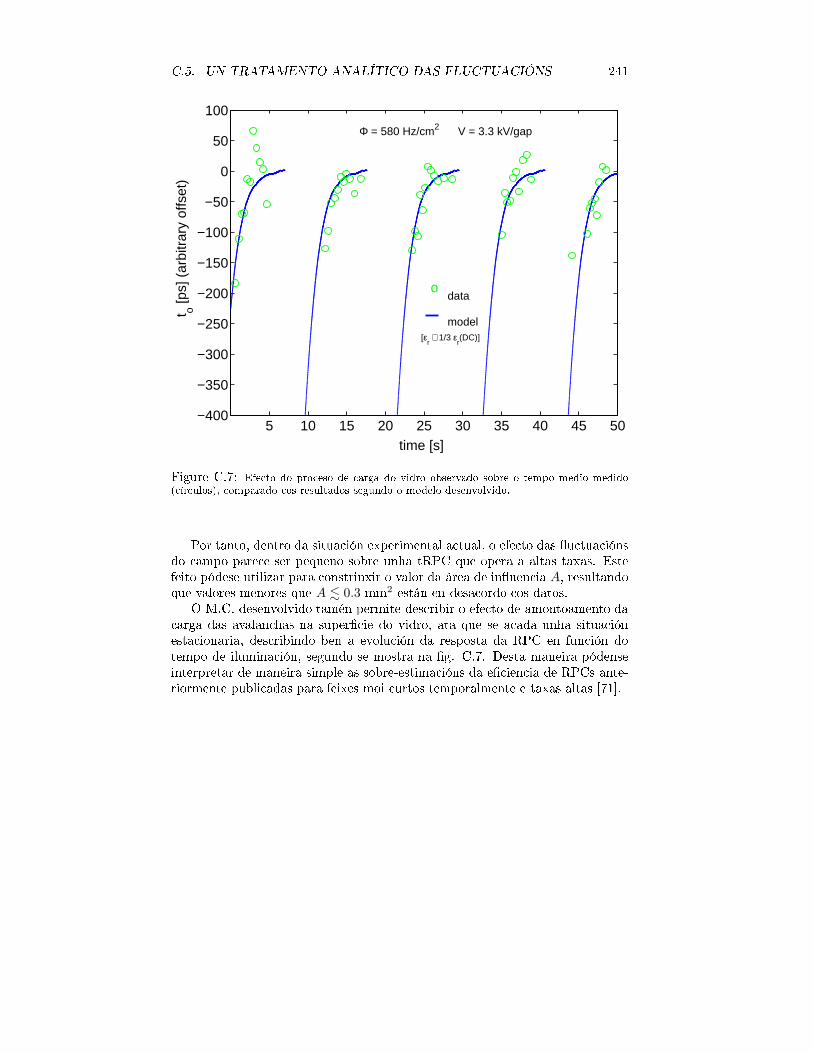
C.5. UN TRATAMENTO ANALÍTICO DAS FLUCTUACIÓNS 241
5 10 15 20 25 30 35 40 45 50−400
−350
−300
−250
−200
−150
−100
−50
0
50
100
time [s]
t o [ps]
(ar
bitr
ary
offs
et)
data model
o
Φ = 580 Hz/cm2 V = 3.3 kV/gap
[εr ∼ 1/3 ε
r(DC)]
Figure C.7: Efe to do pro eso de arga do vidro observado sobre o tempo medio medido( ír ulos), omparado os resultados segundo o modelo desenvolvido.Por tanto, dentro da situa ión experimental a tual, o efe to das u tua iónsdo ampo pare e ser pequeno sobre unha tRPC que opera a altas taxas. Estefeito pódese utilizar para onstrinxir o valor da área de inuen ia A, resultandoque valores menores que A . 0.3 mm2 están en desa ordo os datos.O M.C. desenvolvido tamén permite des ribir o efe to de amontoamento da arga das avalan has na super ie do vidro, ata que se a ada unha situa iónesta ionaria, des ribindo ben a evolu ión da resposta da RPC en fun ión dotempo de ilumina ión, segundo se mostra na g. C.7. Desta maneira pódenseinterpretar de maneira simple as sobre-estima ións da e ien ia de RPCs ante-riormente publi adas para feixes moi urtos temporalmente e taxas altas [71.
242 APPENDIX C. RESUMOC.6 Con lusiónsAs prin ipais aporta ións deste traballo enmár anse dentro do ampo das RPCsde tempo de voo, unha te noloxía emerxida no CERN hai apenas 6 anos. Máis en on reto, ten sido probada a súa apli abilidade ao experimento HADES no GSI,Alemaña, mostrando boas presta ións nun entorno multi-traza ara terísti o de olisións nu leares a enerxías intermedias por volta de 1 GeV/A. Preséntasetamén un deseño realista para tal entorno, propor ionando probabilidades dedete ión próximas ao 90% para as partí ulas de interese (ele tróns e positróns).O proxe to para a onstru ión dun muro de RPCs de tempo de voo paraHADES, denominado ESTRELA (Ele tri ally Shielded Timing RPCs Ensemblefor Low Angles), está xa nun estado avanzado e espérase que sexa ompletadonos próximos anos.Neste traballo móstrase tamén ómo a apa idade de taxa se pode in re-mentar enormemente (unha orde de magnitude) e de maneira prá ti a a travésdun moderado aque emento da RPC (unha te noloxía que ten sido denominadaRPCs mornas para tempo de voo).As posibilidades últimas de mellora da apa idade de ontaxe das RPCsforon exploradas a través dun modelo analíti o que in lúe de maneira explí itao efe to das u tua ións da tensión no gas sobre a resolu ión temporal. Opro eso de arga do vidro foi des rito tamén de maneira simple e omparado os datos, mostrando que a onte e, de maneira natural, na es ala temporal dotempo de relaxa ión da RPC, τg.
Appendix DFrases élebresFa er unha RPC é omo fa er unha tortilla. (O atedráti o).Fa er unha tese non é omo fa er unha tortilla. (O bolseiro).Chega un momento na vida no que hai que fa erse un modelito.(O atedráti o).Fa er unha boa tese require plantexarse abandonala polo menosnun par de o asións. (O bolseiro).Last night I had a dream... (O supervisor).Non me reo iso. (O supervisor).Pois... agranda as barras de erro! (O día antes de enviar oartí ulo).Nun a lle fagas aso ó teu supervisor. (O supervisor).Eu reo que é ne esario des ansar polo menos 8 horas diarias...(O bolseiro).Ok, prepárao para o luns. (O venres pola tarde).Non, hoxe tampou o podo quedar. (O bolseiro).Ah, pero ti tamén traballas nisto? (Ó ompañeiro de grupo).Por qué non organizamos reunións semanais e ontamos o quefa emos...? (Ese vello soño).Bos dias!, omo madrugamos hoxe eh?. (A noite antes dodead line).Algún doutor na sala quere formular preguntas? (A derradeirapregunta da tese).Hai que aumentar a sinerxia. (O atedráti o).243
244 APPENDIX D. FRASES CÉLEBRESrm -rf * (A rise).Que fermoso!. Que é?. (O supervisor).Os datos nun a están mal. O que pode fallar é a teoría. (O bofísi o experimental)Este é o modelo. Se fan ben o experimento deben ser apa es dereprodu ilo. (O bo físi o teóri o)Eu traballo na asa. (O atedráti o).Ola!, traballando no n de semana?. (De bolseiro a bolseiro,o n de semana.).Os xaponeses traballan mentras durmen e os españois durmenmentras traballan. (O hoque de iviliza ións).Sí, sí. (O ins on iente).Non te preo upes pola tese porque ninguén as lé. (O prag-máti o).Segmentation violation, ore dumped. (O ompilador).Moi boa idea, por qué non o fas ti? (A dúbida).O problema é que o ódigo está mal do umentado. (O pro-blema).A físi a é así. (A ausa última de alqueira frustra ión).

Bibliography[1 P. Fonte et al., PoS(HEP2005)376.[2 U. Fano, Penetration of protons, alpha parti les and mesons, Ann. Rev.Nu l. S i. 13(1963)1.[3 S. Eidelman et al., Phys. Lett. B 592(2004)1.[4 Stopping Powers and Ranges for Protons and alpha Parti les, ICRU re-port 49.[5 Aguilar-Benitez M. et al., Phys. Lett. B 24(1988).[6 J. D. Ja kson, Classi al ele trodynami s, 3rd edition, John Wiley & Sons,New York 1998.[7 Enri o Fermi, Phys. Rev. 57(1940)485.[8 P. Budini, L. Taara, Nuovo Cimento, IV/1(1956)22.[9 B. Rossi, High Energy Parti les, Prenti e-Hall, In ., Englewood Clis,NJ, 1952.[10 F. Sauli, Prin iples of operation of multiwire proportional and drift ham-bers, CERN 77-09.[11 E. J. Kobeti h and R. Katz, Phys. Rev. 170(1968)391.[12 Glenn F. Knoll, Radiation Dete tion and Measurement, John Wiley andSons, In ., 1999.[13 P. Ri e-Evans, Spark, Streamer, Proportional and Drift Chambers, Ri he-lieu Press, 1974, London.[14 Townsend J. S., The theory of ionization of gases by ollision, Constable& Co, Londres 1910.[15 S. Biagi, http:// onsult. ern. h/writeup/magboltz/.[16 S. Biagi, CERN.[17 http:// onsult. ern. h/writeup/heed/main.html.[18 W. Riegler, C. Lippmann, Nu l. Instr. and Meth. A 518(2004)86-90.[19 P. Fonte, PhD. Thesis, Lisbon 1992.245

246 BIBLIOGRAPHY[20 V. Palladino, B. Sadoulet, Nu l. Instr. Meth. A 128(1975)323.[21 G. Shultz, J. Gresser, Nu l. Instr. Meth. A 151(1978)413.[22 A. J. Davies, C. J. Evans, The theory of ionization growth in gases underpulsed stati elds, CERN 73-10.[23 J. M. Meek, J. D. Craggs, Ele tri al breakdown in gases, Clarendon Press,Oxford, 1953.[24 C. Lippmann, PhD. Thesis, Frankfurt (2003).[25 W. H. Furry, Phys. Rev. 15(1937)569.[26 R. D. Evans, The Atomi Nu leus, Krieger, New York, 1982.[27 E. D. Lozanskii, Sov. Phys. Usp. 18(1975)83.[28 P. Fonte, IEEE Trans. Nu l. S i. 43(1996)2135.[29 H. Raether, Ele tron avalan hes and breakdown in gases, Butterworths,London, 1964.[30 V. A. Davidenko, B. A. Dolgoshein, V. K. Semenov, S. V. Somov, Nu l.Instr. Meth. 75(1969)325.[31 J. Keuel, Phys. Rev. 73(1948)531.[32 V. V. Parkhom hu k, Yu. N. Pestov, N. V. Petrovykh, Nu l. Instr. andMeth. A 93(1971)269.[33 R. Santoni o and R. Cardarelli, Nu l. Instr. and Meth. A 187(1981)377.[34 R. Cardarelli, R. Santoni o, A. Di Biagio and A. Lu i, Nu l. Instr. andMeth. A 263(1988)20.[35 Jian Gui Wang, Nu l. Instr. and Meth. A. 508(2003)133.[36 D. Pi olo et al, Nu l. Instr. and Meth. A 477(2002)435.[37 C. Ba i et al, Nu l. Instr. and Meth. A 456(2000)121.[38 I. Crotty, J. Lamas Valverde, G. Laurenti, M. C. S. Williams, A. Zi hi hi,Nu l. Instr. and Meth. A 337(1994)370.[39 I. Duerdoth, S. Clowes, J. Freestone, F.K. Loebinger, J. Lomas, S. Snow,R. Thompson, Nu l. Instr. Meth. A 348(1994)303.[40 R. Cardarelli, A. Di Cia io and R. Santoni o, Nu l. Instr. and Meth. A333(1993)399.[41 M. Alviggi, V. Canale, M. Caprio, G. Carlino, R. de Asmundis, M. DellaPietra, D. della Volpe, P. Iengo, S. Patri elli, G. Sekhniaidze, Nu l. Instr.Meth. A 518(2004)79.[42 M. Abbres ia, R. Trentadue et al., Nu l. Instr. Meth. A 533(2004)102.
BIBLIOGRAPHY 247[43 E. Cerron Zeballos, I. Crotty, D. Hatzifotiadou, J. Lamas Valverde, S. Neu-pane, M.C.S. Williams, A. Zi hi hi, Nu l. Instr. and Meth. A 374(1996)132.[44 P. Fonte, IEEE Trans. Nu l. S i. 49,3(2002)881.[45 P. Fonte, A. Smirnitski, M.C.S. Williams, Nu l. Instr. and Meth. A443(2000)201.[46 P. Fonte, R. Ferreira Marques, J. Pinhão, N. Carolino, A. Poli arpo, Nu l.Instr. Meth. A 449(2000)295.[47 A. Blan o, R. Ferreira-Marques, Ch. Fin k, P. Fonte, A. Gobbi, A. Poli- arpo, M. Rozas, Nu l. Instr. Meth. A 485(2002)328.[48 P. Camarri, R. Cardarelli, A. Di Cia io and R. Santoni o, Nu l. Instr. andMeth. A 414(1998)317.[49 A. V. Akindinov, E. S apparone et al., Nu l. Instr. Meth. A 533(2004)93.[50 C. Gustavino, M. D'In e o, E. Tatanami, G. C. Trin hero, Nu l. Instr.Meth. A 457(2001), 558.[51 M. Abbres ia et al., Nu l. Instr. Meth. A 431(1999)413.[52 M. Abbres ia et al., Nu l. Phys. B (Pro . Suppl.) 78(1999)459.[53 P. Fonte, Nu l. Instr. and Meth. A 456(2000)6.[54 G. Aielli, P. Camarri, R. Cardarelli, A. Di Cia io, B. Liberti, A. Paoloni,R. Santoni o, Nu l. Instr. Meth. A 508(2003)6.[55 A. Blan o, P. Fonte, L. Lopes, A. Mangiarotti, R. Ferreira-Marques, A.Poli arpo, Nu l. Instr. and Meth. A 513(2003)8.[56 A. Mangiarotti, C. C. Bueno, P. Fonte, A. Gobbi, D. González-Díaz, L.Lopes, Nu l. Phys. B (Pro . Suppl.) 158(2006)118.[57 Christian Lippmann, Werner Riegler, Nu l. Instr. and Meth. A517(2004)54.[58 G. Carboni, G. Collazuol, S. De Capua, D. Domeni i, G. Ganis, R.Messi, G. Passaleva, E. Santovetti, M. Veltri, Nu l. Instr. and Meth. A498(2003)135.[59 D. González-Díaz, D. Belver, A. Blan o, R. Ferreira Marques, P. Fonte, J.A. Garzon, L. Lopes, A. Mangiarotti, J. Marin, Nu l. Instr. and Meth. A555(2005)72.[60 M. Abbres ia, Nu l. Instr. and Meth. A 533(2004)7.[61 A. Blan o, N. Carolino, C.M.B.A. Correia, R. Ferreira-Marques, P. Fonte,A. Gobbi, D. González-Díaz, M.I.Lopes, L.Lopes, M.P. Ma edo, A. Man-giarotti, V. Peskov, A. Poli arpo, Nu l. Instr. and Meth. A 535(2004)272.[62 D. Gonzalez-Díaz, P. Fonte, J. A. Garzón, A. Mangiarotti, Nu l. Phys. B(Pro . Suppl.) 158(2006)111. .

248 BIBLIOGRAPHY[63 C. Lippmann, W. Riegler, A. Kalweit, Nu l. Phys. B (Pro . Suppl.)158(2006)127.[64 Werner Riegler, Nu l. Instr. Meth. A, 491(2002)258.[65 W. Riegler, D. Burgarth, Nu l. Instr. Meth. A 481(2002)130.[66 W. Riegler, C. Lippmann, R. Veenhof, Nu l. Instr. and Meth. 500(2003)144.[67 A. Mangiarotti, P. Fonte, A. Gobbi, Nu l. Instr. and Meth. A 533(2004)16.[68 P. Fonte, V. Peskov, Nu l. Instr. and Meth. A 477(2002)17.[69 P. Fonte, L. Lopes, private omuni ation.[70 S. Ramo, Pro . of the IRE 27(1939)584.[71 P. Colrain, E. Poly arpo et al., Nu l. Instr. and Meth. A 456(2000)62.[72 J. Va'vra, Nu l. Instr. Meth. A 515(2003)354.[73 C. Gustavino, A. Candela, M. De Deo, M. D'In e o, N. Redaelli, A.Tonazzo, G.C. Trin hero, Nu l. Instr. Meth. A 533(2004)116.[74 J. Zarzy ki, Glasses and the vitreous state, Cambridge University Press,1991.[75 Yu. N. Pestov, Nu l. Instr. Meth. A 494(2002)447.[76 G. Carboni, G. Collazuol, S. de Capua, D. Domeni i, R. Messi, G. Passal-eva, E. Santovetti, M. Veltri, Nu l. Instr. Meth. A 533(2004)107.[77 H. R. Band, Nu l. Phys. B (Pro . Suppl.) 158(2006)139.[78 V. Golovatyuk, F. Gran agnolo, R. Perrino, Nu l. Instr. Meth. A508(2003)29.[79 F. Anulli, C. Lu et al, Nu l. Instr. Meth. A 508(2003)128.[80 S. Park, S.J. Hong et al., Nu l. Instr. Meth. A 533(2004)37.[81 G. Aielli, P. Camarri, R. Cardarelli, A. Di Cia io, A. Di Simone, B. Liberti,L. Palummo, R. Santoni o, Nu l. Phys. B (Pro . Suppl.) 158(2006)143.[82 R. Santoni o, Nu l. Phys. B (Pro . Suppl.)158(2006)5.[83 L. Lopes, R. Ferreira-Marques, P. Fonte, A. P. Piedade, A. Poli arpo, Nu l.Instr. Meth. A 533(2004)121.[84 T. Kubo, H. Sakaue, Y. Teramoto, E. Nakano, T. Takahashi, Nu l. Instr.Meth. A 508(2003)50.[85 F. Anghinol, P. Jarron, A. N. Martemiyanov, E. Usenko, H. Wenninger,M.C.S. Williams, A. Zi hi hi, Nu l. Instr. Meth. 533(2004)183.[86 A. S hüttauf, Nu l. Instr. Meth. A 533(2004)65.

BIBLIOGRAPHY 249[87 D. Belver, J. A. Garzón, A. Gil, D. González-Díaz, W. Koenig, S. Lange, J.Marín, N. Montes, P. Skott, M. Traxler, M. Zapata, Nu l. Phys. B (Pro .Suppl.) 158(2006)47.[88 M. Bogomilov, D. Dedovi h, R. Dumps, F. Dydak, V. Gapienko, A. Se-mak, Y. Sviridov, E. Usenko, J. Wots ha k, V. Zaets, Nu l. Instr. Meth. A508(2003)152.[89 G. Barr, D. Dedovi h, A. De Min, A. De Santo, F. Dydak, V. Koreshev,L. Linssen, C. Pattison, S. Robbins, J. Wots ha k, Nu l. Instr. Meth. A533(2004)214.[90 A. N. Akindinov, D. Hatzifotiadou et al., 533(2004)74.[91 B. Bonner, H. Chen, G. Eppley, F. Geurts, J. Lamas-Valverde, Ch. Li,W. J. Llope, T. Nussbaum, E. Platner, J. Roberts, Nu l. Instr. Meth. A508(2003)181.[92 F. Geurts et al., Nu l. Instr. and Meth. A 533(2004)60.[93 J. Wu et al., Nu l. Instr. and Meth. A 538(2005)243.[94 M. Petrovi i et al., Nu l. Instr. Meth. A 508(2003)75.[95 HADES, Proposal for a High-A eptan e Di-Ele tron Spe trometer, GSI1994.[96 H. Alvarez-Pol, R. Alves, A. Blan o, N. Carolino, J. Es hke, R. Ferreira-Marques, P. Fonte, J. A. Garzón, D. González-Díaz, A. Pereira, J.Pietraszko, J. Pinhão, A. Poli arpo, J. Stroth, Nu l. Instr. and Meth. A533(2004)79.[97 H. Alvarez-Pol, R. Alves, A. Blan o, N. Carolino, J. Es hke, R. Ferreira-Marques, P. Fonte, J. A. Garzón, D. González-Díaz, A. Pereira, J.Pietraszko, J. Pinhão, A. Poli arpo, J. Stroth, Nu l. Instr.and Meth. A535(2004)277.[98 CBM Te hni al Status Report, GSI, January 2005.[99 M. J. Pri e, Nu l. Instr. Meth. A 478(2002)46.[100 W. A. Zaj , Nu l. Instr. Meth. A 453(2000)25.[101 Ch. Fin k, P. Fonte, A. Gobbi, Nu l. Instr. Meth. A 508(2003)63.[102 H. Stöker and W. Greiner, Phys. Rev. E, 137(1986)277.[103 H. Stöker and W. Greiner and W. S heid, Z. Phys. A, 286(1978)121.[104 J. Ai helin and C. M. Ko, Phys. Rev. Lett., 55(1985)2661.[105 E. Grosse, Prog. Part. Nu l. Phys., 30(1993)89.[106 J. Ai helin, Phys. Rev. E, 202(1991)233.[107 C. Sturm et al., Phys. Rev. Lett., 86(2001)39.

250 BIBLIOGRAPHY[108 J. H. Lattimer and M. Prakash, Astrophys. Jour., 550(2001)426.[109 J. Shaner-Bieli h and I. N. Mishustin and J. Bondorf, Nu l. Phys. A,625(1998)12.[110 G. E. Brown and M. Rho, Phys. Rev. Lett., 66, 21(1991)2720.[111 T. Hatsuda and S. H. Lee, Phys. Rev. C, 46(1992)R34.[112 F. Klingl, N. Kaiser and W. Weise, Nu l. Phys. 624(1997)527.[113 W. Weise, Prog. Theor. Phys. Suppl., 149(2003)1.[114 G. Agaki hiev et CERES ollaboration, Phys. Rev. Lett., 75(1995)1272.[115 G. Agaki hiev et CERES ollaboration, Eur. Phys. J. C, 4(1998)231.[116 D. Adamova et CERES ollaboration, Phys. Rev. Lett., 91(2003)042301.[117 G. Agaki hiev et CERES ollaboration, Eur. Phys. J. C, 41(2005)475.[118 R. Rapp and J. Wamba h, Adv. Nu l. Phys., 6(1999)415.[119 R. Shahoyan et NA60 ollaboration, Eur. Phys. J. C, 43(2005)209.[120 G. Usai et NA60 ollaboration, Eur. Phys. J. C, 43(2005)415.[121 S. Damjanovi£ et NA60 ollaboration, nu l-ex/0510044, 2005.[122 R. J. Porter et al., Phys. Rev. Lett. 79(1997)1229.[123 W. K. Wilson et al., Phys. Rev. C 57-4(1998)1865.[124 E. L. Bratkovskaya et al., Nu l. Phys. A 634(1998)168.[125 K. Shekhter, C. Fu hs, Amand Faessler, M. Krivoru henko, B. Marte-myanov, Phys. Rev. C, 68(2003)014904.[126 HADES, http://www-hades.gsi.de.[127 P. Salabura et HADES ollaboration, Progr. Part. Nu l. Phys. 53(2004)49.[128 http://www.gsi.de.[129 C. Garabatos et al., Nu l. Instr. and Meth. 98(1972)577.[130 M. Boehmer, R. Gernhauser et al., Nu l. Instr. and Meth. 471(2001)25.[131 C. Muntz, J. Markert et al., Nu l. Instr. and Meth. A 535(2004)242.[132 C. Agodi et al., IEEE Trans. Nu l. S i. 45, 3(1998)665.[133 A. Balanda, J. Pietraszko et al., Nu l. Instr. and Meth. A 531(2004)445.[134 A. Toia, I. Frohli h, W. Kuhn, J. Lehnert, E. Lins, M. Petri, J. Ritman,M. Traxler, Nu l. Instr. and Meth. A 502(2003)270.[135 T. Eberl et HADES ollaboration, Nu l. Phys A 752(2005)433.[136 HADES ollaboration, nu l-ex/0608031, submitted to PRL.
BIBLIOGRAPHY 251[137 http://wwwasdo .web. ern. h/wwwasdo /geant_html3/geantall.html.[138 http://www-hades.gsi.de, under sim/analysis.[139 P. Salabura et al., HADES internal report.[140 W. Koenig, former HADES te hni al oordinator, private ommuni ation.[141 Dis ussions at XIII HADES ollaboration meeting, Ni olosi, 3-12-2003.[142 http://www.th.physik.uni-frankfurt.de/∼urqmd/.[143 P. Cabanelas Eiras, Diploma Thesis, Santiago de Compostela, 2005.[144 M. Sán hez Gar ía, PhD Thesis, Santiago de Compostela, 2003.[145 LIP-Coimbra, USC-Santiago de Compostela, An RPC TOF WALL forthe HADES spe trometer, Mar h 2002, HADES internal report.[146 http://www.ble ha.at.[147 A. Akindinov et al., IEEE Trans. Nu l. S i. 48, 5(2001)2135.[148 A. S hüttauf, Nu l. Phys. B (Pro . Suppl.) 158(2006)52.[149 Internal ESTRELA-Santiago pages, http://www.us .es/∼genp/estrela.html.[150 A. Kugler, J.A. Garzon, M. Golubeva, D. Gonzalez-Diaz, F. Guber, R.Holzmann, J. Novotny, P. Tlusty, pro . of Bormio onferen e, 2006.[151 A. Blan o, N. Carolino, P. Fonte, A. Gobbi, IEEE Trans. Nu l. S i.48(2001) 1249.[152 Model SK1201EQ5, http://www.imvo-roure. om.[153 V. Ammosov et al., Nu l. Phys. B (Pro . Suppl.) 158(2006)56.[154 P. Fonte, private omumi ation.[155 http://www.femlab. om.[156 A. Mangiarotti and A. Gobbi, Nu l. Instr. and Meth. A 482(2002)192.[157 A. Gobbi, A. Mangiarotti, Nu l. Instr. and Meth. A 508(2003)23.[158 G. Aielli, P. Camarri, R. Cardarelli, A. Di Cia io, L. Di Stante, B. Liberti,A. Paoloni, R. Santoni o, Nu l. Instr. and Meth. A 456(2000)82.[159 D. Belver, talk given at IV CBM ollaboration meeting, GSI, Darmstadt,2005.[160 C. M. Lederer and V. S. Shirley, Table of Isotopes, John Wiley & Sons,New York, 1978.[161 L. Lopes, R. Ferreira Marques, P. Fonte, A. Pereira, V. Peskov, A. Poli- arpo, Nu l. Instr. and Meth. A 533(2004)69.[162 P. Fonte, L. Lopes, private omumi ation.
252 BIBLIOGRAPHY[163 T. Soulfanidis, M Graw-Hill, New York, 1983.[164 L. Lopes.[165 G. Aielli, P. Camarri, R. Cardarelli, A. Di Cia io, L. Di Stante, B. Liberti,A. Paoloni, E. Pastori, R. Santoni o, Nu l. Instr. and Meth. A 508(2003)44.[166 M. Cou eiro, private omuni ation.[167 International Organization for Standarization, Guide to the expression ofun ertainty in measurement, Switzerland, 1995.[168 P. W. Ni holson, Nu lear Ele troni s, John Wiley & Sons, 1974.[169 A. Van der Ziel, Noise in measurements, John Wiley & Sons, 1976.[170 M. M. Fraga et al., Nu l. Instr. and Meth. A 419(1998)485.[171 M. Spiegel, L. Abellanas Rapun, Fórmula y tablas de Matemáti a Apli- ada, M Graw-Hill, 2000.


![URTX - DialnetiI esdentegar verb Ic esdernegar [de,-. de derna] verb xc esdevenidor, esdevenidora esdeveniment m. esdevenir verb isa esdrúixol, esdrúixola esfàcel m.esfaceIar verb](https://static.fdocuments.es/doc/165x107/60be6a06dac4013f1007221e/urtx-dialnet-ii-esdentegar-verb-ic-esdernegar-de-de-derna-verb-xc-esdevenidor.jpg)