![Clase 8 desagregado incoterms [modo de compatibilidad]](https://static.fdocuments.es/doc/165x107/559d73381a28ab10778b468d/clase-8-desagregado-incoterms-modo-de-compatibilidad.jpg)
ANEJO 2 - acuademia.com · que alimentan los almacenamientos naturales de agua, superficiales y...
62
1 ANEJO 2 INVENTARIO DE RECURSOS HÍDRICOS 29/08/2011
-
Upload
hoangtuong -
Category
Documents
-
view
216 -
download
0
Transcript of ANEJO 2 - acuademia.com · que alimentan los almacenamientos naturales de agua, superficiales y...

1
ANEJO 2
INVENTARIO DE RECURSOS
HÍDRICOS
29/08/2011

1
ÍNDICE
1 INTRODUCCIÓN 2
2 BASE NORMATIVA 2
3 ANTECEDENTES 3
4 INVENTARIO DE RECURSOS HÍDRICOS NATURALES 3 4.1 Esquematización y zonificación de los recursos hídricos naturales de la
Demarcación 3 4.2 Descripción e interpretación de las variables hidrológicas 4
4.2.1 Disponibilidad de Información 4 4.2.2 Variables de la Fase atmosférica 5 4.2.3 Variables de la Fase Terrestre. 6 4.2.4 Valores mínimos, medios y máximos en el total de la cuenca 9
4.3 Estadísticos de las series hidrológicas en la Demarcación 9 4.4 Características básicas de calidad de las aguas en condiciones naturales 59 4.5 Reutilización. 60
5 EVALUACIÓN DEL EFECTO DEL CAMBIO CLIMÁTICO 61
DOCUMENTO AUXILIAR 1: Descripción del modelo utilizado.
DOCUMENTO AUXILIAR 2: Inventario de recursos hídricos por sistema de
explotación.

2
1 INTRODUCCIÓN
Este documento presenta el inventario de recursos hídricos de la parte española de la
Demarcación Hidrográfica del Tajo (DHTajo). Los recursos hídricos disponibles en la
demarcación están constituidos por los recursos hídricos propios, convencionales y no
convencionales (naturales, reutilización, etc).
El inventario de recursos hídricos naturales, está compuesto por su estimación cuantitativa,
descripción cualitativa y la distribución temporal. Incluye las aportaciones de los ríos y las
que alimentan los almacenamientos naturales de agua, superficiales y subterráneos. Esta
evaluación se ha desagregado por zonas atendiendo, entre otros, a criterios hidrográficos,
administrativos, socioeconómicos y ambientales. Con carácter general se ha de considerar la
zonificación existente, tal como se indica en el Reglamento de la Planificación Hidrológica
(RPH) y en la Instrucción de Planificación Hidrológica (IPH), los datos estadísticos que
muestran la evolución del régimen natural de flujos y almacenamientos a lo largo del ciclo
hidrológico y las interrelaciones entre variables.
2 BASE NORMATIVA
El artículo 42.1 a) c'), sobre “El contenido de los planes hidrológicos de cuenca”, del texto
refundido de la Ley de Aguas, TRLA en adelante, aprobado por RD Legislativo 1/2001, de 20
de julio, hace referencia al inventario de recursos hídricos:
1. Los planes hidrológicos de cuenca comprenderán obligatoriamente:
a) La descripción general de la demarcación hidrográfica, incluyendo:
a') Para las aguas superficiales tanto continentales como costeras y de transición,
mapas con sus límites y localización, ecorregiones, tipos y condiciones de referencia. En el caso de aguas artificiales y muy modificadas, se incluirá asimismo la motivación conducente a tal calificación.
b') Para las aguas subterráneas, mapas con la localización y límites de las masas de agua.
c') El inventario de los recursos superficiales y subterráneos incluyendo sus regímenes hidrológicos y las características básicas de calidad de las aguas.
El artículo 4 del Reglamento de Planificación Hidrológica, RPH en adelante, transcribe la
referencia del artículo 42.1 a) c') referente al inventario de recursos hídricos dentro de la
descripción general de la demarcación hidrográfica (apartado a)) en el contenido obligatorio
de los planes hidrológicos de la Demarcación:
El apartado 2.4 de la Instrucción de Planificación Hidrológica, IPH en adelante, aprobada por
la Orden Ministerial ARM 2656/2008, desarrolla los contenidos mínimos que deberá abarcar
el inventario de recursos hídricos naturales:
El inventario de recursos incluirá las aguas que contribuyan a las aportaciones de los ríos y las que alimenten
almacenamientos naturales de agua, superficiales o subterráneos.
El inventario contendrá, en la medida que sea posible:
a) Datos estadísticos que muestren la evolución del régimen natural de los flujos y almacenamientos a lo largo
del año hidrológico.
b) Interrelaciones de las variables consideradas, especialmente entre las aguas superficiales y subterráneas, y
entre las precipitaciones y las aportaciones de los ríos o recarga de acuíferos.
c) La zonificación y la esquematización de los recursos hídricos naturales en la demarcación hidrográfica.
d) Características básicas de calidad de las aguas en condiciones naturales.

3
Respecto a los recursos hídricos propios procedentes de fuentes no convencionales: aguas reutilizadas y aguas procedentes de la desalación, el RD 1620/2007, de 7 de diciembre, establece el régimen jurídico de reutilización de las aguas depuradas y en el Capítulo V
artículo 13 del TRLA, se establecen las condiciones de utilización de las aguas procedentes de desalación.
3 ANTECEDENTES
Los recursos hídricos propios naturales o convencionales están constituidos por las
aportaciones naturales en el territorio de la demarcación, considerando las infraestructuras
de almacenamiento y regulación existentes. Para la estimación de estos recursos se emplean
modelos hidrológicos.
Durante la elaboración del anterior Plan Hidrológico de cuenca del Tajo (RD 1664/1998), se
utilizó el modelo conocido en España como “SACRAMENTO”. Los recursos hídricos medios
disponibles, estimados con esta herramienta, ascendían a 11.991 hm3/año.
En cambio para el nuevo Plan Hidrológico, los recursos medios en régimen natural se han
simulado con la versión 2008 del modelo “SIMPA”.
4 INVENTARIO DE RECURSOS HÍDRICOS NATURALES
4.1 ESQUEMATIZACIÓN Y ZONIFICACIÓN DE LOS RECURSOS
HÍDRICOS NATURALES DE LA DEMARCACIÓN
Los sistemas de explotación están formados por una o varias zonas, y su división responde a
criterios de funcionalidad en la explotación de los recursos hídricos en la cuenca. La
Demarcación Hidrográfica del Tajo comprende 10 sistemas de explotación, según se muestra
en la siguiente figura:
Figura 1. Mapa de los sistemas de explotación básicos existentes en la Demarcación Hidrográfica del
Tajo.
Los flujos totales en régimen natural constan de una componente de escorrentía superficial
directa y de una componente de origen subterráneo. Esta componente subterránea de la
escorrentía total, coincide básicamente -dejando al margen los efectos de transferencias
subterráneas externas- con la recarga natural de los acuíferos.
Pese a estas dificultades, el conocimiento de la recarga resulta de gran interés teórico y
práctico, pues viene a acotar las posibilidades máximas de explotación sostenible a largo
plazo de las aguas subterráneas de un acuífero.

4
La mayor parte del agua que se infiltra en los acuíferos se descarga diferida en el tiempo a la
red fluvial, de forma difusa o a través de manantiales, y en muchas cuencas es uno de los
constituyentes básicos de la aportación de los ríos. Otra parte de la recarga, en general
mucho más reducida, se transfiere subterráneamente a otros acuíferos.
Para estimar la recarga natural o infiltración a los acuíferos se necesita conocer su
delimitación geométrica. En España los acuíferos se han agrupado en distintas unidades
hidrogeológicas, que con la implantación de la DMA pasan a ser masas de agua subterránea.
Es conveniente diferenciar aquí entre el concepto físico de acuífero, entendido como
formación geológica capaz de almacenar y transmitir agua, y el concepto administrativo de
masa de agua subterránea, formada por uno o más acuíferos, que se agrupan a efectos de
conseguir una racional y eficaz administración del agua y cuyos límites pueden incluir
también porciones del territorio donde no existen acuíferos. En la Demarcación Hidrográfica
del Tajo se han delimitado 24 masas de agua subterránea.
Se han considerado como recursos renovables de las masas de agua subterránea el
sumatorio de la infiltración media de lluvia, los retornos de riego y las entradas laterales
procedentes de otras cuencas. Estos valores son medios interanuales y en el caso de la
infiltración por lluvia se corresponden con los valores medios de las series históricas.
Las referencias a explotación de aguas subterráneas se refieren a aguas extraídas mediante
bombeo de los acuíferos, y no a la fracción de origen subterráneo de la escorrentía total.
Puede haber gran explotación por bombeos en cuencas con muy escasa fracción de
escorrentía subterránea, y, a la inversa, no haber ninguna explotación por bombeos en
cuencas con gran componente de escorrentía subterránea.
4.2 DESCRIPCIÓN E INTERPRETACIÓN DE LAS VARIABLES
HIDROLÓGICAS
4.2.1 DISPONIBILIDAD DE INFORMACIÓN
Se han utilizado dos series hidrológicas diferentes en la elaboración del Plan Hidrológico de la
Demarcación Hidrográfica del Tajo, la serie larga correspondiente al período 1940/41-
2005/06, y la serie corta correspondiente al período 1981/82-2005/06.
El modelo de simulación utilizado ha sido el modelo conceptual y cuasidistribuido SIMPA
(Sistema Integrado para la Modelación del proceso Precipitación Aportación) de
precipitación-aportación, actualizado por el Centro de Estudios Hidrográficos del CEDEX. Se
han utilizado como variables de la fase atmosférica: la temperatura, la precipitación, la
evapotranspiración potencial, y como variables de la fase terrestre: la infiltración o recarga,
la evapotranspiración real, y las escorrentías: superficial, subterránea y total. El terreno se
ha discretizado en celdas de 1000x1000 m2.
Respecto a la información de recursos de aguas subterráneas (niveles piezométricos en los
acuíferos), la información se ha obtenido de la red de piezometría e hidrometría de la
demarcación hidrográfica, red que se muestra en el siguiente mapa de la demarcación:

5
Figura 2. Mapa de puntos seleccionados de las redes de piezometría
4.2.2 VARIABLES DE LA FASE ATMOSFÉRICA
Las series meteorológicas proceden de la Agencia Española de Meteorología, AEMET. Se ha
utilizado el histórico de la red de medida de lluvia, temperatura máxima y mínima y, en un
número limitado de estaciones, datos de velocidad de viento, número de horas de sol y
humedad relativa.
Todas estas series han sido sometidas a pruebas de homogeneidad, dobles acumulaciones y
test de la elipse principalmente para identificar errores en las medidas. Posteriormente se
aplicó un procedimiento de completado de las carencias de información utilizando un
procedimiento de correlación bivariada con estacionarización mensual previa.
Los mapas de lluvia se han interpolado usando patrones de precipitación que permitieran
descomponer cada dato en un residuo y una tendencia media. La interpolación consideraba
únicamente el residuo de precipitaciones. Y sobre el patrón de precipitaciones se realizaron
los estudios que permitieron corregir los problemas derivados de la escasa densidad de datos
en altura o la de las aglomeraciones y redundancias de información.
En la interpolación de temperaturas máximas y mínimas se ha seguido el mismo
procedimiento. La evapotranspiración potencial se ha obtenido utilizando el método de
Hargreaves, corregido en función de coeficientes mensuales procedentes de la comparación
de resultados entre los métodos de Penman Monteith y Hargreaves.
A continuación se describen los valores característicos de las distintas variables hidrológicas
utilizadas y se muestra su distribución espacial.
4.2.2.1 PRECIPITACIÓN
La distribución intraanual se caracteriza por la heterogeneidad, con meses lluviosos
(fundamentalmente los meses de otoño y primavera) y meses secos (verano). En el
siguiente mapa, se muestra la distribución espacial de los valores medios anuales totales de
precipitación en la demarcación hidrográfica del Tajo:
6
Figura 3. Distribución espacial de la media de la precipitación total anual (mm/año) en la demarcación
hidrográfica. (Período 1940/41-2005/06)
4.2.2.2 TEMPERATURAS E ÍNDICE DE ARIDEZ
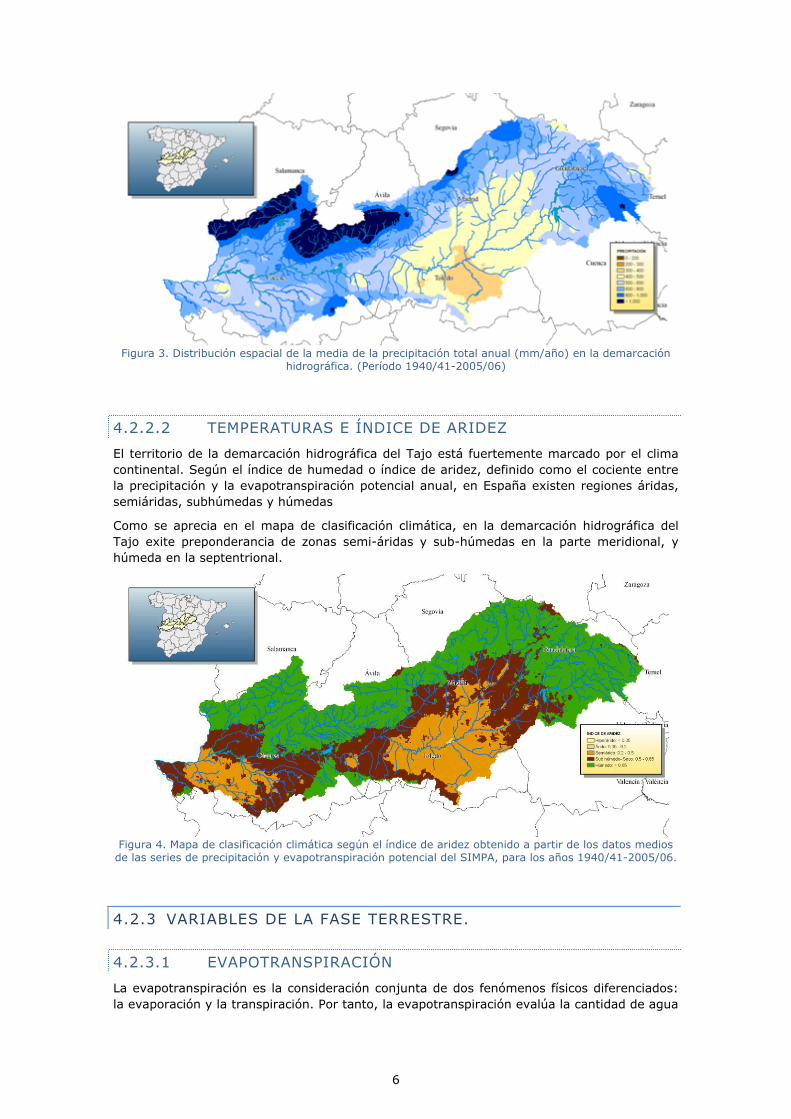
El territorio de la demarcación hidrográfica del Tajo está fuertemente marcado por el clima
continental. Según el índice de humedad o índice de aridez, definido como el cociente entre
la precipitación y la evapotranspiración potencial anual, en España existen regiones áridas,
semiáridas, subhúmedas y húmedas
Como se aprecia en el mapa de clasificación climática, en la demarcación hidrográfica del
Tajo exite preponderancia de zonas semi-áridas y sub-húmedas en la parte meridional, y
húmeda en la septentrional.
Figura 4. Mapa de clasificación climática según el índice de aridez obtenido a partir de los datos medios
de las series de precipitación y evapotranspiración potencial del SIMPA, para los años 1940/41-2005/06.
4.2.3 VARIABLES DE LA FASE TERRESTRE.
4.2.3.1 EVAPOTRANSPIRACIÓN
La evapotranspiración es la consideración conjunta de dos fenómenos físicos diferenciados:
la evaporación y la transpiración. Por tanto, la evapotranspiración evalúa la cantidad de agua

7
que pasa a la atmósfera en forma de vapor de agua a través de la evaporación y de la
traspiración de la vegetación.
La evapotranspiración depende, entre otros, de dos factores muy variables y difíciles de
medir: el contenido de humedad del suelo y el desarrollo vegetal de la planta. Por esta razón
Thornthwaite (1948) introdujo el término de evapotranspiración potencial o pérdidas por
evapotranspiración, en el doble supuesto de un desarrollo vegetal óptimo y una capacidad de
campo permanentemente completa.
La evapotranspiración es un componente fundamental del balance hidrológico y un factor
clave en la interacción entre la superficie terrestre y la atmósfera. Su cuantificación se hace
necesaria para evaluar los recursos hídricos disponibles en el territorio. La unidad más usual
para expresar las pérdidas por evapotranspiración es el milímetro de altura de agua (mm), lo
que equivale a 1.000 m³/km². La medida siempre se refiere a un determinado intervalo de
tiempo.
Figura 5. Distribución espacial de la evapotranspiración potencial total anual (mm/año) en la
demarcación hidrográfica. (Período 1980/81-2005/06)
Es muy importante diferenciar entre evapotranspiración potencial (ETP) y evapotranspiración
real (ETR). La ETP es la evapotranspiración que se produciría si la humedad del suelo y la
cobertera vegetal estuvieran en condiciones óptimas. La ETR es la evapotranspiración real
que se produce en las condiciones reales existentes, dependiendo por tanto, de precipitación,
temperatura, humedad del suelo y del aire, tipo de cobertura vegetal y estado de desarrollo
de la misma. En el siguiente mapa se aprecia la distribución de esta variable en la
demarcación hidrográfica:
Figura 6. Distribución espacial del valor medio de la evapotranspiración real total anual (mm/año) en el
período 1940/41-2005/06
8
4.2.3.2 INFILTRACIÓN O RECARGA
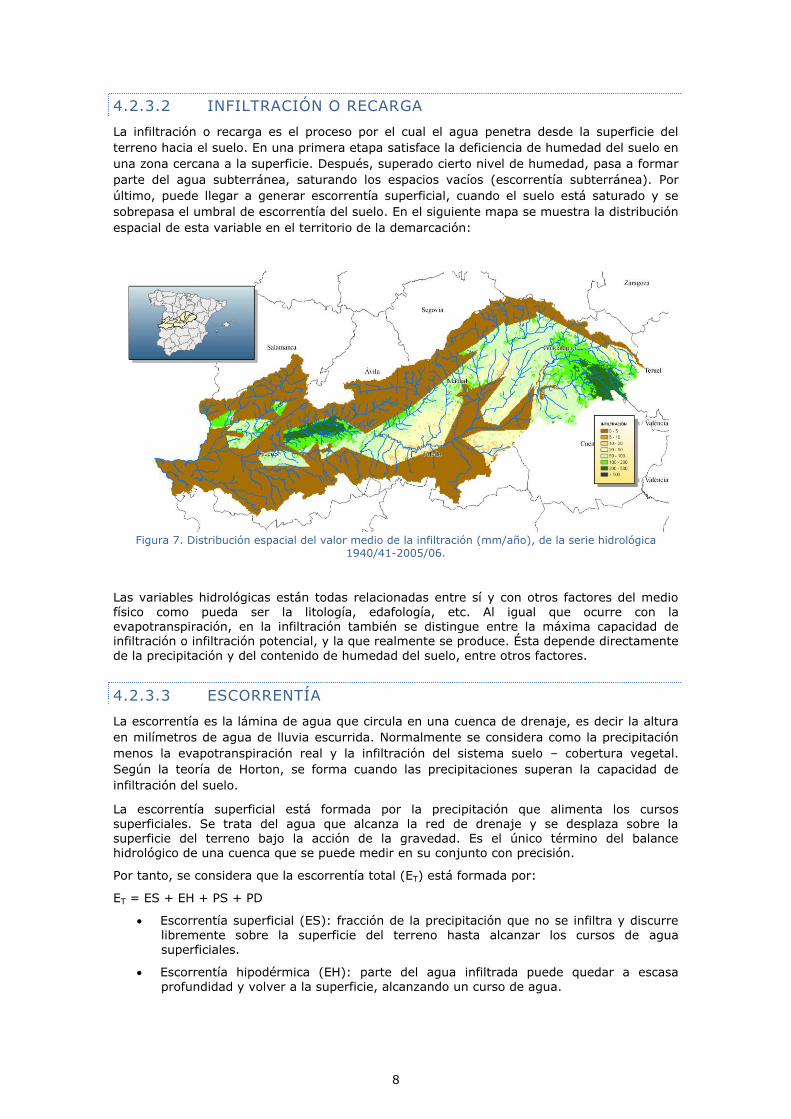
La infiltración o recarga es el proceso por el cual el agua penetra desde la superficie del
terreno hacia el suelo. En una primera etapa satisface la deficiencia de humedad del suelo en
una zona cercana a la superficie. Después, superado cierto nivel de humedad, pasa a formar
parte del agua subterránea, saturando los espacios vacíos (escorrentía subterránea). Por
último, puede llegar a generar escorrentía superficial, cuando el suelo está saturado y se
sobrepasa el umbral de escorrentía del suelo. En el siguiente mapa se muestra la distribución
espacial de esta variable en el territorio de la demarcación:
Figura 7. Distribución espacial del valor medio de la infiltración (mm/año), de la serie hidrológica
1940/41-2005/06.
Las variables hidrológicas están todas relacionadas entre sí y con otros factores del medio
físico como pueda ser la litología, edafología, etc. Al igual que ocurre con la evapotranspiración, en la infiltración también se distingue entre la máxima capacidad de infiltración o infiltración potencial, y la que realmente se produce. Ésta depende directamente
de la precipitación y del contenido de humedad del suelo, entre otros factores.
4.2.3.3 ESCORRENTÍA
La escorrentía es la lámina de agua que circula en una cuenca de drenaje, es decir la altura
en milímetros de agua de lluvia escurrida. Normalmente se considera como la precipitación
menos la evapotranspiración real y la infiltración del sistema suelo – cobertura vegetal.
Según la teoría de Horton, se forma cuando las precipitaciones superan la capacidad de
infiltración del suelo.
La escorrentía superficial está formada por la precipitación que alimenta los cursos
superficiales. Se trata del agua que alcanza la red de drenaje y se desplaza sobre la superficie del terreno bajo la acción de la gravedad. Es el único término del balance hidrológico de una cuenca que se puede medir en su conjunto con precisión.
Por tanto, se considera que la escorrentía total (ET) está formada por:
ET = ES + EH + PS + PD
Escorrentía superficial (ES): fracción de la precipitación que no se infiltra y discurre
libremente sobre la superficie del terreno hasta alcanzar los cursos de agua superficiales.
Escorrentía hipodérmica (EH): parte del agua infiltrada puede quedar a escasa
profundidad y volver a la superficie, alcanzando un curso de agua.
9
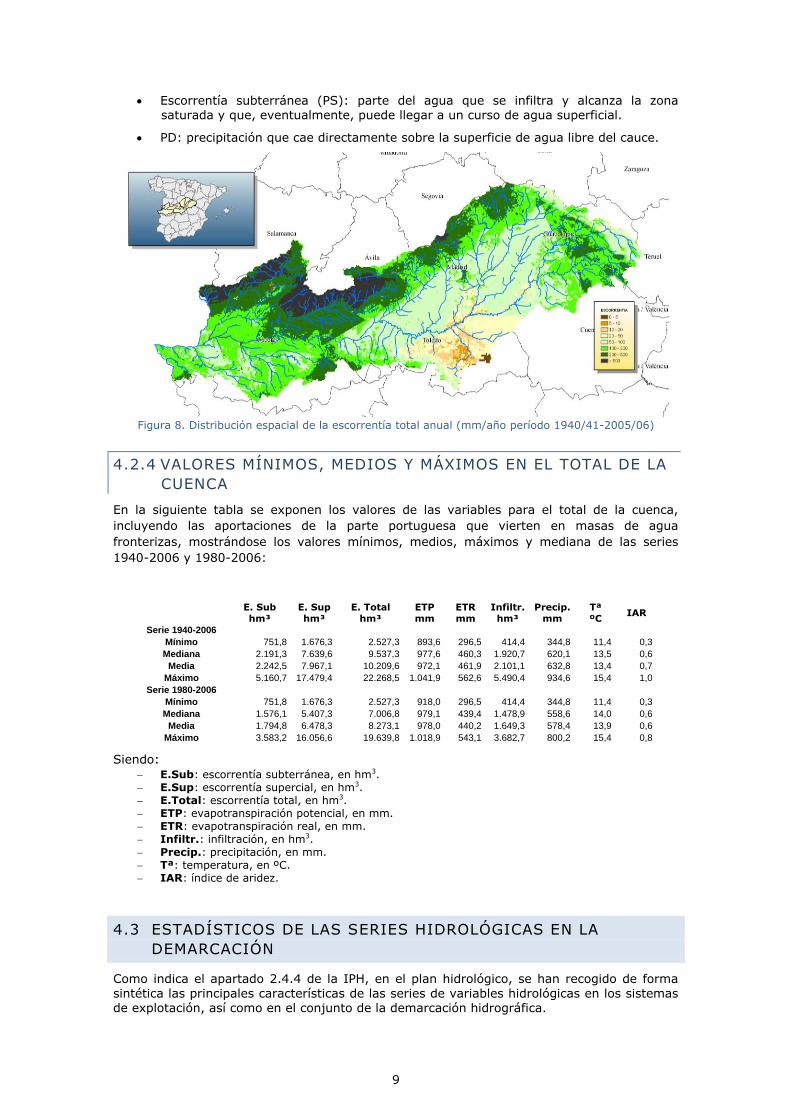
Escorrentía subterránea (PS): parte del agua que se infiltra y alcanza la zona saturada y que, eventualmente, puede llegar a un curso de agua superficial.
PD: precipitación que cae directamente sobre la superficie de agua libre del cauce.
Figura 8. Distribución espacial de la escorrentía total anual (mm/año período 1940/41-2005/06)
4.2.4 VALORES MÍNIMOS, MEDIOS Y MÁXIMOS EN EL TOTAL DE LA
CUENCA
En la siguiente tabla se exponen los valores de las variables para el total de la cuenca,
incluyendo las aportaciones de la parte portuguesa que vierten en masas de agua
fronterizas, mostrándose los valores mínimos, medios, máximos y mediana de las series
1940-2006 y 1980-2006:
E. Sub hm³
E. Sup hm³
E. Total hm³
ETP mm
ETR mm
Infiltr. hm³
Precip. mm
Tª ºC
IAR
Serie 1940-2006
Mínimo 751,8 1.676,3 2.527,3 893,6 296,5 414,4 344,8 11,4 0,3
Mediana 2.191,3 7.639,6 9.537,3 977,6 460,3 1.920,7 620,1 13,5 0,6
Media 2.242,5 7.967,1 10.209,6 972,1 461,9 2.101,1 632,8 13,4 0,7
Máximo 5.160,7 17.479,4 22.268,5 1.041,9 562,6 5.490,4 934,6 15,4 1,0
Serie 1980-2006
Mínimo 751,8 1.676,3 2.527,3 918,0 296,5 414,4 344,8 11,4 0,3
Mediana 1.576,1 5.407,3 7.006,8 979,1 439,4 1.478,9 558,6 14,0 0,6
Media 1.794,8 6.478,3 8.273,1 978,0 440,2 1.649,3 578,4 13,9 0,6
Máximo 3.583,2 16.056,6 19.639,8 1.018,9 543,1 3.682,7 800,2 15,4 0,8
Siendo:
E.Sub: escorrentía subterránea, en hm3.
E.Sup: escorrentía supercial, en hm3.
E.Total: escorrentía total, en hm3.
ETP: evapotranspiración potencial, en mm.
ETR: evapotranspiración real, en mm.
Infiltr.: infiltración, en hm3.
Precip.: precipitación, en mm.
Tª: temperatura, en ºC.
IAR: índice de aridez.
4.3 ESTADÍSTICOS DE LAS SERIES HIDROLÓGICAS EN LA
DEMARCACIÓN
Como indica el apartado 2.4.4 de la IPH, en el plan hidrológico, se han recogido de forma
sintética las principales características de las series de variables hidrológicas en los sistemas de explotación, así como en el conjunto de la demarcación hidrográfica.

10
Para las series de precipitaciones y aportaciones anuales se han indicado los valores mínimo, medio y máximo, los coeficientes de variación y de sesgo y el primer coeficiente de autocorrelación.
Asimismo, y con objeto de conocer la distribución intraanual de los principales flujos, se han indicado los valores medios de precipitación, evapotranspiración potencial y real, recarga a los acuíferos y escorrentía total para cada mes del año en cada sistema de explotación por
separado y acumulando en aquellos que tengan aportaciones naturales de otros sistemas.
Así el Sistema Bajo Tajo acumulado incluye toda la parte española de la demarcación, diferenciándose si se toma sólo las aportaciones de la parte española o si se incluyen las habidas en la parte portuguesa que se incorporan en las masas de agua fronterizas.
Todas estas variables se han calculado tanto para la serie completa o histórica 1940-2006
como para el periodo comprendido entre los años hidrológicos 1980-2006, mostrándose
también para la 1940-1980.
4.3.1.1 SERIES ANUALES
A continuación se muestran los estadísticos de las series por Sistemas de explotación de la
demarcación, así como representación gráfica de las mismas, donde:
E.Sub: escorrentía subterránea, en hm3.
E.Sup: escorrentía supercial, en hm3.
E.Total: escorrentía total, en hm3.
ETP: evapotranspiración potencial, en mm.
ETR: evapotranspiración real, en mm.
Infiltr.: infiltración, en hm3.
Precip.: precipitación, en mm.
Tª: temperatura, en ºC.
IAR: índice de aridez.

11
4.3.1.1.1 SISTEMA DE EXPLOTACIÓN CABECERA
Serie 1940-2006 E. Sub hm³
E. Sup hm³
E. Total hm³
ETP mm
ETR mm
Infiltr. hm³
Precip. mm
Tª ºC IAR
Nº de datos 66 66 66 66 66 66 66 66 66 Mínimo 372,3 30,9 424,2 664,2 328,1 167,7 345,2 10,7 0,5
Percentil 10% 426,0 68,8 504,7 706,7 422,2 337,2 481,3 11,2 0,6
Percentil 15% 478,4 87,2 581,0 712,6 430,5 410,3 500,0 11,2 0,7 Percentil 20% 525,1 115,2 614,5 716,1 437,3 465,5 509,2 11,4 0,7 Percentil 80% 1.246,6 621,5 1.879,2 755,5 520,7 1.360,4 735,9 12,3 1,0 Percentil 85% 1.357,2 709,3 1.985,1 760,3 523,4 1.530,6 769,8 12,5 1,1 Percentil 90% 1.498,3 778,9 2.202,6 763,9 528,3 1.727,1 785,1 12,7 1,1
Máximo 2.365,2 1.401,7 3.766,9 814,2 568,7 2.767,5 982,1 13,7 1,5 Media 944,1 386,2 1.330,3 737,6 475,7 986,6 621,2 11,9 0,8
Mediana 928,8 269,1 1.171,0 738,1 482,4 892,7 588,5 11,9 0,8 Desv. Típica 438,3 321,9 747,9 95,1 76,3 566,1 155,0 1,6 0,2
Coeficiente de variación 0,4642 0,8337 0,5622 0,1289 0,1603 0,5738 0,2496 0,1338 0,2701 Coeficiente de Sesgo 0,8414 1,1835 1,0063 -0,0015 -0,5756 0,8318 0,4031 0,3138 0,6399
1er Coeficiente de autocorrelación 0,3123 0,1338 0,2350 0,1505 0,0953 0,0970 0,0763 0,1345 0,0666
Serie 1980-2006 E. Sub hm³
E. Sup hm³
E. Total hm³
ETP mm
ETR mm
Infiltr. hm³
Precip. mm
Tª ºC IAR
Nº de datos 26 26 26 26 26 26 26 26 26 Mínimo 372,3 30,9 424,2 693,1 328,1 167,7 345,2 11,2 0,5
Percentil 10% 426,0 59,9 486,1 713,3 399,1 318,4 451,3 11,4 0,6 Percentil 15% 445,8 67,0 506,8 718,5 430,4 352,7 482,9 11,6 0,6 Percentil 20% 471,4 69,0 567,0 719,5 433,8 407,6 488,2 11,7 0,7 Percentil 80% 1.108,3 432,2 1.561,2 755,5 488,3 1.227,0 671,2 12,5 0,9 Percentil 85% 1.130,8 460,7 1.597,0 756,9 498,5 1.297,1 691,4 12,6 0,9 Percentil 90% 1.169,4 536,6 1.685,1 761,2 514,7 1.335,2 698,4 12,7 1,0
Máximo 1.390,1 706,9 2.096,9 766,6 523,4 1.718,5 779,5 13,7 1,1 Media 759,1 258,3 1.017,4 739,3 456,3 792,0 568,5 12,1 0,8
Mediana 702,6 179,3 928,6 741,4 460,5 663,3 568,7 12,1 0,8 Desv. Típica 345,5 208,0 546,4 149,2 102,8 450,3 155,0 2,5 0,2
Coeficiente de variación 0,4552 0,8050 0,5371 0,2018 0,2253 0,5686 0,2727 0,2051 0,2793 Coeficiente de Sesgo 0,5283 0,8546 0,6454 -0,6195 -0,9524 0,4562 0,0524 0,5267 0,2004
1er Coeficiente de autocorrelación 0,3123 0,1338 0,2350 0,1505 0,0953 0,0970 0,0763 0,1345 0,0666
Serie 1940-1980
E. Sub
hm³
E. Sup
hm³
E. Total
hm³
ETP
mm
ETR
mm
Infiltr.
hm³
Precip.
mm
Tª
ºC IAR Nº de datos 40 40 40 40 40 40 40 40 40
Mínimo 390,0 49,4 439,4 664,2 375,3 238,0 359,4 10,7 0,5 Percentil 10% 489,3 99,8 577,9 701,1 425,0 403,8 508,2 11,1 0,7 Percentil 15% 645,4 139,3 777,5 711,5 431,0 524,3 515,7 11,2 0,7 Percentil 20% 684,5 152,1 853,5 713,8 445,3 635,0 520,6 11,3 0,7 Percentil 80% 1.397,2 729,2 2.152,5 752,5 523,9 1.613,4 773,3 12,2 1,1 Percentil 85% 1.530,2 781,9 2.245,5 761,4 531,8 1.737,2 794,5 12,4 1,1 Percentil 90% 1.553,8 1.001,5 2.555,3 777,6 538,4 1.825,0 855,3 12,6 1,2
Máximo 2.365,2 1.401,7 3.766,9 814,2 568,7 2.767,5 982,1 13,2 1,5 Media 1.064,4 469,3 1.533,7 736,5 488,3 1.113,2 655,4 11,8 0,9
Mediana 983,3 439,7 1.465,2 735,7 494,6 962,4 633,3 11,7 0,9 Desv. Típica 476,4 361,4 821,4 121,5 90,3 620,8 176,1 2,0 0,3
Coeficiente de variación 0,4475 0,7701 0,5356 0,1650 0,1849 0,5577 0,2687 0,1679 0,2922 Coeficiente de Sesgo 0,6985 0,8872 0,8158 0,1798 -0,4086 0,7105 0,2522 0,3605 0,4638
1er Coeficiente de autocorrelación 0,2436 0,0184 0,1352 0,2633 -0,0311 0,0371 -0,0506 0,0842 -0,0353

12
Sistema de explotación Cabecera
0
500
1.000
1.500
2.000
2.500
3.000
3.500
4.000
1940
-194
1
1942
-194
3
1944
-194
5
1946
-194
7
1948
-194
9
1950
-195
1
1952
-195
3
1954
-195
5
1956
-195
7
1958
-195
9
1960
-196
1
1962
-196
3
1964
-196
5
1966
-196
7
1968
-196
9
1970
-197
1
1972
-197
3
1974
-197
5
1976
-197
7
1978
-197
9
1980
-198
1
1982
-198
3
1984
-198
5
1986
-198
7
1988
-198
9
1990
-199
1
1992
-199
3
1994
-199
5
1996
-199
7
1998
-199
9
2000
-200
1
2002
-200
3
2004
-200
5
hm3
Escorrentía Total (hm3) Escorrentía Subterránea (hm
3) Escorrentía Superficial (hm
3) Infiltración (hm
3)
0
100
200300
400
500
600700
800
900
1940
-194
1
1942
-194
3
1944
-194
5
1946
-194
7
1948
-194
9
1950
-195
1
1952
-195
3
1954
-195
5
1956
-195
7
1958
-195
9
1960
-196
1
1962
-196
3
1964
-196
5
1966
-196
7
1968
-196
9
1970
-197
1
1972
-197
3
1974
-197
5
1976
-197
7
1978
-197
9
1980
-198
1
1982
-198
3
1984
-198
5
1986
-198
7
1988
-198
9
1990
-199
1
1992
-199
3
1994
-199
5
1996
-199
7
1998
-199
9
2000
-200
1
2002
-200
3
2004
-200
5
mm
Evapotranspiración potencial (mm) Evapotranspiración real (mm)
0
200
400
600
800
1.000
1.200
1940
-194
1
1942
-194
3
1944
-194
5
1946
-194
7
1948
-194
9
1950
-195
1
1952
-195
3
1954
-195
5
1956
-195
7
1958
-195
9
1960
-196
1
1962
-196
3
1964
-196
5
1966
-196
7
1968
-196
9
1970
-197
1
1972
-197
3
1974
-197
5
1976
-197
7
1978
-197
9
1980
-198
1
1982
-198
3
1984
-198
5
1986
-198
7
1988
-198
9
1990
-199
1
1992
-199
3
1994
-199
5
1996
-199
7
1998
-199
9
2000
-200
1
2002
-200
3
2004
-200
5
mm
0
3
6
9
12
15
18ºC
Precipitación (mm) Temperatura (ºC)
0,0
0,2
0,4
0,6
0,8
1,0
1,2
1,4
1,6
1940
-194
1
1942
-194
3
1944
-194
5
1946
-194
7
1948
-194
9
1950
-195
1
1952
-195
3
1954
-195
5
1956
-195
7
1958
-195
9
1960
-196
1
1962
-196
3
1964
-196
5
1966
-196
7
1968
-196
9
1970
-197
1
1972
-197
3
1974
-197
5
1976
-197
7
1978
-197
9
1980
-198
1
1982
-198
3
1984
-198
5
1986
-198
7
1988
-198
9
1990
-199
1
1992
-199
3
1994
-199
5
1996
-199
7
1998
-199
9
2000
-200
1
2002
-200
3
2004
-200
5
Índice de aridez
13
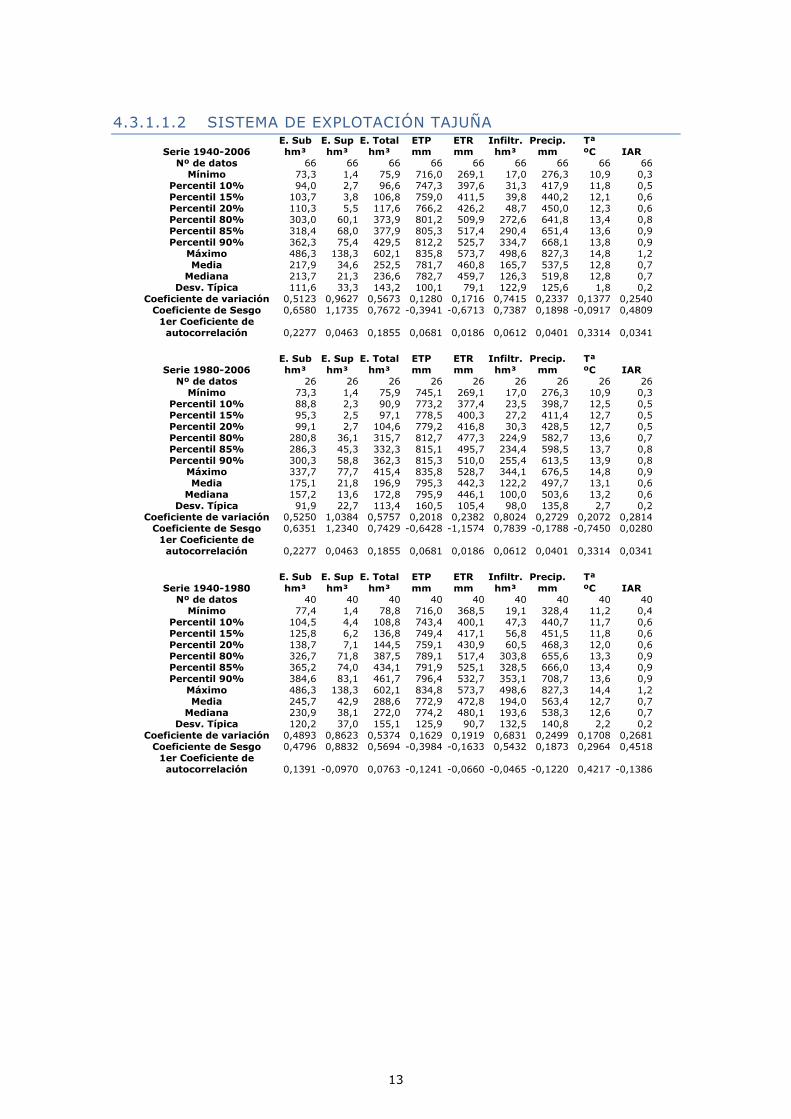
4.3.1.1.2 SISTEMA DE EXPLOTACIÓN TAJUÑA
Serie 1940-2006 E. Sub hm³
E. Sup hm³
E. Total hm³
ETP mm
ETR mm
Infiltr. hm³
Precip. mm
Tª ºC IAR
Nº de datos 66 66 66 66 66 66 66 66 66 Mínimo 73,3 1,4 75,9 716,0 269,1 17,0 276,3 10,9 0,3
Percentil 10% 94,0 2,7 96,6 747,3 397,6 31,3 417,9 11,8 0,5
Percentil 15% 103,7 3,8 106,8 759,0 411,5 39,8 440,2 12,1 0,6 Percentil 20% 110,3 5,5 117,6 766,2 426,2 48,7 450,0 12,3 0,6 Percentil 80% 303,0 60,1 373,9 801,2 509,9 272,6 641,8 13,4 0,8 Percentil 85% 318,4 68,0 377,9 805,3 517,4 290,4 651,4 13,6 0,9 Percentil 90% 362,3 75,4 429,5 812,2 525,7 334,7 668,1 13,8 0,9
Máximo 486,3 138,3 602,1 835,8 573,7 498,6 827,3 14,8 1,2 Media 217,9 34,6 252,5 781,7 460,8 165,7 537,5 12,8 0,7
Mediana 213,7 21,3 236,6 782,7 459,7 126,3 519,8 12,8 0,7 Desv. Típica 111,6 33,3 143,2 100,1 79,1 122,9 125,6 1,8 0,2
Coeficiente de variación 0,5123 0,9627 0,5673 0,1280 0,1716 0,7415 0,2337 0,1377 0,2540 Coeficiente de Sesgo 0,6580 1,1735 0,7672 -0,3941 -0,6713 0,7387 0,1898 -0,0917 0,4809
1er Coeficiente de autocorrelación 0,2277 0,0463 0,1855 0,0681 0,0186 0,0612 0,0401 0,3314 0,0341
Serie 1980-2006 E. Sub hm³
E. Sup hm³
E. Total hm³
ETP mm
ETR mm
Infiltr. hm³
Precip. mm
Tª ºC IAR
Nº de datos 26 26 26 26 26 26 26 26 26 Mínimo 73,3 1,4 75,9 745,1 269,1 17,0 276,3 10,9 0,3
Percentil 10% 88,8 2,3 90,9 773,2 377,4 23,5 398,7 12,5 0,5 Percentil 15% 95,3 2,5 97,1 778,5 400,3 27,2 411,4 12,7 0,5 Percentil 20% 99,1 2,7 104,6 779,2 416,8 30,3 428,5 12,7 0,5 Percentil 80% 280,8 36,1 315,7 812,7 477,3 224,9 582,7 13,6 0,7 Percentil 85% 286,3 45,3 332,3 815,1 495,7 234,4 598,5 13,7 0,8 Percentil 90% 300,3 58,8 362,3 815,3 510,0 255,4 613,5 13,9 0,8
Máximo 337,7 77,7 415,4 835,8 528,7 344,1 676,5 14,8 0,9 Media 175,1 21,8 196,9 795,3 442,3 122,2 497,7 13,1 0,6
Mediana 157,2 13,6 172,8 795,9 446,1 100,0 503,6 13,2 0,6 Desv. Típica 91,9 22,7 113,4 160,5 105,4 98,0 135,8 2,7 0,2
Coeficiente de variación 0,5250 1,0384 0,5757 0,2018 0,2382 0,8024 0,2729 0,2072 0,2814 Coeficiente de Sesgo 0,6351 1,2340 0,7429 -0,6428 -1,1574 0,7839 -0,1788 -0,7450 0,0280
1er Coeficiente de autocorrelación 0,2277 0,0463 0,1855 0,0681 0,0186 0,0612 0,0401 0,3314 0,0341
Serie 1940-1980
E. Sub
hm³
E. Sup
hm³
E. Total
hm³
ETP
mm
ETR
mm
Infiltr.
hm³
Precip.
mm
Tª
ºC IAR Nº de datos 40 40 40 40 40 40 40 40 40
Mínimo 77,4 1,4 78,8 716,0 368,5 19,1 328,4 11,2 0,4 Percentil 10% 104,5 4,4 108,8 743,4 400,1 47,3 440,7 11,7 0,6 Percentil 15% 125,8 6,2 136,8 749,4 417,1 56,8 451,5 11,8 0,6 Percentil 20% 138,7 7,1 144,5 759,1 430,9 60,5 468,3 12,0 0,6 Percentil 80% 326,7 71,8 387,5 789,1 517,4 303,8 655,6 13,3 0,9 Percentil 85% 365,2 74,0 434,1 791,9 525,1 328,5 666,0 13,4 0,9 Percentil 90% 384,6 83,1 461,7 796,4 532,7 353,1 708,7 13,6 0,9
Máximo 486,3 138,3 602,1 834,8 573,7 498,6 827,3 14,4 1,2 Media 245,7 42,9 288,6 772,9 472,8 194,0 563,4 12,7 0,7
Mediana 230,9 38,1 272,0 774,2 480,1 193,6 538,3 12,6 0,7 Desv. Típica 120,2 37,0 155,1 125,9 90,7 132,5 140,8 2,2 0,2
Coeficiente de variación 0,4893 0,8623 0,5374 0,1629 0,1919 0,6831 0,2499 0,1708 0,2681 Coeficiente de Sesgo 0,4796 0,8832 0,5694 -0,3984 -0,1633 0,5432 0,1873 0,2964 0,4518
1er Coeficiente de autocorrelación 0,1391 -0,0970 0,0763 -0,1241 -0,0660 -0,0465 -0,1220 0,4217 -0,1386

14
Sistema de explotación Tajuña
0
100
200
300
400
500
600
700
1940
-194
1
1942
-194
3
1944
-194
5
1946
-194
7
1948
-194
9
1950
-195
1
1952
-195
3
1954
-195
5
1956
-195
7
1958
-195
9
1960
-196
1
1962
-196
3
1964
-196
5
1966
-196
7
1968
-196
9
1970
-197
1
1972
-197
3
1974
-197
5
1976
-197
7
1978
-197
9
1980
-198
1
1982
-198
3
1984
-198
5
1986
-198
7
1988
-198
9
1990
-199
1
1992
-199
3
1994
-199
5
1996
-199
7
1998
-199
9
2000
-200
1
2002
-200
3
2004
-200
5
hm3
Escorrentía Total (hm3) Escorrentía Subterránea (hm
3) Escorrentía Superficial (hm
3) Infiltración (hm
3)
0
100
200300
400
500
600700
800
900
1940
-194
1
1942
-194
3
1944
-194
5
1946
-194
7
1948
-194
9
1950
-195
1
1952
-195
3
1954
-195
5
1956
-195
7
1958
-195
9
1960
-196
1
1962
-196
3
1964
-196
5
1966
-196
7
1968
-196
9
1970
-197
1
1972
-197
3
1974
-197
5
1976
-197
7
1978
-197
9
1980
-198
1
1982
-198
3
1984
-198
5
1986
-198
7
1988
-198
9
1990
-199
1
1992
-199
3
1994
-199
5
1996
-199
7
1998
-199
9
2000
-200
1
2002
-200
3
2004
-200
5
mm
Evapotranspiración potencial (mm) Evapotranspiración real (mm)
0
100
200
300
400
500
600
700
800
900
1940
-194
1
1942
-194
3
1944
-194
5
1946
-194
7
1948
-194
9
1950
-195
1
1952
-195
3
1954
-195
5
1956
-195
7
1958
-195
9
1960
-196
1
1962
-196
3
1964
-196
5
1966
-196
7
1968
-196
9
1970
-197
1
1972
-197
3
1974
-197
5
1976
-197
7
1978
-197
9
1980
-198
1
1982
-198
3
1984
-198
5
1986
-198
7
1988
-198
9
1990
-199
1
1992
-199
3
1994
-199
5
1996
-199
7
1998
-199
9
2000
-200
1
2002
-200
3
2004
-200
5
mm
0
2
4
6
8
10
12
14
16
18ºC
Precipitación (mm) Temperatura (ºC)
0,0
0,2
0,4
0,6
0,8
1,0
1,2
1,4
1940
-194
1
1942
-194
3
1944
-194
5
1946
-194
7
1948
-194
9
1950
-195
1
1952
-195
3
1954
-195
5
1956
-195
7
1958
-195
9
1960
-196
1
1962
-196
3
1964
-196
5
1966
-196
7
1968
-196
9
1970
-197
1
1972
-197
3
1974
-197
5
1976
-197
7
1978
-197
9
1980
-198
1
1982
-198
3
1984
-198
5
1986
-198
7
1988
-198
9
1990
-199
1
1992
-199
3
1994
-199
5
1996
-199
7
1998
-199
9
2000
-200
1
2002
-200
3
2004
-200
5
Índice de aridez

15
4.3.1.1.3 SISTEMA DE EXPLOTACIÓN HENARES
Serie 1940-2006 E. Sub hm³
E. Sup hm³
E. Total hm³
ETP mm
ETR mm
Infiltr. hm³
Precip. mm
Tª ºC IAR
Nº de datos 66 66 66 66 66 66 66 66 66 Mínimo 76,4 91,0 167,5 673,6 283,5 29,9 316,6 10,3 0,4
Percentil 10% 95,4 146,8 252,9 696,7 397,6 40,8 459,7 11,1 0,6
Percentil 15% 108,8 176,3 268,6 703,4 415,8 59,4 473,8 11,1 0,6 Percentil 20% 139,1 203,8 325,6 711,5 422,0 74,1 505,9 11,2 0,7 Percentil 80% 323,9 530,8 803,8 758,8 498,9 302,9 695,1 12,5 0,9 Percentil 85% 340,0 561,9 917,3 765,9 502,1 333,0 716,6 12,5 1,0 Percentil 90% 374,1 627,3 991,1 771,4 515,5 355,2 729,7 12,8 1,0
Máximo 602,2 1.411,3 2.013,5 783,6 562,4 673,3 958,5 13,5 1,3 Media 239,1 385,4 624,5 737,2 453,5 202,2 595,7 11,9 0,8
Mediana 241,7 357,6 580,5 742,7 450,3 179,9 576,7 11,8 0,8 Desv. Típica 125,1 227,9 347,7 95,4 74,9 143,0 143,4 1,6 0,2
Coeficiente de variación 0,5232 0,5911 0,5567 0,1295 0,1651 0,7074 0,2407 0,1372 0,2612 Coeficiente de Sesgo 0,8573 1,7669 1,3775 -0,4974 -0,6242 1,0646 0,4076 0,1873 0,5850
1er Coeficiente de autocorrelación 0,1439 -0,0817 -0,0075 0,3216 0,0300 -0,0420 -0,0514 0,3267 -0,0146
Serie 1980-2006 E. Sub hm³
E. Sup hm³
E. Total hm³
ETP mm
ETR mm
Infiltr. hm³
Precip. mm
Tª ºC IAR
Nº de datos 26 26 26 26 26 26 26 26 26 Mínimo 83,9 110,0 211,9 708,8 283,5 31,7 316,6 11,2 0,4
Percentil 10% 90,4 159,2 252,9 728,2 397,4 37,6 455,6 11,3 0,6 Percentil 15% 93,9 171,3 260,0 734,6 411,2 39,6 471,7 11,6 0,6 Percentil 20% 101,9 177,9 265,9 740,8 416,8 41,2 473,9 11,6 0,6 Percentil 80% 304,8 486,8 795,5 772,1 465,9 276,7 662,0 12,5 0,9 Percentil 85% 308,2 493,0 799,1 773,6 479,6 290,4 668,0 12,7 0,9 Percentil 90% 315,9 528,2 843,3 774,9 491,8 312,7 683,5 12,9 0,9
Máximo 351,5 645,8 997,4 783,6 526,2 348,8 716,2 13,3 1,0 Media 185,2 316,4 501,6 755,4 437,3 150,3 550,4 12,1 0,7
Mediana 159,3 289,0 449,5 758,6 440,4 128,4 535,5 12,1 0,7 Desv. Típica 97,6 166,0 261,3 152,4 100,5 111,3 148,6 2,5 0,2
Coeficiente de variación 0,5270 0,5247 0,5210 0,2017 0,2297 0,7408 0,2700 0,2055 0,2773 Coeficiente de Sesgo 0,6252 0,6422 0,6532 -0,9071 -1,1208 0,6915 -0,0681 0,2210 0,0579
1er Coeficiente de autocorrelación 0,1439 -0,0817 -0,0075 0,3216 0,0300 -0,0420 -0,0514 0,3267 -0,0146
Serie 1940-1980
E. Sub
hm³
E. Sup
hm³
E. Total
hm³
ETP
mm
ETR
mm
Infiltr.
hm³
Precip.
mm
Tª
ºC IAR Nº de datos 40 40 40 40 40 40 40 40 40
Mínimo 76,4 91,0 167,5 673,6 347,3 29,9 355,6 10,3 0,5 Percentil 10% 136,9 143,9 267,4 692,8 406,6 64,8 461,7 11,0 0,6 Percentil 15% 149,7 209,4 367,5 694,6 424,4 77,5 518,5 11,1 0,7 Percentil 20% 155,8 241,8 391,1 700,4 428,8 116,0 522,5 11,1 0,7 Percentil 80% 347,0 561,6 939,9 748,1 501,9 333,4 728,4 12,3 1,0 Percentil 85% 399,0 617,2 989,5 750,9 507,7 360,8 733,1 12,5 1,1 Percentil 90% 455,8 653,4 1.074,0 752,5 520,7 437,2 778,2 12,6 1,1
Máximo 602,2 1.411,3 2.013,5 770,8 562,4 673,3 958,5 13,5 1,3 Media 274,1 430,4 704,5 725,4 464,0 235,9 625,2 11,7 0,9
Mediana 269,9 423,2 719,7 727,7 462,1 215,0 620,4 11,6 0,8 Desv. Típica 134,6 259,1 387,6 118,8 88,0 155,4 162,9 2,0 0,2
Coeficiente de variación 0,4911 0,6020 0,5502 0,1638 0,1896 0,6587 0,2605 0,1714 0,2765 Coeficiente de Sesgo 0,7243 1,6929 1,2957 -0,4134 -0,3429 0,9843 0,3505 0,4856 0,4649
1er Coeficiente de autocorrelación 0,0112 -0,1488 -0,1027 0,1085 -0,1100 -0,1776 -0,2348 0,3163 -0,2258

16
Sistema de explotación Henares
0
500
1.000
1.500
2.000
2.500
1940
-194
1
1942
-194
3
1944
-194
5
1946
-194
7
1948
-194
9
1950
-195
1
1952
-195
3
1954
-195
5
1956
-195
7
1958
-195
9
1960
-196
1
1962
-196
3
1964
-196
5
1966
-196
7
1968
-196
9
1970
-197
1
1972
-197
3
1974
-197
5
1976
-197
7
1978
-197
9
1980
-198
1
1982
-198
3
1984
-198
5
1986
-198
7
1988
-198
9
1990
-199
1
1992
-199
3
1994
-199
5
1996
-199
7
1998
-199
9
2000
-200
1
2002
-200
3
2004
-200
5
hm3
Escorrentía Total (hm3) Escorrentía Subterránea (hm
3) Escorrentía Superficial (hm
3) Infiltración (hm
3)
0
100
200300
400
500
600700
800
900
1940
-194
1
1942
-194
3
1944
-194
5
1946
-194
7
1948
-194
9
1950
-195
1
1952
-195
3
1954
-195
5
1956
-195
7
1958
-195
9
1960
-196
1
1962
-196
3
1964
-196
5
1966
-196
7
1968
-196
9
1970
-197
1
1972
-197
3
1974
-197
5
1976
-197
7
1978
-197
9
1980
-198
1
1982
-198
3
1984
-198
5
1986
-198
7
1988
-198
9
1990
-199
1
1992
-199
3
1994
-199
5
1996
-199
7
1998
-199
9
2000
-200
1
2002
-200
3
2004
-200
5
mm
Evapotranspiración potencial (mm) Evapotranspiración real (mm)
0
200
400
600
800
1.000
1.200
1940
-194
1
1942
-194
3
1944
-194
5
1946
-194
7
1948
-194
9
1950
-195
1
1952
-195
3
1954
-195
5
1956
-195
7
1958
-195
9
1960
-196
1
1962
-196
3
1964
-196
5
1966
-196
7
1968
-196
9
1970
-197
1
1972
-197
3
1974
-197
5
1976
-197
7
1978
-197
9
1980
-198
1
1982
-198
3
1984
-198
5
1986
-198
7
1988
-198
9
1990
-199
1
1992
-199
3
1994
-199
5
1996
-199
7
1998
-199
9
2000
-200
1
2002
-200
3
2004
-200
5
mm
0
3
6
9
12
15
18ºC
Precipitación (mm) Temperatura (ºC)
0,0
0,2
0,4
0,6
0,8
1,0
1,2
1,4
1940
-194
1
1942
-194
3
1944
-194
5
1946
-194
7
1948
-194
9
1950
-195
1
1952
-195
3
1954
-195
5
1956
-195
7
1958
-195
9
1960
-196
1
1962
-196
3
1964
-196
5
1966
-196
7
1968
-196
9
1970
-197
1
1972
-197
3
1974
-197
5
1976
-197
7
1978
-197
9
1980
-198
1
1982
-198
3
1984
-198
5
1986
-198
7
1988
-198
9
1990
-199
1
1992
-199
3
1994
-199
5
1996
-199
7
1998
-199
9
2000
-200
1
2002
-200
3
2004
-200
5
Índice de aridez

17
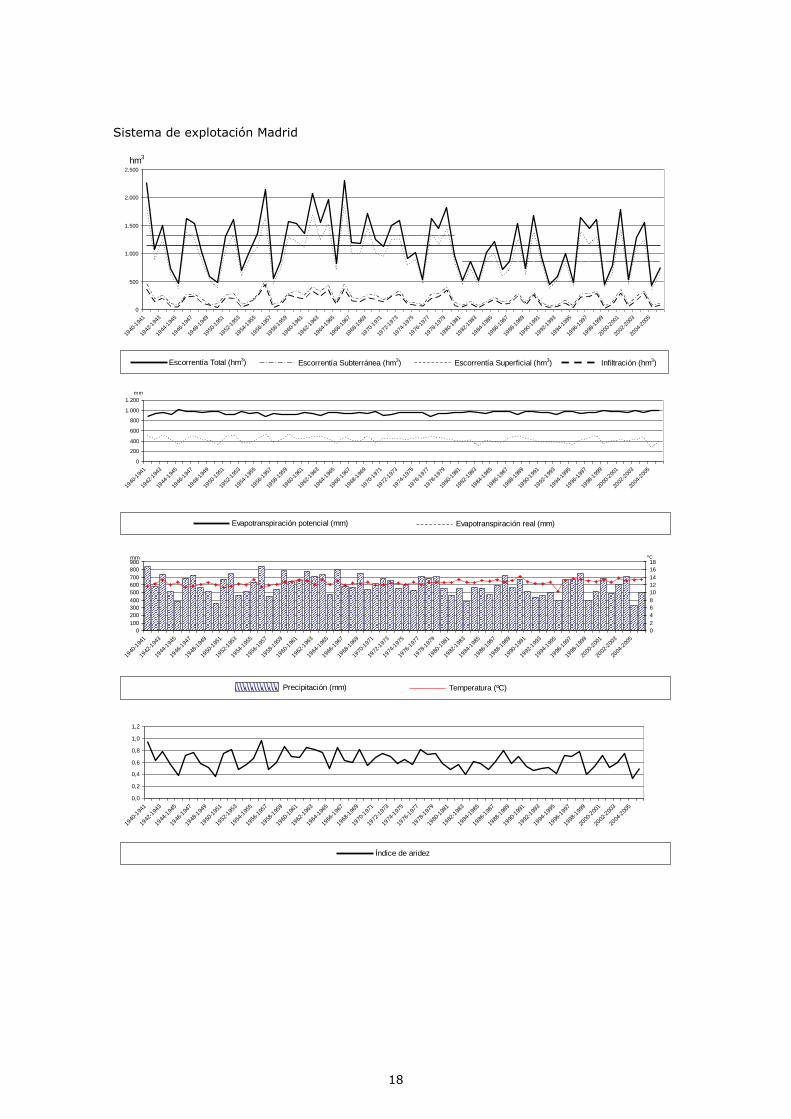
4.3.1.1.4 SISTEMA DE EXPLOTACIÓN MADRID
Serie 1940-2006 E. Sub hm³
E. Sup hm³
E. Total hm³
ETP mm
ETR mm
Infiltr. hm³
Precip. mm
Tª ºC IAR
Nº de datos 66 66 66 66 66 66 66 66 66 Mínimo 59,1 356,6 439,2 872,0 262,4 17,6 323,1 10,3 0,3
Percentil 10% 81,1 441,4 514,0 909,0 350,7 41,2 443,9 11,8 0,5
Percentil 15% 88,1 460,7 551,7 918,6 362,0 50,1 462,4 11,9 0,5 Percentil 20% 96,7 585,7 689,2 924,5 374,1 59,9 486,0 12,0 0,5 Percentil 80% 285,1 1.295,4 1.603,2 966,7 469,9 239,8 707,1 13,2 0,8 Percentil 85% 321,6 1.372,3 1.632,4 972,7 481,6 263,6 729,1 13,3 0,8 Percentil 90% 345,8 1.428,7 1.754,5 980,4 494,8 288,5 742,5 13,4 0,8
Máximo 509,4 1.857,2 2.304,5 1.008,3 532,6 445,2 843,3 14,1 1,0 Media 206,6 964,4 1.171,0 945,8 420,1 159,2 592,5 12,6 0,6
Mediana 187,9 970,5 1.148,6 951,6 417,3 136,0 578,0 12,6 0,6 Desv. Típica 115,8 411,9 522,8 121,0 77,5 105,1 144,5 1,7 0,2
Coeficiente de variación 0,5605 0,4271 0,4465 0,1279 0,1844 0,6601 0,2440 0,1352 0,2632 Coeficiente de Sesgo 0,6387 0,1890 0,2732 -0,4937 -0,3173 0,6081 -0,0441 -0,4352 0,1000
1er Coeficiente de autocorrelación 0,0763 0,0146 0,0296 0,1382 0,0476 0,0174 0,0285 0,2277 0,0562
Serie 1980-2006 E. Sub hm³
E. Sup hm³
E. Total hm³
ETP mm
ETR mm
Infiltr. hm³
Precip. mm
Tª ºC IAR
Nº de datos 26 26 26 26 26 26 26 26 26 Mínimo 59,1 356,6 439,2 908,6 262,4 17,6 323,1 10,3 0,3
Percentil 10% 68,1 407,9 467,4 932,0 332,9 36,2 398,7 12,4 0,4 Percentil 15% 74,9 432,3 505,1 943,4 347,9 40,3 428,8 12,6 0,4 Percentil 20% 80,1 446,4 514,5 949,3 362,4 45,8 461,2 12,6 0,5 Percentil 80% 278,5 1.236,7 1.536,6 972,8 448,6 228,2 663,6 13,4 0,7 Percentil 85% 284,0 1.263,7 1.571,4 981,5 452,8 243,1 670,4 13,4 0,7 Percentil 90% 305,0 1.336,7 1.633,6 987,7 466,7 270,3 693,5 13,6 0,7
Máximo 362,5 1.424,9 1.787,4 1.000,5 501,4 292,2 743,3 14,1 0,8 Media 166,4 810,9 977,3 960,3 397,8 126,3 541,6 12,9 0,6
Mediana 135,2 721,0 864,3 960,6 404,9 98,3 530,2 13,0 0,5 Desv. Típica 101,0 395,7 493,8 193,3 97,4 93,7 157,5 2,7 0,2
Coeficiente de variación 0,6072 0,4880 0,5053 0,2013 0,2449 0,7417 0,2908 0,2071 0,3005 Coeficiente de Sesgo 0,6939 0,4087 0,4616 -0,3074 -0,2970 0,6994 0,0901 -2,0204 0,1771
1er Coeficiente de autocorrelación 0,0763 0,0146 0,0296 0,1382 0,0476 0,0174 0,0285 0,2277 0,0562
Serie 1940-1980
E. Sub
hm³
E. Sup
hm³
E. Total
hm³
ETP
mm
ETR
mm
Infiltr.
hm³
Precip.
mm
Tª
ºC IAR Nº de datos 40 40 40 40 40 40 40 40 40
Mínimo 81,0 375,4 459,5 872,0 312,2 31,3 358,2 11,3 0,4 Percentil 10% 92,1 498,6 581,0 896,9 360,5 50,8 471,9 11,7 0,5 Percentil 15% 98,4 622,1 719,4 908,3 373,6 67,0 513,3 11,9 0,5 Percentil 20% 117,5 724,5 847,8 913,3 399,9 76,2 525,1 11,9 0,6 Percentil 80% 322,8 1.356,7 1.622,3 958,1 481,3 244,5 731,4 12,7 0,8 Percentil 85% 338,7 1.435,5 1.737,1 961,1 490,9 278,6 743,2 12,9 0,8 Percentil 90% 399,1 1.536,3 1.968,6 967,9 502,6 341,7 778,6 13,1 0,8
Máximo 509,4 1.857,2 2.304,5 1.008,3 532,6 445,2 843,3 13,4 1,0 Media 232,8 1.064,1 1.296,9 936,5 434,6 180,6 625,5 12,3 0,7
Mediana 249,7 1.081,0 1.331,1 941,9 437,1 189,6 638,7 12,2 0,7 Desv. Típica 122,6 422,5 539,0 153,0 88,0 110,4 156,9 2,0 0,2
Coeficiente de variación 0,5267 0,3970 0,4156 0,1634 0,2025 0,6112 0,2509 0,1661 0,2669 Coeficiente de Sesgo 0,5213 0,0445 0,1408 -0,2550 -0,3467 0,5025 -0,2005 0,2336 -0,0769
1er Coeficiente de autocorrelación 0,0218 -0,0493 -0,0318 0,0087 -0,1112 -0,0219 -0,1139 -0,0121 -0,0873
18
Sistema de explotación Madrid
0
500
1.000
1.500
2.000
2.500
1940
-194
1
1942
-194
3
1944
-194
5
1946
-194
7
1948
-194
9
1950
-195
1
1952
-195
3
1954
-195
5
1956
-195
7
1958
-195
9
1960
-196
1
1962
-196
3
1964
-196
5
1966
-196
7
1968
-196
9
1970
-197
1
1972
-197
3
1974
-197
5
1976
-197
7
1978
-197
9
1980
-198
1
1982
-198
3
1984
-198
5
1986
-198
7
1988
-198
9
1990
-199
1
1992
-199
3
1994
-199
5
1996
-199
7
1998
-199
9
2000
-200
1
2002
-200
3
2004
-200
5
hm3
Escorrentía Total (hm3) Escorrentía Subterránea (hm
3) Escorrentía Superficial (hm
3) Infiltración (hm
3)
0
200
400
600
800
1.000
1.200
1940
-194
1
1942
-194
3
1944
-194
5
1946
-194
7
1948
-194
9
1950
-195
1
1952
-195
3
1954
-195
5
1956
-195
7
1958
-195
9
1960
-196
1
1962
-196
3
1964
-196
5
1966
-196
7
1968
-196
9
1970
-197
1
1972
-197
3
1974
-197
5
1976
-197
7
1978
-197
9
1980
-198
1
1982
-198
3
1984
-198
5
1986
-198
7
1988
-198
9
1990
-199
1
1992
-199
3
1994
-199
5
1996
-199
7
1998
-199
9
2000
-200
1
2002
-200
3
2004
-200
5
mm
Evapotranspiración potencial (mm) Evapotranspiración real (mm)
0
100
200
300
400
500
600
700
800
900
1940
-194
1
1942
-194
3
1944
-194
5
1946
-194
7
1948
-194
9
1950
-195
1
1952
-195
3
1954
-195
5
1956
-195
7
1958
-195
9
1960
-196
1
1962
-196
3
1964
-196
5
1966
-196
7
1968
-196
9
1970
-197
1
1972
-197
3
1974
-197
5
1976
-197
7
1978
-197
9
1980
-198
1
1982
-198
3
1984
-198
5
1986
-198
7
1988
-198
9
1990
-199
1
1992
-199
3
1994
-199
5
1996
-199
7
1998
-199
9
2000
-200
1
2002
-200
3
2004
-200
5
mm
0
2
4
6
8
10
12
14
16
18ºC
Precipitación (mm) Temperatura (ºC)
0,0
0,2
0,4
0,6
0,8
1,0
1,2
1940
-194
1
1942
-194
3
1944
-194
5
1946
-194
7
1948
-194
9
1950
-195
1
1952
-195
3
1954
-195
5
1956
-195
7
1958
-195
9
1960
-196
1
1962
-196
3
1964
-196
5
1966
-196
7
1968
-196
9
1970
-197
1
1972
-197
3
1974
-197
5
1976
-197
7
1978
-197
9
1980
-198
1
1982
-198
3
1984
-198
5
1986
-198
7
1988
-198
9
1990
-199
1
1992
-199
3
1994
-199
5
1996
-199
7
1998
-199
9
2000
-200
1
2002
-200
3
2004
-200
5
Índice de aridez
19
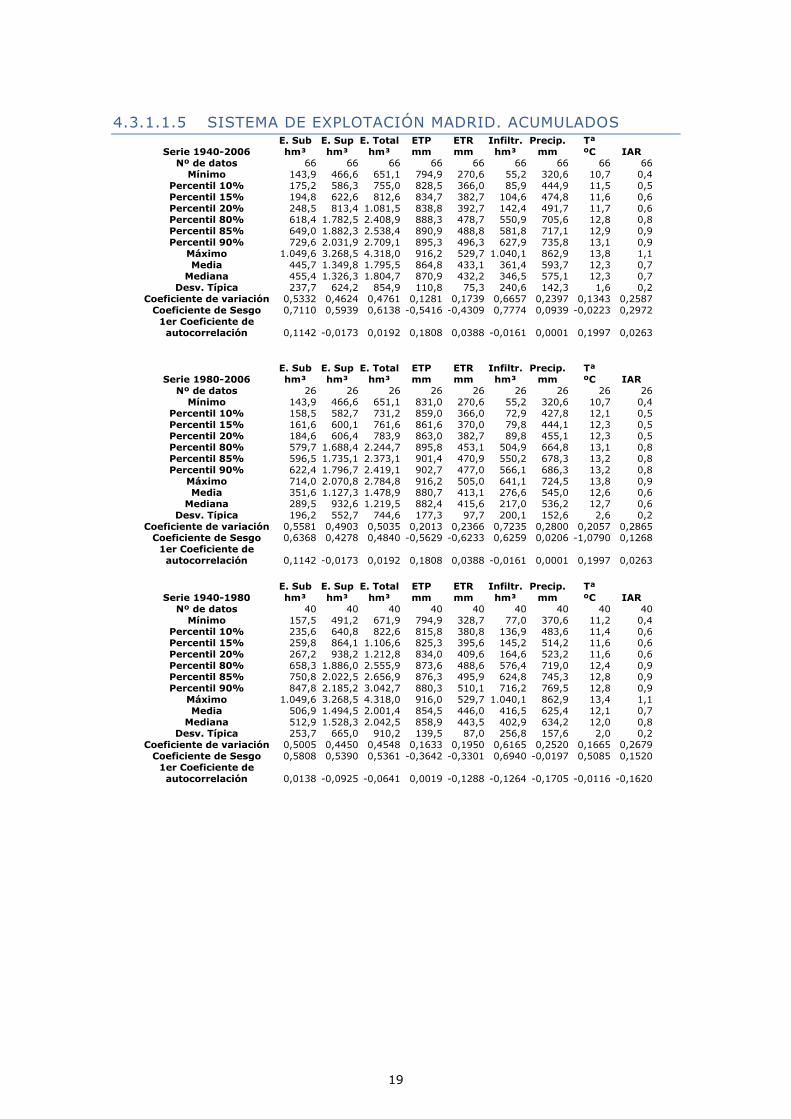
4.3.1.1.5 SISTEMA DE EXPLOTACIÓN MADRID. ACUMULADOS
Serie 1940-2006 E. Sub hm³
E. Sup hm³
E. Total hm³
ETP mm
ETR mm
Infiltr. hm³
Precip. mm
Tª ºC IAR
Nº de datos 66 66 66 66 66 66 66 66 66 Mínimo 143,9 466,6 651,1 794,9 270,6 55,2 320,6 10,7 0,4
Percentil 10% 175,2 586,3 755,0 828,5 366,0 85,9 444,9 11,5 0,5
Percentil 15% 194,8 622,6 812,6 834,7 382,7 104,6 474,8 11,6 0,6 Percentil 20% 248,5 813,4 1.081,5 838,8 392,7 142,4 491,7 11,7 0,6 Percentil 80% 618,4 1.782,5 2.408,9 888,3 478,7 550,9 705,6 12,8 0,8 Percentil 85% 649,0 1.882,3 2.538,4 890,9 488,8 581,8 717,1 12,9 0,9 Percentil 90% 729,6 2.031,9 2.709,1 895,3 496,3 627,9 735,8 13,1 0,9
Máximo 1.049,6 3.268,5 4.318,0 916,2 529,7 1.040,1 862,9 13,8 1,1 Media 445,7 1.349,8 1.795,5 864,8 433,1 361,4 593,7 12,3 0,7
Mediana 455,4 1.326,3 1.804,7 870,9 432,2 346,5 575,1 12,3 0,7 Desv. Típica 237,7 624,2 854,9 110,8 75,3 240,6 142,3 1,6 0,2
Coeficiente de variación 0,5332 0,4624 0,4761 0,1281 0,1739 0,6657 0,2397 0,1343 0,2587 Coeficiente de Sesgo 0,7110 0,5939 0,6138 -0,5416 -0,4309 0,7774 0,0939 -0,0223 0,2972
1er Coeficiente de autocorrelación 0,1142 -0,0173 0,0192 0,1808 0,0388 -0,0161 0,0001 0,1997 0,0263
Serie 1980-2006 E. Sub hm³
E. Sup hm³
E. Total hm³
ETP mm
ETR mm
Infiltr. hm³
Precip. mm
Tª ºC IAR
Nº de datos 26 26 26 26 26 26 26 26 26 Mínimo 143,9 466,6 651,1 831,0 270,6 55,2 320,6 10,7 0,4
Percentil 10% 158,5 582,7 731,2 859,0 366,0 72,9 427,8 12,1 0,5 Percentil 15% 161,6 600,1 761,6 861,6 370,0 79,8 444,1 12,3 0,5 Percentil 20% 184,6 606,4 783,9 863,0 382,7 89,8 455,1 12,3 0,5 Percentil 80% 579,7 1.688,4 2.244,7 895,8 453,1 504,9 664,8 13,1 0,8 Percentil 85% 596,5 1.735,1 2.373,1 901,4 470,9 550,2 678,3 13,2 0,8 Percentil 90% 622,4 1.796,7 2.419,1 902,7 477,0 566,1 686,3 13,2 0,8
Máximo 714,0 2.070,8 2.784,8 916,2 505,0 641,1 724,5 13,8 0,9 Media 351,6 1.127,3 1.478,9 880,7 413,1 276,6 545,0 12,6 0,6
Mediana 289,5 932,6 1.219,5 882,4 415,6 217,0 536,2 12,7 0,6 Desv. Típica 196,2 552,7 744,6 177,3 97,7 200,1 152,6 2,6 0,2
Coeficiente de variación 0,5581 0,4903 0,5035 0,2013 0,2366 0,7235 0,2800 0,2057 0,2865 Coeficiente de Sesgo 0,6368 0,4278 0,4840 -0,5629 -0,6233 0,6259 0,0206 -1,0790 0,1268
1er Coeficiente de autocorrelación 0,1142 -0,0173 0,0192 0,1808 0,0388 -0,0161 0,0001 0,1997 0,0263
Serie 1940-1980
E. Sub
hm³
E. Sup
hm³
E. Total
hm³
ETP
mm
ETR
mm
Infiltr.
hm³
Precip.
mm
Tª
ºC IAR Nº de datos 40 40 40 40 40 40 40 40 40
Mínimo 157,5 491,2 671,9 794,9 328,7 77,0 370,6 11,2 0,4 Percentil 10% 235,6 640,8 822,6 815,8 380,8 136,9 483,6 11,4 0,6 Percentil 15% 259,8 864,1 1.106,6 825,3 395,6 145,2 514,2 11,6 0,6 Percentil 20% 267,2 938,2 1.212,8 834,0 409,6 164,6 523,2 11,6 0,6 Percentil 80% 658,3 1.886,0 2.555,9 873,6 488,6 576,4 719,0 12,4 0,9 Percentil 85% 750,8 2.022,5 2.656,9 876,3 495,9 624,8 745,3 12,8 0,9 Percentil 90% 847,8 2.185,2 3.042,7 880,3 510,1 716,2 769,5 12,8 0,9
Máximo 1.049,6 3.268,5 4.318,0 916,0 529,7 1.040,1 862,9 13,4 1,1 Media 506,9 1.494,5 2.001,4 854,5 446,0 416,5 625,4 12,1 0,7
Mediana 512,9 1.528,3 2.042,5 858,9 443,5 402,9 634,2 12,0 0,8 Desv. Típica 253,7 665,0 910,2 139,5 87,0 256,8 157,6 2,0 0,2
Coeficiente de variación 0,5005 0,4450 0,4548 0,1633 0,1950 0,6165 0,2520 0,1665 0,2679 Coeficiente de Sesgo 0,5808 0,5390 0,5361 -0,3642 -0,3301 0,6940 -0,0197 0,5085 0,1520
1er Coeficiente de autocorrelación 0,0138 -0,0925 -0,0641 0,0019 -0,1288 -0,1264 -0,1705 -0,0116 -0,1620

20
Sistema de explotación Madrid. Acumulados
0
500
1.000
1.500
2.000
2.500
3.000
3.500
4.000
4.500
5.000
1940
-194
1
1942
-194
3
1944
-194
5
1946
-194
7
1948
-194
9
1950
-195
1
1952
-195
3
1954
-195
5
1956
-195
7
1958
-195
9
1960
-196
1
1962
-196
3
1964
-196
5
1966
-196
7
1968
-196
9
1970
-197
1
1972
-197
3
1974
-197
5
1976
-197
7
1978
-197
9
1980
-198
1
1982
-198
3
1984
-198
5
1986
-198
7
1988
-198
9
1990
-199
1
1992
-199
3
1994
-199
5
1996
-199
7
1998
-199
9
2000
-200
1
2002
-200
3
2004
-200
5
hm3
Escorrentía Total (hm3) Escorrentía Subterránea (hm
3) Escorrentía Superficial (hm
3) Infiltración (hm
3)
0100200300400500600700800900
1.000
1940
-194
1
1942
-194
3
1944
-194
5
1946
-194
7
1948
-194
9
1950
-195
1
1952
-195
3
1954
-195
5
1956
-195
7
1958
-195
9
1960
-196
1
1962
-196
3
1964
-196
5
1966
-196
7
1968
-196
9
1970
-197
1
1972
-197
3
1974
-197
5
1976
-197
7
1978
-197
9
1980
-198
1
1982
-198
3
1984
-198
5
1986
-198
7
1988
-198
9
1990
-199
1
1992
-199
3
1994
-199
5
1996
-199
7
1998
-199
9
2000
-200
1
2002
-200
3
2004
-200
5
mm
Evapotranspiración potencial (mm) Evapotranspiración real (mm)
0
100200
300400
500
600700
800900
1.000
1940
-194
1
1942
-194
3
1944
-194
5
1946
-194
7
1948
-194
9
1950
-195
1
1952
-195
3
1954
-195
5
1956
-195
7
1958
-195
9
1960
-196
1
1962
-196
3
1964
-196
5
1966
-196
7
1968
-196
9
1970
-197
1
1972
-197
3
1974
-197
5
1976
-197
7
1978
-197
9
1980
-198
1
1982
-198
3
1984
-198
5
1986
-198
7
1988
-198
9
1990
-199
1
1992
-199
3
1994
-199
5
1996
-199
7
1998
-199
9
2000
-200
1
2002
-200
3
2004
-200
5
mm
0
4
8
12
16
20ºC
Precipitación (mm) Temperatura (ºC)
0,0
0,2
0,4
0,6
0,8
1,0
1,2
1940
-194
1
1942
-194
3
1944
-194
5
1946
-194
7
1948
-194
9
1950
-195
1
1952
-195
3
1954
-195
5
1956
-195
7
1958
-195
9
1960
-196
1
1962
-196
3
1964
-196
5
1966
-196
7
1968
-196
9
1970
-197
1
1972
-197
3
1974
-197
5
1976
-197
7
1978
-197
9
1980
-198
1
1982
-198
3
1984
-198
5
1986
-198
7
1988
-198
9
1990
-199
1
1992
-199
3
1994
-199
5
1996
-199
7
1998
-199
9
2000
-200
1
2002
-200
3
2004
-200
5
Índice de aridez
21
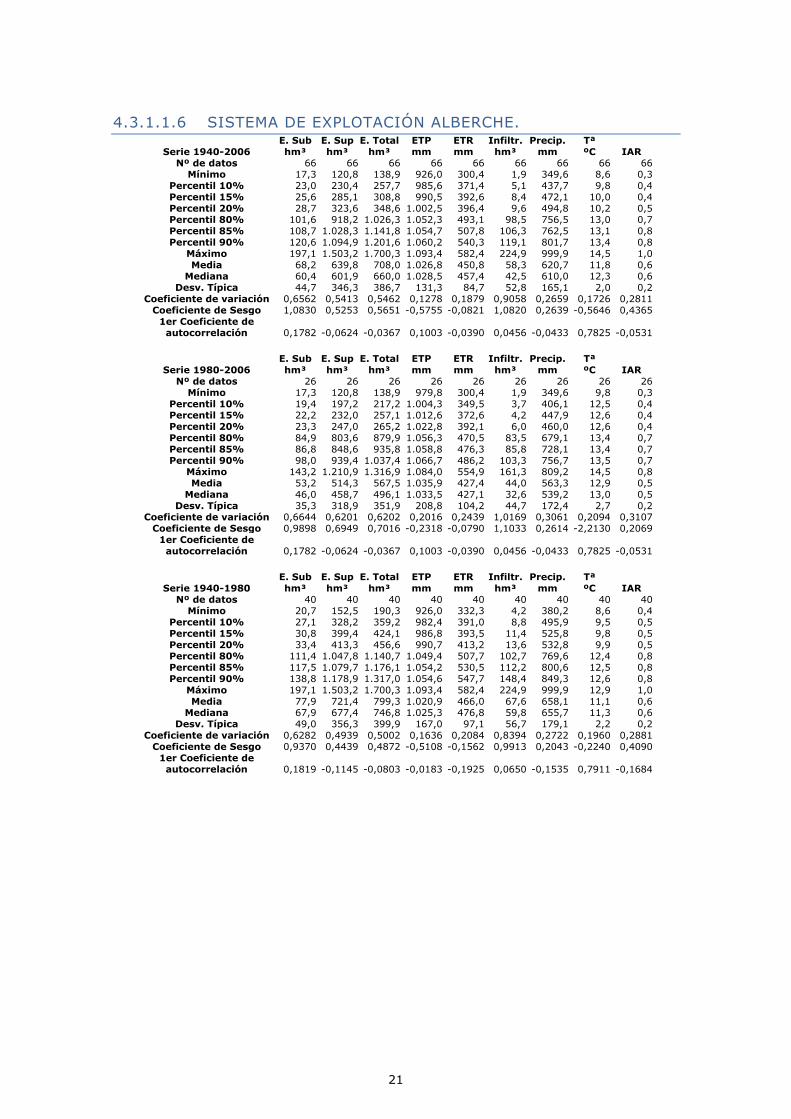
4.3.1.1.6 SISTEMA DE EXPLOTACIÓN ALBERCHE.
Serie 1940-2006 E. Sub hm³
E. Sup hm³
E. Total hm³
ETP mm
ETR mm
Infiltr. hm³
Precip. mm
Tª ºC IAR
Nº de datos 66 66 66 66 66 66 66 66 66 Mínimo 17,3 120,8 138,9 926,0 300,4 1,9 349,6 8,6 0,3
Percentil 10% 23,0 230,4 257,7 985,6 371,4 5,1 437,7 9,8 0,4
Percentil 15% 25,6 285,1 308,8 990,5 392,6 8,4 472,1 10,0 0,4 Percentil 20% 28,7 323,6 348,6 1.002,5 396,4 9,6 494,8 10,2 0,5 Percentil 80% 101,6 918,2 1.026,3 1.052,3 493,1 98,5 756,5 13,0 0,7 Percentil 85% 108,7 1.028,3 1.141,8 1.054,7 507,8 106,3 762,5 13,1 0,8 Percentil 90% 120,6 1.094,9 1.201,6 1.060,2 540,3 119,1 801,7 13,4 0,8
Máximo 197,1 1.503,2 1.700,3 1.093,4 582,4 224,9 999,9 14,5 1,0 Media 68,2 639,8 708,0 1.026,8 450,8 58,3 620,7 11,8 0,6
Mediana 60,4 601,9 660,0 1.028,5 457,4 42,5 610,0 12,3 0,6 Desv. Típica 44,7 346,3 386,7 131,3 84,7 52,8 165,1 2,0 0,2
Coeficiente de variación 0,6562 0,5413 0,5462 0,1278 0,1879 0,9058 0,2659 0,1726 0,2811 Coeficiente de Sesgo 1,0830 0,5253 0,5651 -0,5755 -0,0821 1,0820 0,2639 -0,5646 0,4365
1er Coeficiente de autocorrelación 0,1782 -0,0624 -0,0367 0,1003 -0,0390 0,0456 -0,0433 0,7825 -0,0531
Serie 1980-2006 E. Sub hm³
E. Sup hm³
E. Total hm³
ETP mm
ETR mm
Infiltr. hm³
Precip. mm
Tª ºC IAR
Nº de datos 26 26 26 26 26 26 26 26 26 Mínimo 17,3 120,8 138,9 979,8 300,4 1,9 349,6 9,8 0,3
Percentil 10% 19,4 197,2 217,2 1.004,3 349,5 3,7 406,1 12,5 0,4 Percentil 15% 22,2 232,0 257,1 1.012,6 372,6 4,2 447,9 12,6 0,4 Percentil 20% 23,3 247,0 265,2 1.022,8 392,1 6,0 460,0 12,6 0,4 Percentil 80% 84,9 803,6 879,9 1.056,3 470,5 83,5 679,1 13,4 0,7 Percentil 85% 86,8 848,6 935,8 1.058,8 476,3 85,8 728,1 13,4 0,7 Percentil 90% 98,0 939,4 1.037,4 1.066,7 486,2 103,3 756,7 13,5 0,7
Máximo 143,2 1.210,9 1.316,9 1.084,0 554,9 161,3 809,2 14,5 0,8 Media 53,2 514,3 567,5 1.035,9 427,4 44,0 563,3 12,9 0,5
Mediana 46,0 458,7 496,1 1.033,5 427,1 32,6 539,2 13,0 0,5 Desv. Típica 35,3 318,9 351,9 208,8 104,2 44,7 172,4 2,7 0,2
Coeficiente de variación 0,6644 0,6201 0,6202 0,2016 0,2439 1,0169 0,3061 0,2094 0,3107 Coeficiente de Sesgo 0,9898 0,6949 0,7016 -0,2318 -0,0790 1,1033 0,2614 -2,2130 0,2069
1er Coeficiente de autocorrelación 0,1782 -0,0624 -0,0367 0,1003 -0,0390 0,0456 -0,0433 0,7825 -0,0531
Serie 1940-1980
E. Sub
hm³
E. Sup
hm³
E. Total
hm³
ETP
mm
ETR
mm
Infiltr.
hm³
Precip.
mm
Tª
ºC IAR Nº de datos 40 40 40 40 40 40 40 40 40
Mínimo 20,7 152,5 190,3 926,0 332,3 4,2 380,2 8,6 0,4 Percentil 10% 27,1 328,2 359,2 982,4 391,0 8,8 495,9 9,5 0,5 Percentil 15% 30,8 399,4 424,1 986,8 393,5 11,4 525,8 9,8 0,5 Percentil 20% 33,4 413,3 456,6 990,7 413,2 13,6 532,8 9,9 0,5 Percentil 80% 111,4 1.047,8 1.140,7 1.049,4 507,7 102,7 769,6 12,4 0,8 Percentil 85% 117,5 1.079,7 1.176,1 1.054,2 530,5 112,2 800,6 12,5 0,8 Percentil 90% 138,8 1.178,9 1.317,0 1.054,6 547,7 148,4 849,3 12,6 0,8
Máximo 197,1 1.503,2 1.700,3 1.093,4 582,4 224,9 999,9 12,9 1,0 Media 77,9 721,4 799,3 1.020,9 466,0 67,6 658,1 11,1 0,6
Mediana 67,9 677,4 746,8 1.025,3 476,8 59,8 655,7 11,3 0,6 Desv. Típica 49,0 356,3 399,9 167,0 97,1 56,7 179,1 2,2 0,2
Coeficiente de variación 0,6282 0,4939 0,5002 0,1636 0,2084 0,8394 0,2722 0,1960 0,2881 Coeficiente de Sesgo 0,9370 0,4439 0,4872 -0,5108 -0,1562 0,9913 0,2043 -0,2240 0,4090
1er Coeficiente de autocorrelación 0,1819 -0,1145 -0,0803 -0,0183 -0,1925 0,0650 -0,1535 0,7911 -0,1684

22
Sistema de explotación Alberche
0
200
400
600
800
1.000
1.200
1.400
1.600
1.800
1940
-194
1
1942
-194
3
1944
-194
5
1946
-194
7
1948
-194
9
1950
-195
1
1952
-195
3
1954
-195
5
1956
-195
7
1958
-195
9
1960
-196
1
1962
-196
3
1964
-196
5
1966
-196
7
1968
-196
9
1970
-197
1
1972
-197
3
1974
-197
5
1976
-197
7
1978
-197
9
1980
-198
1
1982
-198
3
1984
-198
5
1986
-198
7
1988
-198
9
1990
-199
1
1992
-199
3
1994
-199
5
1996
-199
7
1998
-199
9
2000
-200
1
2002
-200
3
2004
-200
5
hm3
Escorrentía Total (hm3) Escorrentía Subterránea (hm
3) Escorrentía Superficial (hm
3) Infiltración (hm
3)
0
200
400
600
800
1.000
1.200
1940
-194
1
1942
-194
3
1944
-194
5
1946
-194
7
1948
-194
9
1950
-195
1
1952
-195
3
1954
-195
5
1956
-195
7
1958
-195
9
1960
-196
1
1962
-196
3
1964
-196
5
1966
-196
7
1968
-196
9
1970
-197
1
1972
-197
3
1974
-197
5
1976
-197
7
1978
-197
9
1980
-198
1
1982
-198
3
1984
-198
5
1986
-198
7
1988
-198
9
1990
-199
1
1992
-199
3
1994
-199
5
1996
-199
7
1998
-199
9
2000
-200
1
2002
-200
3
2004
-200
5
mm
Evapotranspiración potencial (mm) Evapotranspiración real (mm)
0
200
400
600
800
1.000
1.200
1940
-194
1
1942
-194
3
1944
-194
5
1946
-194
7
1948
-194
9
1950
-195
1
1952
-195
3
1954
-195
5
1956
-195
7
1958
-195
9
1960
-196
1
1962
-196
3
1964
-196
5
1966
-196
7
1968
-196
9
1970
-197
1
1972
-197
3
1974
-197
5
1976
-197
7
1978
-197
9
1980
-198
1
1982
-198
3
1984
-198
5
1986
-198
7
1988
-198
9
1990
-199
1
1992
-199
3
1994
-199
5
1996
-199
7
1998
-199
9
2000
-200
1
2002
-200
3
2004
-200
5
mm
0
4
8
12
16
20
24ºC
Precipitación (mm) Temperatura (ºC)
0,0
0,2
0,4
0,6
0,8
1,0
1,2
1940
-194
1
1942
-194
3
1944
-194
5
1946
-194
7
1948
-194
9
1950
-195
1
1952
-195
3
1954
-195
5
1956
-195
7
1958
-195
9
1960
-196
1
1962
-196
3
1964
-196
5
1966
-196
7
1968
-196
9
1970
-197
1
1972
-197
3
1974
-197
5
1976
-197
7
1978
-197
9
1980
-198
1
1982
-198
3
1984
-198
5
1986
-198
7
1988
-198
9
1990
-199
1
1992
-199
3
1994
-199
5
1996
-199
7
1998
-199
9
2000
-200
1
2002
-200
3
2004
-200
5
Índice de aridez
23
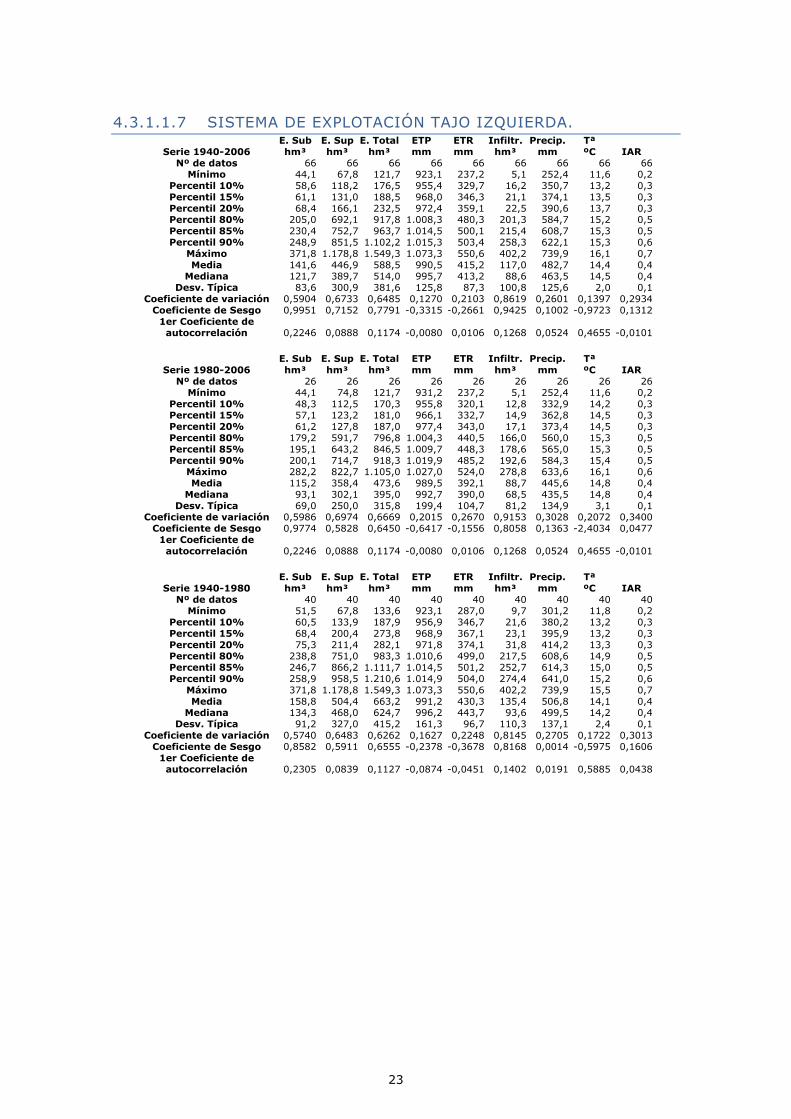
4.3.1.1.7 SISTEMA DE EXPLOTACIÓN TAJO IZQUIERDA.
Serie 1940-2006 E. Sub hm³
E. Sup hm³
E. Total hm³
ETP mm
ETR mm
Infiltr. hm³
Precip. mm
Tª ºC IAR
Nº de datos 66 66 66 66 66 66 66 66 66 Mínimo 44,1 67,8 121,7 923,1 237,2 5,1 252,4 11,6 0,2
Percentil 10% 58,6 118,2 176,5 955,4 329,7 16,2 350,7 13,2 0,3
Percentil 15% 61,1 131,0 188,5 968,0 346,3 21,1 374,1 13,5 0,3 Percentil 20% 68,4 166,1 232,5 972,4 359,1 22,5 390,6 13,7 0,3 Percentil 80% 205,0 692,1 917,8 1.008,3 480,3 201,3 584,7 15,2 0,5 Percentil 85% 230,4 752,7 963,7 1.014,5 500,1 215,4 608,7 15,3 0,5 Percentil 90% 248,9 851,5 1.102,2 1.015,3 503,4 258,3 622,1 15,3 0,6
Máximo 371,8 1.178,8 1.549,3 1.073,3 550,6 402,2 739,9 16,1 0,7 Media 141,6 446,9 588,5 990,5 415,2 117,0 482,7 14,4 0,4
Mediana 121,7 389,7 514,0 995,7 413,2 88,6 463,5 14,5 0,4 Desv. Típica 83,6 300,9 381,6 125,8 87,3 100,8 125,6 2,0 0,1
Coeficiente de variación 0,5904 0,6733 0,6485 0,1270 0,2103 0,8619 0,2601 0,1397 0,2934 Coeficiente de Sesgo 0,9951 0,7152 0,7791 -0,3315 -0,2661 0,9425 0,1002 -0,9723 0,1312
1er Coeficiente de autocorrelación 0,2246 0,0888 0,1174 -0,0080 0,0106 0,1268 0,0524 0,4655 -0,0101
Serie 1980-2006 E. Sub hm³
E. Sup hm³
E. Total hm³
ETP mm
ETR mm
Infiltr. hm³
Precip. mm
Tª ºC IAR
Nº de datos 26 26 26 26 26 26 26 26 26 Mínimo 44,1 74,8 121,7 931,2 237,2 5,1 252,4 11,6 0,2
Percentil 10% 48,3 112,5 170,3 955,8 320,1 12,8 332,9 14,2 0,3 Percentil 15% 57,1 123,2 181,0 966,1 332,7 14,9 362,8 14,5 0,3 Percentil 20% 61,2 127,8 187,0 977,4 343,0 17,1 373,4 14,5 0,3 Percentil 80% 179,2 591,7 796,8 1.004,3 440,5 166,0 560,0 15,3 0,5 Percentil 85% 195,1 643,2 846,5 1.009,7 448,3 178,6 565,0 15,3 0,5 Percentil 90% 200,1 714,7 918,3 1.019,9 485,2 192,6 584,3 15,4 0,5
Máximo 282,2 822,7 1.105,0 1.027,0 524,0 278,8 633,6 16,1 0,6 Media 115,2 358,4 473,6 989,5 392,1 88,7 445,6 14,8 0,4
Mediana 93,1 302,1 395,0 992,7 390,0 68,5 435,5 14,8 0,4 Desv. Típica 69,0 250,0 315,8 199,4 104,7 81,2 134,9 3,1 0,1
Coeficiente de variación 0,5986 0,6974 0,6669 0,2015 0,2670 0,9153 0,3028 0,2072 0,3400 Coeficiente de Sesgo 0,9774 0,5828 0,6450 -0,6417 -0,1556 0,8058 0,1363 -2,4034 0,0477
1er Coeficiente de autocorrelación 0,2246 0,0888 0,1174 -0,0080 0,0106 0,1268 0,0524 0,4655 -0,0101
Serie 1940-1980
E. Sub
hm³
E. Sup
hm³
E. Total
hm³
ETP
mm
ETR
mm
Infiltr.
hm³
Precip.
mm
Tª
ºC IAR Nº de datos 40 40 40 40 40 40 40 40 40
Mínimo 51,5 67,8 133,6 923,1 287,0 9,7 301,2 11,8 0,2 Percentil 10% 60,5 133,9 187,9 956,9 346,7 21,6 380,2 13,2 0,3 Percentil 15% 68,4 200,4 273,8 968,9 367,1 23,1 395,9 13,2 0,3 Percentil 20% 75,3 211,4 282,1 971,8 374,1 31,8 414,2 13,3 0,3 Percentil 80% 238,8 751,0 983,3 1.010,6 499,0 217,5 608,6 14,9 0,5 Percentil 85% 246,7 866,2 1.111,7 1.014,5 501,2 252,7 614,3 15,0 0,5 Percentil 90% 258,9 958,5 1.210,6 1.014,9 504,0 274,4 641,0 15,2 0,6
Máximo 371,8 1.178,8 1.549,3 1.073,3 550,6 402,2 739,9 15,5 0,7 Media 158,8 504,4 663,2 991,2 430,3 135,4 506,8 14,1 0,4
Mediana 134,3 468,0 624,7 996,2 443,7 93,6 499,5 14,2 0,4 Desv. Típica 91,2 327,0 415,2 161,3 96,7 110,3 137,1 2,4 0,1
Coeficiente de variación 0,5740 0,6483 0,6262 0,1627 0,2248 0,8145 0,2705 0,1722 0,3013 Coeficiente de Sesgo 0,8582 0,5911 0,6555 -0,2378 -0,3678 0,8168 0,0014 -0,5975 0,1606
1er Coeficiente de autocorrelación 0,2305 0,0839 0,1127 -0,0874 -0,0451 0,1402 0,0191 0,5885 0,0438

24
Sistema de explotación Tajo Izquierda
0
200
400
600
800
1.000
1.200
1.400
1.600
1.800
1940
-194
1
1942
-194
3
1944
-194
5
1946
-194
7
1948
-194
9
1950
-195
1
1952
-195
3
1954
-195
5
1956
-195
7
1958
-195
9
1960
-196
1
1962
-196
3
1964
-196
5
1966
-196
7
1968
-196
9
1970
-197
1
1972
-197
3
1974
-197
5
1976
-197
7
1978
-197
9
1980
-198
1
1982
-198
3
1984
-198
5
1986
-198
7
1988
-198
9
1990
-199
1
1992
-199
3
1994
-199
5
1996
-199
7
1998
-199
9
2000
-200
1
2002
-200
3
2004
-200
5
hm3
Escorrentía Total (hm3) Escorrentía Subterránea (hm
3) Escorrentía Superficial (hm
3) Infiltración (hm
3)
0
200
400
600
800
1.000
1.200
1940
-194
1
1942
-194
3
1944
-194
5
1946
-194
7
1948
-194
9
1950
-195
1
1952
-195
3
1954
-195
5
1956
-195
7
1958
-195
9
1960
-196
1
1962
-196
3
1964
-196
5
1966
-196
7
1968
-196
9
1970
-197
1
1972
-197
3
1974
-197
5
1976
-197
7
1978
-197
9
1980
-198
1
1982
-198
3
1984
-198
5
1986
-198
7
1988
-198
9
1990
-199
1
1992
-199
3
1994
-199
5
1996
-199
7
1998
-199
9
2000
-200
1
2002
-200
3
2004
-200
5
mm
Evapotranspiración potencial (mm) Evapotranspiración real (mm)
0
100
200
300
400
500
600
700
800
1940
-194
1
1942
-194
3
1944
-194
5
1946
-194
7
1948
-194
9
1950
-195
1
1952
-195
3
1954
-195
5
1956
-195
7
1958
-195
9
1960
-196
1
1962
-196
3
1964
-196
5
1966
-196
7
1968
-196
9
1970
-197
1
1972
-197
3
1974
-197
5
1976
-197
7
1978
-197
9
1980
-198
1
1982
-198
3
1984
-198
5
1986
-198
7
1988
-198
9
1990
-199
1
1992
-199
3
1994
-199
5
1996
-199
7
1998
-199
9
2000
-200
1
2002
-200
3
2004
-200
5
mm
0
3
6
9
12
15
18
21
24ºC
Precipitación (mm) Temperatura (ºC)
0,0
0,1
0,2
0,3
0,4
0,5
0,6
0,7
0,8
1940
-194
1
1942
-194
3
1944
-194
5
1946
-194
7
1948
-194
9
1950
-195
1
1952
-195
3
1954
-195
5
1956
-195
7
1958
-195
9
1960
-196
1
1962
-196
3
1964
-196
5
1966
-196
7
1968
-196
9
1970
-197
1
1972
-197
3
1974
-197
5
1976
-197
7
1978
-197
9
1980
-198
1
1982
-198
3
1984
-198
5
1986
-198
7
1988
-198
9
1990
-199
1
1992
-199
3
1994
-199
5
1996
-199
7
1998
-199
9
2000
-200
1
2002
-200
3
2004
-200
5
Índice de aridez
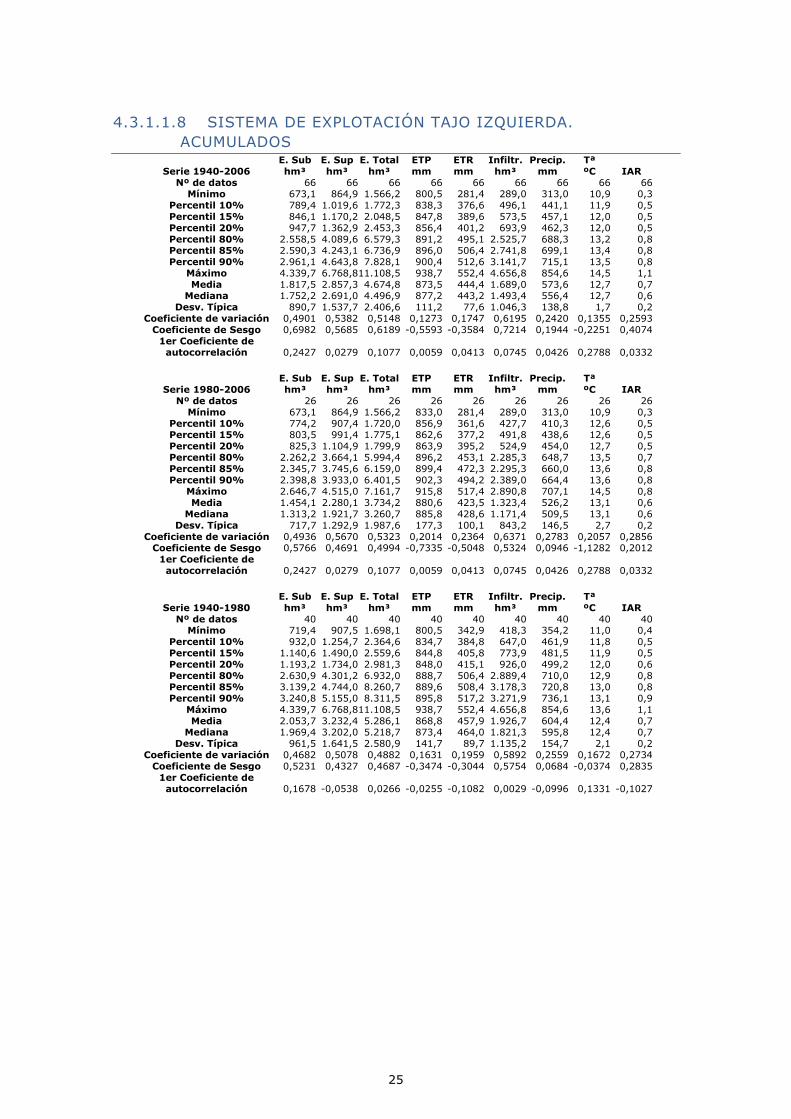
25
4.3.1.1.8 SISTEMA DE EXPLOTACIÓN TAJO IZQUIERDA.
ACUMULADOS
Serie 1940-2006 E. Sub hm³
E. Sup hm³
E. Total hm³
ETP mm
ETR mm
Infiltr. hm³
Precip. mm
Tª ºC IAR
Nº de datos 66 66 66 66 66 66 66 66 66 Mínimo 673,1 864,9 1.566,2 800,5 281,4 289,0 313,0 10,9 0,3
Percentil 10% 789,4 1.019,6 1.772,3 838,3 376,6 496,1 441,1 11,9 0,5 Percentil 15% 846,1 1.170,2 2.048,5 847,8 389,6 573,5 457,1 12,0 0,5 Percentil 20% 947,7 1.362,9 2.453,3 856,4 401,2 693,9 462,3 12,0 0,5 Percentil 80% 2.558,5 4.089,6 6.579,3 891,2 495,1 2.525,7 688,3 13,2 0,8 Percentil 85% 2.590,3 4.243,1 6.736,9 896,0 506,4 2.741,8 699,1 13,4 0,8 Percentil 90% 2.961,1 4.643,8 7.828,1 900,4 512,6 3.141,7 715,1 13,5 0,8
Máximo 4.339,7 6.768,8 11.108,5 938,7 552,4 4.656,8 854,6 14,5 1,1 Media 1.817,5 2.857,3 4.674,8 873,5 444,4 1.689,0 573,6 12,7 0,7
Mediana 1.752,2 2.691,0 4.496,9 877,2 443,2 1.493,4 556,4 12,7 0,6 Desv. Típica 890,7 1.537,7 2.406,6 111,2 77,6 1.046,3 138,8 1,7 0,2
Coeficiente de variación 0,4901 0,5382 0,5148 0,1273 0,1747 0,6195 0,2420 0,1355 0,2593 Coeficiente de Sesgo 0,6982 0,5685 0,6189 -0,5593 -0,3584 0,7214 0,1944 -0,2251 0,4074
1er Coeficiente de autocorrelación 0,2427 0,0279 0,1077 0,0059 0,0413 0,0745 0,0426 0,2788 0,0332
Serie 1980-2006 E. Sub hm³
E. Sup hm³
E. Total hm³
ETP mm
ETR mm
Infiltr. hm³
Precip. mm
Tª ºC IAR
Nº de datos 26 26 26 26 26 26 26 26 26 Mínimo 673,1 864,9 1.566,2 833,0 281,4 289,0 313,0 10,9 0,3
Percentil 10% 774,2 907,4 1.720,0 856,9 361,6 427,7 410,3 12,6 0,5 Percentil 15% 803,5 991,4 1.775,1 862,6 377,2 491,8 438,6 12,6 0,5 Percentil 20% 825,3 1.104,9 1.799,9 863,9 395,2 524,9 454,0 12,7 0,5 Percentil 80% 2.262,2 3.664,1 5.994,4 896,2 453,1 2.285,3 648,7 13,5 0,7 Percentil 85% 2.345,7 3.745,6 6.159,0 899,4 472,3 2.295,3 660,0 13,6 0,8 Percentil 90% 2.398,8 3.933,0 6.401,5 902,3 494,2 2.389,0 664,4 13,6 0,8
Máximo 2.646,7 4.515,0 7.161,7 915,8 517,4 2.890,8 707,1 14,5 0,8 Media 1.454,1 2.280,1 3.734,2 880,6 423,5 1.323,4 526,2 13,1 0,6
Mediana 1.313,2 1.921,7 3.260,7 885,8 428,6 1.171,4 509,5 13,1 0,6 Desv. Típica 717,7 1.292,9 1.987,6 177,3 100,1 843,2 146,5 2,7 0,2
Coeficiente de variación 0,4936 0,5670 0,5323 0,2014 0,2364 0,6371 0,2783 0,2057 0,2856 Coeficiente de Sesgo 0,5766 0,4691 0,4994 -0,7335 -0,5048 0,5324 0,0946 -1,1282 0,2012
1er Coeficiente de autocorrelación 0,2427 0,0279 0,1077 0,0059 0,0413 0,0745 0,0426 0,2788 0,0332
Serie 1940-1980 E. Sub hm³
E. Sup hm³
E. Total hm³
ETP mm
ETR mm
Infiltr. hm³
Precip. mm
Tª ºC IAR
Nº de datos 40 40 40 40 40 40 40 40 40 Mínimo 719,4 907,5 1.698,1 800,5 342,9 418,3 354,2 11,0 0,4
Percentil 10% 932,0 1.254,7 2.364,6 834,7 384,8 647,0 461,9 11,8 0,5 Percentil 15% 1.140,6 1.490,0 2.559,6 844,8 405,8 773,9 481,5 11,9 0,5 Percentil 20% 1.193,2 1.734,0 2.981,3 848,0 415,1 926,0 499,2 12,0 0,6 Percentil 80% 2.630,9 4.301,2 6.932,0 888,7 506,4 2.889,4 710,0 12,9 0,8 Percentil 85% 3.139,2 4.744,0 8.260,7 889,6 508,4 3.178,3 720,8 13,0 0,8 Percentil 90% 3.240,8 5.155,0 8.311,5 895,8 517,2 3.271,9 736,1 13,1 0,9
Máximo 4.339,7 6.768,8 11.108,5 938,7 552,4 4.656,8 854,6 13,6 1,1 Media 2.053,7 3.232,4 5.286,1 868,8 457,9 1.926,7 604,4 12,4 0,7
Mediana 1.969,4 3.202,0 5.218,7 873,4 464,0 1.821,3 595,8 12,4 0,7 Desv. Típica 961,5 1.641,5 2.580,9 141,7 89,7 1.135,2 154,7 2,1 0,2
Coeficiente de variación 0,4682 0,5078 0,4882 0,1631 0,1959 0,5892 0,2559 0,1672 0,2734 Coeficiente de Sesgo 0,5231 0,4327 0,4687 -0,3474 -0,3044 0,5754 0,0684 -0,0374 0,2835
1er Coeficiente de autocorrelación 0,1678 -0,0538 0,0266 -0,0255 -0,1082 0,0029 -0,0996 0,1331 -0,1027

26
Sistema de explotación Tajo Izquierda. Valores medios anuales. Acumulados
0
2.000
4.000
6.000
8.000
10.000
12.000
1940
-194
1
1942
-194
3
1944
-194
5
1946
-194
7
1948
-194
9
1950
-195
1
1952
-195
3
1954
-195
5
1956
-195
7
1958
-195
9
1960
-196
1
1962
-196
3
1964
-196
5
1966
-196
7
1968
-196
9
1970
-197
1
1972
-197
3
1974
-197
5
1976
-197
7
1978
-197
9
1980
-198
1
1982
-198
3
1984
-198
5
1986
-198
7
1988
-198
9
1990
-199
1
1992
-199
3
1994
-199
5
1996
-199
7
1998
-199
9
2000
-200
1
2002
-200
3
2004
-200
5
hm3
Escorrentía Total (hm3) Escorrentía Subterránea (hm
3) Escorrentía Superficial (hm
3) Infiltración (hm
3)
0100200300400500600700800900
1.000
1940
-194
1
1942
-194
3
1944
-194
5
1946
-194
7
1948
-194
9
1950
-195
1
1952
-195
3
1954
-195
5
1956
-195
7
1958
-195
9
1960
-196
1
1962
-196
3
1964
-196
5
1966
-196
7
1968
-196
9
1970
-197
1
1972
-197
3
1974
-197
5
1976
-197
7
1978
-197
9
1980
-198
1
1982
-198
3
1984
-198
5
1986
-198
7
1988
-198
9
1990
-199
1
1992
-199
3
1994
-199
5
1996
-199
7
1998
-199
9
2000
-200
1
2002
-200
3
2004
-200
5
mm
Evapotranspiración potencial (mm) Evapotranspiración real (mm)
0
100
200
300
400
500
600
700
800
900
1940
-194
1
1942
-194
3
1944
-194
5
1946
-194
7
1948
-194
9
1950
-195
1
1952
-195
3
1954
-195
5
1956
-195
7
1958
-195
9
1960
-196
1
1962
-196
3
1964
-196
5
1966
-196
7
1968
-196
9
1970
-197
1
1972
-197
3
1974
-197
5
1976
-197
7
1978
-197
9
1980
-198
1
1982
-198
3
1984
-198
5
1986
-198
7
1988
-198
9
1990
-199
1
1992
-199
3
1994
-199
5
1996
-199
7
1998
-199
9
2000
-200
1
2002
-200
3
2004
-200
5
mm
0
2
4
6
8
10
12
14
16
18ºC
Precipitación (mm) Temperatura (ºC)
0,0
0,2
0,4
0,6
0,8
1,0
1,2
1940
-194
1
1942
-194
3
1944
-194
5
1946
-194
7
1948
-194
9
1950
-195
1
1952
-195
3
1954
-195
5
1956
-195
7
1958
-195
9
1960
-196
1
1962
-196
3
1964
-196
5
1966
-196
7
1968
-196
9
1970
-197
1
1972
-197
3
1974
-197
5
1976
-197
7
1978
-197
9
1980
-198
1
1982
-198
3
1984
-198
5
1986
-198
7
1988
-198
9
1990
-199
1
1992
-199
3
1994
-199
5
1996
-199
7
1998
-199
9
2000
-200
1
2002
-200
3
2004
-200
5
Índice de aridez

27
4.3.1.1.9 SISTEMA DE EXPLOTACIÓN TIETAR
Serie 1940-2006 E. Sub hm³
E. Sup hm³
E. Total hm³
ETP mm
ETR mm
Infiltr. hm³
Precip. mm
Tª ºC IAR
Nº de datos 66 66 66 66 66 66 66 66 66 Mínimo 22,7 284,0 306,7 1.007,1 343,7 7,1 465,1 8,5 0,4
Percentil 10% 61,9 459,5 525,8 1.050,4 450,3 59,8 580,4 9,4 0,5
Percentil 15% 81,8 476,5 572,6 1.063,7 460,6 74,7 639,6 9,8 0,6 Percentil 20% 101,6 623,6 704,4 1.072,6 474,9 98,2 666,3 10,3 0,6 Percentil 80% 375,2 1.924,6 2.237,2 1.115,2 564,7 401,9 1.073,7 15,0 1,0 Percentil 85% 405,9 2.019,0 2.390,4 1.120,9 580,5 430,9 1.137,5 15,2 1,0 Percentil 90% 418,1 2.289,5 2.695,6 1.126,2 595,3 448,3 1.192,9 15,5 1,1
Máximo 545,1 2.979,6 3.507,7 1.170,4 628,5 583,2 1.263,8 16,0 1,2 Media 241,8 1.319,4 1.561,2 1.090,7 518,8 255,1 872,4 13,0 0,8
Mediana 247,5 1.264,3 1.525,5 1.093,5 517,3 264,9 898,3 13,6 0,8 Desv. Típica 140,4 707,1 844,7 139,0 86,1 155,1 244,9 2,8 0,2
Coeficiente de variación 0,5805 0,5360 0,5411 0,1274 0,1660 0,6078 0,2807 0,2115 0,2867 Coeficiente de Sesgo 0,2687 0,4126 0,3853 -0,4585 -0,1974 0,2095 0,1252 -0,6456 0,1322
1er Coeficiente de autocorrelación 0,0186 -0,0579 -0,0469 0,1786 0,0935 0,0200 -0,0065 0,8821 -0,0445
Serie 1980-2006 E. Sub hm³
E. Sup hm³
E. Total hm³
ETP mm
ETR mm
Infiltr. hm³
Precip. mm
Tª ºC IAR
Nº de datos 26 26 26 26 26 26 26 26 26 Mínimo 22,7 284,0 306,7 1.007,1 343,7 7,1 465,1 11,2 0,4
Percentil 10% 32,7 375,8 408,0 1.050,2 433,3 18,0 547,5 13,5 0,5 Percentil 15% 37,5 445,0 486,8 1.063,1 445,9 22,5 556,7 13,5 0,5 Percentil 20% 45,0 466,3 512,2 1.067,5 450,6 34,4 564,4 13,7 0,5 Percentil 80% 300,1 1.662,6 1.939,5 1.112,7 532,7 313,6 957,2 15,6 0,9 Percentil 85% 329,5 1.857,0 2.213,4 1.117,4 552,4 352,8 983,0 15,8 0,9 Percentil 90% 381,5 2.023,7 2.379,7 1.125,0 563,3 406,6 1.081,4 15,9 1,0
Máximo 545,1 2.875,1 3.420,2 1.133,0 628,5 583,2 1.251,8 16,0 1,1 Media 196,8 1.124,1 1.320,9 1.085,5 494,8 203,3 793,0 14,6 0,7
Mediana 184,6 958,9 1.143,6 1.086,6 493,1 191,1 767,7 14,8 0,7 Desv. Típica 144,4 731,6 874,0 219,4 115,2 160,0 272,0 3,1 0,3
Coeficiente de variación 0,7339 0,6509 0,6617 0,2022 0,2328 0,7871 0,3430 0,2155 0,3470 Coeficiente de Sesgo 0,6229 0,7685 0,7430 -0,8529 -0,0343 0,5663 0,4550 -0,9262 0,3922
1er Coeficiente de autocorrelación 0,0186 -0,0579 -0,0469 0,1786 0,0935 0,0200 -0,0065 0,8821 -0,0445
Serie 1940-1980
E. Sub
hm³
E. Sup
hm³
E. Total
hm³
ETP
mm
ETR
mm
Infiltr.
hm³
Precip.
mm
Tª
ºC IAR Nº de datos 40 40 40 40 40 40 40 40 40
Mínimo 55,6 437,5 518,0 1.013,2 422,4 48,3 541,6 8,5 0,5 Percentil 10% 101,1 573,9 670,9 1.052,6 472,3 98,0 663,2 9,2 0,6 Percentil 15% 118,9 706,9 831,9 1.070,0 481,1 122,2 683,5 9,4 0,6 Percentil 20% 135,1 764,7 887,5 1.075,0 487,1 141,5 702,6 9,6 0,6 Percentil 80% 405,9 1.968,1 2.372,8 1.116,0 580,1 430,3 1.103,2 14,2 1,0 Percentil 85% 411,6 2.086,6 2.457,9 1.120,7 588,7 444,9 1.174,4 14,4 1,1 Percentil 90% 428,1 2.392,7 2.804,4 1.127,4 602,4 468,6 1.223,2 14,5 1,1
Máximo 528,2 2.979,6 3.507,7 1.170,4 623,1 561,5 1.263,8 15,2 1,2 Media 271,0 1.446,3 1.717,3 1.094,1 534,4 288,8 924,1 12,0 0,8
Mediana 263,6 1.431,6 1.716,4 1.097,2 537,4 282,5 918,1 12,4 0,8 Desv. Típica 136,4 699,8 833,0 178,1 99,6 149,1 253,2 2,9 0,2
Coeficiente de variación 0,5034 0,4838 0,4850 0,1628 0,1864 0,5164 0,2740 0,2408 0,2819 Coeficiente de Sesgo 0,1793 0,3015 0,2777 -0,2504 -0,0962 0,1297 0,0429 -0,2141 0,0670
1er Coeficiente de autocorrelación 0,1024 -0,0144 0,0032 0,0159 -0,0557 0,0974 -0,0117 0,9184 -0,0662

28
Sistema de explotación Tietar
0
500
1.000
1.500
2.000
2.500
3.000
3.500
4.000
1940
-194
1
1942
-194
3
1944
-194
5
1946
-194
7
1948
-194
9
1950
-195
1
1952
-195
3
1954
-195
5
1956
-195
7
1958
-195
9
1960
-196
1
1962
-196
3
1964
-196
5
1966
-196
7
1968
-196
9
1970
-197
1
1972
-197
3
1974
-197
5
1976
-197
7
1978
-197
9
1980
-198
1
1982
-198
3
1984
-198
5
1986
-198
7
1988
-198
9
1990
-199
1
1992
-199
3
1994
-199
5
1996
-199
7
1998
-199
9
2000
-200
1
2002
-200
3
2004
-200
5
hm3
Escorrentía Total (hm3) Escorrentía Subterránea (hm
3) Escorrentía Superficial (hm
3) Infiltración (hm
3)
0
200
400
600
800
1.000
1.200
1.400
1940
-194
1
1942
-194
3
1944
-194
5
1946
-194
7
1948
-194
9
1950
-195
1
1952
-195
3
1954
-195
5
1956
-195
7
1958
-195
9
1960
-196
1
1962
-196
3
1964
-196
5
1966
-196
7
1968
-196
9
1970
-197
1
1972
-197
3
1974
-197
5
1976
-197
7
1978
-197
9
1980
-198
1
1982
-198
3
1984
-198
5
1986
-198
7
1988
-198
9
1990
-199
1
1992
-199
3
1994
-199
5
1996
-199
7
1998
-199
9
2000
-200
1
2002
-200
3
2004
-200
5
mm
Evapotranspiración potencial (mm) Evapotranspiración real (mm)
0
200
400
600
800
1.000
1.200
1.400
1940
-194
1
1942
-194
3
1944
-194
5
1946
-194
7
1948
-194
9
1950
-195
1
1952
-195
3
1954
-195
5
1956
-195
7
1958
-195
9
1960
-196
1
1962
-196
3
1964
-196
5
1966
-196
7
1968
-196
9
1970
-197
1
1972
-197
3
1974
-197
5
1976
-197
7
1978
-197
9
1980
-198
1
1982
-198
3
1984
-198
5
1986
-198
7
1988
-198
9
1990
-199
1
1992
-199
3
1994
-199
5
1996
-199
7
1998
-199
9
2000
-200
1
2002
-200
3
2004
-200
5
mm
0
3
6
9
12
15
18
21ºC
Precipitación (mm) Temperatura (ºC)
0,0
0,2
0,4
0,6
0,8
1,0
1,2
1,4
1940
-194
1
1942
-194
3
1944
-194
5
1946
-194
7
1948
-194
9
1950
-195
1
1952
-195
3
1954
-195
5
1956
-195
7
1958
-195
9
1960
-196
1
1962
-196
3
1964
-196
5
1966
-196
7
1968
-196
9
1970
-197
1
1972
-197
3
1974
-197
5
1976
-197
7
1978
-197
9
1980
-198
1
1982
-198
3
1984
-198
5
1986
-198
7
1988
-198
9
1990
-199
1
1992
-199
3
1994
-199
5
1996
-199
7
1998
-199
9
2000
-200
1
2002
-200
3
2004
-200
5
Índice de aridez
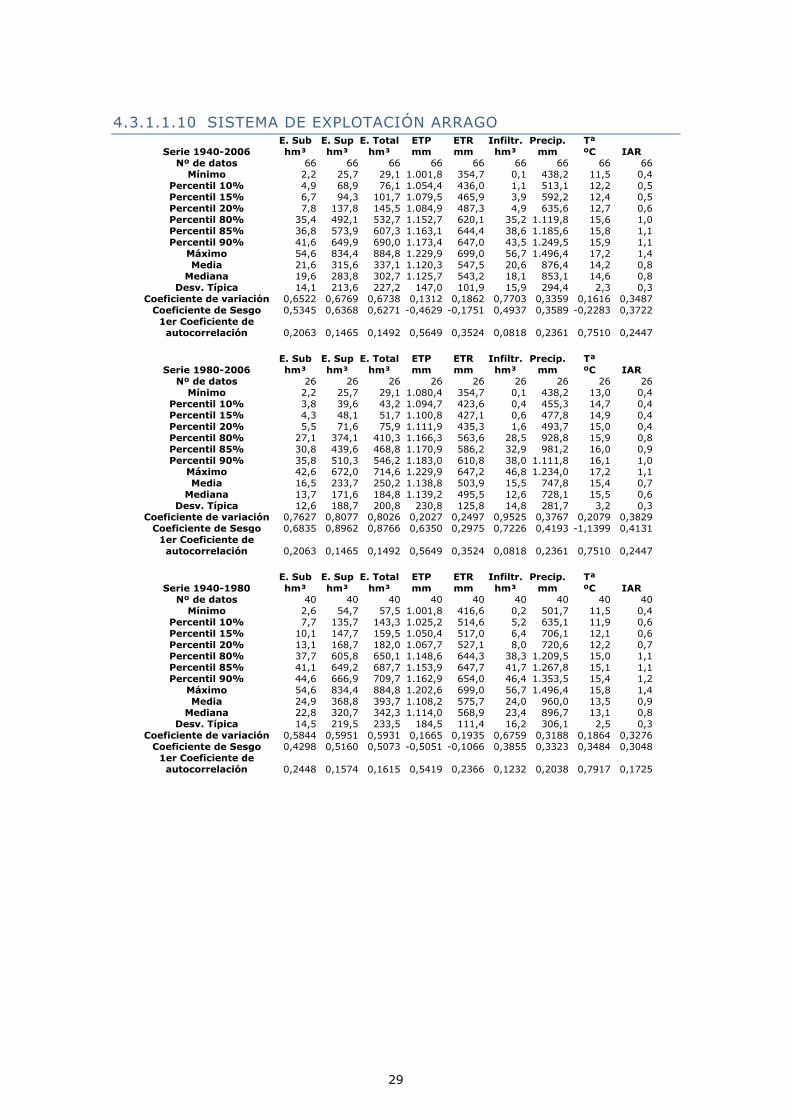
29
4.3.1.1.10 SISTEMA DE EXPLOTACIÓN ARRAGO
Serie 1940-2006 E. Sub hm³
E. Sup hm³
E. Total hm³
ETP mm
ETR mm
Infiltr. hm³
Precip. mm
Tª ºC IAR
Nº de datos 66 66 66 66 66 66 66 66 66 Mínimo 2,2 25,7 29,1 1.001,8 354,7 0,1 438,2 11,5 0,4
Percentil 10% 4,9 68,9 76,1 1.054,4 436,0 1,1 513,1 12,2 0,5
Percentil 15% 6,7 94,3 101,7 1.079,5 465,9 3,9 592,2 12,4 0,5 Percentil 20% 7,8 137,8 145,5 1.084,9 487,3 4,9 635,6 12,7 0,6 Percentil 80% 35,4 492,1 532,7 1.152,7 620,1 35,2 1.119,8 15,6 1,0 Percentil 85% 36,8 573,9 607,3 1.163,1 644,4 38,6 1.185,6 15,8 1,1 Percentil 90% 41,6 649,9 690,0 1.173,4 647,0 43,5 1.249,5 15,9 1,1
Máximo 54,6 834,4 884,8 1.229,9 699,0 56,7 1.496,4 17,2 1,4 Media 21,6 315,6 337,1 1.120,3 547,5 20,6 876,4 14,2 0,8
Mediana 19,6 283,8 302,7 1.125,7 543,2 18,1 853,1 14,6 0,8 Desv. Típica 14,1 213,6 227,2 147,0 101,9 15,9 294,4 2,3 0,3
Coeficiente de variación 0,6522 0,6769 0,6738 0,1312 0,1862 0,7703 0,3359 0,1616 0,3487 Coeficiente de Sesgo 0,5345 0,6368 0,6271 -0,4629 -0,1751 0,4937 0,3589 -0,2283 0,3722
1er Coeficiente de autocorrelación 0,2063 0,1465 0,1492 0,5649 0,3524 0,0818 0,2361 0,7510 0,2447
Serie 1980-2006 E. Sub hm³
E. Sup hm³
E. Total hm³
ETP mm
ETR mm
Infiltr. hm³
Precip. mm
Tª ºC IAR
Nº de datos 26 26 26 26 26 26 26 26 26 Mínimo 2,2 25,7 29,1 1.080,4 354,7 0,1 438,2 13,0 0,4
Percentil 10% 3,8 39,6 43,2 1.094,7 423,6 0,4 455,3 14,7 0,4 Percentil 15% 4,3 48,1 51,7 1.100,8 427,1 0,6 477,8 14,9 0,4 Percentil 20% 5,5 71,6 75,9 1.111,9 435,3 1,6 493,7 15,0 0,4 Percentil 80% 27,1 374,1 410,3 1.166,3 563,6 28,5 928,8 15,9 0,8 Percentil 85% 30,8 439,6 468,8 1.170,9 586,2 32,9 981,2 16,0 0,9 Percentil 90% 35,8 510,3 546,2 1.183,0 610,8 38,0 1.111,8 16,1 1,0
Máximo 42,6 672,0 714,6 1.229,9 647,2 46,8 1.234,0 17,2 1,1 Media 16,5 233,7 250,2 1.138,8 503,9 15,5 747,8 15,4 0,7
Mediana 13,7 171,6 184,8 1.139,2 495,5 12,6 728,1 15,5 0,6 Desv. Típica 12,6 188,7 200,8 230,8 125,8 14,8 281,7 3,2 0,3
Coeficiente de variación 0,7627 0,8077 0,8026 0,2027 0,2497 0,9525 0,3767 0,2079 0,3829 Coeficiente de Sesgo 0,6835 0,8962 0,8766 0,6350 0,2975 0,7226 0,4193 -1,1399 0,4131
1er Coeficiente de autocorrelación 0,2063 0,1465 0,1492 0,5649 0,3524 0,0818 0,2361 0,7510 0,2447
Serie 1940-1980
E. Sub
hm³
E. Sup
hm³
E. Total
hm³
ETP
mm
ETR
mm
Infiltr.
hm³
Precip.
mm
Tª
ºC IAR Nº de datos 40 40 40 40 40 40 40 40 40
Mínimo 2,6 54,7 57,5 1.001,8 416,6 0,2 501,7 11,5 0,4 Percentil 10% 7,7 135,7 143,3 1.025,2 514,6 5,2 635,1 11,9 0,6 Percentil 15% 10,1 147,7 159,5 1.050,4 517,0 6,4 706,1 12,1 0,6 Percentil 20% 13,1 168,7 182,0 1.067,7 527,1 8,0 720,6 12,2 0,7 Percentil 80% 37,7 605,8 650,1 1.148,6 644,3 38,3 1.209,5 15,0 1,1 Percentil 85% 41,1 649,2 687,7 1.153,9 647,7 41,7 1.267,8 15,1 1,1 Percentil 90% 44,6 666,9 709,7 1.162,9 654,0 46,4 1.353,5 15,4 1,2
Máximo 54,6 834,4 884,8 1.202,6 699,0 56,7 1.496,4 15,8 1,4 Media 24,9 368,8 393,7 1.108,2 575,7 24,0 960,0 13,5 0,9
Mediana 22,8 320,7 342,3 1.114,0 568,9 23,4 896,7 13,1 0,8 Desv. Típica 14,5 219,5 233,5 184,5 111,4 16,2 306,1 2,5 0,3
Coeficiente de variación 0,5844 0,5951 0,5931 0,1665 0,1935 0,6759 0,3188 0,1864 0,3276 Coeficiente de Sesgo 0,4298 0,5160 0,5073 -0,5051 -0,1066 0,3855 0,3323 0,3484 0,3048
1er Coeficiente de autocorrelación 0,2448 0,1574 0,1615 0,5419 0,2366 0,1232 0,2038 0,7917 0,1725

30
Sistema de explotación Arrago
0
100
200
300
400
500
600
700
800
900
1.000
1940
-194
1
1942
-194
3
1944
-194
5
1946
-194
7
1948
-194
9
1950
-195
1
1952
-195
3
1954
-195
5
1956
-195
7
1958
-195
9
1960
-196
1
1962
-196
3
1964
-196
5
1966
-196
7
1968
-196
9
1970
-197
1
1972
-197
3
1974
-197
5
1976
-197
7
1978
-197
9
1980
-198
1
1982
-198
3
1984
-198
5
1986
-198
7
1988
-198
9
1990
-199
1
1992
-199
3
1994
-199
5
1996
-199
7
1998
-199
9
2000
-200
1
2002
-200
3
2004
-200
5
hm3
Escorrentía Total (hm3) Escorrentía Subterránea (hm
3) Escorrentía Superficial (hm
3) Infiltración (hm
3)
0
200
400
600
800
1.000
1.200
1.400
1940
-194
1
1942
-194
3
1944
-194
5
1946
-194
7
1948
-194
9
1950
-195
1
1952
-195
3
1954
-195
5
1956
-195
7
1958
-195
9
1960
-196
1
1962
-196
3
1964
-196
5
1966
-196
7
1968
-196
9
1970
-197
1
1972
-197
3
1974
-197
5
1976
-197
7
1978
-197
9
1980
-198
1
1982
-198
3
1984
-198
5
1986
-198
7
1988
-198
9
1990
-199
1
1992
-199
3
1994
-199
5
1996
-199
7
1998
-199
9
2000
-200
1
2002
-200
3
2004
-200
5
mm
Evapotranspiración potencial (mm) Evapotranspiración real (mm)
0
200
400
600
800
1.000
1.200
1.400
1.600
1940
-194
1
1942
-194
3
1944
-194
5
1946
-194
7
1948
-194
9
1950
-195
1
1952
-195
3
1954
-195
5
1956
-195
7
1958
-195
9
1960
-196
1
1962
-196
3
1964
-196
5
1966
-196
7
1968
-196
9
1970
-197
1
1972
-197
3
1974
-197
5
1976
-197
7
1978
-197
9
1980
-198
1
1982
-198
3
1984
-198
5
1986
-198
7
1988
-198
9
1990
-199
1
1992
-199
3
1994
-199
5
1996
-199
7
1998
-199
9
2000
-200
1
2002
-200
3
2004
-200
5
mm
0
3
6
9
12
15
18
21
24ºC
Precipitación (mm) Temperatura (ºC)
0,0
0,2
0,4
0,6
0,8
1,0
1,2
1,4
1,6
1940
-194
1
1942
-194
3
1944
-194
5
1946
-194
7
1948
-194
9
1950
-195
1
1952
-195
3
1954
-195
5
1956
-195
7
1958
-195
9
1960
-196
1
1962
-196
3
1964
-196
5
1966
-196
7
1968
-196
9
1970
-197
1
1972
-197
3
1974
-197
5
1976
-197
7
1978
-197
9
1980
-198
1
1982
-198
3
1984
-198
5
1986
-198
7
1988
-198
9
1990
-199
1
1992
-199
3
1994
-199
5
1996
-199
7
1998
-199
9
2000
-200
1
2002
-200
3
2004
-200
5
Índice de aridez
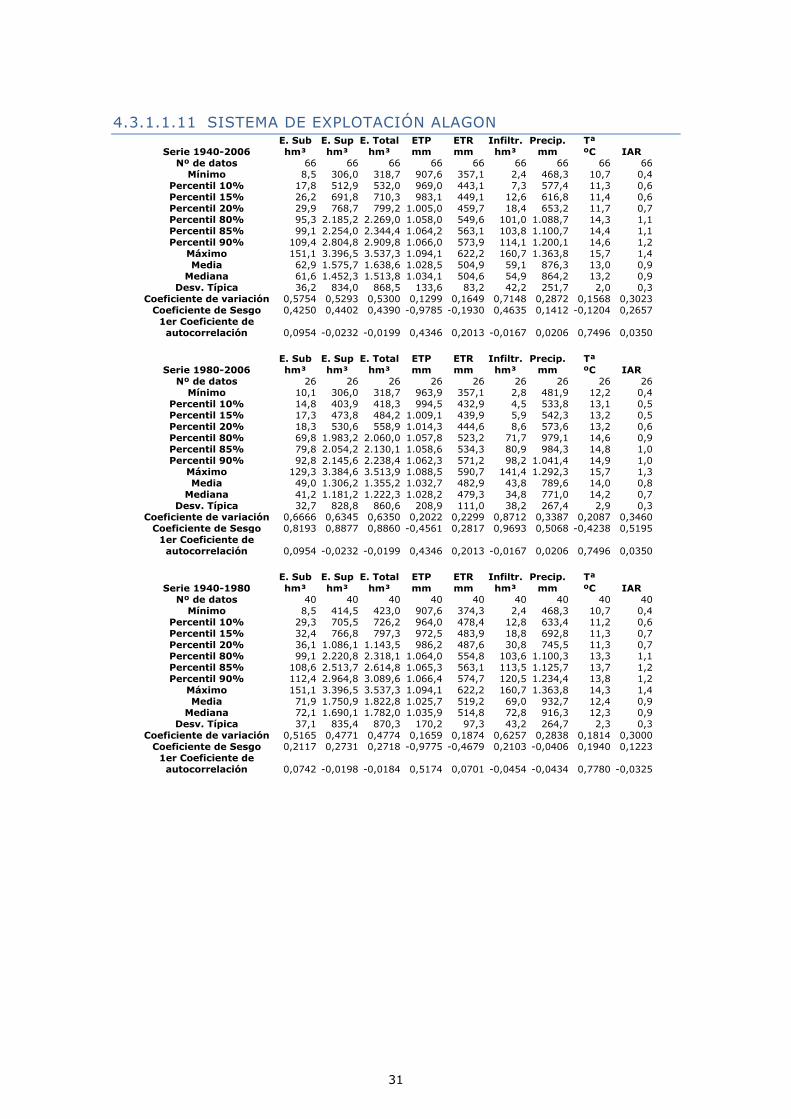
31
4.3.1.1.11 SISTEMA DE EXPLOTACIÓN ALAGON
Serie 1940-2006 E. Sub hm³
E. Sup hm³
E. Total hm³
ETP mm
ETR mm
Infiltr. hm³
Precip. mm
Tª ºC IAR
Nº de datos 66 66 66 66 66 66 66 66 66 Mínimo 8,5 306,0 318,7 907,6 357,1 2,4 468,3 10,7 0,4
Percentil 10% 17,8 512,9 532,0 969,0 443,1 7,3 577,4 11,3 0,6
Percentil 15% 26,2 691,8 710,3 983,1 449,1 12,6 616,8 11,4 0,6 Percentil 20% 29,9 768,7 799,2 1.005,0 459,7 18,4 653,2 11,7 0,7 Percentil 80% 95,3 2.185,2 2.269,0 1.058,0 549,6 101,0 1.088,7 14,3 1,1 Percentil 85% 99,1 2.254,0 2.344,4 1.064,2 563,1 103,8 1.100,7 14,4 1,1 Percentil 90% 109,4 2.804,8 2.909,8 1.066,0 573,9 114,1 1.200,1 14,6 1,2
Máximo 151,1 3.396,5 3.537,3 1.094,1 622,2 160,7 1.363,8 15,7 1,4 Media 62,9 1.575,7 1.638,6 1.028,5 504,9 59,1 876,3 13,0 0,9
Mediana 61,6 1.452,3 1.513,8 1.034,1 504,6 54,9 864,2 13,2 0,9 Desv. Típica 36,2 834,0 868,5 133,6 83,2 42,2 251,7 2,0 0,3
Coeficiente de variación 0,5754 0,5293 0,5300 0,1299 0,1649 0,7148 0,2872 0,1568 0,3023 Coeficiente de Sesgo 0,4250 0,4402 0,4390 -0,9785 -0,1930 0,4635 0,1412 -0,1204 0,2657
1er Coeficiente de autocorrelación 0,0954 -0,0232 -0,0199 0,4346 0,2013 -0,0167 0,0206 0,7496 0,0350
Serie 1980-2006 E. Sub hm³
E. Sup hm³
E. Total hm³
ETP mm
ETR mm
Infiltr. hm³
Precip. mm
Tª ºC IAR
Nº de datos 26 26 26 26 26 26 26 26 26 Mínimo 10,1 306,0 318,7 963,9 357,1 2,8 481,9 12,2 0,4
Percentil 10% 14,8 403,9 418,3 994,5 432,9 4,5 533,8 13,1 0,5 Percentil 15% 17,3 473,8 484,2 1.009,1 439,9 5,9 542,3 13,2 0,5 Percentil 20% 18,3 530,6 558,9 1.014,3 444,6 8,6 573,6 13,2 0,6 Percentil 80% 69,8 1.983,2 2.060,0 1.057,8 523,2 71,7 979,1 14,6 0,9 Percentil 85% 79,8 2.054,2 2.130,1 1.058,6 534,3 80,9 984,3 14,8 1,0 Percentil 90% 92,8 2.145,6 2.238,4 1.062,3 571,2 98,2 1.041,4 14,9 1,0
Máximo 129,3 3.384,6 3.513,9 1.088,5 590,7 141,4 1.292,3 15,7 1,3 Media 49,0 1.306,2 1.355,2 1.032,7 482,9 43,8 789,6 14,0 0,8
Mediana 41,2 1.181,2 1.222,3 1.028,2 479,3 34,8 771,0 14,2 0,7 Desv. Típica 32,7 828,8 860,6 208,9 111,0 38,2 267,4 2,9 0,3
Coeficiente de variación 0,6666 0,6345 0,6350 0,2022 0,2299 0,8712 0,3387 0,2087 0,3460 Coeficiente de Sesgo 0,8193 0,8877 0,8860 -0,4561 0,2817 0,9693 0,5068 -0,4238 0,5195
1er Coeficiente de autocorrelación 0,0954 -0,0232 -0,0199 0,4346 0,2013 -0,0167 0,0206 0,7496 0,0350
Serie 1940-1980
E. Sub
hm³
E. Sup
hm³
E. Total
hm³
ETP
mm
ETR
mm
Infiltr.
hm³
Precip.
mm
Tª
ºC IAR Nº de datos 40 40 40 40 40 40 40 40 40
Mínimo 8,5 414,5 423,0 907,6 374,3 2,4 468,3 10,7 0,4 Percentil 10% 29,3 705,5 726,2 964,0 478,4 12,8 633,4 11,2 0,6 Percentil 15% 32,4 766,8 797,3 972,5 483,9 18,8 692,8 11,3 0,7 Percentil 20% 36,1 1.086,1 1.143,5 986,2 487,6 30,8 745,5 11,3 0,7 Percentil 80% 99,1 2.220,8 2.318,1 1.064,0 554,8 103,6 1.100,3 13,3 1,1 Percentil 85% 108,6 2.513,7 2.614,8 1.065,3 563,1 113,5 1.125,7 13,7 1,2 Percentil 90% 112,4 2.964,8 3.089,6 1.066,4 574,7 120,5 1.234,4 13,8 1,2
Máximo 151,1 3.396,5 3.537,3 1.094,1 622,2 160,7 1.363,8 14,3 1,4 Media 71,9 1.750,9 1.822,8 1.025,7 519,2 69,0 932,7 12,4 0,9
Mediana 72,1 1.690,1 1.782,0 1.035,9 514,8 72,8 916,3 12,3 0,9 Desv. Típica 37,1 835,4 870,3 170,2 97,3 43,2 264,7 2,3 0,3
Coeficiente de variación 0,5165 0,4771 0,4774 0,1659 0,1874 0,6257 0,2838 0,1814 0,3000 Coeficiente de Sesgo 0,2117 0,2731 0,2718 -0,9775 -0,4679 0,2103 -0,0406 0,1940 0,1223
1er Coeficiente de autocorrelación 0,0742 -0,0198 -0,0184 0,5174 0,0701 -0,0454 -0,0434 0,7780 -0,0325

32
Sistema de explotación Alagon
0
500
1.000
1.500
2.000
2.500
3.000
3.500
4.000
1940
-194
1
1942
-194
3
1944
-194
5
1946
-194
7
1948
-194
9
1950
-195
1
1952
-195
3
1954
-195
5
1956
-195
7
1958
-195
9
1960
-196
1
1962
-196
3
1964
-196
5
1966
-196
7
1968
-196
9
1970
-197
1
1972
-197
3
1974
-197
5
1976
-197
7
1978
-197
9
1980
-198
1
1982
-198
3
1984
-198
5
1986
-198
7
1988
-198
9
1990
-199
1
1992
-199
3
1994
-199
5
1996
-199
7
1998
-199
9
2000
-200
1
2002
-200
3
2004
-200
5
hm3
Escorrentía Total (hm3) Escorrentía Subterránea (hm
3) Escorrentía Superficial (hm
3) Infiltración (hm
3)
0
200
400
600
800
1.000
1.200
1940
-194
1
1942
-194
3
1944
-194
5
1946
-194
7
1948
-194
9
1950
-195
1
1952
-195
3
1954
-195
5
1956
-195
7
1958
-195
9
1960
-196
1
1962
-196
3
1964
-196
5
1966
-196
7
1968
-196
9
1970
-197
1
1972
-197
3
1974
-197
5
1976
-197
7
1978
-197
9
1980
-198
1
1982
-198
3
1984
-198
5
1986
-198
7
1988
-198
9
1990
-199
1
1992
-199
3
1994
-199
5
1996
-199
7
1998
-199
9
2000
-200
1
2002
-200
3
2004
-200
5
mm
Evapotranspiración potencial (mm) Evapotranspiración real (mm)
0
200
400
600
800
1.000
1.200
1.400
1.600
1940
-194
1
1942
-194
3
1944
-194
5
1946
-194
7
1948
-194
9
1950
-195
1
1952
-195
3
1954
-195
5
1956
-195
7
1958
-195
9
1960
-196
1
1962
-196
3
1964
-196
5
1966
-196
7
1968
-196
9
1970
-197
1
1972
-197
3
1974
-197
5
1976
-197
7
1978
-197
9
1980
-198
1
1982
-198
3
1984
-198
5
1986
-198
7
1988
-198
9
1990
-199
1
1992
-199
3
1994
-199
5
1996
-199
7
1998
-199
9
2000
-200
1
2002
-200
3
2004
-200
5
mm
0
3
6
9
12
15
18
21
24ºC
Precipitación (mm) Temperatura (ºC)
0,0
0,2
0,4
0,6
0,8
1,0
1,2
1,4
1,6
1940
-194
1
1942
-194
3
1944
-194
5
1946
-194
7
1948
-194
9
1950
-195
1
1952
-195
3
1954
-195
5
1956
-195
7
1958
-195
9
1960
-196
1
1962
-196
3
1964
-196
5
1966
-196
7
1968
-196
9
1970
-197
1
1972
-197
3
1974
-197
5
1976
-197
7
1978
-197
9
1980
-198
1
1982
-198
3
1984
-198
5
1986
-198
7
1988
-198
9
1990
-199
1
1992
-199
3
1994
-199
5
1996
-199
7
1998
-199
9
2000
-200
1
2002
-200
3
2004
-200
5
Índice de aridez

33
4.3.1.1.12 SISTEMA DE EXPLOTACIÓN ALAGON. ACUMULADOS
Serie 1940-2006 E. Sub hm³
E. Sup hm³
E. Total hm³
ETP mm
ETR mm
Infiltr. hm³
Precip. mm
Tª ºC IAR
Nº de datos 66 66 66 66 66 66 66 66 66 Mínimo 11,1 331,7 347,8 925,3 356,6 2,6 474,6 10,9 0,4
Percentil 10% 22,6 584,5 608,6 985,7 441,9 9,2 566,4 11,5 0,5
Percentil 15% 32,4 785,8 815,4 1.001,4 448,2 19,6 608,2 11,7 0,6 Percentil 20% 37,4 904,5 949,8 1.024,8 465,3 23,6 649,4 11,9 0,7 Percentil 80% 127,3 2.683,4 2.804,8 1.076,8 560,2 132,7 1.098,2 14,5 1,0 Percentil 85% 129,4 2.838,9 2.961,6 1.081,2 575,4 138,4 1.110,2 14,6 1,1 Percentil 90% 142,0 3.333,5 3.473,4 1.083,8 588,3 146,0 1.190,6 14,8 1,2
Máximo 205,7 4.056,6 4.230,6 1.115,1 631,5 216,2 1.376,0 16,0 1,4 Media 84,5 1.891,3 1.975,8 1.045,7 512,9 79,7 876,3 13,3 0,8
Mediana 79,8 1.768,8 1.840,2 1.051,9 512,3 74,0 851,7 13,4 0,8 Desv. Típica 49,5 1.035,5 1.083,2 135,8 86,0 56,9 257,2 2,1 0,3
Coeficiente de variación 0,5856 0,5475 0,5482 0,1299 0,1676 0,7135 0,2935 0,1574 0,3078 Coeficiente de Sesgo 0,4255 0,4436 0,4423 -0,8990 -0,1961 0,4213 0,1521 -0,1460 0,2618
1er Coeficiente de autocorrelación 0,1138 0,0031 0,0070 0,4521 0,2439 -0,0077 0,0611 0,7528 0,0719
Serie 1980-2006 E. Sub hm³
E. Sup hm³
E. Total hm³
ETP mm
ETR mm
Infiltr. hm³
Precip. mm
Tª ºC IAR
Nº de datos 26 26 26 26 26 26 26 26 26 Mínimo 12,3 331,7 347,8 986,6 356,6 3,0 476,5 12,3 0,4
Percentil 10% 18,7 444,2 462,1 1.015,8 432,6 4,9 521,9 13,4 0,5 Percentil 15% 21,5 518,1 532,7 1.029,8 439,1 6,5 527,1 13,5 0,5 Percentil 20% 23,7 627,0 662,9 1.030,8 443,4 10,2 566,2 13,5 0,5 Percentil 80% 96,9 2.355,6 2.452,4 1.076,4 530,8 95,2 948,8 14,9 0,9 Percentil 85% 116,1 2.401,8 2.519,7 1.077,9 544,0 120,1 980,7 15,0 1,0 Percentil 90% 127,0 2.655,8 2.784,6 1.081,8 580,4 136,9 1.056,5 15,1 1,0
Máximo 172,0 4.056,6 4.228,5 1.115,1 601,3 188,3 1.281,4 16,0 1,2 Media 65,6 1.539,8 1.605,4 1.052,6 486,8 59,3 781,7 14,3 0,7
Mediana 54,1 1.352,1 1.400,6 1.049,2 485,3 46,0 764,8 14,4 0,7 Desv. Típica 44,9 1.011,7 1.055,4 212,8 113,4 52,5 269,1 3,0 0,3
Coeficiente de variación 0,6848 0,6570 0,6574 0,2022 0,2330 0,8843 0,3443 0,2084 0,3510 Coeficiente de Sesgo 0,7521 0,8837 0,8778 -0,2265 0,3037 0,8701 0,4763 -0,5474 0,4850
1er Coeficiente de autocorrelación 0,1138 0,0031 0,0070 0,4521 0,2439 -0,0077 0,0611 0,7528 0,0719
Serie 1940-1980
E. Sub
hm³
E. Sup
hm³
E. Total
hm³
ETP
mm
ETR
mm
Infiltr.
hm³
Precip.
mm
Tª
ºC IAR Nº de datos 40 40 40 40 40 40 40 40 40
Mínimo 11,1 501,2 512,3 925,3 382,2 2,6 474,6 10,9 0,4 Percentil 10% 36,7 790,3 837,6 978,1 483,1 21,2 640,2 11,3 0,6 Percentil 15% 45,2 916,5 955,1 984,4 491,0 24,8 698,7 11,4 0,7 Percentil 20% 50,4 1.271,3 1.341,4 1.003,4 495,0 39,3 743,9 11,6 0,7 Percentil 80% 129,1 2.836,8 2.959,0 1.078,8 567,0 139,7 1.109,9 13,6 1,1 Percentil 85% 135,6 2.951,2 3.081,7 1.081,9 585,9 145,6 1.147,7 14,0 1,1 Percentil 90% 156,5 3.752,3 3.933,4 1.084,5 589,4 161,0 1.255,4 14,1 1,2
Máximo 205,7 4.045,3 4.230,6 1.114,5 631,5 216,2 1.376,0 14,6 1,4 Media 96,8 2.119,7 2.216,5 1.041,2 529,8 92,9 937,8 12,6 0,9
Mediana 96,3 1.985,1 2.096,6 1.054,7 526,3 98,9 926,1 12,5 0,9 Desv. Típica 50,6 1.038,9 1.087,4 172,7 99,2 57,6 269,2 2,3 0,3
Coeficiente de variación 0,5229 0,4901 0,4906 0,1659 0,1873 0,6197 0,2871 0,1819 0,3020 Coeficiente de Sesgo 0,2502 0,2791 0,2794 -0,8883 -0,4231 0,2043 -0,0005 0,2191 0,1344
1er Coeficiente de autocorrelación 0,1024 0,0051 0,0079 0,5190 0,1127 -0,0283 -0,0009 0,7862 -0,0009

34
Sistema de explotación Alagon. Acumulados
0
500
1.000
1.500
2.000
2.500
3.000
3.500
4.000
4.500
1940
-194
1
1942
-194
3
1944
-194
5
1946
-194
7
1948
-194
9
1950
-195
1
1952
-195
3
1954
-195
5
1956
-195
7
1958
-195
9
1960
-196
1
1962
-196
3
1964
-196
5
1966
-196
7
1968
-196
9
1970
-197
1
1972
-197
3
1974
-197
5
1976
-197
7
1978
-197
9
1980
-198
1
1982
-198
3
1984
-198
5
1986
-198
7
1988
-198
9
1990
-199
1
1992
-199
3
1994
-199
5
1996
-199
7
1998
-199
9
2000
-200
1
2002
-200
3
2004
-200
5
hm3
Escorrentía Total (hm3) Escorrentía Subterránea (hm
3) Escorrentía Superficial (hm
3) Infiltración (hm
3)
0
200
400
600
800
1.000
1.200
1940
-194
1
1942
-194
3
1944
-194
5
1946
-194
7
1948
-194
9
1950
-195
1
1952
-195
3
1954
-195
5
1956
-195
7
1958
-195
9
1960
-196
1
1962
-196
3
1964
-196
5
1966
-196
7
1968
-196
9
1970
-197
1
1972
-197
3
1974
-197
5
1976
-197
7
1978
-197
9
1980
-198
1
1982
-198
3
1984
-198
5
1986
-198
7
1988
-198
9
1990
-199
1
1992
-199
3
1994
-199
5
1996
-199
7
1998
-199
9
2000
-200
1
2002
-200
3
2004
-200
5
mm
Evapotranspiración potencial (mm) Evapotranspiración real (mm)
0
200
400
600
800
1.000
1.200
1.400
1.600
1940
-194
1
1942
-194
3
1944
-194
5
1946
-194
7
1948
-194
9
1950
-195
1
1952
-195
3
1954
-195
5
1956
-195
7
1958
-195
9
1960
-196
1
1962
-196
3
1964
-196
5
1966
-196
7
1968
-196
9
1970
-197
1
1972
-197
3
1974
-197
5
1976
-197
7
1978
-197
9
1980
-198
1
1982
-198
3
1984
-198
5
1986
-198
7
1988
-198
9
1990
-199
1
1992
-199
3
1994
-199
5
1996
-199
7
1998
-199
9
2000
-200
1
2002
-200
3
2004
-200
5
mm
0
3
6
9
12
15
18
21
24ºC
Precipitación (mm) Temperatura (ºC)
0,0
0,2
0,4
0,6
0,8
1,0
1,2
1,4
1,6
1940
-194
1
1942
-194
3
1944
-194
5
1946
-194
7
1948
-194
9
1950
-195
1
1952
-195
3
1954
-195
5
1956
-195
7
1958
-195
9
1960
-196
1
1962
-196
3
1964
-196
5
1966
-196
7
1968
-196
9
1970
-197
1
1972
-197
3
1974
-197
5
1976
-197
7
1978
-197
9
1980
-198
1
1982
-198
3
1984
-198
5
1986
-198
7
1988
-198
9
1990
-199
1
1992
-199
3
1994
-199
5
1996
-199
7
1998
-199
9
2000
-200
1
2002
-200
3
2004
-200
5
Índice de aridez

35
4.3.1.1.13 SISTEMA DE EXPLOTACIÓN BAJO TAJO (SÓLO LA PARTE
ESPAÑOLA DE LA CUENCA)
Serie 1940-2006 E. Sub hm³
E. Sup hm³
E. Total hm³
ETP mm
ETR mm
Infiltr. hm³
Precip. mm
Tª ºC IAR
Nº de datos 66 66 66 66 66 66 66 66 66 Mínimo 15,1 110,6 126,5 1.070,4 303,1 2,2 349,3 11,9 0,3
Percentil 10% 26,6 300,8 334,0 1.107,5 401,3 9,8 436,9 14,2 0,4 Percentil 15% 33,7 429,7 459,6 1.116,4 413,2 15,0 461,2 14,6 0,4 Percentil 20% 41,7 479,6 540,2 1.119,6 424,6 24,3 501,1 14,8 0,4 Percentil 80% 147,8 2.438,2 2.597,8 1.181,5 529,6 118,6 786,1 16,0 0,7 Percentil 85% 160,3 2.695,3 2.816,3 1.185,0 550,3 142,6 802,7 16,2 0,7 Percentil 90% 166,2 3.253,2 3.436,5 1.197,4 556,3 151,7 847,5 16,3 0,7
Máximo 221,5 3.965,2 4.163,8 1.237,1 582,5 195,9 892,0 17,3 0,8 Media 96,6 1.524,5 1.621,1 1.152,4 474,6 75,2 622,5 15,4 0,5
Mediana 95,4 1.343,0 1.448,7 1.154,5 474,7 72,8 606,2 15,5 0,5 Desv. Típica 57,3 1.089,6 1.144,8 147,5 86,0 54,6 169,6 2,1 0,2
Coeficiente de variación 0,5933 0,7147 0,7062 0,1280 0,1812 0,7258 0,2724 0,1365 0,3056 Coeficiente de Sesgo 0,4395 0,6684 0,6547 -0,2295 -0,3021 0,5550 0,1583 -1,2064 0,1603
1er Coeficiente de autocorrelación 0,0388 0,0176 0,0185 0,2501 0,0856 0,0058 0,0738 0,3199 0,0897
Serie 1980-2006 E. Sub hm³
E. Sup hm³
E. Total hm³
ETP mm
ETR mm
Infiltr. hm³
Precip. mm
Tª ºC IAR
Nº de datos 26 26 26 26 26 26 26 26 26 Mínimo 15,1 110,6 126,5 1.074,9 303,1 2,2 349,3 11,9 0,3
Percentil 10% 17,1 206,0 222,9 1.132,5 370,8 4,4 390,4 15,3 0,3 Percentil 15% 17,8 221,0 238,7 1.134,7 376,8 7,6 404,5 15,4 0,3 Percentil 20% 18,8 262,2 280,1 1.142,5 411,8 8,8 433,1 15,5 0,3 Percentil 80% 114,2 1.901,8 2.045,1 1.183,4 511,1 89,0 688,1 16,3 0,6 Percentil 85% 124,4 2.197,6 2.312,8 1.187,7 514,7 109,6 709,3 16,4 0,6 Percentil 90% 152,8 2.761,9 2.905,4 1.199,6 536,3 135,6 793,0 16,5 0,7
Máximo 215,3 3.763,8 3.979,1 1.217,3 575,9 195,9 859,8 17,3 0,8 Media 76,7 1.244,8 1.321,5 1.161,9 453,2 61,6 573,9 15,8 0,5
Mediana 63,6 981,7 1.046,6 1.165,1 459,1 54,2 549,2 15,8 0,5 Desv. Típica 56,1 1.082,4 1.136,8 234,6 111,8 53,0 189,3 3,3 0,2
Coeficiente de variación 0,7309 0,8695 0,8602 0,2019 0,2468 0,8606 0,3299 0,2086 0,3659 Coeficiente de Sesgo 0,8471 1,0591 1,0437 -0,7943 -0,1197 0,9368 0,3824 -2,9213 0,4218
1er Coeficiente de autocorrelación 0,0388 0,0176 0,0185 0,2501 0,0856 0,0058 0,0738 0,3199 0,0897
Serie 1940-1980 E. Sub hm³
E. Sup hm³
E. Total hm³
ETP mm
ETR mm
Infiltr. hm³
Precip. mm
Tª ºC IAR
Nº de datos 40 40 40 40 40 40 40 40 40 Mínimo 26,4 306,7 339,1 1.070,4 337,6 4,7 367,4 13,5 0,3
Percentil 10% 40,8 450,3 487,8 1.104,7 419,1 15,6 490,9 14,1 0,4 Percentil 15% 50,0 667,5 735,2 1.113,3 436,4 24,2 501,8 14,3 0,4 Percentil 20% 61,1 738,8 782,5 1.116,4 438,7 32,7 512,3 14,5 0,4 Percentil 80% 155,3 2.511,0 2.655,6 1.180,3 550,2 134,5 791,3 15,8 0,7 Percentil 85% 162,9 2.883,6 3.049,7 1.184,4 551,7 149,1 828,6 16,0 0,7 Percentil 90% 198,8 3.274,5 3.461,9 1.190,8 557,3 168,0 867,8 16,1 0,7
Máximo 221,5 3.965,2 4.163,8 1.237,1 582,5 195,2 892,0 16,4 0,8 Media 109,5 1.706,3 1.815,8 1.146,2 488,6 84,0 654,1 15,1 0,6
Mediana 107,0 1.436,7 1.550,2 1.145,0 493,9 79,8 645,9 15,3 0,6 Desv. Típica 56,9 1.093,9 1.148,6 187,5 97,0 55,6 178,4 2,5 0,2
Coeficiente de variación 0,5199 0,6411 0,6325 0,1635 0,1986 0,6618 0,2728 0,1678 0,2993 Coeficiente de Sesgo 0,3101 0,5276 0,5167 0,1028 -0,3184 0,3803 0,1025 -0,3486 0,0782
1er Coeficiente de autocorrelación 0,0772 0,1098 0,1087 0,2113 0,0174 0,0898 0,1054 0,4753 0,1390
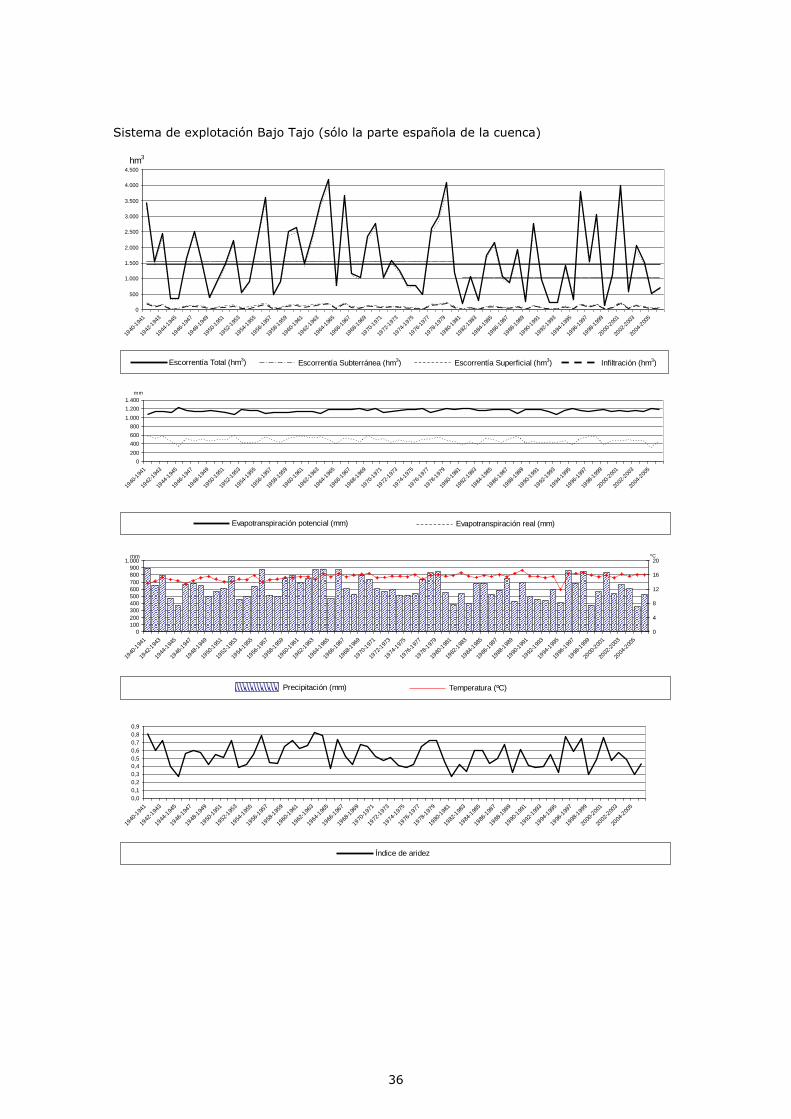
36
Sistema de explotación Bajo Tajo (sólo la parte española de la cuenca)
0
500
1.000
1.500
2.000
2.500
3.000
3.500
4.000
4.500
1940
-194
1
1942
-194
3
1944
-194
5
1946
-194
7
1948
-194
9
1950
-195
1
1952
-195
3
1954
-195
5
1956
-195
7
1958
-195
9
1960
-196
1
1962
-196
3
1964
-196
5
1966
-196
7
1968
-196
9
1970
-197
1
1972
-197
3
1974
-197
5
1976
-197
7
1978
-197
9
1980
-198
1
1982
-198
3
1984
-198
5
1986
-198
7
1988
-198
9
1990
-199
1
1992
-199
3
1994
-199
5
1996
-199
7
1998
-199
9
2000
-200
1
2002
-200
3
2004
-200
5
hm3
Escorrentía Total (hm3) Escorrentía Subterránea (hm
3) Escorrentía Superficial (hm
3) Infiltración (hm
3)
0
200
400
600
800
1.000
1.200
1.400
1940
-194
1
1942
-194
3
1944
-194
5
1946
-194
7
1948
-194
9
1950
-195
1
1952
-195
3
1954
-195
5
1956
-195
7
1958
-195
9
1960
-196
1
1962
-196
3
1964
-196
5
1966
-196
7
1968
-196
9
1970
-197
1
1972
-197
3
1974
-197
5
1976
-197
7
1978
-197
9
1980
-198
1
1982
-198
3
1984
-198
5
1986
-198
7
1988
-198
9
1990
-199
1
1992
-199
3
1994
-199
5
1996
-199
7
1998
-199
9
2000
-200
1
2002
-200
3
2004
-200
5
mm
Evapotranspiración potencial (mm) Evapotranspiración real (mm)
0
100
200
300
400
500
600
700
800
900
1.000
1940
-194
1
1942
-194
3
1944
-194
5
1946
-194
7
1948
-194
9
1950
-195
1
1952
-195
3
1954
-195
5
1956
-195
7
1958
-195
9
1960
-196
1
1962
-196
3
1964
-196
5
1966
-196
7
1968
-196
9
1970
-197
1
1972
-197
3
1974
-197
5
1976
-197
7
1978
-197
9
1980
-198
1
1982
-198
3
1984
-198
5
1986
-198
7
1988
-198
9
1990
-199
1
1992
-199
3
1994
-199
5
1996
-199
7
1998
-199
9
2000
-200
1
2002
-200
3
2004
-200
5
mm
0
4
8
12
16
20ºC
Precipitación (mm) Temperatura (ºC)
0,0
0,1
0,2
0,3
0,4
0,5
0,6
0,7
0,8
0,9
1940
-194
1
1942
-194
3
1944
-194
5
1946
-194
7
1948
-194
9
1950
-195
1
1952
-195
3
1954
-195
5
1956
-195
7
1958
-195
9
1960
-196
1
1962
-196
3
1964
-196
5
1966
-196
7
1968
-196
9
1970
-197
1
1972
-197
3
1974
-197
5
1976
-197
7
1978
-197
9
1980
-198
1
1982
-198
3
1984
-198
5
1986
-198
7
1988
-198
9
1990
-199
1
1992
-199
3
1994
-199
5
1996
-199
7
1998
-199
9
2000
-200
1
2002
-200
3
2004
-200
5
Índice de aridez

37
4.3.1.1.14 SISTEMA DE EXPLOTACIÓN BAJO TAJO (SÓLO LA PARTE
ESPAÑOLA DE LA CUENCA). ACUMULADOS
Serie 1940-2006 E. Sub hm³
E. Sup hm³
E. Total hm³
ETP mm
ETR mm
Infiltr. hm³
Precip. mm
Tª ºC IAR
Nº de datos 66 66 66 66 66 66 66 66 66 Mínimo 751,4 1.649,6 2.500,1 887,7 297,9 414,0 348,0 11,3 0,3
Percentil 10% 898,7 2.457,3 3.356,2 923,3 404,0 614,5 468,8 12,1 0,5 Percentil 15% 1.060,0 2.740,6 3.949,6 932,3 409,7 700,9 491,5 12,4 0,5 Percentil 20% 1.205,7 3.551,7 4.674,5 941,4 416,0 890,6 524,0 12,6 0,5 Percentil 80% 3.082,6 10.939,2 14.271,2 981,6 509,4 3.146,9 779,4 13,9 0,8 Percentil 85% 3.271,7 11.683,9 14.955,5 984,2 519,8 3.369,5 799,7 14,1 0,8 Percentil 90% 3.698,2 13.161,1 16.786,2 988,0 538,4 3.796,5 803,0 14,2 0,9
Máximo 5.155,4 16.440,8 21.500,7 1.032,1 562,2 5.485,7 941,8 15,3 1,1 Media 2.240,4 7.592,4 9.832,8 961,6 462,8 2.099,0 636,3 13,3 0,7
Mediana 2.190,1 7.284,0 9.199,0 967,6 462,7 1.918,3 624,6 13,4 0,6 Desv. Típica 1.113,9 4.259,6 5.333,7 122,2 78,4 1.284,4 160,3 1,8 0,2
Coeficiente de variación 0,4972 0,5610 0,5424 0,1271 0,1695 0,6119 0,2518 0,1390 0,2663 Coeficiente de Sesgo 0,5914 0,4780 0,4878 -0,5350 -0,3255 0,6078 0,1787 -0,4192 0,3244
1er Coeficiente de autocorrelación 0,2024 0,0056 0,0458 0,0542 0,0794 0,0636 0,0586 0,4539 0,0558
Serie 1980-2006 E. Sub hm³
E. Sup hm³
E. Total hm³
ETP mm
ETR mm
Infiltr. hm³
Precip. mm
Tª ºC IAR
Nº de datos 26 26 26 26 26 26 26 26 26 Mínimo 751,4 1.649,6 2.500,1 910,3 297,9 414,0 348,0 11,3 0,3
Percentil 10% 850,4 2.170,0 3.044,2 943,4 382,0 455,2 431,2 13,3 0,4 Percentil 15% 888,6 2.440,5 3.350,2 950,0 402,1 577,4 444,9 13,4 0,5 Percentil 20% 916,1 2.446,8 3.361,5 952,2 409,2 623,6 469,9 13,4 0,5 Percentil 80% 2.773,2 9.424,0 12.455,4 986,7 476,8 2.715,2 678,3 14,4 0,7 Percentil 85% 2.864,0 9.945,3 12.512,2 989,6 489,9 2.895,6 726,1 14,4 0,8 Percentil 90% 2.986,2 11.001,3 13.592,3 992,1 505,2 3.107,2 772,9 14,4 0,8
Máximo 3.579,0 15.210,6 18.789,5 1.007,9 544,0 3.678,0 802,2 15,3 0,8 Media 1.793,1 6.188,9 7.982,0 968,2 441,1 1.647,6 581,6 13,8 0,6
Mediana 1.575,1 5.204,6 6.798,0 969,5 439,7 1.476,8 563,9 13,9 0,6 Desv. Típica 933,5 4.018,1 4.902,1 195,0 103,4 1.078,4 172,0 2,9 0,2
Coeficiente de variación 0,5206 0,6492 0,6141 0,2015 0,2345 0,6545 0,2958 0,2066 0,3024 Coeficiente de Sesgo 0,5496 0,7305 0,6770 -0,8766 -0,3402 0,4858 0,2141 -1,5350 0,2529
1er Coeficiente de autocorrelación 0,2024 0,0056 0,0458 0,0542 0,0794 0,0636 0,0586 0,4539 0,0558
Serie 1940-1980 E. Sub hm³
E. Sup hm³
E. Total hm³
ETP mm
ETR mm
Infiltr. hm³
Precip. mm
Tª ºC IAR
Nº de datos 40 40 40 40 40 40 40 40 40 Mínimo 832,0 2.253,3 3.149,5 887,7 364,0 529,7 410,6 11,3 0,4
Percentil 10% 1.096,7 3.203,1 4.310,1 921,7 409,6 746,9 505,0 12,0 0,5 Percentil 15% 1.410,3 3.925,3 5.304,2 929,4 428,6 934,9 525,9 12,1 0,5 Percentil 20% 1.514,7 4.230,3 5.578,7 932,4 438,0 1.078,7 532,5 12,2 0,6 Percentil 80% 3.288,8 11.665,4 14.936,6 976,9 514,6 3.557,5 799,9 13,6 0,9 Percentil 85% 3.849,5 12.295,6 16.186,7 978,7 530,0 3.884,5 805,5 13,6 0,9 Percentil 90% 4.155,2 15.617,8 19.677,7 981,8 541,1 4.200,5 836,0 13,9 0,9
Máximo 5.155,4 16.440,8 21.500,7 1.032,1 562,2 5.485,7 941,8 14,0 1,1 Media 2.531,0 8.504,7 11.035,8 957,3 476,9 2.392,4 671,9 12,9 0,7
Mediana 2.418,1 7.909,1 10.452,9 964,2 474,9 2.257,4 658,4 13,0 0,7 Desv. Típica 1.186,3 4.368,4 5.524,4 155,9 90,6 1.372,4 174,4 2,2 0,2
Coeficiente de variación 0,4687 0,5136 0,5006 0,1628 0,1900 0,5736 0,2595 0,1691 0,2743 Coeficiente de Sesgo 0,4410 0,3621 0,3707 -0,3183 -0,2145 0,4900 0,1097 -0,4239 0,2624
1er Coeficiente de autocorrelación 0,1493 0,0068 0,0362 0,0113 -0,0626 0,0104 -0,0253 0,4019 -0,0343
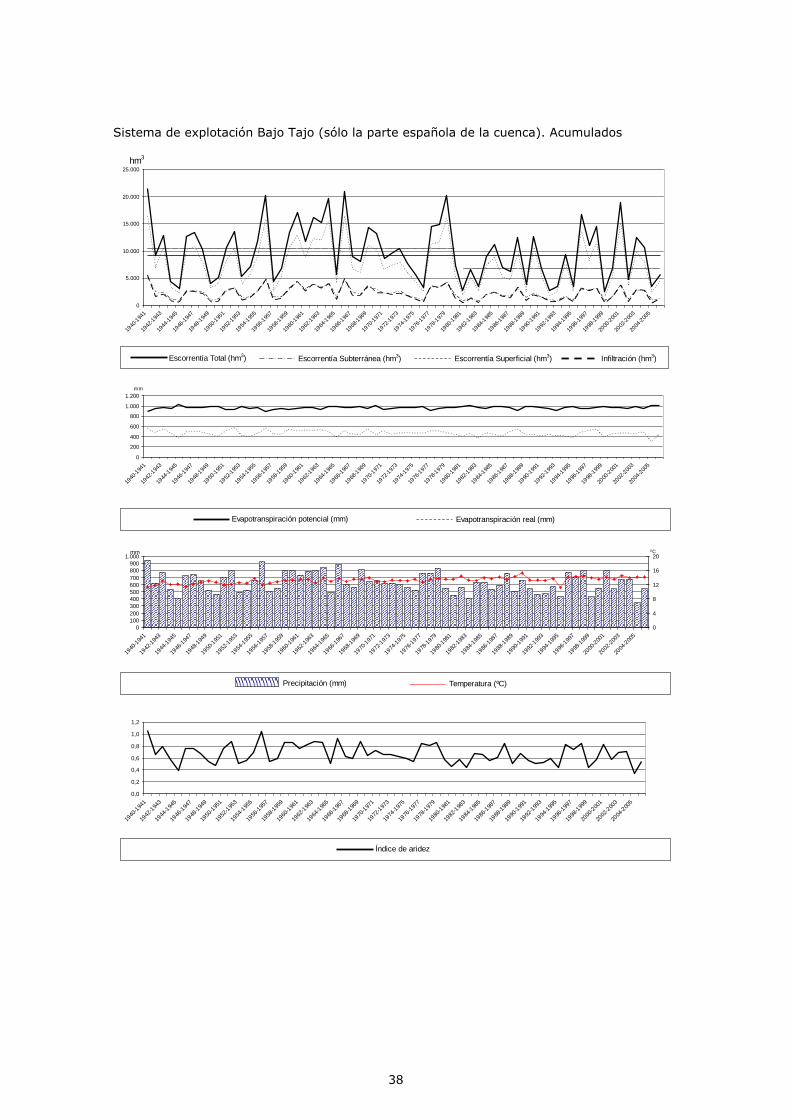
38
Sistema de explotación Bajo Tajo (sólo la parte española de la cuenca). Acumulados
0
5.000
10.000
15.000
20.000
25.000
1940
-194
1
1942
-194
3
1944
-194
5
1946
-194
7
1948
-194
9
1950
-195
1
1952
-195
3
1954
-195
5
1956
-195
7
1958
-195
9
1960
-196
1
1962
-196
3
1964
-196
5
1966
-196
7
1968
-196
9
1970
-197
1
1972
-197
3
1974
-197
5
1976
-197
7
1978
-197
9
1980
-198
1
1982
-198
3
1984
-198
5
1986
-198
7
1988
-198
9
1990
-199
1
1992
-199
3
1994
-199
5
1996
-199
7
1998
-199
9
2000
-200
1
2002
-200
3
2004
-200
5
hm3
Escorrentía Total (hm3) Escorrentía Subterránea (hm
3) Escorrentía Superficial (hm
3) Infiltración (hm
3)
0
200
400
600
800
1.000
1.200
1940
-194
1
1942
-194
3
1944
-194
5
1946
-194
7
1948
-194
9
1950
-195
1
1952
-195
3
1954
-195
5
1956
-195
7
1958
-195
9
1960
-196
1
1962
-196
3
1964
-196
5
1966
-196
7
1968
-196
9
1970
-197
1
1972
-197
3
1974
-197
5
1976
-197
7
1978
-197
9
1980
-198
1
1982
-198
3
1984
-198
5
1986
-198
7
1988
-198
9
1990
-199
1
1992
-199
3
1994
-199
5
1996
-199
7
1998
-199
9
2000
-200
1
2002
-200
3
2004
-200
5
mm
Evapotranspiración potencial (mm) Evapotranspiración real (mm)
0
100
200
300
400
500
600
700
800
900
1.000
1940
-194
1
1942
-194
3
1944
-194
5
1946
-194
7
1948
-194
9
1950
-195
1
1952
-195
3
1954
-195
5
1956
-195
7
1958
-195
9
1960
-196
1
1962
-196
3
1964
-196
5
1966
-196
7
1968
-196
9
1970
-197
1
1972
-197
3
1974
-197
5
1976
-197
7
1978
-197
9
1980
-198
1
1982
-198
3
1984
-198
5
1986
-198
7
1988
-198
9
1990
-199
1
1992
-199
3
1994
-199
5
1996
-199
7
1998
-199
9
2000
-200
1
2002
-200
3
2004
-200
5
mm
0
4
8
12
16
20ºC
Precipitación (mm) Temperatura (ºC)
0,0
0,2
0,4
0,6
0,8
1,0
1,2
1940
-194
1
1942
-194
3
1944
-194
5
1946
-194
7
1948
-194
9
1950
-195
1
1952
-195
3
1954
-195
5
1956
-195
7
1958
-195
9
1960
-196
1
1962
-196
3
1964
-196
5
1966
-196
7
1968
-196
9
1970
-197
1
1972
-197
3
1974
-197
5
1976
-197
7
1978
-197
9
1980
-198
1
1982
-198
3
1984
-198
5
1986
-198
7
1988
-198
9
1990
-199
1
1992
-199
3
1994
-199
5
1996
-199
7
1998
-199
9
2000
-200
1
2002
-200
3
2004
-200
5
Índice de aridez

39
4.3.1.1.15 SISTEMA DE EXPLOTACIÓN BAJO TAJO (INCLUYENDO LA
PARTE PORTUGUESA DE LAS MASAS FRONTERIZAS)
Serie 1940-2006 E. Sub hm³
E. Sup hm³
E. Total hm³
ETP mm
ETR mm
Infiltr. hm³
Precip. mm
Tª ºC IAR
Nº de datos 66 66 66 66 66 66 66 66 66 Mínimo 15,4 137,3 153,6 1.055,1 295,9 2,4 335,5 12,1 0,3
Percentil 10% 27,1 371,7 403,1 1.109,4 392,5 10,0 427,8 14,4 0,3 Percentil 15% 34,5 508,9 536,6 1.118,9 409,5 15,4 451,5 14,5 0,4 Percentil 20% 42,4 572,2 634,0 1.123,0 416,4 25,6 488,8 14,8 0,4 Percentil 80% 152,3 3.002,5 3.142,2 1.188,1 526,4 122,7 764,0 16,0 0,7 Percentil 85% 162,9 3.384,2 3.507,3 1.192,7 541,8 145,5 794,8 16,2 0,7 Percentil 90% 169,5 4.116,0 4.323,1 1.206,1 553,7 155,3 830,2 16,2 0,7
Máximo 225,8 5.176,6 5.380,1 1.233,4 586,7 200,5 886,9 17,1 0,8 Media 98,7 1.899,2 1.997,9 1.154,6 468,0 77,2 610,6 15,4 0,5
Mediana 97,8 1.613,2 1.716,3 1.155,6 465,5 74,9 588,1 15,5 0,5 Desv. Típica 58,6 1.383,3 1.439,5 148,5 86,0 55,9 168,4 2,1 0,2
Coeficiente de variación 0,5935 0,7284 0,7205 0,1286 0,1839 0,7237 0,2758 0,1354 0,3082 Coeficiente de Sesgo 0,4391 0,7148 0,7014 -0,2985 -0,2684 0,5518 0,1914 -1,1092 0,2175
1er Coeficiente de autocorrelación 0,0411 0,0279 0,0281 0,3249 0,0949 0,0059 0,0870 0,3079 0,1132
Serie 1980-2006 E. Sub hm³
E. Sup hm³
E. Total hm³
ETP mm
ETR mm
Infiltr. hm³
Precip. mm
Tª ºC IAR
Nº de datos 26 26 26 26 26 26 26 26 26 Mínimo 15,4 137,3 153,6 1.071,4 295,9 2,4 335,5 12,1 0,3
Percentil 10% 17,5 230,4 247,6 1.127,9 365,4 4,7 383,0 15,2 0,3 Percentil 15% 18,3 264,9 283,0 1.140,0 373,7 7,9 400,4 15,3 0,3 Percentil 20% 19,0 329,4 347,8 1.146,4 406,3 9,0 426,5 15,5 0,3 Percentil 80% 117,8 2.394,8 2.541,7 1.180,9 498,2 92,1 676,8 16,2 0,6 Percentil 85% 127,3 2.794,2 2.912,8 1.191,5 503,8 112,7 691,9 16,3 0,6 Percentil 90% 156,1 3.437,8 3.584,4 1.198,5 525,5 139,3 770,9 16,4 0,7
Máximo 219,5 4.609,8 4.829,3 1.228,0 570,0 200,5 838,3 17,1 0,7 Media 78,3 1.534,3 1.612,6 1.160,6 446,6 63,3 561,9 15,7 0,5
Mediana 64,6 1.191,5 1.254,9 1.156,9 449,0 55,7 538,6 15,8 0,4 Desv. Típica 57,2 1.346,9 1.402,4 234,6 110,4 54,3 184,4 3,3 0,2
Coeficiente de variación 0,7306 0,8779 0,8696 0,2021 0,2471 0,8583 0,3282 0,2077 0,3615 Coeficiente de Sesgo 0,8408 1,0497 1,0366 -0,6200 -0,1390 0,9276 0,3587 -2,7892 0,4094
1er Coeficiente de autocorrelación 0,0411 0,0279 0,0281 0,3249 0,0949 0,0059 0,0870 0,3079 0,1132
Serie 1940-1980 E. Sub hm³
E. Sup hm³
E. Total hm³
ETP mm
ETR mm
Infiltr. hm³
Precip. mm
Tª ºC IAR
Nº de datos 40 40 40 40 40 40 40 40 40 Mínimo 26,7 376,5 404,4 1.055,1 320,4 4,9 348,0 13,6 0,3
Percentil 10% 41,5 517,2 558,7 1.106,7 414,8 16,0 485,4 14,1 0,4 Percentil 15% 51,5 831,3 900,0 1.113,1 424,9 25,3 492,5 14,4 0,4 Percentil 20% 62,8 943,8 988,3 1.119,0 434,2 34,1 501,6 14,5 0,4 Percentil 80% 158,9 3.222,4 3.370,6 1.188,1 539,0 138,5 791,4 15,8 0,7 Percentil 85% 166,3 3.487,1 3.659,7 1.195,8 549,2 152,3 805,0 16,0 0,7 Percentil 90% 203,7 4.232,3 4.433,6 1.207,0 555,1 173,1 867,2 16,1 0,7
Máximo 225,8 5.176,6 5.380,1 1.233,4 586,7 199,9 886,9 16,4 0,8 Media 111,9 2.136,4 2.248,3 1.150,7 481,8 86,3 642,3 15,1 0,5
Mediana 109,7 1.708,8 1.824,8 1.148,1 486,6 81,6 627,7 15,2 0,5 Desv. Típica 58,2 1.401,7 1.457,2 189,0 97,4 56,9 178,8 2,5 0,2
Coeficiente de variación 0,5203 0,6561 0,6481 0,1643 0,2021 0,6597 0,2784 0,1672 0,3064 Coeficiente de Sesgo 0,3118 0,6017 0,5896 -0,1014 -0,2993 0,3804 0,1362 -0,2176 0,1441
1er Coeficiente de autocorrelación 0,0791 0,1095 0,1086 0,3313 0,0322 0,0893 0,1081 0,4291 0,1530
Nota: Las aportaciones de la cuenca vertiente portuguesa se han estimado mediante una correlación
superficial.

40
Sistema de explotación Bajo Tajo (incluyendo la parte portuguesa de las masas fronterizas)
0
1.000
2.000
3.000
4.000
5.000
6.000
1940
-194
1
1942
-194
3
1944
-194
5
1946
-194
7
1948
-194
9
1950
-195
1
1952
-195
3
1954
-195
5
1956
-195
7
1958
-195
9
1960
-196
1
1962
-196
3
1964
-196
5
1966
-196
7
1968
-196
9
1970
-197
1
1972
-197
3
1974
-197
5
1976
-197
7
1978
-197
9
1980
-198
1
1982
-198
3
1984
-198
5
1986
-198
7
1988
-198
9
1990
-199
1
1992
-199
3
1994
-199
5
1996
-199
7
1998
-199
9
2000
-200
1
2002
-200
3
2004
-200
5
hm3
Escorrentía Total (hm3) Escorrentía Subterránea (hm
3) Escorrentía Superficial (hm
3) Infiltración (hm
3)
0
200
400
600
800
1.000
1.200
1.400
1940
-194
1
1942
-194
3
1944
-194
5
1946
-194
7
1948
-194
9
1950
-195
1
1952
-195
3
1954
-195
5
1956
-195
7
1958
-195
9
1960
-196
1
1962
-196
3
1964
-196
5
1966
-196
7
1968
-196
9
1970
-197
1
1972
-197
3
1974
-197
5
1976
-197
7
1978
-197
9
1980
-198
1
1982
-198
3
1984
-198
5
1986
-198
7
1988
-198
9
1990
-199
1
1992
-199
3
1994
-199
5
1996
-199
7
1998
-199
9
2000
-200
1
2002
-200
3
2004
-200
5
mm
Evapotranspiración potencial (mm) Evapotranspiración real (mm)
0
100
200
300
400
500
600
700
800
900
1.000
1940
-194
1
1942
-194
3
1944
-194
5
1946
-194
7
1948
-194
9
1950
-195
1
1952
-195
3
1954
-195
5
1956
-195
7
1958
-195
9
1960
-196
1
1962
-196
3
1964
-196
5
1966
-196
7
1968
-196
9
1970
-197
1
1972
-197
3
1974
-197
5
1976
-197
7
1978
-197
9
1980
-198
1
1982
-198
3
1984
-198
5
1986
-198
7
1988
-198
9
1990
-199
1
1992
-199
3
1994
-199
5
1996
-199
7
1998
-199
9
2000
-200
1
2002
-200
3
2004
-200
5
mm
0
4
8
12
16
20ºC
Precipitación (mm) Temperatura (ºC)
0,0
0,1
0,2
0,3
0,4
0,5
0,6
0,7
0,8
0,9
1940
-194
1
1942
-194
3
1944
-194
5
1946
-194
7
1948
-194
9
1950
-195
1
1952
-195
3
1954
-195
5
1956
-195
7
1958
-195
9
1960
-196
1
1962
-196
3
1964
-196
5
1966
-196
7
1968
-196
9
1970
-197
1
1972
-197
3
1974
-197
5
1976
-197
7
1978
-197
9
1980
-198
1
1982
-198
3
1984
-198
5
1986
-198
7
1988
-198
9
1990
-199
1
1992
-199
3
1994
-199
5
1996
-199
7
1998
-199
9
2000
-200
1
2002
-200
3
2004
-200
5
Índice de aridez

41
4.3.1.1.16 SISTEMA DE EXPLOTACIÓN BAJO TAJO (INCLUYENDO LA
PARTE PORTUGUESA DE LAS MASAS FRONTERIZAS).
ACUMULADOS
Serie 1940-2006 E. Sub hm³
E. Sup hm³
E. Total hm³
ETP mm
ETR mm
Infiltr. hm³
Precip. mm
Tª ºC IAR
Nº de datos 66 66 66 66 66 66 66 66 66 Mínimo 751,8 1.676,3 2.527,3 893,6 296,5 414,4 344,8 11,4 0,3
Percentil 10% 899,0 2.510,6 3.426,5 932,7 402,1 615,0 467,9 12,3 0,5 Percentil 15% 1.060,9 2.810,4 4.054,1 944,5 409,3 702,5 486,7 12,5 0,5 Percentil 20% 1.206,8 3.700,4 4.824,2 952,3 414,7 891,0 519,8 12,7 0,5 Percentil 80% 3.086,2 11.559,0 14.893,6 992,6 508,9 3.150,3 778,5 14,0 0,8 Percentil 85% 3.274,6 12.318,6 15.648,4 996,1 519,4 3.371,7 796,8 14,2 0,8 Percentil 90% 3.702,1 13.961,1 17.589,6 999,0 538,4 3.799,7 802,9 14,3 0,8
Máximo 5.160,7 17.479,4 22.268,5 1.041,9 562,6 5.490,4 934,6 15,4 1,0 Media 2.242,5 7.967,1 10.209,6 972,1 461,9 2.101,1 632,8 13,4 0,7
Mediana 2.191,3 7.639,6 9.537,3 977,6 460,3 1.920,7 620,1 13,5 0,6 Desv. Típica 1.115,1 4.542,2 5.614,3 123,6 78,6 1.285,7 160,1 1,9 0,2
Coeficiente de variación 0,4973 0,5701 0,5499 0,1272 0,1701 0,6119 0,2530 0,1384 0,2674
Coeficiente de Sesgo 0,5913 0,4962 0,4998 -0,5637 -0,3108 0,6076 0,1826 -0,4225 0,3272 1er Coeficiente de
autocorrelación 0,2024 0,0091 0,0465 0,0708 0,0822 0,0636 0,0628 0,4406 0,0623
Serie 1980-2006 E. Sub hm³
E. Sup hm³
E. Total hm³
ETP mm
ETR mm
Infiltr. hm³
Precip. mm
Tª ºC IAR
Nº de datos 26 26 26 26 26 26 26 26 26 Mínimo 751,8 1.676,3 2.527,3 918,0 296,5 414,4 344,8 11,4 0,3
Percentil 10% 851,0 2.204,1 3.068,8 953,7 380,8 455,5 428,4 13,4 0,4 Percentil 15% 888,9 2.478,8 3.412,5 959,9 398,9 577,6 440,1 13,4 0,4 Percentil 20% 916,4 2.492,0 3.429,2 963,9 408,6 624,1 466,6 13,5 0,5 Percentil 80% 2.775,8 9.769,6 12.802,7 998,8 476,3 2.717,5 671,8 14,4 0,7 Percentil 85% 2.866,3 10.474,3 13.044,5 999,3 485,9 2.899,5 721,8 14,5 0,8 Percentil 90% 2.988,5 11.677,2 14.271,4 1.002,6 504,0 3.110,7 769,8 14,5 0,8
Máximo 3.583,2 16.056,6 19.639,8 1.018,9 543,1 3.682,7 800,2 15,4 0,8 Media 1.794,8 6.478,3 8.273,1 978,0 440,2 1.649,3 578,4 13,9 0,6
Mediana 1.576,1 5.407,3 7.006,8 979,1 439,4 1.478,9 558,6 14,0 0,6 Desv. Típica 934,6 4.276,9 5.158,7 197,1 103,3 1.079,6 171,6 2,9 0,2
Coeficiente de variación 0,5207 0,6602 0,6235 0,2015 0,2348 0,6546 0,2966 0,2065 0,3033
Coeficiente de Sesgo 0,5495 0,7445 0,6897 -0,8574 -0,3386 0,4856 0,2123 -1,5696 0,2546 1er Coeficiente de
autocorrelación 0,2024 0,0091 0,0465 0,0708 0,0822 0,0636 0,0628 0,4406 0,0623
Serie 1940-1980 E. Sub hm³
E. Sup hm³
E. Total hm³
ETP mm
ETR mm
Infiltr. hm³
Precip. mm
Tª ºC IAR
Nº de datos 40 40 40 40 40 40 40 40 40 Mínimo 832,3 2.312,9 3.209,3 893,6 358,5 530,0 403,8 11,5 0,4
Percentil 10% 1.098,8 3.278,2 4.381,9 928,8 409,3 747,3 500,6 12,1 0,5 Percentil 15% 1.411,4 4.079,5 5.411,2 939,5 433,0 935,6 522,7 12,3 0,5 Percentil 20% 1.516,2 4.435,3 5.781,6 944,7 435,5 1.079,6 525,8 12,4 0,6 Percentil 80% 3.292,3 12.288,3 15.606,5 989,1 513,9 3.560,3 797,4 13,7 0,8 Percentil 85% 3.853,3 13.058,3 16.765,5 990,2 529,6 3.888,1 807,4 13,7 0,8 Percentil 90% 4.159,5 16.638,9 20.870,9 994,0 540,6 4.205,1 833,6 14,0 0,9
Máximo 5.160,7 17.479,4 22.268,5 1.041,9 562,6 5.490,4 934,6 14,1 1,0 Media 2.533,5 8.934,8 11.468,3 968,2 476,0 2.394,7 668,2 13,0 0,7
Mediana 2.421,0 8.163,3 10.699,0 975,3 473,3 2.258,8 652,8 13,1 0,7 Desv. Típica 1.187,6 4.660,2 5.814,2 157,7 90,7 1.373,6 174,2 2,2 0,2
Coeficiente de variación 0,4687 0,5216 0,5070 0,1629 0,1906 0,5736 0,2608 0,1687 0,2756
Coeficiente de Sesgo 0,4412 0,3834 0,3847 -0,3757 -0,2003 0,4900 0,1140 -0,4033 0,2654 1er Coeficiente de
autocorrelación 0,1493 0,0134 0,0400 0,0281 -0,0550 0,0104 -0,0168 0,3848 -0,0226
Nota: Las aportaciones de la cuenca vertiente portuguesa se han estimado mediante una correlación
superficial.

42
Sistema de explotación Bajo Tajo (incluyendo la parte portuguesa de las masas fronterizas).
Acumulados
0
5.000
10.000
15.000
20.000
25.000
1940
-194
1
1942
-194
3
1944
-194
5
1946
-194
7
1948
-194
9
1950
-195
1
1952
-195
3
1954
-195
5
1956
-195
7
1958
-195
9
1960
-196
1
1962
-196
3
1964
-196
5
1966
-196
7
1968
-196
9
1970
-197
1
1972
-197
3
1974
-197
5
1976
-197
7
1978
-197
9
1980
-198
1
1982
-198
3
1984
-198
5
1986
-198
7
1988
-198
9
1990
-199
1
1992
-199
3
1994
-199
5
1996
-199
7
1998
-199
9
2000
-200
1
2002
-200
3
2004
-200
5
hm3
Escorrentía Total (hm3) Escorrentía Subterránea (hm
3) Escorrentía Superficial (hm
3) Infiltración (hm
3)
0
200
400
600
800
1.000
1.200
1940
-194
1
1942
-194
3
1944
-194
5
1946
-194
7
1948
-194
9
1950
-195
1
1952
-195
3
1954
-195
5
1956
-195
7
1958
-195
9
1960
-196
1
1962
-196
3
1964
-196
5
1966
-196
7
1968
-196
9
1970
-197
1
1972
-197
3
1974
-197
5
1976
-197
7
1978
-197
9
1980
-198
1
1982
-198
3
1984
-198
5
1986
-198
7
1988
-198
9
1990
-199
1
1992
-199
3
1994
-199
5
1996
-199
7
1998
-199
9
2000
-200
1
2002
-200
3
2004
-200
5
mm
Evapotranspiración potencial (mm) Evapotranspiración real (mm)
0
100200
300400
500
600700
800900
1.000
1940
-194
1
1942
-194
3
1944
-194
5
1946
-194
7
1948
-194
9
1950
-195
1
1952
-195
3
1954
-195
5
1956
-195
7
1958
-195
9
1960
-196
1
1962
-196
3
1964
-196
5
1966
-196
7
1968
-196
9
1970
-197
1
1972
-197
3
1974
-197
5
1976
-197
7
1978
-197
9
1980
-198
1
1982
-198
3
1984
-198
5
1986
-198
7
1988
-198
9
1990
-199
1
1992
-199
3
1994
-199
5
1996
-199
7
1998
-199
9
2000
-200
1
2002
-200
3
2004
-200
5
mm
0
24
68
10
1214
1618
20ºC
Precipitación (mm) Temperatura (ºC)
0,0
0,2
0,4
0,6
0,8
1,0
1,2
1940
-194
1
1942
-194
3
1944
-194
5
1946
-194
7
1948
-194
9
1950
-195
1
1952
-195
3
1954
-195
5
1956
-195
7
1958
-195
9
1960
-196
1
1962
-196
3
1964
-196
5
1966
-196
7
1968
-196
9
1970
-197
1
1972
-197
3
1974
-197
5
1976
-197
7
1978
-197
9
1980
-198
1
1982
-198
3
1984
-198
5
1986
-198
7
1988
-198
9
1990
-199
1
1992
-199
3
1994
-199
5
1996
-199
7
1998
-199
9
2000
-200
1
2002
-200
3
2004
-200
5
Índice de aridez

43
4.3.1.2 SERIES MENSUALES
A continuación se indica la distribución intraanual de la escorrentía subterránea, escorrentía
superficial, escorrentía total, infiltración, evapotranspiración potencial, evapotranspiración
real, precipitación, temperatura e índice de aridez por sistema de explotación.
Sistema de explotación Cabecera. Valores medios mensuales
Serie 1940-2006 Serie 1980-2006 Serie 1940-1980
0
50
100
150
200
250
OCT NOV DIC ENE FEB M AR ABR M AY JUN JUL AGO SEP
hm3
0
50
100
150
200
250
OCT NOV DIC ENE FEB M AR ABR M AY JUN JUL AGO SEP
hm3
0
50
100
150
200
250
OCT NOV DIC ENE FEB M AR ABR M AY JUN JUL AGO SEP
hm3
Escorrentía Total (hm3) Escorrentía Subterránea (hm
3) Escorrentía Superficial (hm
3) Infiltración (hm
3)
0
20
40
60
80
100
120
140
OCT NOV DIC ENE FEB M AR ABR M AY JUN JUL AGO SEP
mm
0
20
40
60
80
100
120
140
OCT NOV DIC ENE FEB M AR ABR M AY JUN JUL AGO SEP
mm
0
20
40
60
80
100
120
140
OCT NOV DIC ENE FEB M AR ABR M AY JUN JUL AGO SEP
mm
Evapotranspiración potencial (mm) Evapotranspiración real (mm)
0
10
20
30
40
50
60
70
80
OCT NOV DIC ENE FEB M AR ABR M AY JUN JUL AGO SEP
mm
0
5
10
15
20
25
ºC
0
10
20
30
40
50
60
70
80
OCT NOV DIC ENE FEB M AR ABR M AY JUN JUL AGO SEP
mm
0
5
10
15
20
25
ºC
0
10
20
30
40
50
60
70
80
OCT NOV DIC ENE FEB M AR ABR M AY JUN JUL AGO SEP
mm
0
5
10
15
20
25
ºC
Precipitación (mm) Temperatura (ºC)
0
1
2
3
4
5
6
OCT NOV DIC ENE FEB M AR ABR M AY JUN JUL AGO SEP
0
1
2
3
4
5
6
OCT NOV DIC ENE FEB M AR ABR M AY JUN JUL AGO SEP
0
1
2
3
4
5
6
OCT NOV DIC ENE FEB M AR ABR M AY JUN JUL AGO SEP
Índice de aridez

44
Sistema de explotación Tajuña. Valores medios mensuales
Serie 1940-2006 Serie 1980-2006 Serie 1940-1980
0
5
10
15
20
25
30
35
40
OCT NOV DIC ENE FEB M AR ABR M AY JUN JUL AGO SEP
hm3
0
5
10
15
20
25
30
35
40
OCT NOV DIC ENE FEB M AR ABR M AY JUN JUL AGO SEP
hm3
0
5
10
15
20
25
30
35
40
OCT NOV DIC ENE FEB M AR ABR M AY JUN JUL AGO SEP
hm3
Escorrentía Total (hm3) Escorrentía Subterránea (hm
3) Escorrentía Superficial (hm
3) Infiltración (hm
3)
0
20
40
60
80
100
120
140
160
OCT NOV DIC ENE FEB M AR ABR M AY JUN JUL AGO SEP
mm
0
20
40
60
80
100
120
140
160
OCT NOV DIC ENE FEB M AR ABR M AY JUN JUL AGO SEP
mm
0
20
40
60
80
100
120
140
160
OCT NOV DIC ENE FEB M AR ABR M AY JUN JUL AGO SEP
mm
Evapotranspiración potencial (mm) Evapotranspiración real (mm)
0
10
20
30
40
50
60
70
OCT NOV DIC ENE FEB M AR ABR M AY JUN JUL AGO SEP
mm
0
5
10
15
20
25
30
35
ºC
0
10
20
30
40
50
60
70
OCT NOV DIC ENE FEB M AR ABR M AY JUN JUL AGO SEP
mm
0
5
10
15
20
25
30
35
ºC
0
10
20
30
40
50
60
70
OCT NOV DIC ENE FEB M AR ABR M AY JUN JUL AGO SEP
mm
0
5
10
15
20
25
30
35
ºC
Precipitación (mm) Temperatura (ºC)
0
1
1
2
2
3
3
4
4
5
OCT NOV DIC ENE FEB M AR ABR M AY JUN JUL AGO SEP
0
1
1
2
2
3
3
4
4
5
OCT NOV DIC ENE FEB M AR ABR M AY JUN JUL AGO SEP
0
1
1
2
2
3
3
4
4
5
OCT NOV DIC ENE FEB M AR ABR M AY JUN JUL AGO SEP
Índice de aridez

45
Sistema de explotación Henares. Valores medios mensuales
Serie 1940-2006 Serie 1980-2006 Serie 1940-1980
0
10
20
30
40
50
60
70
80
90
100
OCT NOV DIC ENE FEB M AR ABR M AY JUN JUL AGO SEP
hm3
0
10
20
30
40
50
60
70
80
90
100
OCT NOV DIC ENE FEB M AR ABR M AY JUN JUL AGO SEP
hm3
0
10
20
30
40
50
60
70
80
90
100
OCT NOV DIC ENE FEB M AR ABR M AY JUN JUL AGO SEP
hm3
Escorrentía Total (hm3) Escorrentía Subterránea (hm
3) Escorrentía Superficial (hm
3) Infiltración (hm
3)
0
20
40
60
80
100
120
140
160
OCT NOV DIC ENE FEB M AR ABR M AY JUN JUL AGO SEP
mm
0
20
40
60
80
100
120
140
160
OCT NOV DIC ENE FEB M AR ABR M AY JUN JUL AGO SEP
mm
0
20
40
60
80
100
120
140
160
OCT NOV DIC ENE FEB M AR ABR M AY JUN JUL AGO SEP
mm
Evapotranspiración potencial (mm) Evapotranspiración real (mm)
0
10
20
30
40
50
60
70
80
OCT NOV DIC ENE FEB M AR ABR M AY JUN JUL AGO SEP
mm
0
5
10
15
20
25
ºC
0
10
20
30
40
50
60
70
80
OCT NOV DIC ENE FEB M AR ABR M AY JUN JUL AGO SEP
mm
0
5
10
15
20
25
ºC
0
10
20
30
40
50
60
70
80
OCT NOV DIC ENE FEB M AR ABR M AY JUN JUL AGO SEP
mm
0
5
10
15
20
25
ºC
Precipitación (mm) Temperatura (ºC)
0
1
2
3
4
5
6
OCT NOV DIC ENE FEB M AR ABR M AY JUN JUL AGO SEP
0
1
2
3
4
5
6
OCT NOV DIC ENE FEB M AR ABR M AY JUN JUL AGO SEP
0
1
2
3
4
5
6
OCT NOV DIC ENE FEB M AR ABR M AY JUN JUL AGO SEP
Índice de aridez

46
Sistema de explotación Madrid. Valores medios mensuales
Serie 1940-2006 Serie 1980-2006 Serie 1940-1980
0
20
40
60
80
100
120
140
160
180
OCT NOV DIC ENE FEB M AR ABR M AY JUN JUL AGO SEP
hm3
0
20
40
60
80
100
120
140
160
180
OCT NOV DIC ENE FEB M AR ABR M AY JUN JUL AGO SEP
hm3
0
20
40
60
80
100
120
140
160
180
OCT NOV DIC ENE FEB M AR ABR M AY JUN JUL AGO SEP
hm3
Escorrentía Total (hm3) Escorrentía Subterránea (hm
3) Escorrentía Superficial (hm
3) Infiltración (hm
3)
0
20
40
60
80
100
120
140
160
180
OCT NOV DIC ENE FEB M AR ABR M AY JUN JUL AGO SEP
mm
0
20
40
60
80
100
120
140
160
180
OCT NOV DIC ENE FEB M AR ABR M AY JUN JUL AGO SEP
mm
0
20
40
60
80
100
120
140
160
180
OCT NOV DIC ENE FEB M AR ABR M AY JUN JUL AGO SEP
mm
Evapotranspiración potencial (mm) Evapotranspiración real (mm)
0
10
20
30
40
50
60
70
80
OCT NOV DIC ENE FEB M AR ABR M AY JUN JUL AGO SEP
mm
0
5
10
15
20
25
ºC
0
10
20
30
40
50
60
70
80
OCT NOV DIC ENE FEB M AR ABR M AY JUN JUL AGO SEP
mm
0
5
10
15
20
25
ºC
0
10
20
30
40
50
60
70
80
OCT NOV DIC ENE FEB M AR ABR M AY JUN JUL AGO SEP
mm
0
5
10
15
20
25
ºC
Precipitación (mm) Temperatura (ºC)
0
1
1
2
2
3
3
4
4
5
OCT NOV DIC ENE FEB M AR ABR M AY JUN JUL AGO SEP
0
1
1
2
2
3
3
4
4
5
OCT NOV DIC ENE FEB M AR ABR M AY JUN JUL AGO SEP
0
1
1
2
2
3
3
4
4
5
OCT NOV DIC ENE FEB M AR ABR M AY JUN JUL AGO SEP
Índice de aridez

47
Sistema de explotación Madrid. Valores medios mensuales. Acumulados
Serie 1940-2006 Serie 1980-2006 Serie 1940-1980
0
50
100
150
200
250
300
OCT NOV DIC ENE FEB M AR ABR M AY JUN JUL AGO SEP
hm3
0
50
100
150
200
250
300
OCT NOV DIC ENE FEB M AR ABR M AY JUN JUL AGO SEP
hm3
0
50
100
150
200
250
300
OCT NOV DIC ENE FEB M AR ABR M AY JUN JUL AGO SEP
hm3
Escorrentía Total (hm3) Escorrentía Subterránea (hm
3) Escorrentía Superficial (hm
3) Infiltración (hm
3)
0
20
40
60
80
100
120
140
160
180
OCT NOV DIC ENE FEB M AR ABR M AY JUN JUL AGO SEP
mm
0
20
40
60
80
100
120
140
160
180
OCT NOV DIC ENE FEB M AR ABR M AY JUN JUL AGO SEP
mm
0
20
40
60
80
100
120
140
160
180
OCT NOV DIC ENE FEB M AR ABR M AY JUN JUL AGO SEP
mm
Evapotranspiración potencial (mm) Evapotranspiración real (mm)
0
10
20
30
40
50
60
70
80
OCT NOV DIC ENE FEB M AR ABR M AY JUN JUL AGO SEP
mm
0
5
10
15
20
25
ºC
0
10
20
30
40
50
60
70
80
OCT NOV DIC ENE FEB M AR ABR M AY JUN JUL AGO SEP
mm
0
5
10
15
20
25
ºC
0
10
20
30
40
50
60
70
80
OCT NOV DIC ENE FEB M AR ABR M AY JUN JUL AGO SEP
mm
0
5
10
15
20
25
ºC
Precipitación (mm) Temperatura (ºC)
0
1
1
2
2
3
3
4
4
5
5
OCT NOV DIC ENE FEB M AR ABR M AY JUN JUL AGO SEP
0
1
1
2
2
3
3
4
4
5
5
OCT NOV DIC ENE FEB M AR ABR M AY JUN JUL AGO SEP
0
1
1
2
2
3
3
4
4
5
5
OCT NOV DIC ENE FEB M AR ABR M AY JUN JUL AGO SEP
Índice de aridez

48
Sistema de explotación Alberche. Valores medios mensuales
Serie 1940-2006 Serie 1980-2006 Serie 1940-1980
0
20
40
60
80
100
120
140
OCT NOV DIC ENE FEB M AR ABR M AY JUN JUL AGO SEP
hm3
0
20
40
60
80
100
120
140
OCT NOV DIC ENE FEB M AR ABR M AY JUN JUL AGO SEP
hm3
0
20
40
60
80
100
120
140
OCT NOV DIC ENE FEB M AR ABR M AY JUN JUL AGO SEP
hm3
Escorrentía Total (hm3) Escorrentía Subterránea (hm
3) Escorrentía Superficial (hm
3) Infiltración (hm
3)
0
20
40
60
80
100
120
140
160
180
200
OCT NOV DIC ENE FEB M AR ABR M AY JUN JUL AGO SEP
mm
0
20
40
60
80
100
120
140
160
180
200
OCT NOV DIC ENE FEB M AR ABR M AY JUN JUL AGO SEP
mm
0
20
40
60
80
100
120
140
160
180
200
OCT NOV DIC ENE FEB M AR ABR M AY JUN JUL AGO SEP
mm
Evapotranspiración potencial (mm) Evapotranspiración real (mm)
0
10
20
30
40
50
60
70
80
90
OCT NOV DIC ENE FEB M AR ABR M AY JUN JUL AGO SEP
mm
0
5
10
15
20
25
30
ºC
0
10
20
30
40
50
60
70
80
90
OCT NOV DIC ENE FEB M AR ABR M AY JUN JUL AGO SEP
mm
0
5
10
15
20
25
30
ºC
0
10
20
30
40
50
60
70
80
90
OCT NOV DIC ENE FEB M AR ABR M AY JUN JUL AGO SEP
mm
0
5
10
15
20
25
30
ºC
Precipitación (mm) Temperatura (ºC)
0
1
1
2
2
3
3
4
4
5
OCT NOV DIC ENE FEB M AR ABR M AY JUN JUL AGO SEP
0
1
1
2
2
3
3
4
4
5
OCT NOV DIC ENE FEB M AR ABR M AY JUN JUL AGO SEP
0
1
1
2
2
3
3
4
4
5
OCT NOV DIC ENE FEB M AR ABR M AY JUN JUL AGO SEP
Índice de aridez

49
Sistema de explotación Tajo Izquierda. Valores medios mensuales
Serie 1940-2006 Serie 1980-2006 Serie 1940-1980
0
20
40
60
80
100
120
140
OCT NOV DIC ENE FEB M AR ABR M AY JUN JUL AGO SEP
hm3
0
20
40
60
80
100
120
140
OCT NOV DIC ENE FEB M AR ABR M AY JUN JUL AGO SEP
hm3
0
20
40
60
80
100
120
140
OCT NOV DIC ENE FEB M AR ABR M AY JUN JUL AGO SEP
hm3
Escorrentía Total (hm3) Escorrentía Subterránea (hm
3) Escorrentía Superficial (hm
3) Infiltración (hm
3)
0
20
40
60
80
100
120
140
160
180
OCT NOV DIC ENE FEB M AR ABR M AY JUN JUL AGO SEP
mm
0
20
40
60
80
100
120
140
160
180
OCT NOV DIC ENE FEB M AR ABR M AY JUN JUL AGO SEP
mm
0
20
40
60
80
100
120
140
160
180
OCT NOV DIC ENE FEB M AR ABR M AY JUN JUL AGO SEP
mm
Evapotranspiración potencial (mm) Evapotranspiración real (mm)
0
10
20
30
40
50
60
70
OCT NOV DIC ENE FEB M AR ABR M AY JUN JUL AGO SEP
mm
0
5
10
15
20
25
30
35
ºC
0
10
20
30
40
50
60
70
OCT NOV DIC ENE FEB M AR ABR M AY JUN JUL AGO SEP
mm
0
5
10
15
20
25
30
35
ºC
0
10
20
30
40
50
60
70
OCT NOV DIC ENE FEB M AR ABR M AY JUN JUL AGO SEP
mm
0
5
10
15
20
25
30
35
ºC
Precipitación (mm) Temperatura (ºC)
0
1
1
2
2
3
3
OCT NOV DIC ENE FEB M AR ABR M AY JUN JUL AGO SEP
0
1
1
2
2
3
3
OCT NOV DIC ENE FEB M AR ABR M AY JUN JUL AGO SEP
0
1
1
2
2
3
3
OCT NOV DIC ENE FEB M AR ABR M AY JUN JUL AGO SEP
Índice de aridez

50
Sistema de explotación Tajo Izquierda. Valores medios mensuales. Acumulados
Serie 1940-2006 Serie 1980-2006 Serie 1940-1980
0
100
200
300
400
500
600
700
800
OCT NOV DIC ENE FEB M AR ABR M AY JUN JUL AGO SEP
hm3
0
100
200
300
400
500
600
700
800
OCT NOV DIC ENE FEB M AR ABR M AY JUN JUL AGO SEP
hm3
0
100
200
300
400
500
600
700
800
OCT NOV DIC ENE FEB M AR ABR M AY JUN JUL AGO SEP
hm3
Escorrentía Total (hm3) Escorrentía Subterránea (hm
3) Escorrentía Superficial (hm
3) Infiltración (hm
3)
0
20
40
60
80
100
120
140
160
180
OCT NOV DIC ENE FEB M AR ABR M AY JUN JUL AGO SEP
mm
0
20
40
60
80
100
120
140
160
180
OCT NOV DIC ENE FEB M AR ABR M AY JUN JUL AGO SEP
mm
0
20
40
60
80
100
120
140
160
180
OCT NOV DIC ENE FEB M AR ABR M AY JUN JUL AGO SEP
mm
Evapotranspiración potencial (mm) Evapotranspiración real (mm)
0
10
20
30
40
50
60
70
OCT NOV DIC ENE FEB M AR ABR M AY JUN JUL AGO SEP
mm
0
5
10
15
20
25
30
35
ºC
0
10
20
30
40
50
60
70
OCT NOV DIC ENE FEB M AR ABR M AY JUN JUL AGO SEP
mm
0
5
10
15
20
25
30
35
ºC
0
10
20
30
40
50
60
70
OCT NOV DIC ENE FEB M AR ABR M AY JUN JUL AGO SEP
mm
0
5
10
15
20
25
30
35
ºC
Precipitación (mm) Temperatura (ºC)
0
1
1
2
2
3
3
4
4
5
OCT NOV DIC ENE FEB M AR ABR M AY JUN JUL AGO SEP
0
1
1
2
2
3
3
4
4
5
OCT NOV DIC ENE FEB M AR ABR M AY JUN JUL AGO SEP
0
1
1
2
2
3
3
4
4
5
OCT NOV DIC ENE FEB M AR ABR M AY JUN JUL AGO SEP
Índice de aridez
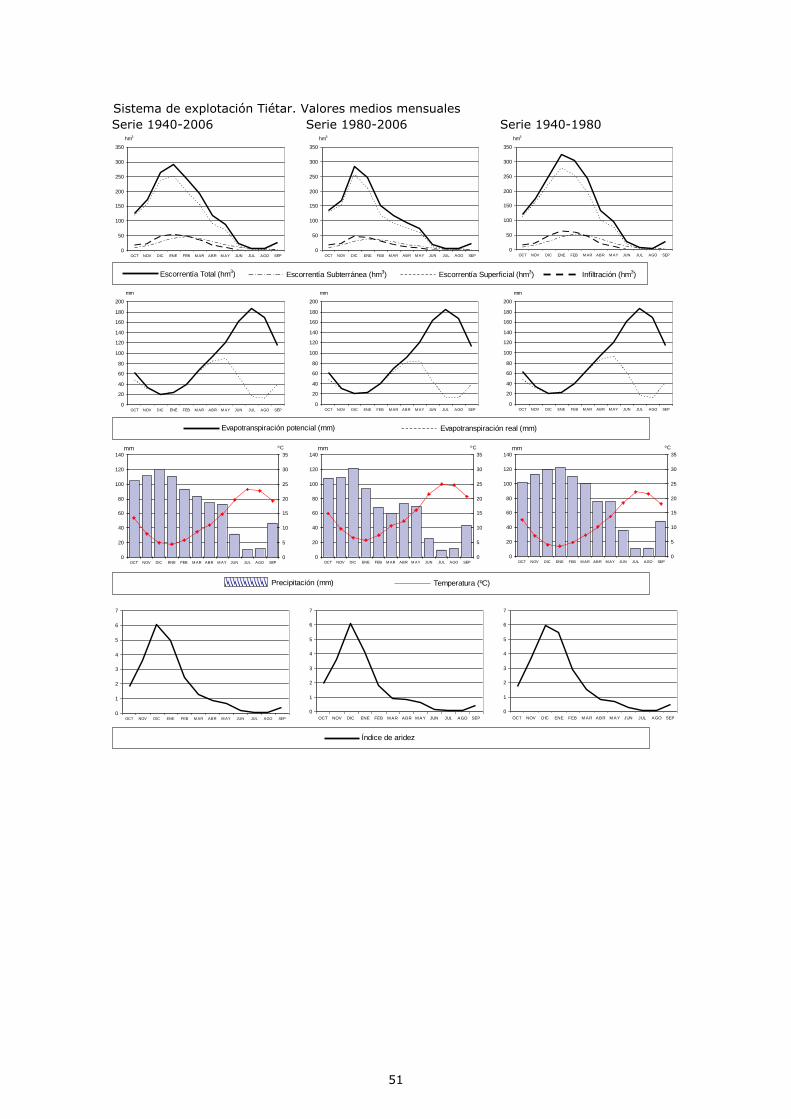
51
Sistema de explotación Tiétar. Valores medios mensuales
Serie 1940-2006 Serie 1980-2006 Serie 1940-1980
0
50
100
150
200
250
300
350
OCT NOV DIC ENE FEB M AR ABR M AY JUN JUL AGO SEP
hm3
0
50
100
150
200
250
300
350
OCT NOV DIC ENE FEB M AR ABR M AY JUN JUL AGO SEP
hm3
0
50
100
150
200
250
300
350
OCT NOV DIC ENE FEB M AR ABR M AY JUN JUL AGO SEP
hm3
Escorrentía Total (hm3) Escorrentía Subterránea (hm
3) Escorrentía Superficial (hm
3) Infiltración (hm
3)
0
20
40
60
80
100
120
140
160
180
200
OCT NOV DIC ENE FEB M AR ABR M AY JUN JUL AGO SEP
mm
0
20
40
60
80
100
120
140
160
180
200
OCT NOV DIC ENE FEB M AR ABR M AY JUN JUL AGO SEP
mm
0
20
40
60
80
100
120
140
160
180
200
OCT NOV DIC ENE FEB M AR ABR M AY JUN JUL AGO SEP
mm
Evapotranspiración potencial (mm) Evapotranspiración real (mm)
0
20
40
60
80
100
120
140
OCT NOV DIC ENE FEB M AR ABR M AY JUN JUL AGO SEP
mm
0
5
10
15
20
25
30
35
ºC
0
20
40
60
80
100
120
140
OCT NOV DIC ENE FEB M AR ABR M AY JUN JUL AGO SEP
mm
0
5
10
15
20
25
30
35
ºC
0
20
40
60
80
100
120
140
OCT NOV DIC ENE FEB M AR ABR M AY JUN JUL AGO SEP
mm
0
5
10
15
20
25
30
35
ºC
Precipitación (mm) Temperatura (ºC)
0
1
2
3
4
5
6
7
OCT NOV DIC ENE FEB M AR ABR M AY JUN JUL AGO SEP
0
1
2
3
4
5
6
7
OCT NOV DIC ENE FEB M AR ABR M AY JUN JUL AGO SEP
0
1
2
3
4
5
6
7
OCT NOV DIC ENE FEB M AR ABR M AY JUN JUL AGO SEP
Índice de aridez

52
Sistema de explotación Árrago. Valores medios mensuales
Serie 1940-2006 Serie 1980-2006 Serie 1940-1980
0
10
20
30
40
50
60
70
80
90
OCT NOV DIC ENE FEB M AR ABR M AY JUN JUL AGO SEP
hm3
0
10
20
30
40
50
60
70
80
90
OCT NOV DIC ENE FEB M AR ABR M AY JUN JUL AGO SEP
hm3
0
10
20
30
40
50
60
70
80
90
OCT NOV DIC ENE FEB M AR ABR M AY JUN JUL AGO SEP
hm3
Escorrentía Total (hm3) Escorrentía Subterránea (hm
3) Escorrentía Superficial (hm
3) Infiltración (hm
3)
0
50
100
150
200
250
OCT NOV DIC ENE FEB M AR ABR M AY JUN JUL AGO SEP
mm
0
50
100
150
200
250
OCT NOV DIC ENE FEB M AR ABR M AY JUN JUL AGO SEP
mm
0
50
100
150
200
250
OCT NOV DIC ENE FEB M AR ABR M AY JUN JUL AGO SEP
mm
Evapotranspiración potencial (mm) Evapotranspiración real (mm)
0
20
40
60
80
100
120
140
OCT NOV DIC ENE FEB M AR ABR M AY JUN JUL AGO SEP
mm
0
5
10
15
20
25
30
35
ºC
0
20
40
60
80
100
120
140
OCT NOV DIC ENE FEB M AR ABR M AY JUN JUL AGO SEP
mm
0
5
10
15
20
25
30
35
ºC
0
20
40
60
80
100
120
140
OCT NOV DIC ENE FEB M AR ABR M AY JUN JUL AGO SEP
mm
0
5
10
15
20
25
30
35
ºC
Precipitación (mm) Temperatura (ºC)
0
1
2
3
4
5
6
7
OCT NOV DIC ENE FEB M AR ABR M AY JUN JUL AGO SEP
0
1
2
3
4
5
6
7
OCT NOV DIC ENE FEB M AR ABR M AY JUN JUL AGO SEP
0
1
2
3
4
5
6
7
OCT NOV DIC ENE FEB M AR ABR M AY JUN JUL AGO SEP
Índice de aridez

53
Sistema de explotación Alagón. Valores medios mensuales
Serie 1940-2006 Serie 1980-2006 Serie 1940-1980
0
50
100
150
200
250
300
350
OCT NOV DIC ENE FEB M AR ABR M AY JUN JUL AGO SEP
hm3
0
50
100
150
200
250
300
350
OCT NOV DIC ENE FEB M AR ABR M AY JUN JUL AGO SEP
hm3
0
50
100
150
200
250
300
350
OCT NOV DIC ENE FEB M AR ABR M AY JUN JUL AGO SEP
hm3
Escorrentía Total (hm3) Escorrentía Subterránea (hm
3) Escorrentía Superficial (hm
3) Infiltración (hm
3)
0
20
40
60
80
100
120
140
160
180
200
OCT NOV DIC ENE FEB M AR ABR M AY JUN JUL AGO SEP
mm
0
20
40
60
80
100
120
140
160
180
200
OCT NOV DIC ENE FEB M AR ABR M AY JUN JUL AGO SEP
mm
0
20
40
60
80
100
120
140
160
180
200
OCT NOV DIC ENE FEB M AR ABR M AY JUN JUL AGO SEP
mm
Evapotranspiración potencial (mm) Evapotranspiración real (mm)
0
20
40
60
80
100
120
140
OCT NOV DIC ENE FEB M AR ABR M AY JUN JUL AGO SEP
mm
0
5
10
15
20
25
30
35
ºC
0
20
40
60
80
100
120
140
OCT NOV DIC ENE FEB M AR ABR M AY JUN JUL AGO SEP
mm
0
5
10
15
20
25
30
35
ºC
0
20
40
60
80
100
120
140
OCT NOV DIC ENE FEB M AR ABR M AY JUN JUL AGO SEP
mm
0
5
10
15
20
25
30
35
ºC
Precipitación (mm) Temperatura (ºC)
0
1
2
3
4
5
6
7
OCT NOV DIC ENE FEB M AR ABR M AY JUN JUL AGO SEP
0
1
2
3
4
5
6
7
OCT NOV DIC ENE FEB M AR ABR M AY JUN JUL AGO SEP
0
1
2
3
4
5
6
7
OCT NOV DIC ENE FEB M AR ABR M AY JUN JUL AGO SEP
Índice de aridez
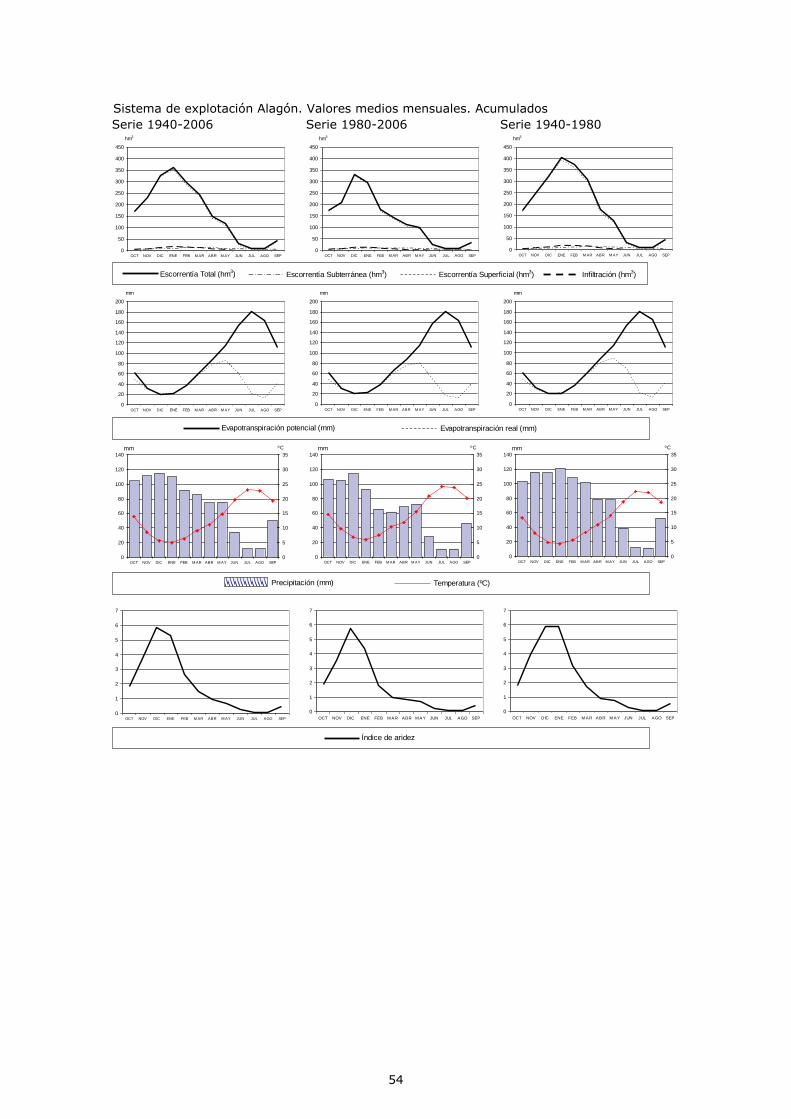
54
Sistema de explotación Alagón. Valores medios mensuales. Acumulados
Serie 1940-2006 Serie 1980-2006 Serie 1940-1980
0
50
100
150
200
250
300
350
400
450
OCT NOV DIC ENE FEB M AR ABR M AY JUN JUL AGO SEP
hm3
0
50
100
150
200
250
300
350
400
450
OCT NOV DIC ENE FEB M AR ABR M AY JUN JUL AGO SEP
hm3
0
50
100
150
200
250
300
350
400
450
OCT NOV DIC ENE FEB M AR ABR M AY JUN JUL AGO SEP
hm3
Escorrentía Total (hm3) Escorrentía Subterránea (hm
3) Escorrentía Superficial (hm
3) Infiltración (hm
3)
0
20
40
60
80
100
120
140
160
180
200
OCT NOV DIC ENE FEB M AR ABR M AY JUN JUL AGO SEP
mm
0
20
40
60
80
100
120
140
160
180
200
OCT NOV DIC ENE FEB M AR ABR M AY JUN JUL AGO SEP
mm
0
20
40
60
80
100
120
140
160
180
200
OCT NOV DIC ENE FEB M AR ABR M AY JUN JUL AGO SEP
mm
Evapotranspiración potencial (mm) Evapotranspiración real (mm)
0
20
40
60
80
100
120
140
OCT NOV DIC ENE FEB M AR ABR M AY JUN JUL AGO SEP
mm
0
5
10
15
20
25
30
35
ºC
0
20
40
60
80
100
120
140
OCT NOV DIC ENE FEB M AR ABR M AY JUN JUL AGO SEP
mm
0
5
10
15
20
25
30
35
ºC
0
20
40
60
80
100
120
140
OCT NOV DIC ENE FEB M AR ABR M AY JUN JUL AGO SEP
mm
0
5
10
15
20
25
30
35
ºC
Precipitación (mm) Temperatura (ºC)
0
1
2
3
4
5
6
7
OCT NOV DIC ENE FEB M AR ABR M AY JUN JUL AGO SEP
0
1
2
3
4
5
6
7
OCT NOV DIC ENE FEB M AR ABR M AY JUN JUL AGO SEP
0
1
2
3
4
5
6
7
OCT NOV DIC ENE FEB M AR ABR M AY JUN JUL AGO SEP
Índice de aridez

55
Sistema de explotación Bajo Tajo (sólo la parte española de la cuenca). Valores medios
mensuales
Serie 1940-2006 Serie 1980-2006 Serie 1940-1980
0
50
100
150
200
250
300
350
400
450
OCT NOV DIC ENE FEB M AR ABR M AY JUN JUL AGO SEP
hm3
0
50
100
150
200
250
300
350
400
450
OCT NOV DIC ENE FEB M AR ABR M AY JUN JUL AGO SEP
hm3
0
50
100
150
200
250
300
350
400
450
OCT NOV DIC ENE FEB M AR ABR M AY JUN JUL AGO SEP
hm3
Escorrentía Total (hm
3) Escorrentía Subterránea (hm
3) Escorrentía Superficial (hm
3) Infiltración (hm
3)
0
50
100
150
200
250
OCT NOV DIC ENE FEB M AR ABR M AY JUN JUL AGO SEP
mm
0
50
100
150
200
250
OCT NOV DIC ENE FEB M AR ABR M AY JUN JUL AGO SEP
mm
0
50
100
150
200
250
OCT NOV DIC ENE FEB M AR ABR M AY JUN JUL AGO SEP
mm
Evapotranspiración potencial (mm) Evapotranspiración real (mm)
0
10
20
30
40
50
60
70
80
90
100
OCT NOV DIC ENE FEB M AR ABR M AY JUN JUL AGO SEP
mm
0
5
10
15
20
25
30
ºC
0
10
20
30
40
50
60
70
80
90
100
OCT NOV DIC ENE FEB M AR ABR M AY JUN JUL AGO SEP
mm
0
5
10
15
20
25
30
ºC
0
10
20
30
40
50
60
70
80
90
100
OCT NOV DIC ENE FEB M AR ABR M AY JUN JUL AGO SEP
mm
0
5
10
15
20
25
30
ºC
Precipitación (mm) Temperatura (ºC)
0
1
1
2
2
3
3
4
4
5
OCT NOV DIC ENE FEB M AR ABR M AY JUN JUL AGO SEP
0
1
1
2
2
3
3
4
4
5
OCT NOV DIC ENE FEB M AR ABR M AY JUN JUL AGO SEP
0
1
1
2
2
3
3
4
4
5
OCT NOV DIC ENE FEB M AR ABR M AY JUN JUL AGO SEP
Índice de aridez

56
Sistema de explotación Bajo Tajo (sólo la parte española de la cuenca). Valores medios
mensuales. Acumulados
Serie 1940-2006 Serie 1980-2006 Serie 1940-1980
0
200
400
600
800
1.000
1.200
1.400
1.600
1.800
2.000
OCT NOV DIC ENE FEB M AR ABR M AY JUN JUL AGO SEP
hm3
0
200
400
600
800
1.000
1.200
1.400
1.600
1.800
2.000
OCT NOV DIC ENE FEB M AR ABR M AY JUN JUL AGO SEP
hm3
0
200
400
600
800
1.000
1.200
1.400
1.600
1.800
2.000
OCT NOV DIC ENE FEB M AR ABR M AY JUN JUL AGO SEP
hm3
Escorrentía Total (hm
3) Escorrentía Subterránea (hm
3) Escorrentía Superficial (hm
3) Infiltración (hm
3)
0
20
40
60
80
100
120
140
160
180
OCT NOV DIC ENE FEB M AR ABR M AY JUN JUL AGO SEP
mm
0
20
40
60
80
100
120
140
160
180
OCT NOV DIC ENE FEB M AR ABR M AY JUN JUL AGO SEP
mm
0
20
40
60
80
100
120
140
160
180
OCT NOV DIC ENE FEB M AR ABR M AY JUN JUL AGO SEP
mm
Evapotranspiración potencial (mm) Evapotranspiración real (mm)
0
10
20
30
40
50
60
70
80
90
OCT NOV DIC ENE FEB M AR ABR M AY JUN JUL AGO SEP
mm
0
5
10
15
20
25
30
ºC
0
10
20
30
40
50
60
70
80
90
OCT NOV DIC ENE FEB M AR ABR M AY JUN JUL AGO SEP
mm
0
5
10
15
20
25
30
ºC
0
10
20
30
40
50
60
70
80
90
OCT NOV DIC ENE FEB M AR ABR M AY JUN JUL AGO SEP
mm
0
5
10
15
20
25
30
ºC
Precipitación (mm) Temperatura (ºC)
0
1
1
2
2
3
3
4
4
5
5
OCT NOV DIC ENE FEB M AR ABR M AY JUN JUL AGO SEP
0
1
1
2
2
3
3
4
4
5
5
OCT NOV DIC ENE FEB M AR ABR M AY JUN JUL AGO SEP
0
1
1
2
2
3
3
4
4
5
5
OCT NOV DIC ENE FEB M AR ABR M AY JUN JUL AGO SEP
Índice de aridez
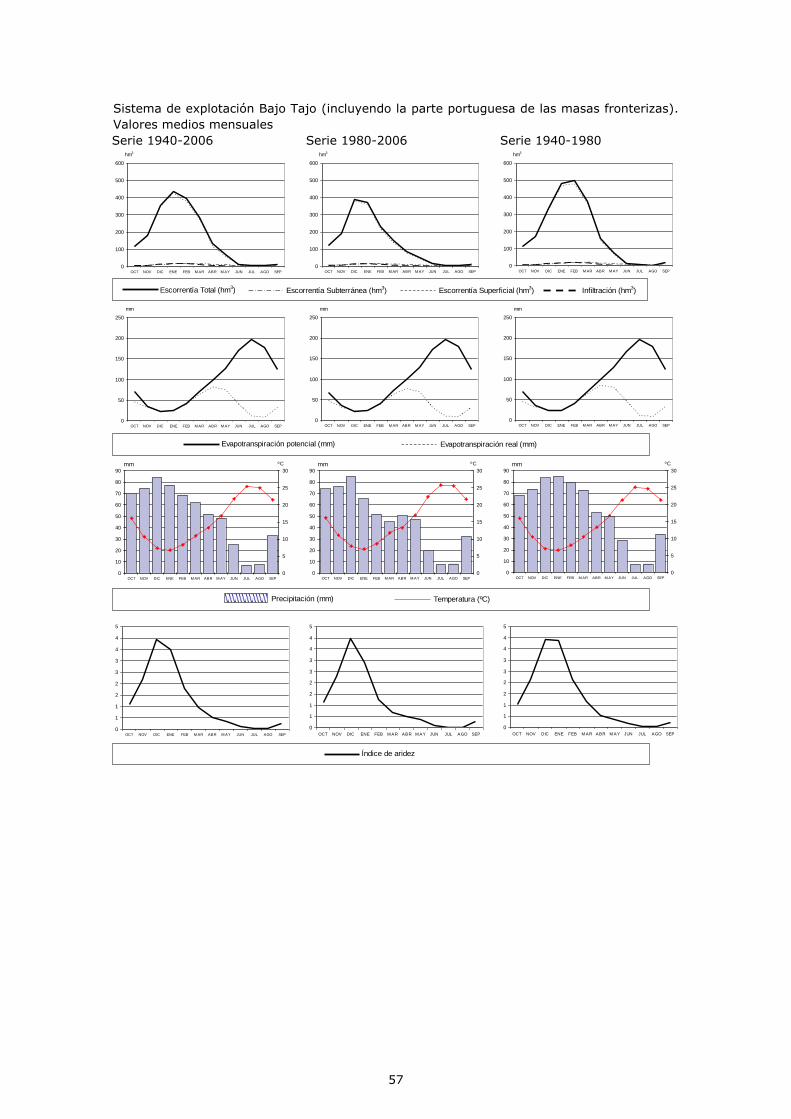
57
Sistema de explotación Bajo Tajo (incluyendo la parte portuguesa de las masas fronterizas).
Valores medios mensuales
Serie 1940-2006 Serie 1980-2006 Serie 1940-1980
0
100
200
300
400
500
600
OCT NOV DIC ENE FEB M AR ABR M AY JUN JUL AGO SEP
hm3
0
100
200
300
400
500
600
OCT NOV DIC ENE FEB M AR ABR M AY JUN JUL AGO SEP
hm3
0
100
200
300
400
500
600
OCT NOV DIC ENE FEB M AR ABR M AY JUN JUL AGO SEP
hm3
Escorrentía Total (hm
3) Escorrentía Subterránea (hm
3) Escorrentía Superficial (hm
3) Infiltración (hm
3)
0
50
100
150
200
250
OCT NOV DIC ENE FEB M AR ABR M AY JUN JUL AGO SEP
mm
0
50
100
150
200
250
OCT NOV DIC ENE FEB M AR ABR M AY JUN JUL AGO SEP
mm
0
50
100
150
200
250
OCT NOV DIC ENE FEB M AR ABR M AY JUN JUL AGO SEP
mm
Evapotranspiración potencial (mm) Evapotranspiración real (mm)
0
10
20
30
40
50
60
70
80
90
OCT NOV DIC ENE FEB M AR ABR M AY JUN JUL AGO SEP
mm
0
5
10
15
20
25
30
ºC
0
10
20
30
40
50
60
70
80
90
OCT NOV DIC ENE FEB M AR ABR M AY JUN JUL AGO SEP
mm
0
5
10
15
20
25
30
ºC
0
10
20
30
40
50
60
70
80
90
OCT NOV DIC ENE FEB M AR ABR M AY JUN JUL AGO SEP
mm
0
5
10
15
20
25
30
ºC
Precipitación (mm) Temperatura (ºC)
0
1
1
2
2
3
3
4
4
5
OCT NOV DIC ENE FEB M AR ABR M AY JUN JUL AGO SEP
0
1
1
2
2
3
3
4
4
5
OCT NOV DIC ENE FEB M AR ABR M AY JUN JUL AGO SEP
0
1
1
2
2
3
3
4
4
5
OCT NOV DIC ENE FEB M AR ABR M AY JUN JUL AGO SEP
Índice de aridez

58
Sistema de explotación Bajo Tajo (incluyendo la parte portuguesa de las masas fronterizas).
Valores medios mensuales. Acumulados
Serie 1940-2006 Serie 1980-2006 Serie 1940-1980
0
500
1.000
1.500
2.000
2.500
OCT NOV DIC ENE FEB M AR ABR M AY JUN JUL AGO SEP
hm3
0
500
1.000
1.500
2.000
2.500
OCT NOV DIC ENE FEB M AR ABR M AY JUN JUL AGO SEP
hm3
0
500
1.000
1.500
2.000
2.500
OCT NOV DIC ENE FEB M AR ABR M AY JUN JUL AGO SEP
hm3
Escorrentía Total (hm
3) Escorrentía Subterránea (hm
3) Escorrentía Superficial (hm
3) Infiltración (hm
3)
0
20
40
60
80
100
120
140
160
180
OCT NOV DIC ENE FEB M AR ABR M AY JUN JUL AGO SEP
mm
0
20
40
60
80
100
120
140
160
180
OCT NOV DIC ENE FEB M AR ABR M AY JUN JUL AGO SEP
mm
0
20
40
60
80
100
120
140
160
180
OCT NOV DIC ENE FEB M AR ABR M AY JUN JUL AGO SEP
mm
Evapotranspiración potencial (mm) Evapotranspiración real (mm)
0
10
20
30
40
50
60
70
80
90
OCT NOV DIC ENE FEB M AR ABR M AY JUN JUL AGO SEP
mm
0
5
10
15
20
25
30
ºC
0
10
20
30
40
50
60
70
80
90
OCT NOV DIC ENE FEB M AR ABR M AY JUN JUL AGO SEP
mm
0
5
10
15
20
25
30
ºC
0
10
20
30
40
50
60
70
80
90
OCT NOV DIC ENE FEB M AR ABR M AY JUN JUL AGO SEP
mm
0
5
10
15
20
25
30
ºC
Precipitación (mm) Temperatura (ºC)
0
1
1
2
2
3
3
4
4
5
5
OCT NOV DIC ENE FEB M AR ABR M AY JUN JUL AGO SEP
0
1
1
2
2
3
3
4
4
5
5
OCT NOV DIC ENE FEB M AR ABR M AY JUN JUL AGO SEP
0
1
1
2
2
3
3
4
4
5
5
OCT NOV DIC ENE FEB M AR ABR M AY JUN JUL AGO SEP
Índice de aridez
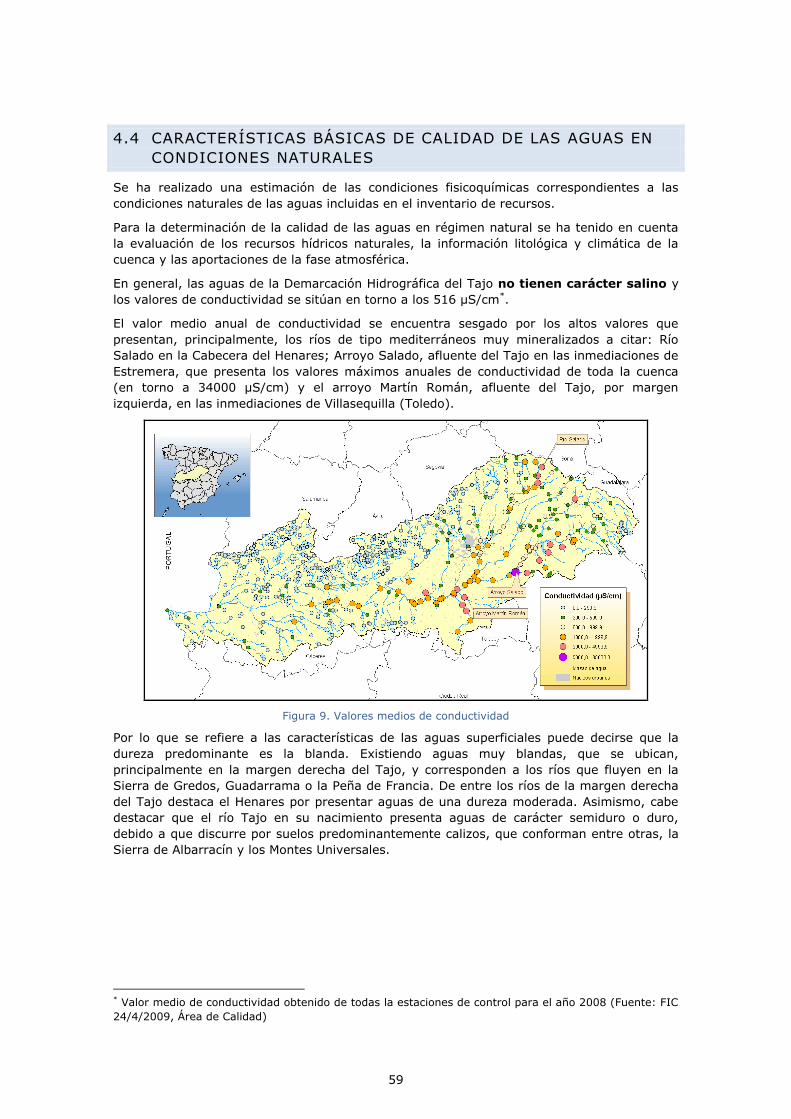
59
4.4 CARACTERÍSTICAS BÁSICAS DE CALIDAD DE LAS AGUAS EN
CONDICIONES NATURALES
Se ha realizado una estimación de las condiciones fisicoquímicas correspondientes a las
condiciones naturales de las aguas incluidas en el inventario de recursos.
Para la determinación de la calidad de las aguas en régimen natural se ha tenido en cuenta
la evaluación de los recursos hídricos naturales, la información litológica y climática de la
cuenca y las aportaciones de la fase atmosférica.
En general, las aguas de la Demarcación Hidrográfica del Tajo no tienen carácter salino y
los valores de conductividad se sitúan en torno a los 516 µS/cm*.
El valor medio anual de conductividad se encuentra sesgado por los altos valores que
presentan, principalmente, los ríos de tipo mediterráneos muy mineralizados a citar: Río
Salado en la Cabecera del Henares; Arroyo Salado, afluente del Tajo en las inmediaciones de
Estremera, que presenta los valores máximos anuales de conductividad de toda la cuenca
(en torno a 34000 µS/cm) y el arroyo Martín Román, afluente del Tajo, por margen
izquierda, en las inmediaciones de Villasequilla (Toledo).
Figura 9. Valores medios de conductividad
Por lo que se refiere a las características de las aguas superficiales puede decirse que la
dureza predominante es la blanda. Existiendo aguas muy blandas, que se ubican,
principalmente en la margen derecha del Tajo, y corresponden a los ríos que fluyen en la
Sierra de Gredos, Guadarrama o la Peña de Francia. De entre los ríos de la margen derecha
del Tajo destaca el Henares por presentar aguas de una dureza moderada. Asimismo, cabe
destacar que el río Tajo en su nacimiento presenta aguas de carácter semiduro o duro,
debido a que discurre por suelos predominantemente calizos, que conforman entre otras, la
Sierra de Albarracín y los Montes Universales.
* Valor medio de conductividad obtenido de todas la estaciones de control para el año 2008 (Fuente: FIC
24/4/2009, Área de Calidad)

60
Figura 10. Dureza del agua
La mineralización en la cuenca del Tajo varía de muy débil (aguas que fluyen principalmente
en rocas ígneas, correspondientes a la Sierra de Gredos y de Guadarrama) a fuerte
(principalmente en los ríos de tipo mediterráneos muy mineralizados, anteriormente
citados), aunque predominan las aguas con mineralización baja.
La concentración de sodio, excepto en casos extremos, se mantiene por regla general por
debajo de 15 mg/I. Por su parte, la mayoría de registros de calcio no sobrepasa los 25 mg/l
aunque en casos extremos se registran valores de hasta 525 mg/l.
La concentración de cloruros no supera por lo común 10 mg/l: sólo ocasionalmente alcanza
valores elevados (superiores a 1000 mg/l) en los ríos mediterráneos muy mineralizados.
Figura 11. Distribución de máximos y mínimos de los elementos denominados de proporcionalidad
constante que definen la composición mineralógica del agua
4.5 REUTILIZACIÓN.
Datos de 2009 aseveran que en la parte española de la Demarcación Hidrográfica existen 36
estaciones depuradoras con capacidad para regenerar 103 hm3/año, de los cuales se
reutilizan 10 hm3/año. Otros 18 hm3/año están pendientes de autorización para ser
reutilizados El caudal depurado en dichas instalaciones asciende a 453 hm3/año.
Existen otras 33 instalaciones con capacidad para depurar al menos 1 hm3/año, pero que no
regeneran el agua actualmente. En conjunto, estas instalaciones suman un volumen

61
depurado de 231 hm3/año, que añadido al depurado por las estaciones que ya regeneran
alcanza un total de 684 hm3/año en toda la Demarcación Hidrográfica. De estos 684
hm3/año, el 96% se depura en la Comunidad de Madrid con un total de 655 hm3/año.
En la siguiente tabla se pueden observar los distintos valores de caudales reseñados
anteriormente discriminados según las diferentes provincias que abarca la parte española de
la Demarcación Hidrográfica del Tajo.
Provincia
Caudal
depurado (hm3/año)
Capacidad de
regeneración (hm3/año)
Caudal
reutilizado (hm3/año)
CACERES 7,55 1,10 0,001
GUADALAJARA 6,46 1,83 0,38
MADRID 655,29 96,73 7,86
SALAMANCA 1,13
TOLEDO 13,52 3,71 1,67
Total 683,95 103,36 9,91
En la Comunidad de Madrid, el Canal de Isabel II está llevando a cabo un plan de
reutilización amplio y exigente, llamado “Plan Dpura”, con una inversión que superará los
200 millones de euros y que afectará al menos a 30 plantas depuradoras. El objetivo último
es poner a disposición de los usuarios unos 40 hm3 anuales de agua regenerada en el año
2010 cuyos usuarios potenciales son los Ayuntamientos, las industrias y los campos de golf.
El Ayuntamiento de Madrid, por su parte, cuenta también con un “Plan de Reutilización de
Agua Regenerada”, un ambicioso proyecto en marcha desde el año 2001, que permitirá el
suministro de agua regenerada para riego, baldeo y otros usos, mediante la construcción de
una red subterránea de más de 100 km que circunvalará la ciudad. Con esta infraestructura
el Ayuntamiento de Madrid pretende distribuir anualmente 26 hectómetros cúbicos de agua
destinados a usos urbanos y riegos de campos de golf.
En la siguiente tabla se pueden observar las previsiones de reutilización incluidas en los
planes de la Comunidad y Ayuntamiento de Madrid, con indicación de los usos previstos.
PLANES DE REUTILIZACIÓN Previsiones de reutilización
(hm3/año)
COMUNIDAD DE MADRID 40
USOS URBANOS 27
INDUSTRIA 4
CAMPOS DE GOLF 9
AYUNTAMIENTO DE MADRID 26
USOS URBANOS 23
CAMPOS DE GOLF 3
Total 65*
A la vista de los datos reseñados se deduce que el mayor potencial para suministrar agua
regenerada en la Demarcación Hidrográfica del Tajo reside en las estaciones depuradoras de
Madrid. Por tanto, las mayores posibilidades de reutilización futuras provendrán de las aguas
regeneradas en los municipios de Madrid.
5 EVALUACIÓN DEL EFECTO DEL CAMBIO CLIMÁTICO
Según un estudio del Centro de Estudios Hidrográficos del CEDEX sobre la evaluación de los
efectos del Cambio Climático sobre los recursos hídricos, el coeficiente de reducción global de
las aportaciones a utilizar en la Demarcación Hidrográfica del Tajo es del 7%.
* Los 9 hm3/año para riego de campos de golf de la Comunidad de Madrid incluyen 1,4 hm3/año
correspondientes a campos de golf del Ayuntamiento de Madrid ya incluidos en los 26 hm3/año, por eso
se restan del total.