REACCIONES ADVERSAS A MEDICAMENTOS ESTIBALIZ GOIENETXE R3 MFYCM.

ESTUDIO DE LA TOXICIDAD COMBINADA DE AFLATOXINA B1
Y OCRATOXINA A EN MODELOS IN VITRO E IN VIVO
COMBINED TOXICITY OF AFLATOXIN B1 AND OCHRATOXIN A
IN IN VITRO AND IN VIVO MODELS
Laura Ana Corcuera Martínez
TESIS DOCTORAL


El trabajo de investigación titulado:
que presenta Dña. Laura Ana Corcuera Martínez para aspirar al grado de Doctor por la
Universidad de Navarra, ha sido realizado en el Departamento de Ciencias de la
Alimentación, Fisiología y Toxicología bajo la dirección de la Dra. Adela López de Cerain
Salsamendi y la co-dirección de la Dra. Elena González-Peñas
Pamplona, Abril de 2012
Dra. Adela López de Cerain Salsamendi Dra. Elena González-Peñas
ESTUDIO DE LA TOXICIDAD COMBINADA DE AFLATOXINA B1
Y OCRATOXINA A EN MODELOS IN VITRO E IN VIVO
COMBINED TOXICITY OF AFLATOXIN B1 AND OCHRATOXIN A
IN IN VITRO AND IN VIVO MODELS

Este trabajo ha sido financiado por los proyectos:
“Micotoxinas: toxicidad del tratamiento combinado de ocratoxina A y aflatoxina B1 en modelos in vitro e in vivo”
Ministerio de Ciencia e Innovación del Gobierno de España Referencia: AGL2008-01437/ALI
“Presencia de toxinas en alimentos y su implicación en la salud humana”
Fundación CAN Referencia: 10829


7
AGRADECIMIENTOS / ACKNOWLEDGMENTS
Deseo expresar mi profundo agradecimiento a todas las personas e instituciones que durante
estos años han contribuido a que esta tesis doctoral sea hoy una realidad:
El más especial de los agradecimientos a la Dra. Adela López de Cerain y a la Dra. Elena
González-Peñas, directoras de este proyecto. Gracias por confiar en mí, guiarme en este camino y
alentarme en el desánimo. Adela, has sido para mí un ejemplo de profesionalidad y excelencia. Elena,
de tí he aprendido el valor del trabajo bien hecho. Gracias por vuestro cariño.
A la Universidad de Navarra, por haberme acogido y formado durante todos estos años, en
especial al Departamento de Ciencias de la Alimentación, Fisiología y Toxicología, por brindarme la
oportunidad de realizar este proyecto. A la Asociación de Amigos y a la Fundación Empresa-
Universidad de Navarra por las ayudas económicas recibidas a través de sus programas de ayuda para
la formación de personal investigador. Estas entidades me brindaron la oportunidad de realizar esta
tesis. Al Gobierno noruego por otorgarme una beca para una estancia durante este proyecto.
I am extremely greateful to the Faculty of Medicine of the University of Oslo, in particular to
Prof. Andrew Collins not only for giving me the opportunity to join his group and learn the comet
assay but also for his warmness and closeness. I would also like to thank the Norwegian Institute of
Public Health, especially to Dr. Gunnar Brunborg who warmly welcomed me in his group. Thanks
to those people who I met in my visits to Norway, Torgrim, Claire, Cameron, Cristine, and especially
to Yol for your friendliness and your little madness. Nos vemos en Mono!
A todas las personas que forma parte de CIFA, a las que están y a las que vi marchar, por
hacer que este centro funcione, por las sonrisas en los pasillos y los entrañables cafés. Mi
agradecimiento y respeto al Dr. Monge, director de CIFA por aceptarme en su departamento como
alumna interna para que pudiera “probar” qué es la investigación y después aceptarme en su centro
para realizar esta tesis doctoral. A Estefanía, Laura y Carlos por su eficacia y su sonrisa.
Al Departamento de Química Orgánica y Farmaceútica, en especial a la sección de Técnicas
Instrumentales, por darme la oportunidad de desarrollar una parte de este proyecto que también es
de ellos, y por darme “asilo” generosamente. Gracias a Susana, Mayte, Rebeca, María y Teresa que
aunque ya no están se siente su presencia en cada milímetro. Y a los que continúan, Angel, Elena L. y

8
Elena G. Gracias por los debates científicos y las conversaciones en confianza. Me llevo grandes
recuerdos.
A todos los que forman y han formado parte en algún momento del Laboratorio de
Toxicología. Gracias a los masterianos y los alumnos internos, en especial a Olatz por hacer que mi
incorporación y la suficiencia fueran algo “fácil” y a Noemi, gracias por tu cariño, tus ganas de
aprender, tu buen hacer y tu amistad. Laura estás en el comienzo, disfruta de la investigación! A
Mauricio, María Laura y María Puerto, ha sido un gusto compartir ciencia y ocio con vosotros. A
Ana Gloria y a Celia por su disposición, sus consejos y su cercanía. A David por su frescura y su
buen fondo y a Patricia “Pojer” por las risas, los buenos momentos, los vinos que se alargan y por
Audrie. Al comenzar esta andadura tuve la mejor profesora, la mas paciente y cariñosa, y poco a
poco una amiga, Leire. Gracias Ariane por contagiarme la ilusión por la investigación, por tu amistad
siempre en positivo, y por hacerme reir tanto. No tengo agradecimientos suficientes para Amaia,
gracias por hacerme crecer en lo científico y por ayudarme tanto en lo personal, gracias por el
cometa, el sofá de Oslo, tu casa de Zizur, la letra garamond… y por tu amistad. Ceci, eres la “mami”
del laboratorio, que nos reprende con cariño y nos cuida con amor, siempre atenta y dispuesta a
ayudar, gracias por tu ternura, me llevo una amiga.
A mis químicas, gracias por apreciarme tanto. Gali por tu inocencia y tu generosidad. Ele, por
tu alegría contagiosa y tu espontaneidad, sólo te faltaba yo!. María y Rebe, primero compañeras,
luego amigas, también colegas, he aprendido de vosotras el significado del trabajo bien hecho y saber
que siempre contamos las unas con las otras. A mi hermana Asun, hemos compartido tanto… gracias
por quererme, por conocerme tan bien y enseñarme a ser mejor persona. Te echo de menos pero se
que te tengo.
A los telekos y “apegados”, Amaia y Mikel, Jaione, Ezker y Ana, Claudio y Elena, Meno y
Ana, Dani, Arregui, Alberto y Estibaliz, Natxo y Julie, Asier y Ohiane, Pablo y Elena, Pedro…
gracias por los viajes, las cenas, las discusiones, los planes, el spam…
A mis amigos “del cole”, Ana, Vero, Peci y a Jose por intentar entender qué era lo que hacía
durante tanto tiempo en la Universidad. Gracias por los buenos momentos, por vuestro apoyo y por
los ánimos cuando me faltaron. Vero, ¿el próximo viaje?

9
A mi familia de Pamplona, Begoña, Miguel, Lander, Javier, Jose, Asier, Txikitin, María,
Manolo... por acogerme con tanto cariño y hacerme sentir en casa.
A Iban, por dar cada paso conmigo en este camino, por levantarme cuando caigo y por tu
paciencia. Gracias por quererme tanto y entenderme tan bien. Esta tesis también es tuya y el futuro
es nuestro.
A mi familia, por preocuparse por mí. A Ama, la Yaya y el Abuelo que vieron el principio y
desde el cielo están viendo el final. Al Yayo, que puede disfrutar conmigo de este triunfo. A mi tios
Ignacio y Begoña, a María. A mi hermano Luis, gracias por tu ánimo, tu curiosidad y tu admiración,
me haces querer ser mejor cada día.
Nada hubiera sido posible sin mis padres, los pilares de mi vida. Gracias por enseñarme que el
trabajo bien hecho es el éxito en si mismo. Gracías por vuestro amor, por creer en mí, y hacerme
saber que podía. Éste también es vuestro premio.
¡GRACIAS A TODOS!


“Lo consiguieron porque no sabían que era imposible”
Jean Cocteau
A mis padres
A Iban

Abreviaturas /Abreviations
13
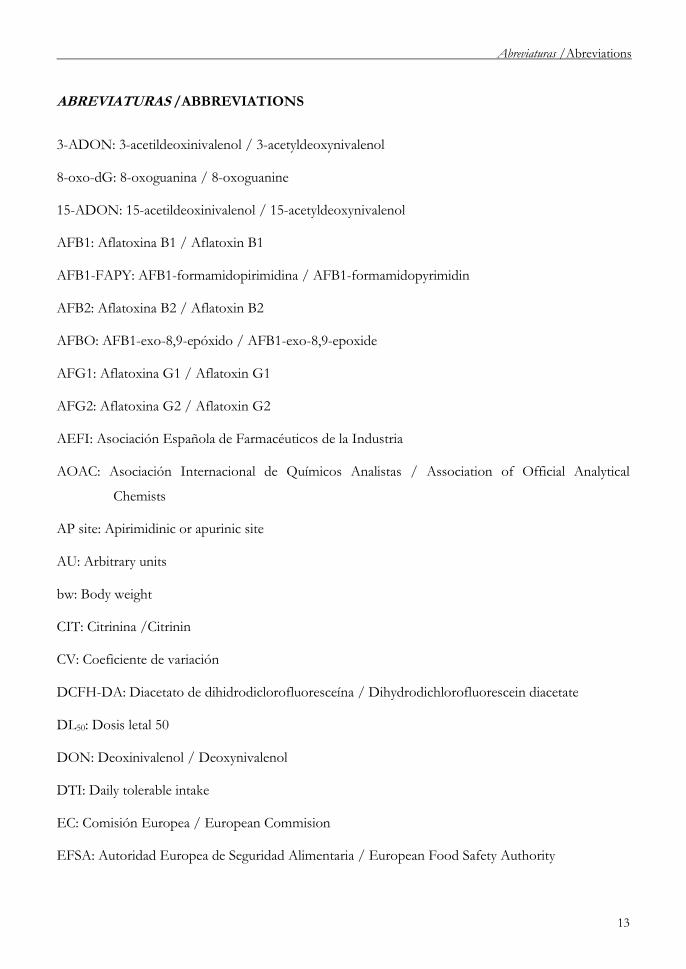
ABREVIATURAS /ABBREVIATIONS
3-ADON: 3-acetildeoxinivalenol / 3-acetyldeoxynivalenol
8-oxo-dG: 8-oxoguanina / 8-oxoguanine
15-ADON: 15-acetildeoxinivalenol / 15-acetyldeoxynivalenol
AFB1: Aflatoxina B1 / Aflatoxin B1
AFB1-FAPY: AFB1-formamidopirimidina / AFB1-formamidopyrimidin
AFB2: Aflatoxina B2 / Aflatoxin B2
AFBO: AFB1-exo-8,9-epóxido / AFB1-exo-8,9-epoxide
AFG1: Aflatoxina G1 / Aflatoxin G1
AFG2: Aflatoxina G2 / Aflatoxin G2
AEFI: Asociación Española de Farmacéuticos de la Industria
AOAC: Asociación Internacional de Químicos Analistas / Association of Official Analytical
Chemists
AP site: Apirimidinic or apurinic site
AU: Arbitrary units
bw: Body weight
CIT: Citrinina /Citrinin
CV: Coeficiente de variación
DCFH-DA: Diacetato de dihidrodiclorofluoresceína / Dihydrodichlorofluorescein diacetate
DL50: Dosis letal 50
DON: Deoxinivalenol / Deoxynivalenol
DTI: Daily tolerable intake
EC: Comisión Europea / European Commision
EFSA: Autoridad Europea de Seguridad Alimentaria / European Food Safety Authority

Abreviaturas /Abreviations
14
Endo III: Endonucleasa III / Endonuclease III
FPG: Formamidopirimidina ADN glicosilasa / Formamidopyrimidine DNA glycosylase
FAO/OIEA (IAEA): Organización de las Naciones Unidas para la Agricultura y la Alimentación /
Organismo Internacional de Energía Atómica / Food and Agriculture
Organization of the United Nations / International Atomic Energy
Agency
FAO/OMS: Organización de las Naciones Unidas para la Agricultura y la Alimentación
Organización Mundial de la Salud / Food and Agriculture Organization of the United
Nations/World Health Organization
FDA: Agencia de medicamentos y alimentos / Food and Drug Administration
FLD: Detector de fluorescencia / Fluorescence detector
FB1: Fumonisina B1 / Fumonisin B1
GST: Complejo glutatión–S-transferasa / Glutation-S-transferase complex
HPLC: Cromatografía líquida de alta resolución / High Performance Liquid Chromatography
HT-2: Toxina HT-2 /HT-2 toxin
IARC: Agencia Internacional para la Investigación sobre el Cáncer / International Agency for the
Research on Cancer
ICH: Conferencia Internacional de Armonización / International Conference on Harmonisation
IDT: Ingesta diaria tolerable
JEFCA: Comité Mixto FAO/OMS de Expertos en Aditivos Alimentarios / Joint FAO/WHO
Expert Committee on Food Additives
LD50: Lethal Dose 50
LD/LOD: Límite de detección / Limit of detection
LC/LOQ: Límite de cuantificación / Limit of quantification
NIV: Nivalenol /Nivalenol
NTP: Programa Nacional de Toxicología / National Toxicology Program

Abreviaturas /Abreviations
15
OECD: Organización para la Cooperación y el Desarrollo Económico / Organisation for the
Economics Co-operation and Development
OTA: Ocratoxina A / Ochratoxin A
PBS: Tampón fosfato / Phosphate buffered saline
pc: Peso corporal
PECE: Extracto de cacao enriquecido en polifenoles / polyphenol-enriched cocoa extract
pKa: Constante de disociación ácida / Acid dissociation constant
RE: Relative error
SCF: Comité Científico de la Alimentación de la Comisión Europea / Scientific Committee of Food
SCOOP: Cooperación científica sobre las cuestiones relativas a la alimentación / Scientific Co-
operation on Questions relating to Food)
RF: Relative fluorescence
ROS: Especies reactivas de oxígeno / Reactive oxygen species
RSD: Desviación estándar / Relative standard deviation
SE: Standard error
t1/2: Semivida de eliminación /Elimination half life
T-2: Toxina T-2/ T-2 toxin
TWI: Tolerable weekly intake
UA: Unidades arbitrarias
UHPLC-LD: Cromatografía líquida de ultra alta resolución con detector ultravioleta / Ultra high
performance liquid chromatography-fluorescence detector
UV: Ultraviolet detector
WHO: Organización Mundial de la Salud / World Health Organisation
ZEA: Zearalenona / Zearalenone

17
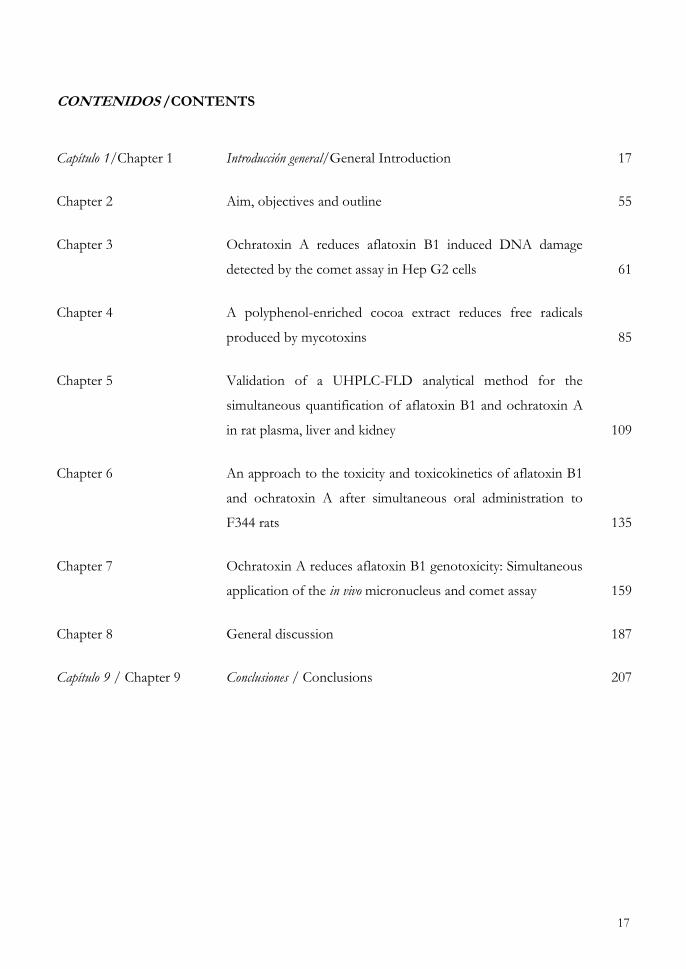
CONTENIDOS /CONTENTS
Capítulo 1/Chapter 1 Introducción general/General Introduction 17
Chapter 2 Aim, objectives and outline 55
Chapter 3 Ochratoxin A reduces aflatoxin B1 induced DNA damage
detected by the comet assay in Hep G2 cells 61
Chapter 4 A polyphenol-enriched cocoa extract reduces free radicals
produced by mycotoxins 85
Chapter 5 Validation of a UHPLC-FLD analytical method for the
simultaneous quantification of aflatoxin B1 and ochratoxin A
in rat plasma, liver and kidney 109
Chapter 6 An approach to the toxicity and toxicokinetics of aflatoxin B1
and ochratoxin A after simultaneous oral administration to
F344 rats 135
Chapter 7 Ochratoxin A reduces aflatoxin B1 genotoxicity: Simultaneous
application of the in vivo micronucleus and comet assay 159
Chapter 8 General discussion 187
Capítulo 9 / Chapter 9 Conclusiones / Conclusions 207


Capítulo 1 / Chapter 1
Introducción general / General introduction


Introducción general /General introduction
21
MICOTOXINAS
Desde hace siglos el hombre ha empleado los hongos que se desarrollan en los alimentos para
obtener otros alimentos de características organolépticas distintas al original. Así los hongos se
empleaban para la elaboración de vinos, quesos, cervezas, embutidos y también en la producción de
fármacos. Sin embargo, algunos de los hongos que crecen sobre los materiales vegetales producen
toxinas con efectos indeseables para plantas y animales.
Micotoxina es un término que deriva del griego antiguo mykes, mukos (μύκης), que significa
hongo, y del latín toxicum, que significa veneno. Las micotoxinas son metabolitos secundarios con
distintas propiedades químicas, biológicas y toxicológicas, producidas por hongos que se desarrollan
en productos vegetales.
Se denomina micotoxicosis a la intoxicación provocada por una micotoxina y pueden darse
intoxicaciones agudas o crónicas. Generalmente, el riesgo de intoxicación aguda por micotoxinas es
bajo o moderado en comparación con intoxicaciones de origen microbiológico o por contaminantes
químicos. Es la exposición crónica la de mayor relevancia en el hombre; ya que son ingeridas por el
ser humano asociadas a los alimentos, en pequeñas dosis y durante periodos de tiempo prolongados
(Soriano del Castillo, 2007). En particular, es especialmente relevante la ingesta crónica de aquellas
micotoxinas que presentan efectos cancerígenos y/o inmunosupresores.
Los primeros casos de micotoxicosis comenzaron a documentarse en la Edad Media por la
contaminación del centeno con el hongo Claviceps purpurea, vulgarmente llamado Cornezuelo del
centeno. Los alcaloides generados sobre el cereal provocan la enfermedad llamada ergotismo o fuego
de San Antonio. Esta micotoxicosis ya era conocida en la antigüedad por los romanos, que la
denominaban ignis sacer o ignis martialis, fuego sagrado o fuego sacro, por sus síntomas de ataques,
convulsiones, alucinaciones, inflamaciones y gangrenas (FAO/OIEA, 2003). Las micotoxicosis
adquirieron mayor interés en 1960, cuando murieron en Inglaterra pavos, patos y otros animales de
granja a causa de una enfermedad denominada “Enfermedad X de los pavos”. Fue provocada por
contaminación con el hongo Aspergillus flavus en harinas de cacahuete para piensos importadas de
Brasil (Soriano del Castillo, 2007; Austwick, 1978), y supuso importantes pérdidas en el sector
agroalimentario.

Capítulo 1/ Chapter 1
22
Muchas especies de hongos infectan los cultivos y producen las micotoxinas en los productos
vegetales antes de su recolección, denominándose hongos de campo. Otras especies, denominadas
hongos de almacenamiento, se desarrollan, generan micotoxinas o incrementan su síntesis cuando el
producto se ha recolectado y las condiciones de almacenamiento lo permiten; y otras son capaces de
producirlas en ambas condiciones. Fundamentalmente, las micotoxinas son producidas por tres
géneros de hongos: Aspergillus, Fusarium y Penicillium. Fusarium es mayoritariamente hongo de campo,
Penicillium de almacenamiento y Aspergillus es micotoxigénico en ambos medios (Soriano del Castillo,
2007). En un alimento, la ausencia de especies potencialmente toxigénicas no indica que no pueda
contener micotoxinas. Los hongos presentes pueden haber dejado de ser viables después de un
tratamiento tecnológico aplicado para su elaboración (calor, por ejemplo), pero las micotoxinas,
debido a su termoresistencia, pueden encontrarse aún presentes en el mismo (Maganen y Olsen,
2004).
Según la FAO, las micotoxinas son objeto de interés mundial debido a las importantes
pérdidas económicas que acarrean sus efectos sobre la salud de las personas, la productividad de los
animales y el comercio nacional e internacional. Una micotoxina se considera “importante” si se ha
demostrado su capacidad de provocar efectos adversos considerables en varios países (FAO/OIEA,
2003). Las micotoxinas que tienen mayor importancia desde el punto de vista agroalimentario son las
aflatoxinas (B, G y M), la citrinina, las fumonisinas (especialmente FB1), la ocratoxina A, la patulina,
los tricotecenos (DAS, T-2, HT-2, NEO, DON, NIV y fusarenona X) y la zearalenona. Éstas son
capaces de producir su efecto tóxico a concentraciones extremadamente bajas (µg/L o µg/kg)
(Pascual Anderson, 2005). De entre sus posibles efectos tóxicos, es muy importante su efecto
inmunosupresor, ya que pueden disminuir las defensas, tanto de animales como de humanos,
aumentando la susceptibilidad a infecciones (Sharma, 1993). La Agencia Internacional de
Investigación sobre el Cáncer (IARC) ha clasificado varias micotoxinas como carcinógenas o
potencialmente carcinógenas para el hombre en función de evidencias experimentales y
epidemiológicas. En la tabla 1 se presenta un breve resumen de los principales efectos tóxicos de las
micotoxinas más relevantes.

Introducción general /General introduction
23
Tabla 1: Principales efectos tóxicos de las micotoxinas con mayor prevalencia agroalimentaria.
Clasificación IARC: grupo 1: carcinógeno para humanos, grupo 2A: probable carcinógeno para humanos, grupo 2B:
posible carcinógeno para humanos, grupo 3: no clasificable como carcinógeno para humanos, grupo 4: probablemente no
es carcinógeno para humanos.
Micotoxina Efectos Fisiopatológicos Clasificación IARC Referencias
Aflatoxinas Daño hepático agudo, cirrosis, inducción de tumores,
inmunosupresivas, teratogénicas, carcinogénica
B y G: 1
M1: 2B
IARC, 1987
IARC, 1993
Citrinina Toxicidad renal, temblores corporales, inmunosupresiva 3 IARC, 1987
Soriano del Castillo, 2007
Fumonisinas Leucoencefalomalacia, edema pulmonar, cáncer de esófago,
hepatotóxica, embriotóxica, teratogénica
B1: 2B IARC, 1993
WHO/IPCS, 2000
Ocratoxinas Nefropatía endémica de los Balcanes, acumulación en riñon,
tubulonefritis, vómitos, teratogénica, mutagénica, embriotóxica
A: 2B IARC, 2002
Patulina Trastornos gastrointestinales y neurológicos, temblores corporales,
mutágena e inductora de tumores
3 IARC, 1987
Soriano del Castillo, 2007
Tricotecenos Anorexia, emesis, dolor abdominal, diarrea, inmunosupresión 3 IARC, 1993
FAO/OIEA, 2003
Zearalenona Efectos estrogénicos (alteraciones en niveles de progesterona y
estradiol), descenso fertilidad, alteraciones en glándulas suprarrenales,
tiroides y pituitaria
3 IARC, 1993
FAO/OIEA, 2003
Capítulo 1/ Chapter 1
24
AFLATOXINA B1
Propiedades químicas
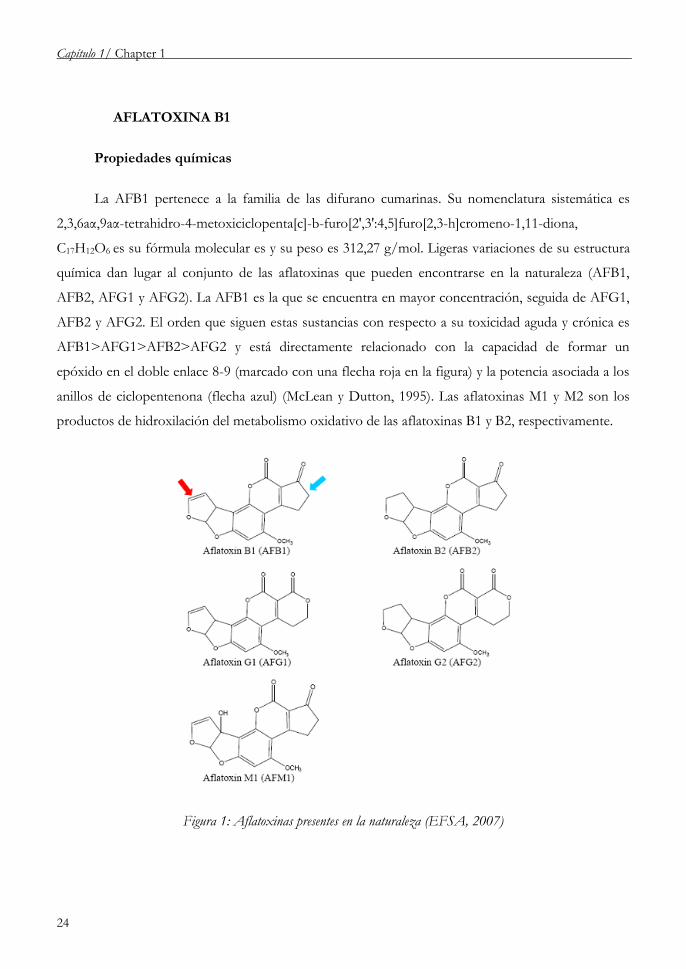
La AFB1 pertenece a la familia de las difurano cumarinas. Su nomenclatura sistemática es
2,3,6aα,9aα-tetrahidro-4-metoxiciclopenta[c]-b-furo[2',3':4,5]furo[2,3-h]cromeno-1,11-diona,
C17H12O6 es su fórmula molecular es y su peso es 312,27 g/mol. Ligeras variaciones de su estructura
química dan lugar al conjunto de las aflatoxinas que pueden encontrarse en la naturaleza (AFB1,
AFB2, AFG1 y AFG2). La AFB1 es la que se encuentra en mayor concentración, seguida de AFG1,
AFB2 y AFG2. El orden que siguen estas sustancias con respecto a su toxicidad aguda y crónica es
AFB1>AFG1>AFB2>AFG2 y está directamente relacionado con la capacidad de formar un
epóxido en el doble enlace 8-9 (marcado con una flecha roja en la figura) y la potencia asociada a los
anillos de ciclopentenona (flecha azul) (McLean y Dutton, 1995). Las aflatoxinas M1 y M2 son los
productos de hidroxilación del metabolismo oxidativo de las aflatoxinas B1 y B2, respectivamente.
Figura 1: Aflatoxinas presentes en la naturaleza (EFSA, 2007)

Introducción general /General introduction
25
Son inodoras, insípidas, incoloras e inestables en estado puro en contacto con la luz y el aire.
Sufren hidrólisis alcalina (pH> 10,5 de amoniaco o lejía) y se degradan en solución ácida pH<3. La
AFB1 es poco soluble en agua (10-30 μg/mL), pero se disuelve bien en soluciones acuosas de
metanol, dimetilsulfóxido, cloroformo, acetona y acetonitrilo. Estas características lipófilas facilitan
su paso a través de las membranas celulares y su bioacumulación (Palanee et al., 2001).
Micología
Las aflatoxinas son producidas por tres clases de hongos del género Aspergillus,
fundamentalmente: A. flavus, A. parasiticus y A. nomius. El porcentaje de cepas capaces de producir
aflatoxinas depende, no sólo del genotipo, sino también de los factores ambientales que influirán en
el crecimiento y metabolismo del hongo. Aproximadamente un 40% de las cepas de A. flavus son
aflatoxigénicas y dependientes de la estación y lugar geográfico. Sin embargo, aproximadamente el
100% de las cepas de A. parasiticus y A. nomius son aflatoxigénicas (Soriano del Castillo, 2007). La
presencia y contaminación de aflatoxinas no sólo depende de factores geográficos y estacionales, sino
también de las condiciones de cultivo, recolección y almacenamiento. Los hongos aflatoxigénicos
pueden infectar los cultivos y producir la toxina en cualquiera de los tres pasos anteriores si se dan
las condiciones adecuadas para el hongo.
Prevalencia en alimentos, legislación y exposición
Las aflatoxinas se han detectado como contaminantes naturales en productos agrícolas,
habiéndose confirmado su presencia en prácticamente todas las zonas del mundo y, en mayor o
menor medida, en todos los alimentos de primera necesidad (Soriano del Castillo, 2007). Los
alimentos típicamente contaminados con AFB1 son maíz, cacahuetes, pistachos, nueces de Brasil y
semillas de algodón. También puede aparecer en semillas oleaginosas como el girasol, la soja, aceites
vegetales sin refinar, y otros frutos secos como almendras, avellanas o nueces. También en especias
como pimentón, chili, pimienta, etc. Puede encontrarse en frutas desecadas, como higos y pasas, en
cacao, café y en cereales y productos derivados. También es relevante su presencia en piensos de
alimentación animal, y pueden encontrarse en huevos, sangre, vísceras, etc. Aunque la tasa de
transferencia entre el pienso y los productos comestibles de origen animal suele ser baja. En los
alimentos, las aflatoxinas son químicamente estables y resistentes a la degradación bajo
procedimientos de cocción normales (termoestables); por lo tanto, una vez que se producen son
difíciles de eliminar de los alimentos (Soriano del Castillo, 2007).
Capítulo 1/ Chapter 1
26
Desde 1999 existe legislación en la Unión Europea que regula el contenido máximo de
aflatoxinas en productos vegetales. Cacahuetes, nueces, frutos secos, cereales y productos procesados
para el consumo no deben estar contaminados con más de 4 µg/kg de aflatoxinas
(AFB1+B2+G1+G2), y no más de 2 µg/kg de AFB1. Para especias, los límites son algo superiores,
con un máximo de 10 µg/kg de aflatoxinas y 5 µg/kg de AFB1. La AFB1 se metaboliza a AFM1 en
rumiantes alimentados con piensos contaminados, por tanto en leche y derivados lácteos se ha
establecido un límite máximo de 0,05 µg/kg de AFM1. Para alimentos destinados al consumo infantil
no se permiten niveles superiores a 0,10 µg/kg de AFB1 y 0,025 µg/kg de AFM1 (EC, 2006).
La Unión Europea ha establecido grupos de cooperación científica (SCOOP) para recoger
datos sobre la presencia de micotoxinas en los alimentos y valorar la ingesta diaria de dichas toxinas
por la población de los Estados miembros. Para la AFB1 se ha estimado un consumo medio diario
de 0,03 a 1,3 ng/kg de pc (EC, 1997a). Sin embargo, grandes consumidores de alimentos que suelen
aparecer contaminados con aflatoxinas, como los frutos secos, pueden ver aumentada su exposición
diaria a AFB1 hasta 2,3 ng/kg de pc (EFSA, 2007). Debido a la alta toxicidad de la AFB1 no se han
podido establecer límites de exposición segura, por ello debe aplicarse el principio ALARA (as low as
reasonably achievable), que intenta mantener los límites de exposición tan bajos como sea posible.
Metabolismo
La exposición humana a aflatoxinas se produce principalmente por ingestión de alimentos
contaminados, aunque puede inhalarse ocasionalmente debido a la exposición laboral. Una vez en el
organismo se absorben por el tracto gastrointestinal gracias a su alta liposolubilidad. Llegan al hígado,
donde comienza su metabolismo, por circulación portal. En humanos, la AFB1 sigue un modelo
cinético bicompartimental con una fase de absorción y distribución rápida y una fase de eliminación
más lenta (EFSA, 2007; Jubert et al., 2009). La vida media plasmática varía entre especies (Wong y
Hsieh, 1980), y aproximadamente, el 95% de la dosis administrada se elimina en 24 h (Jubert et al.,
2009).
La AFB1 es biotransformada en el hígado por monooxigenasas microsomales de función
mixta de la superfamilia del citocromo P450 (CYP1A2, 3A4, 3A5 y 3A7) (figura 2) (McLean y
Dutton, 1995). El CYP3A4 interviene en la formación de la AFQ1 y de la forma exo-epóxido de la
AFB1, que es capaz de unirse al ADN. El CYP1A2 forma la AFM1 y la forma endo-epóxido (que no
se une al ADN) (EFSA, 2007; Urrego Novoa y Díaz, 2006). Es importante destacar que existen

Introducción general /General introduction
27
grandes diferencias interespecíficas en el metabolismo de la AFB1. Estas diferencias se deben a la
afinidad y actividad catalítica de los CYPs y de la detoxificación del complejo glutatión –S-transferasa
(GST) entre las distintas especies, así como de la capacidad de algunos CYPs de ser inducidos. En
contraste con experimentos en roedores, se ha evidenciado que en humanos el CYP3A4 (el
predominante) tiene una menor afinidad por la AFB1, y en cambio CYP1A2 posee alta afinidad.
Previsiblemente, a concentraciones de AFB1 bajas en alimentos, ésta será biotransformada
preferentemente por el CYP1A2; mientras que a concentraciones altas, la AFB1 será bioactivada por
el CYP3A4 (EFSA, 2007).
Figura 2: Metabolitos de la AFB1 (EFSA, 2007)
La AFB1 puede convertirse, de forma reversible, por la NADPH-reductasa en aflatoxicol, que
actúa como reservorio de AFB1. La AFM1, AFQ1 y el endo epóxido de la AFB1 (figura 2, A)
pueden ser eliminadas por los hepatocitos, mientras que el epóxido se une a ácidos nucleicos y
proteínas (figura 2, B). Dicho epóxido puede hidratarse a su dihidrodiol (8,9-dihidro-8,9-dihidroxi
AFB1) (figura 2, C), reorganizándose después en el correspondiente dialdehído y condensar con
aminoácidos o proteínas (como la albúmina) formando bases de Shiff (iminas C=N). El producto de
hidrólisis de la AFB1 es la AFB2a, que también es capaz de unirse a proteínas y formar bases de Shiff
(McLean y Dutton, 1995). La vía de detoxificación principal de la AFB1 es la conjugación del
epóxido con glutatión mediado por la glutation S-transferasa (GST) (figura 2, D), aunque también es
posible la actuación de la UDP-glucoronil-transferasa, sulfotransferasas (McLean y Dutton, 1995). La
mayoría de los metabolitos de la AFB1 (AFM1, AFQ1 y AFP1) son excretados por la orina en su
A
B
C
D
Capítulo 1/ Chapter 1
28
forma conjugada con glucorónidos o sulfatos. También puede darse excreción biliar, donde se rompe
el conjugado de AFB1 y se reabsorbe apareciendo recirculación entero-hepática de la micotoxina.
Una vía muy importante de excreción es la del metabolito genotóxico AFM1 por la leche,
consistiendo una vía de alto riesgo para los lactantes (EFSA, 2007). La AFM1 se excreta en 48 h y
representa entre el 1-4% de la AFB1 ingerida (Urrego Novoa y Díaz, 2006).
Toxicidad general
La AFB1 causa hepatotoxicidad aguda en humanos y animales de experimentación. Los
síntomas son necrosis hemorrágica en el hígado, proliferación de los conductos biliares, edema y
letargo, y, en intoxicaciones muy severas, la muerte. Los estudios en animales han encontrado dos
órdenes de magnitud en la LD50 media para la AFB1: conejos y patos son muy sensibles con LD50
media de 0,3 mg/kg pc, mientras que pollos, ratas, ratones y monos tienen una LD50 media de 18
mg/kg pc. Wild y Gong (2010) estimaron una DL50 en humanos de entre 0,6 y 1,6 mg kg pc a partir
de datos de víctimas en Kenia e India, encontrándonos, por lo tanto, en resistencia comparable a la
de los conejos o perros, pero menor que la de los roedores. Los seres humanos adultos tienen mayor
tolerancia a las intoxicaciones agudas de aflatoxina, y, por lo general, las víctimas mortales, si se dan,
suelen ser niños (EFSA, 2007; Williams et al., 2004). Las aflatoxicosis agudas se han relacionado con
el consumo de maíz y no con el de frutos secos. Ésto puede ser el reflejo de la susceptibilidad del
maíz a la contaminación con aflatoxinas y la alta ingesta diaria de este cereal en los países en vías de
desarrollo (Wild y Gong, 2010).
La AFB1 también es capaz de afectar al sistema inmune, produciendo en animales de
experimentación aplasias en el timo, reducción de la función y número de linfocitos T y reducción de
la actividad fagocítica y del complemento (Williams et al., 2004). Estudios en niños de Gambia y
Ghana indicaron que la exposición alimentaria a AFB1 reducía la actividad inmunológica, afectando
la capacidad de los individuos a resistir infecciones; y estudios recientes en niños menores de 5 años
de Benin y Togo han relacionado la exposición a AFB1 con retrasos en el crecimiento y falta de peso
(EFSA, 2007).
Genotoxicidad: mecanismos moleculares
La Agencia Internacional para la Investigación del Cáncer (IARC) ha concluido que existe
suficiente evidencia de que estas micotoxinas son carcinógenas para el ser humano (grupo 1), estando

Introducción general /General introduction
29
involucradas en el cáncer de hígado, sobre todo en pacientes portadores de antígenos del virus de la
Hepatitis B (IARC, 1987; IARC, 1993). En animales de experimentación hay suficiente evidencia de
carcinogenicidad de las mezclas naturales de aflatoxinas, así como de las aflatoxinas B1, G1 y M1,
limitada evidencia para la aflatoxina B2 y evidencia inadecuada para la aflatoxina G2. Las aflatoxinas
son capaces de formar tumores en el hígado y en otros órganos, principalmente riñón y colon. La
AFB1 es genotóxica in vitro e in vivo (EFSA, 2007). El comité conjunto de expertos FAO/WHO en
aditivos alimentarios (JECFA) concluyó en 1998 que las aflatoxinas se encuentran entre las sustancias
conocidas con mayor poder mutagénico y carcinógeno (JECFA, 1998).
Interacción con ácidos nucleicos
Los heteroátomos de las bases nitrogenadas de los ácidos nucleicos son muy susceptibles al
ataque nucleofílico de los metabolitos de la AFB1, formando enlaces covalentes. Además, la
conformación plana del anillo de ciclopentenona fusionado con la lactona de la cumarina, facilita el
proceso de intercalado con el ADN (o ARN). Cualquier alteración en la estructura de ácidos
nucleicos (ADN y ARN) inhibirá su acción programada y en último lugar, inhibirá la síntesis de
proteínas (McLean y Dutton, 1995).
Figura 3: Aducto ADN-AFB1 (Urrego Novoa y Díaz, 2006)
El epóxido de aflatoxina se une covalentemente al nitrógeno 7 de los residuos guanil del ADN
(o ARN). Se forma el aducto 8,9-dihydro-8-(N7-guanil)-9-hidroxi-AFB1 (AFB1-N7-Gua) como
lesión primaria (McLean y Dutton, 1995), que evoluciona rápidamente a lesiones secundarias que
pueden ser: lugares apúricos (“AP sites”), que son bases apúricas o apirimidínicas (en rosa en la
Capítulo 1/ Chapter 1
30
figura 4) o aductos de anillos abiertos de purina, que son las AFB1-formamidopirimidinas (AFB1-
FAPY, en verde en la figura 4) (Smela et al., 2002). Estas lesiones son reparadas por mecanismos de
escisión, dando lugar a roturas de una hebra o de las dos previos a la reparación (EFSA, 2007).
Estudios recientes indican que el compuesto mutagénico es el AFB1-FAPY. Este aducto causa la
transversión G>T con mucha mayor frecuencia que la lesión primaria y es un gran bloqueador en la
replicación del ADN. En humanos de zonas con gran prevalencia del HBV se han observado
transversiones G>T en el codon 249 del gen p53 (Waters et al., 1992; Bedard y Massey, 2006). Los
metabolitos de los aductos tras la reparación se pueden encontrar en orina y son un buen indicador
de la exposición (EFSA, 2007; Urrego Novoa y Díaz, 2006).
Interacción con proteínas: unión e inhibición enzimática
La AFB1 puede unirse a proteínas en forma de su metabolito AFB1-8,9-dihidroindol,
transformándose en un dialdehido y formando bases de Shiff. En el caso de la albúmina, reacciona
con el grupo amino primario del residuo lisina y forma el aducto albúmina-aflatoxina (AF-alb). Una
fracción de la AFB1 bioactivada es capaz de unirse a proteínas celulares y traslocarse a distintos
orgánulos e incluso al núcleo. Un ejemplo de la distinta afinidad del dihidroindol de aflatoxina a
proteínas sería kinasa> albúmina> anhidrasa carbónica> RNasa pancreática> histonas. La unión de
AFB1 a proteínas funcionales inhibe la función de la proteína, particularmente de las enzimas. Si la
síntesis de proteínas no se afectara, las proteínas no funcionales serían reemplazadas por otras
sintetizadas de novo, y su destrucción sería una forma de detoxificar la AFB1 (McLean y Dutton,
1995), pero la inhibición en la síntesis de proteínas es su mayor efecto metabólico e impide el
reemplazo de moléculas fundamentales.
Inducción de estrés oxidativo
Amstad et al. en 1984 postularon una nueva vía de acción de la micotoxina. La AFB1 sería
capaz de ser genotóxica por una vía indirecta a través de intermedios activos de oxígeno,
hiperoxidasas lipícas y pequeños aldehídos. En ese estudio, la inducción del intercambio de
cromátidas hermanas en linfocitos se daba a muy bajas concentraciones de aductos AFB1-ADN; por
tanto, por ellos mismos no se puede explicar toda la genotoxicidad (Amstad et al., 1984). Lee et al.
(2005) fueron capaces de provocar estrés oxidativo por AFB1 (10 μM) en la línea celular Hep G2
(células de hepatocarcinoma humano) y detectarlo en forma de especies reactivas de oxígeno (ROS) y
8-OHdG (marcador de daño oxidativo en el ADN). Se ha observado que la AFB1 es capaz de

Introducción general /General introduction
31
inducir la formación de 8-OHdG en hígado de rata y pato. Esta lesión en el ADN puede inducir la
transversión G>T, lo cual resultaría en una contribución a la carcinogenicidad de la AFB1 (Bedard y
Massey, 2006).
Figura 4: Evolución del aducto AFB1-ADN (Smela et al., 2002)
Capítulo 1/ Chapter 1
32
OCRATOXINA A
Propiedades químicas
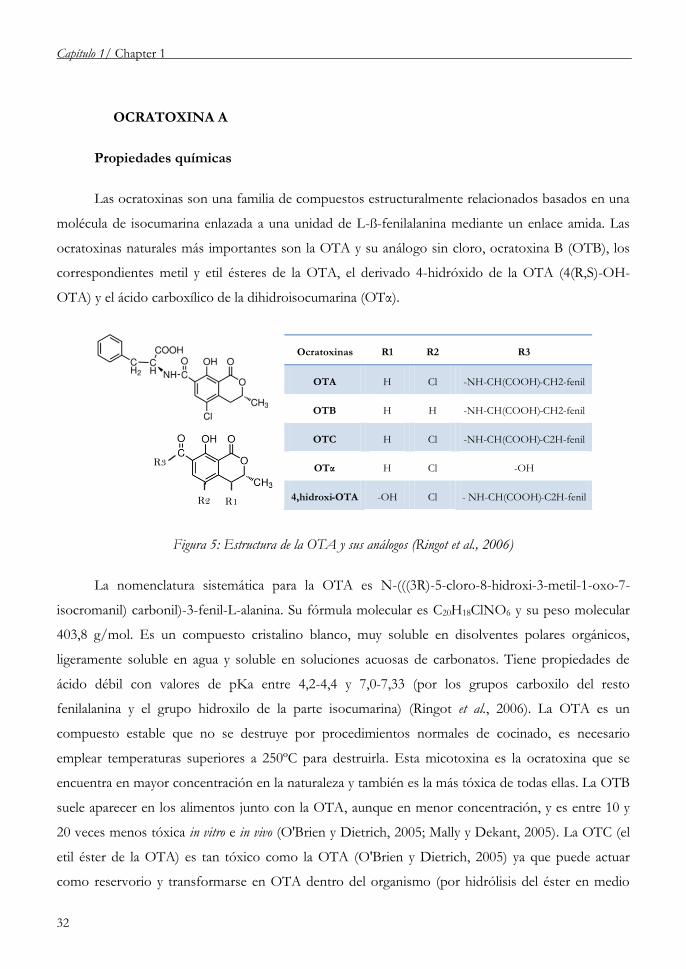
Las ocratoxinas son una familia de compuestos estructuralmente relacionados basados en una
molécula de isocumarina enlazada a una unidad de L-ß-fenilalanina mediante un enlace amida. Las
ocratoxinas naturales más importantes son la OTA y su análogo sin cloro, ocratoxina B (OTB), los
correspondientes metil y etil ésteres de la OTA, el derivado 4-hidróxido de la OTA (4(R,S)-OH-
OTA) y el ácido carboxílico de la dihidroisocumarina (OTα).
Figura 5: Estructura de la OTA y sus análogos (Ringot et al., 2006)
La nomenclatura sistemática para la OTA es N-(((3R)-5-cloro-8-hidroxi-3-metil-1-oxo-7-
isocromanil) carbonil)-3-fenil-L-alanina. Su fórmula molecular es C20H18ClNO6 y su peso molecular
403,8 g/mol. Es un compuesto cristalino blanco, muy soluble en disolventes polares orgánicos,
ligeramente soluble en agua y soluble en soluciones acuosas de carbonatos. Tiene propiedades de
ácido débil con valores de pKa entre 4,2-4,4 y 7,0-7,33 (por los grupos carboxilo del resto
fenilalanina y el grupo hidroxilo de la parte isocumarina) (Ringot et al., 2006). La OTA es un
compuesto estable que no se destruye por procedimientos normales de cocinado, es necesario
emplear temperaturas superiores a 250ºC para destruirla. Esta micotoxina es la ocratoxina que se
encuentra en mayor concentración en la naturaleza y también es la más tóxica de todas ellas. La OTB
suele aparecer en los alimentos junto con la OTA, aunque en menor concentración, y es entre 10 y
20 veces menos tóxica in vitro e in vivo (O'Brien y Dietrich, 2005; Mally y Dekant, 2005). La OTC (el
etil éster de la OTA) es tan tóxico como la OTA (O'Brien y Dietrich, 2005) ya que puede actuar
como reservorio y transformarse en OTA dentro del organismo (por hidrólisis del éster en medio
R3
R2 R1
Ocratoxinas R1 R2 R3
OTA H Cl -NH-CH(COOH)-CH2-fenil
OTB H H -NH-CH(COOH)-CH2-fenil
OTC H Cl -NH-CH(COOH)-C2H-fenil
OTα H Cl -OH
4,hidroxi-OTA -OH Cl - NH-CH(COOH)-C2H-fenil
Introducción general /General introduction
33
ácido) (Ringot et al., 2006). La OTα (sin el resto fenilalanina) es la menos tóxica de ellas. En general,
estudios estructura-actividad sugieren que el resto isocumarina y el grupo lactona están muy
relacionados con la toxicidad de las ocratoxinas (Xiao et al., 1996).
Micología
Las ocratoxinas son producidas por los géneros de hongos Aspergillus y Penicillium. Dentro del
género Aspergillus, las principales especies ocratoxigénicas son A. ochraceus, A. niger y A. carbonarius.
Sólo el 50% de las cepas de A. ochraceus son capaces de generar la toxina; mientras que
aproximadamente el 100% de las de A. carbonarius y algo menos del 100% de las A. niger tienen esta
capacidad. A. ochraceus se desarrolla en zonas templadas y cálidas en alimentos como café, cacahuetes
y frutos secos; A. niger es ubicua y puede aislarse en gran número de sustratos; A. carbonarius es
menos frecuente; se puede encontrar en vino, uva y uvas pasas. P. Verrucosum es la especie
ocratoxigénica dentro del género Penicillium. Este hongo no se desarrolla a temperaturas superiores a
30ºC, por tanto es típico de zonas templadas o frías (Soriano del Castillo, 2007).
Prevalencia en alimentos, legislación y exposición
La exposición a la OTA se produce principalmente en zonas templadas donde se cultiva trigo,
cebada, centeno, arroz, avena, maíz, mijo, café, uvas, cacao, especias, te, dátiles, higos, guisantes, etc.
Es relevante su presencia en productos elaborados a partir de materia prima contaminada, como el
vino, vinagre, cerveza, chocolate, kétchup, los zumos de frutas, uvas pasas y aceites. La detección en
Europa de la presencia de OTA en productos y sangre de cerdo ha demostrado que esta toxina
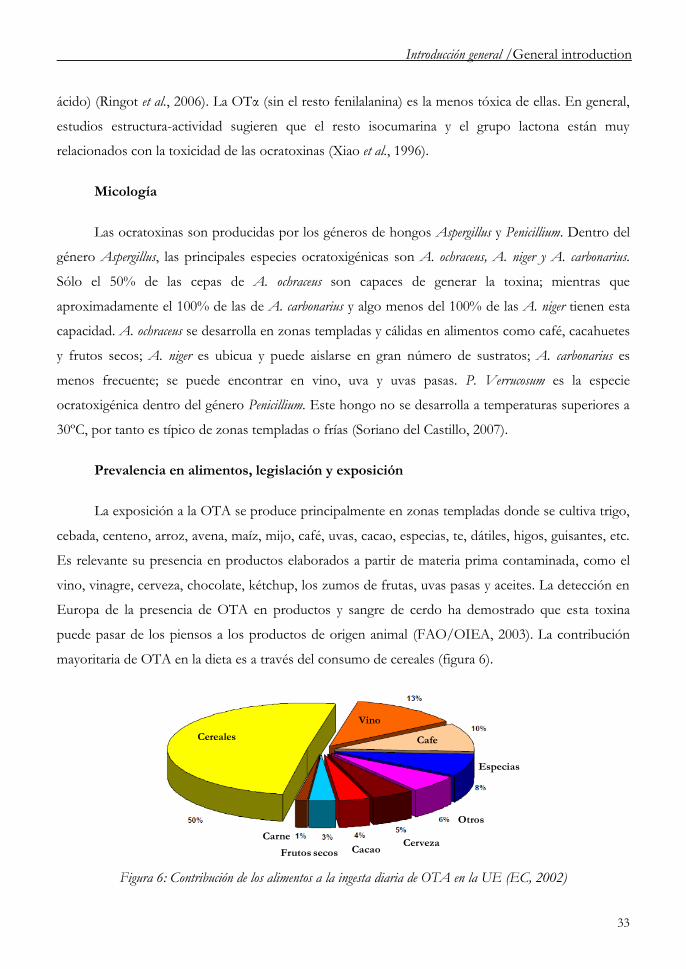
puede pasar de los piensos a los productos de origen animal (FAO/OIEA, 2003). La contribución
mayoritaria de OTA en la dieta es a través del consumo de cereales (figura 6).
Figura 6: Contribución de los alimentos a la ingesta diaria de OTA en la UE (EC, 2002)
Cereales
Vino
Cafe
Especias
Otros
CervezaCacaoFrutos secos
Carne

Capítulo 1/ Chapter 1
34
La Unión Europea reguló en 2006 el contenido máximo de OTA en alimentos de consumo
humano (Comisón Europea (EC) nº 1881/2006) (EC, 2006). Así, los cereales en general y el café en
grano, tostado o molido no deben superar los 5 µg/kg. Los derivados de cereales no pueden superar
los 3 µg/kg. Las uvas pasas y el café soluble pueden contener hasta 10 µg/kg. Los vinos y zumos de
uva no superarán los 2 µg/kg y los alimentos de consumo infantil no podrán superar los 0,5 µg/kg.
En 2010 la Unión Europea reguló también el contenido máximo en especias y regaliz siendo 15 y 20
µg/kg, respectivamente (EC, 2010).
La JEFCA en 1991 estableció una IDT de 16 ng/kg de pc que corresponde a un consumo
semanal de 112 ng/kg (JEFCA, 1991). Posteriormente, el Comité Científico de la Comisión Europea
sobre alimentación humana valoró los datos científicos sobre la OTA, y, debido a sus posibles
efectos cancerígenos, consideró que sería prudente reducir la exposición tanto como fuera posible y
en cualquier caso siempre inferior a 5 ng/kg de pc y día, lo que corresponde a 35 ng/kg pc semanales
(EC, 1997b). En el informe del proyecto SCOOP Task 3.2.7 en 2002, se presentan los datos de
ingesta diaria de OTA en 12 países europeos, siendo, por ejemplo en España, de 1,18 ng/kg de pc
(EC, 2002). El consumo medio de OTA en Europa es de unos 45 ng/kg de pc por semana,
suponiendo un peso medio de 60 kg, y la mayor exposición sería debida a cereales (58%) (WHO,
2001). El comité de expertos de la JEFCA determinó, en la opinión publicada el 23 de Septiembre de
1994, que la OTA es un potente agente nefrotóxico, un carcinógeno en roedores y que tiene
propiedades genotóxicas; por tanto, era necesario determinar una exposición diaria aceptable a esta
sustancia. Al crecer la preocupación sobre los efectos potencialmente genotóxicos de la OTA, dicho
comité consideró el 17 de septiembre de 1998, reducir su exposición al máximo y en cualquier caso
no superar los 5 ng/kg de pc (JECFA, 1998).
Metabolismo
En la mayoría de especies animales, el perfil cinético de la OTA se ha descrito como un
modelo de dos compartimentos, pero los datos de acumulación renal sugieren que este modelo es
demasiado sencillo y se recomienda un re-análisis de los datos en un modelo multi-compartimental
(EFSA, 2006). En humanos, el modelo bicompartimental sugiere una fase rápida de absorción y
distribución (t1/2 de 20 horas) y una lenta eliminación, con una semivida plasmática de unos 35 días
(Studer Rohr et al., 2000). Tras la ingesta oral, es rápidamente absorbida, pasa a circulación sistémica
por vía portal y se une a proteínas plasmáticas, en su mayoría albúmina (en un 99,98% en humanos),

Introducción general /General introduction
35
lo cual facilita su absorción pasiva y explica en parte la larga vida media en el organismo. Debido a
esta alta afinidad por las proteínas, la OTA puede encontrarse en riñón, hígado, grasa y músculo
(Kuiper Goodman y Scott, 1989).
La biotransformación de la OTA no ha sido elucidada por completo y su metabolismo sigue
generando controversia. Al tener la OTA y algunos de sus metabolitos el resto fenilalanina, se
comporta como un análogo de este aminoácido y, por tanto, puede interferir en todas las vías que lo
implican (Dirheimer y Creppy, 1991). Las enzimas involucradas en estos procesos son: isoformas del
citocromo P450, prostaglandina sintasa (PGSH) y lipooxigenasas (LOX). La vía metabólica
mayoritaria es la hidrólisis del enlace peptídico hacia un compuesto mucho menos tóxico como es la
OTα (figura 7). Enzimas microsomales humanas (cerdo y rata) son capaces de hidroxilar la OTA
(figura 7) a dos epímeros 4(R),4(S)-OH OTA (4(R)-OH OTA en rata y humano y 4(S)-OH OTA en
cerdo). Estos compuestos no son tóxicos, debido a su rápida eliminación en comparación con la
OTA. Se ha encontrado in vitro la presencia de otro derivado hidroxilado: el 10-OH OTA que podría
aparecer también in vivo (figura 7). El derivado no clorado, la OTB, aparece junto con la OTA en
cereales y como metabolito tras la incubación in vitro en células de riñón de mono (figura 7). La OTB
es 10 veces menos tóxica en pollitos, no tóxica en patitos y ratas (Ringot et al., 2006) y aparentemente
no es genotóxica (Knasmuller et al., 2004).
Figura 7: Metabolismo de la OTA

Capítulo 1/ Chapter 1
36
Los estudios cinéticos revelan un lento aclaramiento y, por tanto, una larga vida plasmática en
general, aunque existen grandes diferencias entre especies. La excreción es mayoritariamente renal,
aunque en roedores prevalece la excreción biliar. La OTA y su metabolito principal, OTα, son
excretados por las heces debido a la excreción biliar, que es muy eficaz. Pero la excreción biliar hace
que la OTA entre en recirculación enterohepática, y se aprecien segundos picos de distribución en
sangre y redistribución por los tejidos. Otra vía secundaria de excreción es la leche materna, vía de
exposición muy importante para bebes lactantes (EFSA, 2006).
En la eliminación renal, la filtración glomerular (ultrafiltro pasivo del plasma, dejando paso a
solutos e impidiendo el paso de proteínas) es limitada debido a la alta afinidad de la OTA por
proteínas plasmáticas. Los transportadores de aniones orgánicos (oat) de las membranas basolaterales
introducen la OTA en la célula epitelial y por un transportador similar pasan a las células del túbulo
proximal. Los transportadores hOAT1 (predominantes en el riñón) y hOAT3 (presente en hígado y
cerebro) se han identificado como mediadores del transporte de la OTA. La OTA sale de la célula a
través de la membrana apical del túbulo proximal por difusión facilitada, pero puede ser reabsorbida
en todos los segmentos de la nefrona por la presencia de los transportadores oat (como el hOAT4 de
la membrana apical del túbulo proximal). Se han sugerido otras vías de reabsorción tubular, como el
co-transportador H+-dipeptidasa y la difusión pasiva no iónica (Ringot et al., 2006). Estos procesos
de recirculación favorecen el lento aclaramiento de la toxina y la bioacumulación en el riñón (Ringot
et al., 2006).
La biotransformación de la OTA en sus metabolitos no explica el largo espectro de efectos
tóxicos de la OTA. Se sugiere que se dan reacciones de bioactivación que explican los efectos
nefrotóxicos y carcinogénicos.
Toxicidad general
En humanos se conoce un caso de ocratoxicosis aguda debido a la inhalación prolongada de la
micotoxina (Di Paolo et al., 1994); sin embargo, las intoxicaciones agudas relevantes aparecen en
animales de granja (Hussein y Brasel, 2001). Son más sensibles a la OTA los patos, pollos, pavos y
cerdos (DL50 0,5; 3,3; 5,9; 6,0 mg/kg pc, respectivamente) que la rata o el ratón (DL50 20; 46 mg/kg
pc) (O'Brien y Dietrich, 2005). Los rumiantes son muy poco sensibles a la OTA, ya que es destruida
en sus estómagos (Ringot et al., 2006).

Introducción general /General introduction
37
La OTA es principalmente nefrotóxica. En humanos se ha relacionado con la nefropatía
endémica de los Balcanes y un aumento en la incidencia de tumores en el tracto urinario, aunque los
datos epidemiológicos no son concluyentes (Pfohl Leszkowicz, 2009). El consumo crónico de pienso
contaminado con OTA se ha asociado con la nefropatía aviar espontánea (Hamilton et al., 1982) y la
nefropatía porcina (Krogh et al., 1979), siendo el cerdo una de las especies más sensibles a la
nefrotoxicidad de la OTA. En estudios de toxicidad a dosis repetida, la OTA ha sido nefrotóxica en
todas las especies monogástricas testadas, habiéndose observado diferencias significativas entre sexos
y especies (Kuiper Goodman y Scott, 1989). Las diferencias entre especies están muy relacionadas
con la unión de la OTA a proteínas plasmáticas y su aclaramiento renal (Hagelberg et al., 1989),
mientras que las diferencias entre sexos no están elucidadas aún (Vettorazzi et al., 2010; Vettorazzi et
al., 2011). Estudios en ratas han confirmado que los túbulos contorneados distales de las nefronas de
la franja exterior de la médula externa del riñón son dianas específicas de la OTA (Munro et al.,
1974).
La OTA ha demostrado efectos neurotóxicos en ratón (Sava et al., 2006a), rata (Wangikar et al.,
2004a) y conejo (Wangikar et al., 2005), y es capaz de bioacumularse en el cerebro en función del
tiempo. El mesencéfalo ventral y el cerebelo parecen ser las zonas más sensibles a la OTA
(Belmadani et al., 1998). Sava et al. (2006b) observaron disminución de dopamina y aumento de estrés
oxidativo en diferentes regiones cerebrales de ratones tratados con OTA. Los autores apoyan la idea
de que la OTA afecta a la vía nigro-estriada y puede aumentar el riesgo a desarrollar la enfermedad de
Parkinson. Otros efectos tóxicos asociados a la OTA son su inmunotoxicidad (Sharma, 1993;
Alvarez et al., 2004) y teratogenicidad (Wangikar et al., 2004a; Wangikar et al., 2004b; Wangikar et al.,
2005). Según la EFSA, en un estudio en cerdos a 90 días, la mínima dosis de OTA para generar
efectos neurotóxicos e inmunológicos es 6 veces la dosis nefrotóxica, y 20 veces para observar
efectos teratogénicos (EFSA, 2006).
Genotoxicidad: mecanismos moleculares
La carcinogenicidad de la OTA ha sido evaluada en rata y ratón y se ha observado un aumento
en la incidencia de tumores hepatocelulares en ratón, y adenomas y carcinomas renales en ratones y
ratas macho (NTP, 1989; Bendele et al., 1985; Castegnaro et al., 1998), aunque la OTA administrada
junto con pienso fue significativamente menos carcinogénica que administrada directamente vía
sonda gástrica (Mantle et al., 2005). La IARC ha determinado que no existe suficiente evidencia de
Capítulo 1/ Chapter 1
38
carcinogenicidad en humanos, pero sí suficiente evidencia de carcinogenicidad en animales de
experimentación; por tanto, clasificó la OTA como posible carcinógeno humano (IARC, 2002). Los
mecanismos moleculares de la genotoxicidad de la OTA aún no han sido elucidados.
Se han realizado numerosos estudios para evaluar la mutagenicidad de la OTA obteniéndose
resultados contradictorios. Arbillaga et al. en 2004 revisaron los resultados más relevantes sobre la
capacidad de la OTA para causar mutación génica, reparación de ADN, fragmentación de ADN y
alteraciones cromosómicas (Arbillaga et al., 2004). Ni la OTA ni sus metabolitos fueron capaces de
generar mutaciones en bacterias, a no ser que en el medio de cultivo hubiera células íntegras (de
Groene et al., 1996). Sin embargo, la OTA fue capaz de inducir procesos de reparación de ADN en
hepatocitos y otras células diana. Tanto in vitro como in vivo, existen resultados positivos y negativos
sobre la capacidad de generar roturas en la cadena de ADN en forma de intercambio de cromátidas
hermanas, alteraciones cromosómicas, formación de micronúcleos y migración de fragmentos en
electroforesis en gel (Arbillaga et al., 2004).
Si bien la genotoxicidad de la OTA está demostrada, los mecanismos por los que esta
micotoxina daña el ADN no lo están en absoluto. La OTA se ha estudiado desde dos mecanismos
genotóxicos contrarios: como genotóxico directo, estudiando la formación de aductos de ADN, o
como genotóxico indirecto (epigenético), dañando el ADN por un aumento de estrés oxidativo.
Formación de aductos de ADN
Se han buscado aductos como uniones covalentes entre la OTA o sus metabolitos con ADN
de ratón y rata sintetizando patrones del aducto mayoritario de la OTA (O-C8 OTA-3'-dGMP) y
buscándolo in vivo mediante la técnica de 32P-postlabeling (Pfohl Leszkowicz et al., 1991; Pfohl
Leszkowicz et al., 1993; Faucet et al., 2004; Pfohl Leszkowicz y Castegnaro, 2005; Mantle et al., 2010).
Sin embargo, estudios posteriores observaron que la técnica 32P-postlabeling no es específica y no se
puede asegurar que en los aductos detectados esté presente la molécula de OTA. En muestras de
animales tratados con OTA marcada radiactivamente (3H-OTA) (Gautier et al., 2001a) o analizadas
por espectroscopía de aceleración de masas (AMS) o cromatografía líquida MS/MS no se han
encontrado aductos de OTA (Mally et al., 2004; Mally, 2005; Delatour et al., 2008) y sus autores
proponen mecanismos alternativos al daño directo de la OTA o sus metabolitos.

Introducción general /General introduction
39
Estrés oxidativo y formación de especies reactivas de oxígeno (ROS)
La toxicidad de la OTA se ha relacionado con el estrés oxidativo aunque no está claro si se
debe mayoritariamente a una inducción de ROS o a un descenso en las defensas antioxidantes
intracelulares.
Gautier et al. (2001B) examinaron in vivo la formación de marcadores de estrés oxidativo y
encontraron alteraciones, específicamente en riñón, de marcadores de estrés temprano como
hemooxigenasa 1 (HO-1) y el marcador de estrés de membrana α-tocoferol, pero no inducción de
marcadores de estrés tardío como el aumento de malondialdehido (MDA, producto final de la
peroxidación lipídica y marcador de daño renal) o daño en el ADN por formación de 8-oxo-guaninas
(8-oxodG). Sin embargo, en estudios in vitro se ha confirmado la formación de MDA y aductos 8-
oxodG. Las discrepancias entre el in vitro el in vivo pueden ser debidas a los mecanismos de defensa
antioxidante que in vivo contrarrestan el ROS formado, pero que no están presentes en los modelos in
vitro.
Estudios en líneas celulares (Hep G2, Caco 2, MDCK, BME-UV1, HK-2) han mostrado la
capacidad de la OTA de inducir ROS, reducir la viabilidad celular e inhibir la síntesis de ADN y
proteínas; y cómo algunos antioxidantes (α-tocoferol, retinol, N-acetilcisteína) son capaces de
proteger las células (Baldi et al., 2004; Renzulli et al., 2004; Guerra et al., 2005; Costa et al., 2007;
Arbillaga et al., 2007). También se ha relacionado la inducción de radicales con daño en el ADN
(Arbillaga et al., 2007; Ehrlich et al., 2002; Lebrun y Follmann, 2002; Kamp et al., 2005; Simarro
Doorten et al., 2006; Zeljezic et al., 2006).
Dai et al. (2002) propusieron dos hipótesis que podrían explicar cómo la OTA es capaz de
inducir ROS. Una posibilidad sería (figura 8) que la OTA2- (forma favorecida por el pH in vivo (A)) se
trasformara en un radical fenólico (figura 8, B) que puede tomar dos rutas. Como se indica, en la ruta
C puede oxidar el glutation (GSH) y formar el radical tiilo (GS•), que reacciona con otro radical
dando un disulfuro de glutation (GSSG), y el radical anión superóxido (O2-•). Otra posibilidad (figura
8, D) sería que el radical fenólico participara en una ruta vía radical libre transformándose en una
quinona (OTAQ) y generándose O2-• (figura 8, E) en su equilibrio quinona/hidroquinona
(OTAQ/OTAHQ). El GSH puede actuar como sustrato y conjugarse con la OTAHQ dando
OTAHQ-GS que, en un proceso oxidativo, genera el conjugado cisteinilo (OTAHQ-cisteinil) que
puede generar ROS o unirse covalentemente a proteínas (figura 8, F y G). La otra hipótesis postula

Capítulo 1/ Chapter 1
40
que la OTA en su forma fenólica (OTA-) sea convertida en un catión fenoxonio (figura 8, J) que a su
vez se transforme en la OTAQ (figura 8, K) (Ringot et al., 2006; Dai et al., 2002).
Por otro lado, la administración repetida de OTA es capaz de reducir significativamente los
niveles de antioxidantes intracelulares como glutatión (GSH), superóxido dismutasa (SOD), catalasa
(CAT) o glutatión peroxidasa (GSPx) en hígado y riñón (Meki y Hussein, 2001) y aumentar la
peroxidación lipídica (Khan et al., 1989). Estudios estructura-actividad han postulado que el átomo de
cloro es esencial para el efecto genotóxico de la OTA, ya que los compuestos clorados que inducen
daño en el ADN, sufren antes un proceso de bioactivación a benzoquinonas (Ringot et al., 2006).
Figura 8: Formación de ROS por la OTA (Ringot et al., 2006)
Estudios de expresión génica han probado que la OTA es capaz de reducir la expresión de
genes involucrados en la protección oxidativa intracelular más intensamente en hígado que en riñón
(Cavin et al., 2007; Arbillaga et al., 2008); y que aumenta la expresión de la óxido-nitrico sintetasa

Introducción general /General introduction
41
inducible (iNOs), enzima responsable de la producción de óxido nítrico (NO). El NO puede
reaccionar con el O2-• y generar peroxinitritos que evolucionan a especies reactivas de nitrógeno
(RNS) que reaccionan con ADN y proteínas (Marin Kuan et al., 2011).
La información disponible sugiere que la OTA es poco probable que actúe a través de un
único mecanismo de acción. La OTA, especialmente en el riñón, genera estrés oxidativo
directamente (generación de radicales que alteran los ciclos redox) e indirectamente (disminución de
las defensas antioxidantes). Ambos mecanismos pueden interactuar, ya que la reducción de las
defensas amplifica el impacto de la producción de radicales libres (Marin Kuan et al., 2011). Por
tanto, el mecanismo de acción propuesto como responsable de la carcinogenicidad de la OTA sería
una red de interacción de mecanismos epigenéticos, incluyendo la inhibición de la síntesis de
proteínas, el estrés oxidativo y la activación de determinadas vías de señalización celular (Marin Kuan
et al., 2008).

Capítulo 1/ Chapter 1
42
TOXICIDAD COMBINADA
Aunque la literatura científica ofrece gran cantidad de información sobre el efecto individual
de las toxinas, la exposición múltiple y simultánea es un hecho que se ajusta más a la realidad. Por
ejemplo, aflatoxinas y fumonisinas, DON (u otros tricotecenos) y ZEA aparecen frecuentemente co-
existiendo en el mismo cereal (Ibáñez-Vea et al., 2011; Ibáñez-Vea et al., 2012), en higos (Bircan,
2009), uvas (El Khoury et al., 2008), arroz (Nguyen et al., 2007), o productos elaborados como los
cereales de desayuno (Villa y Markaki, 2009). Estudios de exposición conjunta confirman la presencia
de biomarcadores de exposición a OTA, AFB1 y AFB2 en niños de Sierra Leona (Jonsyn Ellis,
2001), OTA y aflatoxinas en pacientes con enfermedades renales crónicas en Sri Lanka (Desalegn et
al., 2011), o tricotecenos, aflatoxinas y OTA en individuos expuestos a mohos en EEUU tras el
huracán Katrina (Hooper et al., 2009).
La combinación de varias micotoxinas en un organismo puede provocar distintos efectos:
o Aditivos: el efecto final es la suma de los efectos individuales.
o Antagónicos: el efecto final es menor que la suma de los efectos individuales.
o Sinérgicos: el efecto final es mayor que la suma de los efectos individuales.
En 2006, McKean et al. (2006a y 2006b) presentaron dos trabajos con similar metodología
para estudiar los efectos sinérgicos de la AFB1 con la toxina T-2 y la FB1 en modelos in vitro e in vivo.
Emplearon dos líneas celulares: Hep G2 (hepatocarcinoma humano) y BEAS-2B (epiteliales de
pulmón humano), ratas F344 y peces Gambusia affinis. Con respecto a la citotoxicidad, en Hep G2 la
toxicidad conjunta fue aditiva para AFB1+T-2 y ligeramente antagonista para AFB1+FB1 mientras
que en BEAS-2B ambas combinaciones fueron sinérgicas. En ratas y peces las combinaciones con
AFB1 fueron aditivas tras una dosis. Sin embargo, en ratas Wistar la presencia de FB1 potenció el
efecto de la AFB1 en un estudio a dosis repetida (Pozzi et al., 2001)
Creepy et al. en 2004 estudiaron la citotoxicidad conjunta entre OTA y FB1 en las líneas
celulares Caco-2 (adenocarcinoma colorectal humano) y Vero (epiteliales de riñón de mono
cercopiteco verde). Los resultados mostraron un efecto sinérgico entre ambas micotoxinas. La FB1
sola es un tóxico débil, y la OTA un tóxico moderado, mientras que conjuntamente, muestran una
toxicidad superior a la suma de sus efectos aislados. Los autores atribuyen el efecto sinérgico a que
Introducción general /General introduction
43
ambas generan ROS e impiden la síntesis de proteínas y otras macromoléculas (Creppy et al., 2004).
En 2006, Heussner et al. estudiaron la citotoxicidad de OTA, OTB, CIT y PAT individualmente, en
combinaciones 2 a 2 y todas en conjunto en células renales LLC-PK1 (epiteliales de riñón de cerdo).
Individualmente observaron el siguiente órden de toxicidad tras 24 h de exposición: PAT > OTA ≥
OTB > CIT. Sin embargo, en los tratamientos 2 a 2 CIT + OTA > OTB + OTA > PAT + OTA y
también CIT + OTB > PAT + OTB > OTA + OTB. Concluyen que existe un efecto sinérgico
entre la CIT y la OTA y posiblemente con otras micotoxinas en células renales. Así pues, la toxicidad
de éstos compuestos combinados no puede predecirse en base a los resultados de citotoxicidad
individual.
Datos in vivo mostraron que combinaciones de OTA con CIT pueden tener efectos
nefrotóxicos aditivos o sinérgicos en aves, cerdos, ratón y rata (Pohland et al., 1992; Speijers, 2004).
Sin embargo, las combinaciones de OTA+T2 y OTA+DON no mostraron interacciones en pollitos
y cerdos, respectivamente (Ringot et al., 2006).
Con respecto a combinaciones de AFB1 y OTA existe un número limitado de trabajos hasta la
fecha. Ha sido publicado recientemente que AFB1 y OTA muestran una asociación citotóxica
ligeramente aditiva en células Vero (epiteliales de riñón de mono cercopiteco verde) y que la mezcla
era capaz de aumentar la fragmentación de ADN en comparación con los tratamientos individuales
(El Golli-Bennour et al., 2010). Sedmíková et al. (2001) estudiaron la mutagenicidad de las dos toxinas
individualmente y en combinación con el fin de encontrar sinergias entre ellas. Llegaron a la
conclusión de que, si bien la OTA daba resultados negativos en el Test de Ames con Salmonella
typhimurium (TA98 y TA100), con y sin activación metabólica, la presencia de OTA aumentaba
significativamente el efecto mutagénico de la AFB1.
En aves, las AFB1 y OTA tuvieron efecto sinérgico aumentando la mortalidad, pero la OTA
inhibió la acumulación lipídica en el hígado que habitualmente genera la AFB1 (Huff y Doerr, 1981;
Huff et al., 1983; Huff et al., 1988). En cerdos, no mostraron interacción con respecto a parámetros
bioquímicos séricos, pero fueron antagonistas con respecto al daño renal (Ringot et al., 2006). En
ratas, la mezcla no mostró interacción con respecto a la mortalidad, ganancia de peso, histología
hepática y la mayoría de parámetros séricos (Ringot et al., 2006); mientras que en estudios sobre la
teratogenicidad de la mezcla, las lesiones en cerebro, hígado y riñón de fetos fueron menores que
cuando se administraban individualmente (Wangikar et al., 2004a; Wangikar et al., 2004b). En gallinas

Capítulo 1/ Chapter 1
44
ponedoras se observaron menores cantidades de AFB1 y OTA en pechuga, hígado y riñón así como
en los huevos puestos (Zahoor Ul Hassan et al., 2011).
Los datos existentes muestran que son poco habituales los estudios adecuados para establecer
antagonismos, sinergias y efectos aditivos y su interpretación resulta complicada. Como punto de
partida, se puede intentar entender la toxicidad combinada de las micotoxinas en función de su
mecanismo de acción individual en la célula. Así, en micotoxinas con modos de acción similares se
podrían esperar efectos aditivos, o incluso algunas interacciones podrían ser antagonistas (Speijers,
2004). En el caso de la AFB1 y la OTA, los mecanismos de acción son muy dispares, pero ambos
comienzan en la biotransformación en el citocromo P450, así que podría darse cualquier tipo de
asociación. En la práctica, el resultado cuantitativo o cualitativo obtenido puede ser muy distinto al
esperado y, como se ha revisado, AFB1 y OTA pueden dar cualquier tipo de interacción entre ellas in
vitro e in vivo. El resultado parece depender de las especies o del estudio de toxicidad realizado o
incluso del tipo de criterio de valoración empleado.

Introducción general /General introduction
45
BIBLIOGRAFÍA
Alvarez, L., Gil, A.G., Ezpeleta, O., García-Jalón, J.A. and López de Cerain, A., 2004. Immunotoxic
effects of Ochratoxin A in Wistar rats after oral administration. Food Chem Toxicol 42, 825-834.
Amstad, P., Levy, A., Emerit, I. and Cerutti, P., 1984. Evidence for membrane-mediated chromosomal
damage by aflatoxin B1 in human lymphocytes. Carcinogenesis 5, 719-723.
Arbillaga, L., Azqueta, A., Ezpeleta, O. and López de Cerain, A., 2007. Oxidative DNA damage
induced by Ochratoxin A in the HK-2 human kidney cell line: evidence of the relationship with cytotoxicity.
Mutagenesis 22, 35-42.
Arbillaga, L., Ezpeleta, O. and López de Cerain, A., 2004. ¿Es la Ocratoxina A una micotoxina
mutagénica? (Is the Ochratoxin A a mutagenic mycotoxine?). Revista de Toxicología 21, 1-10.
Arbillaga, L., Vettorazzi, A., Gil, A.G., van Delft, J.H., García-Jalón, J.A. and López de Cerain, A., 2008.
Gene expression changes induced by ochratoxin A in renal and hepatic tissues of male F344 rat after oral
repeated administration. Toxicol Appl Pharmacol 230, 197-207.
Austwick, P.K.C., 1978. Mycotoxicoses in Poultry, in: Wyllie, T.D., Morehouse, L.G. (Eds). Marcel
Dekker, Inc., Nueva York, Estados Unidos de América., pp. 279-301.
Baldi, A., Losio, M.N., Cheli, F., Rebucci, R., Sangalli, L., Fusi, E., Bertasi, B., Pavoni, E., Carli, S. and
Politis, I., 2004. Evaluation of the protective effects of alpha-tocopherol and retinol against ochratoxin A
cytotoxicity. Br J Nutr 91, 507-512.
Bedard, L.L. and Massey, T.E., 2006. Aflatoxin B1-induced DNA damage and its repair. Cancer Lett
241, 174-183.
Belmadani, A., Tramu, G., Betbeder, A.M., Steyn, P.S. and Creppy, E.E., 1998. Regional selectivity to
ochratoxin A, distribution and cytotoxicity in rat brain. Arch Toxicol 72, 656-662.
Bendele, A.M., Carlton, W.W., Krogh, P. and Lillehoj, E.B., 1985. Ochratoxin A carcinogenesis in the
(C57BL/6J X C3H) F1 mouse. J. Natl Cancer Inst 75, 733-742.
Bircan, C., 2009. Incidence of ochratoxin A in dried fruits and co-occurrence with aflatoxins in dried
figs. Food Chem Toxicol 47, 1996-2001.

Capítulo 1/ Chapter 1
46
Castegnaro, M., Mohr, U., Pfohl-Leszkowicz, A., Estève, J., Steinmann, J., Tillmann, T., Michelon, J.
and Bartsch, H., 1998. Sex and strain specific induction of renal tumors by ochratoxin A in rats correlates with
DNA adduction. Int J Cancer 77, 70-75.
Cavin, C., Delatour, T., Marin Kuan, M., Holzhuser, D., Higgins, L., Bezenon, C., Guignard, G., Junod,
S., Richoz Payot, J., Gremaud, E., Hayes, J., Nestler, S., Mantle, P. and Schilter, B., 2007. Reduction in
antioxidant defenses may contribute to ochratoxin A toxicity and carcinogenicity. Toxicol Sci 96, 30-39.
Costa, S., Utan, A., Cervellati, R., Speroni, E. and Guerra, M.C., 2007. Catechins: natural free-radical
scavengers against ochratoxin A-induced cell damage in a pig kidney cell line (LLC-PK1). Food Chem Toxicol
45, 1910-1917.
Creppy, E.E., Chiarappa, P., Baudrimont, I., Borracci, P., Moukha, S. and Carratu, M.R., 2004.
Synergistic effects of fumonisin B1 and ochratoxin A: are in vitro cytotoxicity data predictive of in vivo acute
toxicity? Toxicology 201, 115-123.
Dai, J., Park, G., Wright, M.W., Adams, M., Akman, S.A. and Manderville, R.A., 2002. Detection and
characterization of a glutathione conjugate of ochratoxin A. Chem Res Toxicol 15, 1581-1588.
De Groene, E.M., Jahn, A., Horbach, G.J. and Fink-Gremmels, J., 1996. Mutagenicity and genotoxicity
of the mycotoxin ochratoxin A. Environ Toxicol Pharmacol 1, 21-26.
Delatour, T., Mally, A., Richoz, J., Ozden, S., Dekant, W., Ihmels, H., Otto, D., Gasparutto, D., Marin
Kuan, M., Schilter, B. and Cavin, C., 2008. Absence of 2'-deoxyguanosine-carbon 8-bound ochratoxin A
adduct in rat kidney DNA monitored by isotope dilution LC-MS/MS. Molec Nutr Food Res 52, 472-482.
Desalegn, B., Nanayakkara, S., Harada, K., Hitomi, T., Chandrajith, R., Karunaratne, U., Abeysekera, T.
and Koizumi, A., 2011. Mycotoxin detection in urine samples from patients with chronic kidney disease of
uncertain etiology in Sri Lanka. Bull Environ Contam Toxicol 87, 6-10.
Di Paolo, N., Guarnieri, A., Garosi, G., Sacchi, G., Mangiarotti, A.M. and Di Paolo, M., 1994. Inhaled
mycotoxins lead to acute renal failure. Nephrol Dial Transpl 9 Suppl 4, 116-120.
Dirheimer, G. and Creppy, E.E., 1991. Mechanism of action of ochratoxin A. IARC Sci. Publ. , 171-
186.
EFSA, 2006. Opinion of the Scientific Panel on Contaminats in the Food Chain on a request from the
commision related to Ochratoxin A in food. EFSA J 365, 1-56.
Introducción general /General introduction
47
EFSA, 2007. Opinion of the Scientific Panel on Contaminats in the Food Chain on a request from the
Commission related to the potential increase of consumer health risk by a possible increase of the existing
maximun levels for Aflatoxins in almonds, hazelnuts and pistachios and derived products. EFSA J 446, 1-127.
Ehrlich, V., Darroudi, F., Uhl, M., Steinkellner, H., Gann, M., Majer, B.J., Eisenbauer, M. and
Knasmuller, S., 2002. Genotoxic effects of ochratoxin A in human-derived hepatoma (Hep G2) cells. Food
Chem Toxicol 40, 1085-1090.
El Golli-Bennour, E., Kouidhi, B., Bouslimi, A., Abid-Essefi, S., Hassen, W. and Bacha, H., 2010.
Cytotoxicity and genotoxicity induced by aflatoxin B1, ochratoxin A, and their combination in cultured Vero
cells. J Biochem Mol Toxicol 24, 42-50.
EL Khoury, A., Rizk, T., Lteif, R., Azouri, H., Delia, M. and Lebrihi, A., 2008. Fungal contamination
and Aflatoxin B1 and Ochratoxin A in Lebanese wine–grapes and musts. Food Chem Toxicol 46, 2244-2250.
EC, 1997a. Reports on tasks for scientific cooperation. Report of experts participating in Task 3.2.1.
Risk assessment of aflatoxins. Office for Official Publications of the European Communities Report EUR
17526EN.
EC, 1997b. Scientific Committee on Food on Ochratoxin A. Consumer Policy and Consumer Health
Protection .
EC, 2002. Reports on tasks for scientific cooperation Task 3.2.7. Assessment of dietary intake of
Ochratoxin A by the population of EU Member States. Directorate General Health and Consumer Protection.
Reports on tasks for scientific cooperation .
EC, 2006. Commission Regulation (EC) No 1881/2006 of 19 December 2006 setting maximum levels
for certain contaminants in foodstuffs (Text with EEA relevance). OJ L 364, 20.12.2006, p. 5–24.
EC, 2010. Commission Regulation (EC) No 105/2010) of 5 February 2010 amending Regulation (EC)
No 1881/2006 setting maximum levels for certain contaminants in foodstuffs as regards ochratoxin A. OJ L
35, p. 7–8.
Faucet, V., Pfohl Leszkowicz, A., Dai, J., Castegnaro, M. and Manderville, R., 2004. Evidence for
covalent DNA adduction by ochratoxin A following chronic exposure to rat and subacute exposure to pig.
Chem Res Toxicol 17, 1289-1296.

Capítulo 1/ Chapter 1
48
Gautier, J., Richoz, J., Welti, D.H., Markovic, J., Gremaud, E., Guengerich, F.P. and Turesky, R.J.,
2001a. Metabolism of ochratoxin A: absence of formation of genotoxic derivatives by human and rat enzymes.
Chem Res Toxicol 14, 34-45.
Gautier, J.C., Holzhaeuser, D., Markovic, J., Gremaud, E., Schilter, B. and Turesky, R.J., 2001b.
Oxidative damage and stress response from ochratoxin A exposure in rats. Free Radic Biol Med 30, 1089-1098.
Guerra, M.C., Galvano, F., Bonsi, L., Speroni, E., Costa, S., Renzulli, C. and Cervellati, R., 2005.
Cyanidin-3-O-beta-glucopyranoside, a natural free-radical scavenger against aflatoxin B1- and ochratoxin A-
induced cell damage in a human hepatoma cell line (Hep G2) and a human colonic adenocarcinoma cell line
(CaCo-2). Br J Nutr 94, 211-220.
Hagelberg, S., Hult, K. and Fuchs, R., 1989. Toxicokinetics of ochratoxin A in several species and its
plasma-binding properties. J Appl Toxicol 9, 91-96.
Hamilton, P.B., Huff, W.E., Harris, J.R. and Wyatt, R.D., 1982. Natural occurrences of ochratoxicosis
in poultry. Poult Sci 61, 1832-1841.
Heussner, A.H., Dietrich, D.R. and O’Brien, E., 2006. In vitro investigation of individual and combined
cytotoxic effects of ochratoxin A and other selected mycotoxins on renal cells. Toxicol In vitro 20, 332-341.
Hooper, D., Bolton, V., Guilford, F. and Straus, D., 2009. Mycotoxin detection in human samples from
patients exposed to environmental molds. Int J Mol Sci 10, 1465-1475.
Huff, W.E., Kubena, L.F., Harvey, R.B. and Doerr, J.A., 1988. Mycotoxin interactions in poultry and
swine. J Anim Sci 66, 2351-2355.
Huff, W.E., Doerr, J.A., Wabeck, C.J., Chaloupka, G.W., May, J.D. and Merkley, J.W., 1983. Individual
and combined effects of aflatoxin and ochratoxin A on bruising in broiler chickens. Poult Sci 62, 1764-1771.
Huff, W.E. and Doerr, J.A., 1981. Synergism between aflatoxin and ochratoxin A in broiler chickens.
Poult Sci 60, 550-555.
Hussein, H.S. and Brasel, J.M., 2001. Toxicity, metabolism, and impact of mycotoxins on humans and
animals. Toxicology 167, 101-134.
IARC, 2002. IARC Monographs on the Evaluation of Carcinogenic Risks to Humans. Some Traditional
Herbal Medicines, Some Mycotoxins, Naphthalene and Styrene. IARC Publ 82, 590.

Introducción general /General introduction
49
IARC, 1993. IARC Monographs on the Evaluation of Carcinogenic Risks to Humans. Some Naturally
Occurring Substances: Food Items and Constituents, Heterocyclic Aromatic Amines and Mycotoxins. IARC
Publ 56, 33.
IARC, 1987. IARC Monographs on the Evaluation of Carcinogenic Risks to Humans. Overall
Evaluations of Carcinogenicity: An Updating of IARC Monographs. IARC Publ Volumes 1 to 42. Supplement
7, 440.
Ibáñez-Vea, M., Lizarraga, E., González-Peñas, E. and López de Cerain, A., 2012. Co-occurrence of
type-A and type-B trichothecenes in barley from a northern region of Spain. Food Control 25, 81-88.
Ibáñez-Vea, M., Martínez, R., González-Peñas, E., Lizarraga, E. and López de Cerain, A., 2011. Co-
occurrence of aflatoxins, ochratoxin A and zearalenone in breakfast cereals from spanish market. Food Control
22, 1949-1955.
JEFCA, 1991. Evaluation of certain food additives and contaminants. 37th Report. WHO Technical
Report Series 806, 29-31.
JEFCA, 1998. Safety evaluation of certain food additives and contaminants.. Aflatoxins. WHO
Technical Report Series 40.
Jonsyn Ellis, F.E., 2001. Seasonal variation in exposure frequency and concentration levels of aflatoxins
and ochratoxins in urine samples of boys and girls. Mycopathologia 152, 35-40.
Jubert C., Mata J., Bench, G., Dashwood, R., Pereira, C., Tracewell, W., Turteltaub, K., Williams, D.
and Bailey, G., 2009. Effects of chlorophyll and chlorophyllin on low-dose aflatoxin B (1) pharmacokinetics in
human volunteers. Cancer Prev Res 2 (12), 1015-1022.
Kamp, H.G., Eisenbrand, G., Schlatter, J., Würth, K. and Janzowski, C., 2005. Ochratoxin A: induction
of (oxidative) DNA damage, cytotoxicity and apoptosis in mammalian cell lines and primary cells. Toxicology
206, 413-425.
Khan, S., Martin, M., Bartsch, H. and Rahimtula, A.D., 1989. Perturbation of liver microsomal calcium
homeostasis by ochratoxin A. Biochem Pharmacol 38, 67-72.
Knasmuller, S., Cavin, C., Chakraborty, A., Darroudi, F., Majer, B.J., Huber, W.W. and Ehrlich, V.A.,
2004. Structurally related mycotoxins ochratoxin A, ochratoxin B, and citrinin differ in their genotoxic
Capítulo 1/ Chapter 1
50
activities and in their mode of action in human-derived liver (Hep G2) cells: implications for risk assessment.
Nutr Cancer 50, 190-197.
Krogh, P., Elling, F., Friis, C., Hald, B., Larsen, A.E., Lillehj, E.B., Madsen, A., Mortensen, H.P.,
Rasmussen, F. and Ravnskov, U., 1979. Porcine nephropathy induced by long-term ingestion of ochratoxin A.
Vet Pathol 16, 466-475.
Kuiper Goodman, T. and Scott, P.M., 1989. Risk assessment of the mycotoxin ochratoxin A. Biomed
Environ Sci 2, 179-248.
Lebrun, S. and Follmann, W., 2002. Detection of ochratoxin A-induced DNA damage in MDCK cells
by alkaline single cell gel electrophoresis (comet assay). Arch Toxicol 75, 734-741.
Lee, J.K., Choi, E.H., Lee, K.G. and Chun, H.S., 2005. Alleviation of aflatoxin B1-induced oxidative
stress in Hep G2 cells by volatile extract from Allii Fistulosi Bulbus. Life Sci 77, 2896-2910.
Maganen, N. and Olsen, M., 2004. Mycotoxins in Food: Detection and Control. Woodhead Publishing
in food science and technology. CRC Press, Boca Raton Estados, Unidos de América.
Mally, A., Pepe, G., Ravoori, S., Fiore, M., Gupta, R.C., Dekant, W. and Mosesso, P., 2005. Ochratoxin
a causes DNA damage and cytogenetic effects but no DNA adducts in rats. Chem Res. Toxicol 18, 1253-1261.
Mally, A. and Dekant, W., 2005. DNA adduct formation by ochratoxin A: review of the available
evidence. Food Addit Contam 22 Suppl 1, 65-74.
Mally, A., Zepnik, H., Wanek, P., Eder, E., Dingley, K., Ihmels, H., Volkel, W. and Dekant, W., 2004.
Ochratoxin A: lack of formation of covalent DNA adducts. Chem Res Toxicol 17, 234-242.
Mantle, P., Faucet Marquis, V., Manderville, R., Squillaci, B. and Pfohl Leszkowicz, A., 2010. Structures
of covalent adducts between DNA and ochratoxin a: a new factor in debate about genotoxicity and human risk
assessment. Chem Res Toxicol 23, 89-98.
Mantle, P., Kulinskaya, E. and Nestler, S., 2005. Renal tumourigenesis in male rats in response to
chronic dietary ochratoxin A. Food Addit Contam 22 Suppl 1, 58-64.
Marin Kuan, M., Ehrlich, V., Delatour, T., Cavin, C. and Schilter, B., 2011. Evidence for a role of
oxidative stress in the carcinogenicity of ochratoxin a. J Toxicol 2011, 645361, 15 pages.
Introducción general /General introduction
51
Marin Kuan, M., Cavin, C., Delatour, T. and Schilter, B., 2008. Ochratoxin A carcinogenicity involves a
complex network of epigenetic mechanisms. Toxicon 52, 195-202.
McKean, C., Tang, L., Tang, M., Billam, M., Wang, Z., Theodorakis, C.W., Kendall, R.J. and Wang, J.S.,
2006a. Comparative acute and combinative toxicity of aflatoxin B1 and fumonisin B1 in animals and human
cells. Food Chem Toxicol 44, 868-876.
McKean, C., Tang, L., Billam, M., Tang, M., Theodorakis, C., Kendall, R. and Wang, J., 2006b.
Comparative acute and combinative toxicity of aflatoxin B1 and T-2 toxin in animals and immortalized human
cell lines. J Appl Toxicol 26, 139-147.
McLean, M. and Dutton, M.F., 1995. Cellular interactions and metabolism of aflatoxin: An update.
Pharmac Ther 65, 163-192.
Meki, A.R. and Hussein, A.A., 2001. Melatonin reduces oxidative stress induced by ochratoxin A in rat
liver and kidney. Comparative biochemistry and physiology.Pt.C, Toxicol Appl Pharmacol 130, 305-313.
Munro, I.C., Moodie, C.A., Kuiper Goodman, T., Scott, P.M. and Grice, H.C., 1974. Toxicologic
changes in rats fed graded dietary levels of ochratoxin A. Toxicol Appl Pharmacol 28, 180-188.
NTP, 1989. Toxicology and carcinogenesis studies of ochratoxin A (CAS No 303-47-9) in F344/N rats
(gavage studies). Natl Toxicol Program Tech Rep Ser 358, 1-142.
Nguyen, M.T., Tozlovanu, M., Tran, T.L. and Pfohl-Leszkowicz, A., 2007. Occurrence of aflatoxin B1,
citrinin and ochratoxin A in rice in five provinces of the central region of Vietnam. Food Chem 105, 42-47.
O'Brien, E. and Dietrich, D.R., 2005. Ochratoxin A: The Continuing Enigma. Crit Rev Toxicol 35, 33-
60.
FAO/OIEA, 2003. Manual sobre la aplicación del sistema de Análisis de Peligros y de Puntos Críticos
de Control (APPCC) en la prevención y control de las micotoxinas. FAO/OIEA 73.
Palanee, T., Dutton, M.F. and Chuturgoon, A.A., 2001. Cytotoxicity of aflatoxin B1 and its chemically
synthesised epoxide derivative on the A549 human epithelioid lung cell line. Mycopathologia 151, 155-159.
Pascual Anderson, M.d.R., 2005. Hongos, 94. Ediciones Díaz de Santos S.A., España.
Pfohl Leszkowicz, A. and Castegnaro, M., 2005. Further arguments in favour of direct covalent binding
of Ochratoxin A (OTA) after metabolic biotransformation. Food Addit Contam 22 Suppl 1, 75-87.

Capítulo 1/ Chapter 1
52
Pfohl Leszkowicz, A., Grosse, Y., Castegnaro, M., Nicolov, I.G., Chernozemsky, I.N., Bartsch, H.,
Betbeder, A.M., Creppy, E.E. and Dirheimer, G., 1993. Ochratoxin A-related DNA adducts in urinary tract
tumours of Bulgarian subjects. IARC Sci Publ, 141-148.
Pfohl Leszkowicz, A., Chakor, K., Creppy, E.E. and Dirheimer, G., 1991. DNA adduct formation in
mice treated with ochratoxin A. IARC Sci Publ, 245-253.
Pfohl Leszkowicz, A., 2009. Ochratoxin A and aristolochic acid involvement in nephropathies and
associated urothelial tract tumours. Arh Hig Rada Toksikol 60, 465-483.
Pohland, A.E., Nesheim, S. and Friedman, L., 1992. Ochartoxin A: a review. Pure Appl Chem 64, 1029-
1046.
Pozzi, C.R., Corra, B., Xavier, J.G., Direito, G.M., Orsi, R.B. and Matarazzo, S.V., 2001. Effects of
prolonged oral administration of fumonisin B1 and aflatoxin B1 in rats. Mycopathologia 151, 21-27.
Renzulli, C., Galvano, F., Pierdomenico, L., Speroni, E. and Guerra, M.C., 2004. Effects of rosmarinic
acid against aflatoxin B1 and ochratoxin-A-induced cell damage in a human hepatoma cell line (Hep G2). J
Appl Toxicol 24, 289-296.
Ringot, D., Chango, A., Schneider, Y.J. and Larondelle, Y., 2006. Toxicokinetics and toxicodynamics of
ochratoxin A, an update. Chem Biol Interact 159, 18-46.
Sava, V., Reunova, O., Velasquez, A., Harbison, R. and Sanchez-Ramos, J., 2006a. Acute neurotoxic
effects of the fungal metabolite ochratoxin-A. Neurotoxicology 27, 82-92.
Sava, V., Reunova, O., Velasquez, A. and Sanchez-Ramos, J., 2006b. Can low level exposure to
ochratoxin-A cause parkinsonism? J. Neurol Sci 249, 68-75.
Sedmíková, M., Reisnerová, H., Dufková, Z., Bárta, I. and Jílek, F., 2001. Potential Hazard of
simultaneous occurrence of aflatoxin B1 and ochratoxin A. Vet Med 46, 169-174.
Sharma, R.P., 1993. Immunotoxicity of mycotoxins. J. Dairy Sci. 76, 892-897.
Simarro Doorten, Y.S., Nijmeijer, S., de Nijs-Tjon, L. and Fink-Gremmels, J., 2006. Metabolism-
mediated Ochratoxin A genotoxicity in the single-cell gel electrophoresis (Comet) assay. Food Chem Toxicol
44, 261-270.

Introducción general /General introduction
53
Smela, M.E., Hamm, M.L., Henderson, P.T., Harris, C.M., Harris, T.M. and Essigmann, J.M., 2002. The
aflatoxin B(1) formamidopyrimidine adduct plays a major role in causing the types of mutations observed in
human hepatocellular carcinoma. Proc Natl Acad Sci USA 99, 6655-6660-
Soriano del Castillo, J.M., 2007. Micotoxinas En Alimentos. Díaz de Santos, Madrid.
Speijers, G.J.A., 2004. Combined toxic effects of mycotoxins. Toxicol Lett 153, 91.
Studer Rohr, I., Schlatter, J. and Dietrich, D.R., 2000. Kinetic parameters and intraindividual
fluctuations of ochratoxin A plasma levels in humans. Arch Toxicol 74, 499-510.
Urrego Novoa, J.R. and Diaz, G.J., 2006. Aflatoxins and its mechanisms of toxicity in hepatic cancer.
Rev Fac Med Una 54, 108-116.
Vettorazzi, A., Trocóniz, I.F., Gonzalez-Peñas, E., Corcuera, L.A., Arbillaga, L., Gil, A.G., Nagy, J.M.,
Mantle, P.G. and López de Cerain, A., 2010. Effects of fasting and gender on ochratoxin A toxicokinetics in
F344 rats. Food Chem Toxicol 48, 3159-3166.
Vettorazzi, A., de Trocóniz, I.F., González-Peñas, E., Arbillaga, L., Corcuera, L., Gil, A.G. and de
Cerain, A.L., 2011. Kidney and liver distribution of ochratoxin A in male and female F344 rats. Food Chem
Toxicol 49, 1935-1942.
Villa, P. and Markaki, P., 2009. Aflatoxin B1 and ochratoxin A in breakfast cereals from athens market:
Occurrence and risk assessment. Food Control 20, 455-461.
Wangikar, P.B., Dwivedi, P., Sinha, N., Sharma, A.K. and Telang, A.G., 2005. Teratogenic effects in
rabbits of simultaneous exposure to ochratoxin A and aflatoxin B1 with special reference to microscopic
effects. Toxicology 215, 37-47.
Wangikar, P.B., Dwivedi, P., Sharma, A.K. and Sinha, N., 2004a. Effect in rats of simultaneous prenatal
exposure to ochratoxin A and aflatoxin B1. II. Histopathological features of teratological anomalies induced in
fetuses. Birth defects research.Part B, Dev Rep Toxicol 71, 352-358.
Wangikar, P.B., Dwivedi, P. and Sinha, N., 2004b. Effect in rats of simultaneous prenatal exposure to
ochratoxin A and aflatoxin B1. I. Maternal toxicity and fetal malformations. Birth defects research.Part B, Dev
Rep Toxicol 71, 343-351.
Waters, R., Jones, C.J., Martin, E.A., Yang, A.-. and Jones, N.J., 1992. The repair of large DNA adducts
in mammalian cells. Mutat. Res. /DNA Repair 273, 145-155.

Capítulo 1/ Chapter 1
54
WHO, 2001. Safety evaluation of certain mycotoxins in food. WHO Food Additives Series 47.
Wild, C. and Gong, Y., 2010. Mycotoxins and human disease: a largely ignored global health issue.
Carcinogenesis 31, 71-82.
Williams, J.H., Phillips, T.D., Jolly, P.E., Stiles, J.K., Jolly, C.M. and Aggarwal, D., 2004. Human
aflatoxicosis in developing countries: a review of toxicology, exposure, potential health consequences, and
interventions. Am J Clin Nutr 80, 1106-1122.
Wong, Z.A. and Hsieh, D.P.H., 1980. The comparative metabolism and toxicokinetics of aflatoxin B1
in the monkey, rat, and mouse. Toxicol Appl Pharmacol 55, 115-125.
Xiao, H., Madhyastha, S., Marquardt, R.R., Li, S., Vodela, J.K., Frohlich, A.A. and Kemppainen, B.W.,
1996. Toxicity of Ochratoxin A, Its Opened Lactone Form and Several of Its Analogs: Structure–Activity
Relationships. Toxicol Appl Pharmacol 137, 182-192.
Zahoor Ul Hassan, M.Z., Khan, A., Khan, I., Javed, Z. and Hussain, 2011. Effects of individual and
combined administration of ochratoxin A and aflatoxin B(1) in tissues and eggs of White Leghorn breeder
hens. J Sci Food Agric doi: 10.1002/jsfa.4740.
Zeljezic, D., Domijan, A.M. and Peraica, M., 2006. DNA damage by ochratoxin A in rat kidney
assessed by the alkaline comet assay. Braz J Med Biol Res 39, 1563

Aim, objectives and outline
Chapter 2

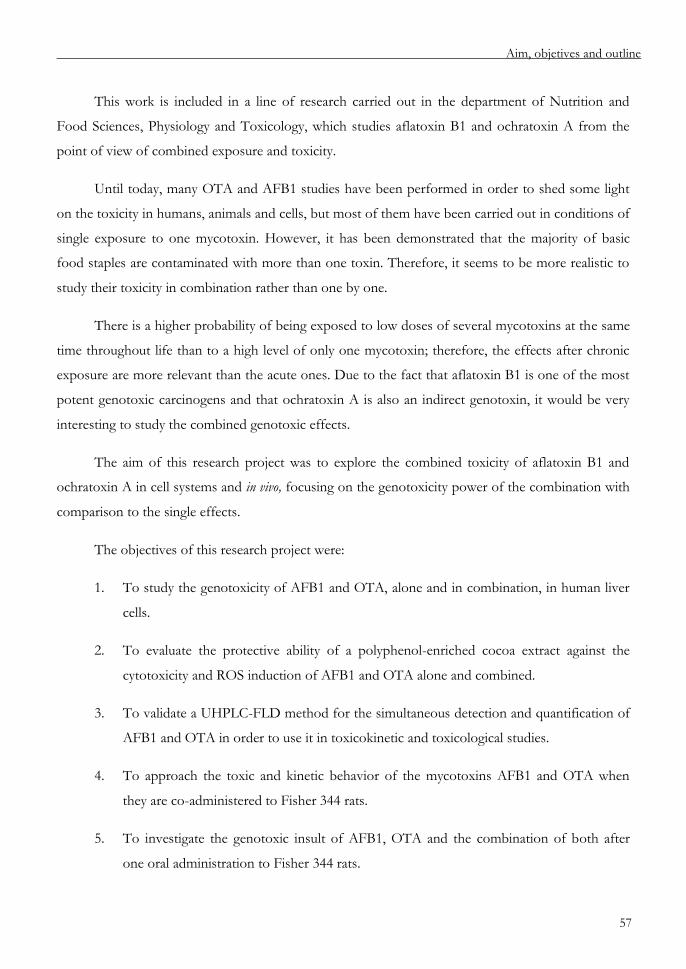
Aim, objetives and outline
57
This work is included in a line of research carried out in the department of Nutrition and
Food Sciences, Physiology and Toxicology, which studies aflatoxin B1 and ochratoxin A from the
point of view of combined exposure and toxicity.
Until today, many OTA and AFB1 studies have been performed in order to shed some light
on the toxicity in humans, animals and cells, but most of them have been carried out in conditions of
single exposure to one mycotoxin. However, it has been demonstrated that the majority of basic
food staples are contaminated with more than one toxin. Therefore, it seems to be more realistic to
study their toxicity in combination rather than one by one.
There is a higher probability of being exposed to low doses of several mycotoxins at the same
time throughout life than to a high level of only one mycotoxin; therefore, the effects after chronic
exposure are more relevant than the acute ones. Due to the fact that aflatoxin B1 is one of the most
potent genotoxic carcinogens and that ochratoxin A is also an indirect genotoxin, it would be very
interesting to study the combined genotoxic effects.
The aim of this research project was to explore the combined toxicity of aflatoxin B1 and
ochratoxin A in cell systems and in vivo, focusing on the genotoxicity power of the combination with
comparison to the single effects.
The objectives of this research project were:
1. To study the genotoxicity of AFB1 and OTA, alone and in combination, in human liver
cells.
2. To evaluate the protective ability of a polyphenol-enriched cocoa extract against the
cytotoxicity and ROS induction of AFB1 and OTA alone and combined.
3. To validate a UHPLC-FLD method for the simultaneous detection and quantification of
AFB1 and OTA in order to use it in toxicokinetic and toxicological studies.
4. To approach the toxic and kinetic behavior of the mycotoxins AFB1 and OTA when
they are co-administered to Fisher 344 rats.
5. To investigate the genotoxic insult of AFB1, OTA and the combination of both after
one oral administration to Fisher 344 rats.
Chapter 2
58
The project is outlined as follows:
Chapter 3: In this chapter, the ability of AFB1, OTA and the combination of both to cause
DNA strand breaks and oxidative damage is evaluated with and without external metabolic
activation after 3 and 24 h in Hep G2 cells. The comet assay complemented with restriction enzymes
is performed. The cytotoxicity of the mycotoxins is evaluated in advance under the same conditions.
Moreover, the ROS induction capability after 24 h is also studied.
Chapter 4: A polyphenol-enriched cocoa extract has been obtained from cocoa seeds, and its
antioxidant properties against free radicals in cell free systems have been tested. In this work, the
cytotoxicity and ROS inner induction of the extract is evaluated in Hep G2 cells; afterwards, its
protective properties are evaluated against the cytotoxicity of mycotoxins (alone and combined) and
ROS induction.
Chapter 5: In this chapter, the validation of a fast and simple ultra high performance liquid
chromatography-fluorescence detector (UHPLC-FLD) method for the simultaneous detection and
quantification of AFB1 and OTA in rat plasma, liver and kidney is presented. The objective was to
use the same extraction method, calibration curves and chromatographic conditions for both
mycotoxins and the three matrices. The validation was performed based on the following criteria:
selectivity, linearity, precision and accuracy (within-day and between day variability), limits of
detection and quantification, recovery, stability of the samples and robustness.
Chapter 6: A single oral dose of a mixture of AFB1 and OTA was administered orally to male
Fisher 344 rats. Biochemistry parameters and histopathological observations are commented. Plasma
and tissue levels of mycotoxins are analyzed and compared with published kinetic data of
mycotoxins alone.
Chapter 7: The genotoxicity of AFB1, OTA and the combination of both are evaluated in vivo.
For this purpose, two methods are chosen: the micronucleus test and the comet assay complemented
with enzymes. First, the in vivo comet assay was set up in liver and kidney in order to detect direct
DNA strand breaks and oxidative damage with sufficient sensitivity. Next, one oral administration of
the mycotoxins was given to F344 rats and samples were taken after 3 h or 24 h. The micronucleus
test was performed on bone marrow while the comet assay was performed on the target organs (liver
and kidney). In addition, biochemical parameters, histopathological findings and plasma and tissue
levels were taken into account in the toxicity evaluation.

Aim, objetives and outline
59
Chapter 8: The most important findings of the previous chapters are discussed in this section.
Chapter 9: The main conclusions of the research project are presented.


Ochratoxin A reduces aflatoxin B1 induced DNA damage detected by the comet assay in
Hep G2 cells
Chapter 3
Laura-Ana Corcuera., Leire Arbillaga, Ariane Vettorazzi, Amaia Azqueta,
Adela López de Cerain
Food and Chemical Toxicology 49 (2011) 2883–2889


OTA reduces AFB1 genotoxicity in vitro
63
Resumen
Las micotoxinas aflatoxina B1 (AFB1) y ocratoxina A (OTA) pueden aparecer juntas en un
mismo alimentos y si bien actúan por mecanismos diferentes, ambas son consideradas genotoxinas.
El objetivo de este trabajo es caracterizar la genotoxicidad combinada de ambas toxinas in vitro en la
línea celular Hep G2. Para ello, la citotoxicidad se estudió en tratamientos aislados y en combinación
con el fin de establecer los rangos de dosis a aplicar en los estudios de genotoxicidad. La
citotoxicidad conjunta de AFB1+OTA durante 24 h mostró efectos aditivos. La genotoxicidad se
evaluó en la línea Hep G2 mediante el ensayo del cometa complementado con las enzimas de
restricción endo III y FPG. La inducción de especies reactivas de oxígeno también fue evaluada en
tratamientos aislados y combinados. La AFB1 fue genotóxica tras 3 h con activación metabólica
(mezcla S9) y tras 24 h sin activación metabólica. La presencia de OTA disminuyó significativamente
el daño en el DNA provocado por la AFB1, no solo en las roturas directas y lugares apurínicos sino
también en los lugares sensibles a la FPG. Esta aparente contradicción entre los efectos citotóxicos
aditivos y los efectos genotóxicos antagonistas puede deberse a que ambas toxinas compiten por los
mismos CYPs, generando más ROS pero menos aductos de AFB1.
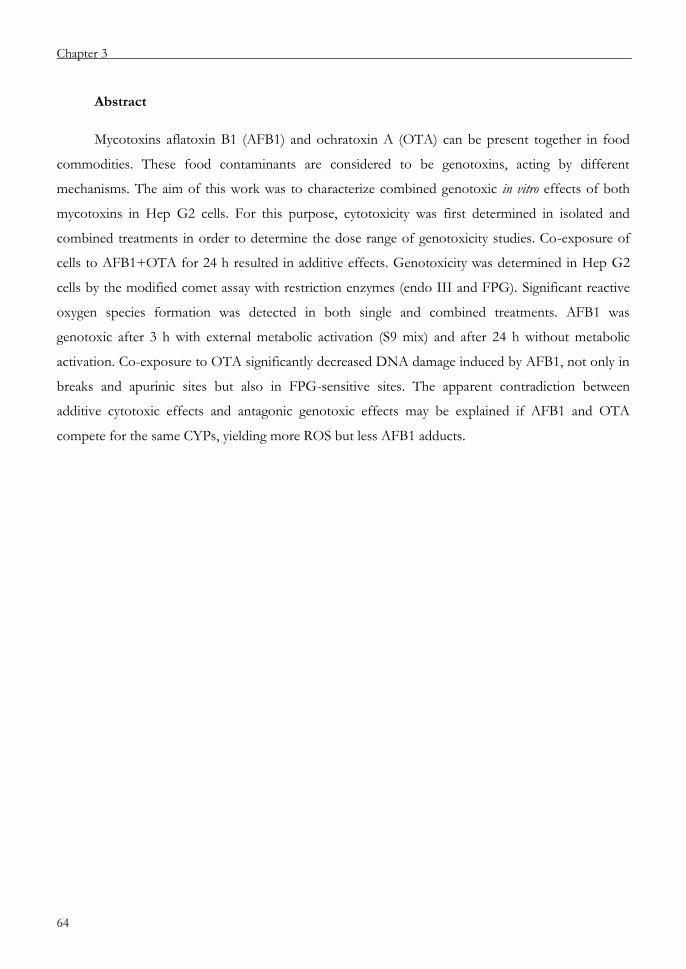
Chapter 3
64
Abstract
Mycotoxins aflatoxin B1 (AFB1) and ochratoxin A (OTA) can be present together in food
commodities. These food contaminants are considered to be genotoxins, acting by different
mechanisms. The aim of this work was to characterize combined genotoxic in vitro effects of both
mycotoxins in Hep G2 cells. For this purpose, cytotoxicity was first determined in isolated and
combined treatments in order to determine the dose range of genotoxicity studies. Co-exposure of
cells to AFB1+OTA for 24 h resulted in additive effects. Genotoxicity was determined in Hep G2
cells by the modified comet assay with restriction enzymes (endo III and FPG). Significant reactive
oxygen species formation was detected in both single and combined treatments. AFB1 was
genotoxic after 3 h with external metabolic activation (S9 mix) and after 24 h without metabolic
activation. Co-exposure to OTA significantly decreased DNA damage induced by AFB1, not only in
breaks and apurinic sites but also in FPG-sensitive sites. The apparent contradiction between
additive cytotoxic effects and antagonic genotoxic effects may be explained if AFB1 and OTA
compete for the same CYPs, yielding more ROS but less AFB1 adducts.
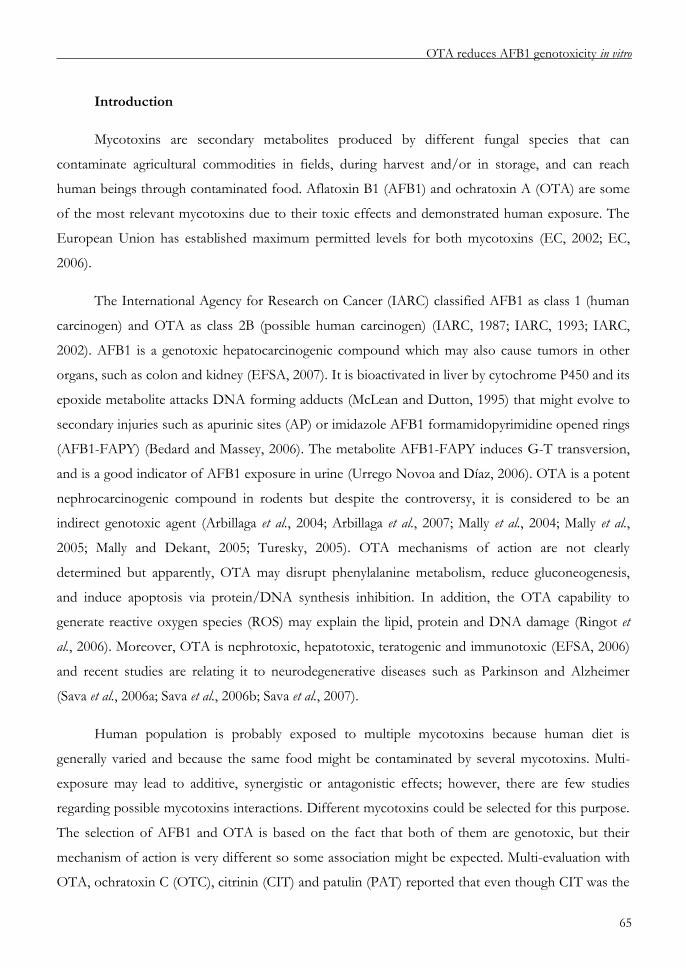
OTA reduces AFB1 genotoxicity in vitro
65
Introduction
Mycotoxins are secondary metabolites produced by different fungal species that can
contaminate agricultural commodities in fields, during harvest and/or in storage, and can reach
human beings through contaminated food. Aflatoxin B1 (AFB1) and ochratoxin A (OTA) are some
of the most relevant mycotoxins due to their toxic effects and demonstrated human exposure. The
European Union has established maximum permitted levels for both mycotoxins (EC, 2002; EC,
2006).
The International Agency for Research on Cancer (IARC) classified AFB1 as class 1 (human
carcinogen) and OTA as class 2B (possible human carcinogen) (IARC, 1987; IARC, 1993; IARC,
2002). AFB1 is a genotoxic hepatocarcinogenic compound which may also cause tumors in other
organs, such as colon and kidney (EFSA, 2007). It is bioactivated in liver by cytochrome P450 and its
epoxide metabolite attacks DNA forming adducts (McLean and Dutton, 1995) that might evolve to
secondary injuries such as apurinic sites (AP) or imidazole AFB1 formamidopyrimidine opened rings
(AFB1-FAPY) (Bedard and Massey, 2006). The metabolite AFB1-FAPY induces G-T transversion,
and is a good indicator of AFB1 exposure in urine (Urrego Novoa and Díaz, 2006). OTA is a potent
nephrocarcinogenic compound in rodents but despite the controversy, it is considered to be an
indirect genotoxic agent (Arbillaga et al., 2004; Arbillaga et al., 2007; Mally et al., 2004; Mally et al.,
2005; Mally and Dekant, 2005; Turesky, 2005). OTA mechanisms of action are not clearly
determined but apparently, OTA may disrupt phenylalanine metabolism, reduce gluconeogenesis,
and induce apoptosis via protein/DNA synthesis inhibition. In addition, the OTA capability to
generate reactive oxygen species (ROS) may explain the lipid, protein and DNA damage (Ringot et
al., 2006). Moreover, OTA is nephrotoxic, hepatotoxic, teratogenic and immunotoxic (EFSA, 2006)
and recent studies are relating it to neurodegenerative diseases such as Parkinson and Alzheimer
(Sava et al., 2006a; Sava et al., 2006b; Sava et al., 2007).
Human population is probably exposed to multiple mycotoxins because human diet is
generally varied and because the same food might be contaminated by several mycotoxins. Multi-
exposure may lead to additive, synergistic or antagonistic effects; however, there are few studies
regarding possible mycotoxins interactions. Different mycotoxins could be selected for this purpose.
The selection of AFB1 and OTA is based on the fact that both of them are genotoxic, but their
mechanism of action is very different so some association might be expected. Multi-evaluation with
OTA, ochratoxin C (OTC), citrinin (CIT) and patulin (PAT) reported that even though CIT was the
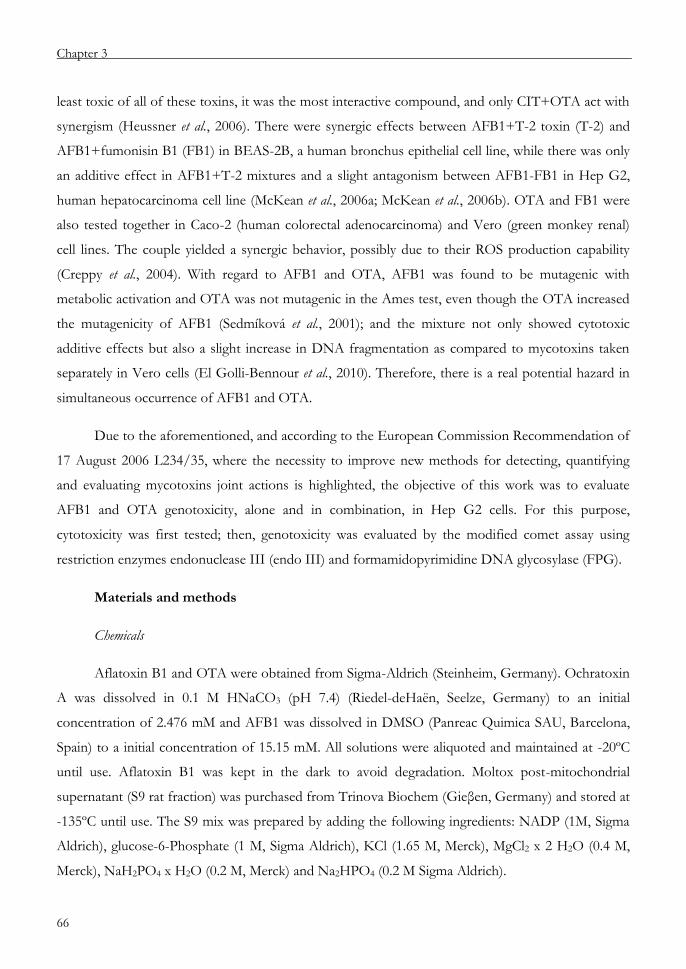
Chapter 3
66
least toxic of all of these toxins, it was the most interactive compound, and only CIT+OTA act with
synergism (Heussner et al., 2006). There were synergic effects between AFB1+T-2 toxin (T-2) and
AFB1+fumonisin B1 (FB1) in BEAS-2B, a human bronchus epithelial cell line, while there was only
an additive effect in AFB1+T-2 mixtures and a slight antagonism between AFB1-FB1 in Hep G2,
human hepatocarcinoma cell line (McKean et al., 2006a; McKean et al., 2006b). OTA and FB1 were
also tested together in Caco-2 (human colorectal adenocarcinoma) and Vero (green monkey renal)
cell lines. The couple yielded a synergic behavior, possibly due to their ROS production capability
(Creppy et al., 2004). With regard to AFB1 and OTA, AFB1 was found to be mutagenic with
metabolic activation and OTA was not mutagenic in the Ames test, even though the OTA increased
the mutagenicity of AFB1 (Sedmíková et al., 2001); and the mixture not only showed cytotoxic
additive effects but also a slight increase in DNA fragmentation as compared to mycotoxins taken
separately in Vero cells (El Golli-Bennour et al., 2010). Therefore, there is a real potential hazard in
simultaneous occurrence of AFB1 and OTA.
Due to the aforementioned, and according to the European Commission Recommendation of
17 August 2006 L234/35, where the necessity to improve new methods for detecting, quantifying
and evaluating mycotoxins joint actions is highlighted, the objective of this work was to evaluate
AFB1 and OTA genotoxicity, alone and in combination, in Hep G2 cells. For this purpose,
cytotoxicity was first tested; then, genotoxicity was evaluated by the modified comet assay using
restriction enzymes endonuclease III (endo III) and formamidopyrimidine DNA glycosylase (FPG).
Materials and methods
Chemicals
Aflatoxin B1 and OTA were obtained from Sigma-Aldrich (Steinheim, Germany). Ochratoxin
A was dissolved in 0.1 M HNaCO3 (pH 7.4) (Riedel-deHaën, Seelze, Germany) to an initial
concentration of 2.476 mM and AFB1 was dissolved in DMSO (Panreac Quimica SAU, Barcelona,
Spain) to a initial concentration of 15.15 mM. All solutions were aliquoted and maintained at -20ºC
until use. Aflatoxin B1 was kept in the dark to avoid degradation. Moltox post-mitochondrial
supernatant (S9 rat fraction) was purchased from Trinova Biochem (Gieβen, Germany) and stored at
-135ºC until use. The S9 mix was prepared by adding the following ingredients: NADP (1M, Sigma
Aldrich), glucose-6-Phosphate (1 M, Sigma Aldrich), KCl (1.65 M, Merck), MgCl2 x 2 H2O (0.4 M,
Merck), NaH2PO4 x H2O (0.2 M, Merck) and Na2HPO4 (0.2 M Sigma Aldrich).

OTA reduces AFB1 genotoxicity in vitro
67
Cell cultures
Hep G2 (hepatocellular carcinoma epithelial cell line) (HB-8065) was obtained from the
American Type Culture Collection (ATCC, Manassas, VA, USA). It was kept in the laboratory
satisfying the requirements for Good Laboratory Practice conditions. A master bank was created on
arrival and a working bank was created to perform the assays of this study, controlling the passing
number, which never surpassed 20.
Cells were cultured in monolayer in Dulbecco’s Modified Eagle’s Medium (DMEM, Gibco,
Prat de Llobregat, Barcelona, Spain) supplemented with 10% of fetal calf serum (FCS, Gibco) and
1% of antibiotics (10,000 U/mL penicillin and 10,000 µg/mL streptomycin, Gibco). Cells were
grown at 37ºC and 5% CO2 in a humidified atmosphere.
MTT assay
Cytotoxicity was assessed by the MTT assay which measures the reduction of MTT (3-(4,5-
methyl-2-thiazolyl)-2,5-diphenyltetrazolium bromide) to formazan by the mitochondrial enzyme
succinate dehydrogenase (Mosmann, 1983). Cells were seeded on 96-well plates. After 48 h of
incubation, they were treated with AFB1 and OTA, alone and combined. Each concentration was
tested in 6 independent wells. Mycotoxins were added to serum-free medium in order to avoid serum
binding. Exposure times of all treatments were 3 h (with and without metabolic activation) and 24 h.
The final concentration of the metabolic activation S9 mix was 10% and was prepared and added to
the cultures together with the mycotoxins and maintained during 3 h. After the treatments cells were
washed, and MTT (5 mg/mL) was added to fresh culture medium to each well and incubated
another 2 hours. The supernatant was removed, and the insoluble formazan crystals were dissolved
with 100 µL of DMSO. The absorbance was measured at 540 nm using a spectrophotometer reader
(Titertek Multiskan® MCC/340 MK II). Results were expressed as the percentage of viability (%)
with respect to the control (solvent treated cells) according to the following formula: [(absorbance
treated cells - absorbance blank)/ (absorbance control cells – absorbance blank)] x 100. The half
inhibitory concentration (IC50) was estimated as the measurement of the cytotoxic potency of single
and combined treatments.

Chapter 3
68
Comet assay
After single or combined treatments with mycotoxins during 3 h (with and without metabolic
activation) or 24 h, cells were washed and detached. In order to monitor the ongoing process of the
assay, a negative control (cells treated with solvent) and a positive control (cells treated with a
solution of 100 µM H2O2) were included. The comet assay was applied as previously described by
Singh et al. and Collins et al. (Singh et al 1988; Collins et al., 1997; Collins and Dusinska, 2002; Collins
et al., 2001) with several modifications. The comet assay was performed to detect DNA strand
breaks, alkali labile sites (AP), and oxidized DNA bases. The DNA strand breaks were detected with
a simple version of the comet assay, but oxidized DNA bases were detected by incubating DNA
with bacterial restriction enzymes, which permit detecting specific lesions. Two different enzymes
were used in these experiments: endo III, whose substrates are oxidized pyrimidines; and FPG,
which is known for recognizing the common oxidized purine 8-oxoGua and ring-opened purines, or
formamidopyrimidines (FAPY) (Collins et al., 2008).
Cells were resuspended in PBS at a concentration of 1x10⁶ cells/mL. Thirty microliters of this
suspension were mixed with 140 µL of 1% low melting point agarose; two drops of 70 µL of this
mixture were placed on a microscope slide. A cover slip was put on top of each drop and the gels
were allowed to set for 5 min at 4ºC. Once the gels had become solid, the cover slip was removed
and the slides were dipped into lysis solution at 4ºC (2.5 M NaCl, 0.1 M Na4- EDTA • 2 H2O,
0.01 M Trizma-BASE, pH 10.5, TRITON X-100 1%). Four different slides, numbered from 1 to 4,
were prepared for each condition. Number 1, for observing DNA breaks and AP sites, and numbers
2, 3 and 4 for obtaining information regarding the presence of oxidized DNA bases using endo III
and FPG post-treatments.
During at least 1 h, samples were maintained in the lysis solution at 4ºC. The positive control
slide cells was dipped into H2O2 (100 µM in PBS) solution for 5 min at 4ºC, then washed with cold
PBS and introduced into a lysis solution in a separate jar for at least 1h.
Slides 2, 3 and 4 were washed 3 times (5 min each time) with the enzyme buffer (0.04 M
HEPES, 0.1 M KCl, 0.0005 M Na4- EDTA x 2 H2O, 0.2 mg/mL BSA, pH 8). Then gels were
digested with buffer (slide 2), endo III (slide 3) or FPG (slide 4), by adding 50 µL of the
corresponding solution to each gel and placing a cover slip on top, for 30 min at 37ºC in a humid
chamber. All nucleoids were denatured in a high-pH buffer (0.3 M NaOH, 0.001 M Na4-EDTA x
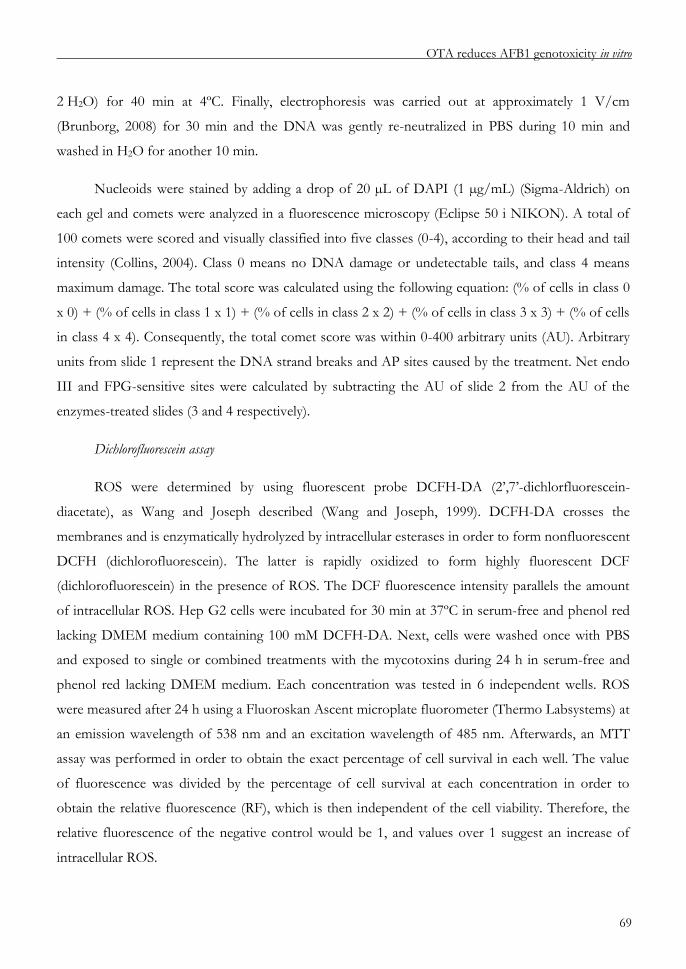
OTA reduces AFB1 genotoxicity in vitro
69
2 H2O) for 40 min at 4ºC. Finally, electrophoresis was carried out at approximately 1 V/cm
(Brunborg, 2008) for 30 min and the DNA was gently re-neutralized in PBS during 10 min and
washed in H2O for another 10 min.
Nucleoids were stained by adding a drop of 20 µL of DAPI (1 µg/mL) (Sigma-Aldrich) on
each gel and comets were analyzed in a fluorescence microscopy (Eclipse 50 i NIKON). A total of
100 comets were scored and visually classified into five classes (0-4), according to their head and tail
intensity (Collins, 2004). Class 0 means no DNA damage or undetectable tails, and class 4 means
maximum damage. The total score was calculated using the following equation: (% of cells in class 0
x 0) + (% of cells in class 1 x 1) + (% of cells in class 2 x 2) + (% of cells in class 3 x 3) + (% of cells
in class 4 x 4). Consequently, the total comet score was within 0-400 arbitrary units (AU). Arbitrary
units from slide 1 represent the DNA strand breaks and AP sites caused by the treatment. Net endo
III and FPG-sensitive sites were calculated by subtracting the AU of slide 2 from the AU of the
enzymes-treated slides (3 and 4 respectively).
Dichlorofluorescein assay
ROS were determined by using fluorescent probe DCFH-DA (2’,7’-dichlorfluorescein-
diacetate), as Wang and Joseph described (Wang and Joseph, 1999). DCFH-DA crosses the
membranes and is enzymatically hydrolyzed by intracellular esterases in order to form nonfluorescent
DCFH (dichlorofluorescein). The latter is rapidly oxidized to form highly fluorescent DCF
(dichlorofluorescein) in the presence of ROS. The DCF fluorescence intensity parallels the amount
of intracellular ROS. Hep G2 cells were incubated for 30 min at 37ºC in serum-free and phenol red
lacking DMEM medium containing 100 mM DCFH-DA. Next, cells were washed once with PBS
and exposed to single or combined treatments with the mycotoxins during 24 h in serum-free and
phenol red lacking DMEM medium. Each concentration was tested in 6 independent wells. ROS
were measured after 24 h using a Fluoroskan Ascent microplate fluorometer (Thermo Labsystems) at
an emission wavelength of 538 nm and an excitation wavelength of 485 nm. Afterwards, an MTT
assay was performed in order to obtain the exact percentage of cell survival in each well. The value
of fluorescence was divided by the percentage of cell survival at each concentration in order to
obtain the relative fluorescence (RF), which is then independent of the cell viability. Therefore, the
relative fluorescence of the negative control would be 1, and values over 1 suggest an increase of
intracellular ROS.

Chapter 3
70
Statistical analysis
Statistical analysis was performed by using SPSS for Windows. Three independent
experiments were performed in order to evaluate cytotoxicity and genotoxicity; four independent
experiments were carried out in the case of the ROS assay. Data is presented by descriptive analysis
[mean±standard deviation (SD) of the replicated experiments]. Comparisons were performed by
nonparametric Kruskal-Wallis H-test and Mann-Whitney U-test. P≤0.05 probability was accepted as
the level of significance.
Results
Cytotoxicity
Mycotoxins cytotoxicity was measured in Hep G2 cells at two different exposure times: a
short exposure time of 3 h, with and without S9 mix; and a long exposure time of 24 h. First they
were studied separately; then in combined treatments.
After 3 h of exposure, there was no evidence of cytotoxicity for AFB1 (1.56-150 µM) and no
apparent toxicity for OTA (50-800 µM). The presence of an external metabolizing enzyme system
did not show any variation in cell survival (data not shown). The IC50 values for AFB1 were over
150 µM and over 800 µM for OTA. After 24 h of treatment, AFB1 was more toxic (IC50= 100 µM)
than OTA (IC50= 360 µM) for Hep G2 cells. See table 1 and figure 1.
In order to study the effects of mycotoxins acting together, 100 µM or 150 µM of AFB1 were
added to five concentrations of OTA (3 h: 50-800 µM, 24 h: 1-200 µM). In the short treatment of 3
h, no significant cytotoxicity was observed at any of the concentrations of OTA with 100 µM or
150 µM of AFB1. At 24 h of treatment, the mixtures were more cytotoxic than the mycotoxins alone
(figure 1), thus decreasing the IC50 values (table 1).
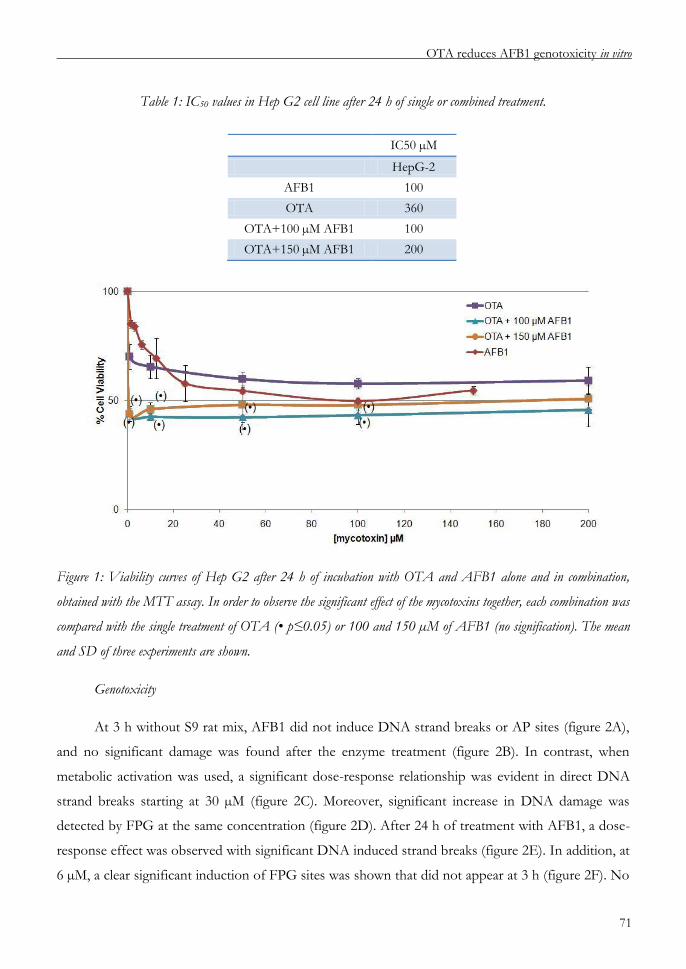
OTA reduces AFB1 genotoxicity in vitro
71
Table 1: IC50 values in Hep G2 cell line after 24 h of single or combined treatment.
Figure 1: Viability curves of Hep G2 after 24 h of incubation with OTA and AFB1 alone and in combination,
obtained with the MTT assay. In order to observe the significant effect of the mycotoxins together, each combination was
compared with the single treatment of OTA (• p≤0.05) or 100 and 150 µM of AFB1 (no signification). The mean
and SD of three experiments are shown.
Genotoxicity
At 3 h without S9 rat mix, AFB1 did not induce DNA strand breaks or AP sites (figure 2A),
and no significant damage was found after the enzyme treatment (figure 2B). In contrast, when
metabolic activation was used, a significant dose-response relationship was evident in direct DNA
strand breaks starting at 30 µM (figure 2C). Moreover, significant increase in DNA damage was
detected by FPG at the same concentration (figure 2D). After 24 h of treatment with AFB1, a dose-
response effect was observed with significant DNA induced strand breaks (figure 2E). In addition, at
6 µM, a clear significant induction of FPG sites was shown that did not appear at 3 h (figure 2F). No
IC50 µM
HepG-2
AFB1 100
OTA 360
OTA+100 µM AFB1 100
OTA+150 µM AFB1 200

Chapter 3
72
significant variations of the DNA breaks were detected after the digestion with endo III in any of the
treatments with AFB1 (figure 2B, 2D, 2F).
Ochratoxin A (50-800 µM) did not induce DNA breaks after 3 h or 24 h of exposure to Hep
G2 cells. The enzymatic digestion of the nuclei did not reveal any oxidative damage in the range
tested (data not shown).
Combined treatments were only carried out at 24 h because a very good dose-response
relationship was observed in single treatments at this time point; in addition, FPG was able to detect
significant DNA breaks at lower concentrations of AFB1 at 24 h rather than at 3 h with S9 mix. For
this purpose, different concentrations of AFB1 (1.2-150 μM) were tested with 50 μM of OTA. Both
combined treatments showed a good dose response behavior in DNA strand breaks and AP sites
(figure 3A). According to the enzyme digestion of the nuclei, no increase in DNA damage has been
observed when endo III was used (figure 3B) whereas significant increases in DNA breaks were
detected by FPG following a dose-response effect (figure 3C). The comparisons between the
combined and the single exposures at AFB1 yielded a significant decrease of DNA strand breaks and
AP sites (figure 3A). The detected damage in FPG treated nuclei was also less at low AFB1
concentrations (1.2 - 30 µM) (figure 3C).
Induction of intracellular ROS
The induction of intracellular reactive oxygen species (ROS) was studied in Hep G2 cells after
24 h of exposure to AFB1 (1.2-150 µM), OTA (50-200 µM), and the mixture of AFB1 with 50 µM of
OTA. There was a dose-dependent induction of ROS with a single treatment of AFB1 (figure 4A).
OTA treated cells suffered an increase in their ROS up to 100 µM (1.5 times control level) and then
the levels remained stable (figure 4B). Combined treatments induced greater amounts of ROS in
comparison to the control, and the differences were statistically significant. There was an increase in
ROS when the combined treatment was used with respect to the single treatment. This increase was
not significant in any case.

OTA reduces AFB1 genotoxicity in vitro
73
Figure 2: Genotoxic effects of AFB1 after 3 h (A and B), 3 h with 2.5% S9 rat mix (C and D) and 24 h of
treatment (E and F) measured with the comet assay. DNA damage was measured in arbitrary units (0-400). DNA
strand breaks and AP sites are plotted in A, C and E. Oxidative damage detected by post-digestion with the enzymes
is represented as net endo III (orange) and net FPG-sensitive sites (yellow) in B, D and F. In order to observe the
significant effects of treatments, each concentration was compared with nontreated cells (C-) (* p≤ 0.05). The mean
and SD of three experiments are shown.

Chapter 3
74
Figure 3: Comparative plots of DNA damage after exposing Hep G2 cells to AFB1 and AFB1+ 50 µM OTA
for 24 h measured with the comet assay. DNA damage was measured in arbitrary units (0-400). DNA damage was
measured as DNA strand breaks and AP sites (A) or oxidative damage, expressed as net endo III (B) or FPG (C)
sensitive sites. In order to observe significant differences among treatments, AFB1+OTA combinations were compared
with single exposures to AFB1 (* p≤0.05). The mean and SD of three experiments are shown.
Figure 4: Intracellular ROS of Hep G2 cells treated with AFB1 (A in blue), OTA (B), and mixtures of
AFB1+ 50 µM OTA (A in light blue) for 24 h. ROS levels were expressed as fluorescence per percentage of
survival. Results were compared with their negative control (* p≤0.05). The mean and SD of four experiments are
shown.
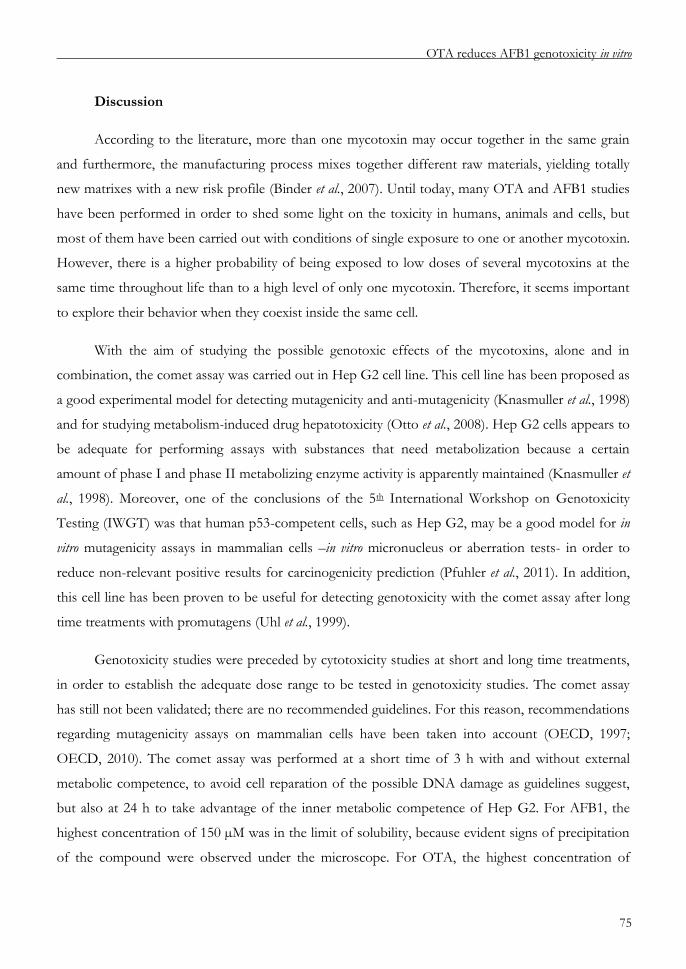
OTA reduces AFB1 genotoxicity in vitro
75
Discussion
According to the literature, more than one mycotoxin may occur together in the same grain
and furthermore, the manufacturing process mixes together different raw materials, yielding totally
new matrixes with a new risk profile (Binder et al., 2007). Until today, many OTA and AFB1 studies
have been performed in order to shed some light on the toxicity in humans, animals and cells, but
most of them have been carried out with conditions of single exposure to one or another mycotoxin.
However, there is a higher probability of being exposed to low doses of several mycotoxins at the
same time throughout life than to a high level of only one mycotoxin. Therefore, it seems important
to explore their behavior when they coexist inside the same cell.
With the aim of studying the possible genotoxic effects of the mycotoxins, alone and in
combination, the comet assay was carried out in Hep G2 cell line. This cell line has been proposed as
a good experimental model for detecting mutagenicity and anti-mutagenicity (Knasmuller et al., 1998)
and for studying metabolism-induced drug hepatotoxicity (Otto et al., 2008). Hep G2 cells appears to
be adequate for performing assays with substances that need metabolization because a certain
amount of phase I and phase II metabolizing enzyme activity is apparently maintained (Knasmuller et
al., 1998). Moreover, one of the conclusions of the 5th International Workshop on Genotoxicity
Testing (IWGT) was that human p53-competent cells, such as Hep G2, may be a good model for in
vitro mutagenicity assays in mammalian cells –in vitro micronucleus or aberration tests- in order to
reduce non-relevant positive results for carcinogenicity prediction (Pfuhler et al., 2011). In addition,
this cell line has been proven to be useful for detecting genotoxicity with the comet assay after long
time treatments with promutagens (Uhl et al., 1999).
Genotoxicity studies were preceded by cytotoxicity studies at short and long time treatments,
in order to establish the adequate dose range to be tested in genotoxicity studies. The comet assay
has still not been validated; there are no recommended guidelines. For this reason, recommendations
regarding mutagenicity assays on mammalian cells have been taken into account (OECD, 1997;
OECD, 2010). The comet assay was performed at a short time of 3 h with and without external
metabolic competence, to avoid cell reparation of the possible DNA damage as guidelines suggest,
but also at 24 h to take advantage of the inner metabolic competence of Hep G2. For AFB1, the
highest concentration of 150 µM was in the limit of solubility, because evident signs of precipitation
of the compound were observed under the microscope. For OTA, the highest concentration of
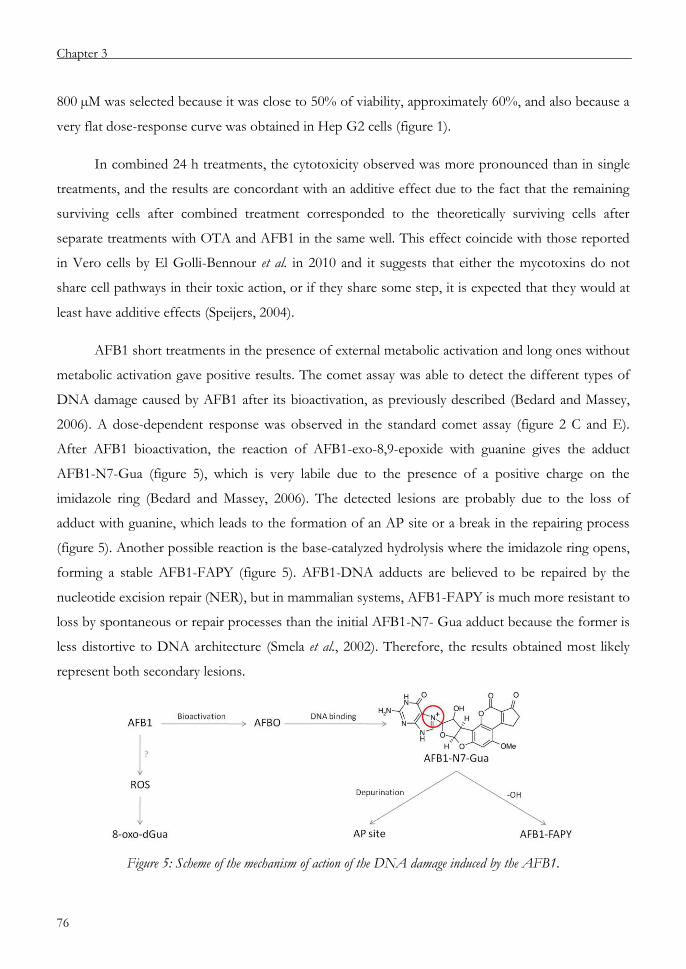
Chapter 3
76
800 µM was selected because it was close to 50% of viability, approximately 60%, and also because a
very flat dose-response curve was obtained in Hep G2 cells (figure 1).
In combined 24 h treatments, the cytotoxicity observed was more pronounced than in single
treatments, and the results are concordant with an additive effect due to the fact that the remaining
surviving cells after combined treatment corresponded to the theoretically surviving cells after
separate treatments with OTA and AFB1 in the same well. This effect coincide with those reported
in Vero cells by El Golli-Bennour et al. in 2010 and it suggests that either the mycotoxins do not
share cell pathways in their toxic action, or if they share some step, it is expected that they would at
least have additive effects (Speijers, 2004).
AFB1 short treatments in the presence of external metabolic activation and long ones without
metabolic activation gave positive results. The comet assay was able to detect the different types of
DNA damage caused by AFB1 after its bioactivation, as previously described (Bedard and Massey,
2006). A dose-dependent response was observed in the standard comet assay (figure 2 C and E).
After AFB1 bioactivation, the reaction of AFB1-exo-8,9-epoxide with guanine gives the adduct
AFB1-N7-Gua (figure 5), which is very labile due to the presence of a positive charge on the
imidazole ring (Bedard and Massey, 2006). The detected lesions are probably due to the loss of
adduct with guanine, which leads to the formation of an AP site or a break in the repairing process
(figure 5). Another possible reaction is the base-catalyzed hydrolysis where the imidazole ring opens,
forming a stable AFB1-FAPY (figure 5). AFB1-DNA adducts are believed to be repaired by the
nucleotide excision repair (NER), but in mammalian systems, AFB1-FAPY is much more resistant to
loss by spontaneous or repair processes than the initial AFB1-N7- Gua adduct because the former is
less distortive to DNA architecture (Smela et al., 2002). Therefore, the results obtained most likely
represent both secondary lesions.
Figure 5: Scheme of the mechanism of action of the DNA damage induced by the AFB1.
OTA reduces AFB1 genotoxicity in vitro
77
It has been described that FPG detects the typical oxidative biomarker, 8-oxodG, and the
open ring formamidopyrimidines (FAPY) (Collins et al., 2008). A significant increase in DNA
damage was found when nuclei were treated with FPG, and no oxidized purines were detected with
endo III. Bedard and Massey (2006) suggested that, as a secondary route, AFB1 may yield ROS
forms that react with guanine residues, forming 8-oxodG. In order to elucidate if the significant
increase of net FPG-sensitive sites was only due to AFB1-FAPY forms or if oxidative damage was
also involved, the dichlorofluorescein assay was performed after 24 h when the positive oxidative
damage was clearly observed. A low, but significant, increase in intracellular ROS was detected;
therefore, it is presumed that oxidative secondary route may play a role in AFB1 genotoxic action.
No genotoxic effects were observed in Hep G2 cells after 3 h or 24 h treatment with OTA in
the concentration range of 50-800 µM, with the latter being clearly cytotoxic after 24 h. These results
do not coincide with those reported by other authors, who have found a tail length increase in the
same cell line after 24 h, using a lower range (up to 62 µM) (Ehrlich et al., 2002). In human
CYP expressing cells, a slight significant increase in tail moment was observed only at the highest
cytotoxic concentration used (200 µM), after 8 h of exposure (Simarro Doorten et al., 2006).
Arbillaga et al. (2007) found a genotoxic effect in HK-2 cells after 6h (not after 3 h) with the comet
assay but only at cytotoxic concentrations, and this effect was correlated with an increase in
intracellular ROS. Clear increases were found in intracellular ROS levels in the range tested at 24 h,
and these results coincide with those published in the same experimental conditions; moreover, the
author correlates ROS increases with a mitochondrial-dependant apoptotic process and an
upregulation of Hsp70 genes (several authors have shown an evident correlation between oxidative
stress generation and Hsp70 induction (Hassen et al., 2005; El Golli et al., 2006)). Conversely, the
authors found that the increase of ROS was very low compared to H2O2 and lower yet when
compared to other cell lines (Arbillaga et al., 2007; Costa et al., 2007), so perhaps the OTA ROS
oxidation in DNA was low enough to be undetectable for FPG with the comet assay. A strong
hypothesis regarding how OTA produces ROS is that the OTA molecule reacts with glutathione
(GSH) or forms OTA-derived quinines (OTA-Q and OTA-HQ), yielding ROS acting forms as
secondary products (Ringot et al., 2006). As Hep G2 cells retain some phase I and phase II
metabolizing enzymes, they might be able to detoxify OTA, reducing the molecules available to react
with GSH, Q or HQ, and consequently, reducing ROS formation.
With respect to the genotoxic combined effects of these two toxins, the results that have been
obtained were unexpected. Combined treatments showed a significant decrease in DNA damage, not

Chapter 3
78
only in breaks and AP sites but also in FPG-sensitive sites, when compared to the AFB1 treatment.
On the other hand, ROS increased when mycotoxins coexist inside cells. A possible hypothesis for
these facts may be that AFB1 and OTA compete for the same CYP enzymes that represent a
bioactivation route for AFB1. If OTA had much more affinity for the CYPs involved, it would
displace other molecules until OTA would be consumed and consequently, after 24 h, there would
be less AFB1 bioactivated molecules (AFB1-epoxide) to attack and damage DNA, and as a result,
the combination of these two toxins would yield less direct DNA damage but an increase in
intracellular ROS. To confirm this hypothesis, very thorough mechanistic assays are needed,
probably starting with the characterization of the CYP or CYPs involved in AFB1 and OTA
metabolization in Hep G2 cell line, and finding its inhibitors.
Conclusion
In conclusion, AFB1 and OTA turned out to be more cytotoxic in combination than alone in
Hep G2, forming additive combination. As expected, AFB1 was genotoxic but OTA gave negative
results in Hep G2. Surprisingly, the co-exposure with OTA decreased AFB1 genotoxicity; it could be
that there was some kind of competition for the CYPs involved in mycotoxin metabolization. In vitro
assays, even when using human cell lines, are always hard to extrapolate to in vivo real situations;
however, additive and/or antagonic toxic effects may also be presumed in vivo. Therefore, further
investigations are needed in order to improve risk assessment.
Funding and acknowledgments
This work was supported by the Science and Innovation Ministry of Spain [AGL 2008-
01437/ALI]. The author wishes to express her gratitude to Prof. Andrew Collins for having given
her the opportunity to learn the comet assay in his group; to Ms. Celia Goñi and to Ms. Cecilia
Gutierrez for their kind help. The authors are grateful to Ms. Laura Stokes for reviewing the English
version of this manuscript. L-A.C. wishes to express her gratitude to the “Fundación Caja Navarra”,
the “Asociación de Amigos” of the University of Navarra and the Norwegian Government for their
grants received.

OTA reduces AFB1 genotoxicity in vitro
79
References
Arbillaga, L., Azqueta, A., Ezpeleta, O. and Lopez de Cerain, A., 2007. Oxidative DNA damage
induced by Ochratoxin A in the HK-2 human kidney cell line: evidence of the relationship with cytotoxicity.
Mutagenesis 22, 35-42.
Arbillaga, L., Ezpeleta, O. and Lopez de Cerain, A., 2004. ¿Es la Ocratoxina A una micotoxina
mutagénica? (Is the Ochratoxin A a mutagenic mycotoxine?). Revista de Toxicología 21, 1-10.
Bedard, L.L. and Massey, T.E., 2006. Aflatoxin B1-induced DNA damage and its repair. Cancer Lett
241, 174-183.
Binder, E.M., Tan, L.M., Chin, L.J., Handl, J. and Richard, J., 2007. Worldwide occurrence of
mycotoxins in commodities feeds and feed ingredients. Anim. Feed Sci Technol 137, 265-282.
Brunborg, G., 2008. Spreadsheet to calculate voltages and currents in an electrophoresis tank.
http://comics.vitamib.com/electrophoresis-physics.
Collins, A.R., Oscoz, A.A., Brunborg, G., Gaivao, I., Giovannelli, L., Kruszewski, M., Smith, C.C. and
Stetina, R., 2008. The comet assay: topical issues. Mutagenesis 23, 143-151.
Collins, A.R., 2004. The comet assay for DNA damage and repair: principles, applications, and
limitations. Mol Biotechnol 26, 249-261.
Collins, A.R. and Dusinska, M., 2002. Oxidation of cellular DNA measured with the comet assay.
Methods Mol Biol 186, 147-159.
Collins, A.R., Dusinska, M., Horvathova, E., Munro, E., Savio, M. and Stetina, R., 2001. Inter-individual
differences in repair of DNA base oxidation, measured in vitro with the comet assay. Mutagenesis 16, 297-301.
Collins, A.R., Dobson, V.L., Dusinska, M., Kennedy, G. and Stetina, R., 1997. The comet assay: what
can it really tell us? Mutat Res 375, 183-193.
Costa, S., Utan, A., Cervellati, R., Speroni, E. and Guerra, M.C., 2007. Catechins: natural free-radical
scavengers against ochratoxin A-induced cell damage in a pig kidney cell line (LLC-PK1). Food Chem Toxicol
45, 1910-1917.
Chapter 3
80
Creppy, E.E., Chiarappa, P., Baudrimont, I., Borracci, P., Moukha, S. and Carratu, M.R., 2004.
Synergistic effects of fumonisin B1 and ochratoxin A: are in vitro cytotoxicity data predictive of in vivo acute
toxicity? Toxicology 201, 115-123.
EFSA, 2007. Opinion of the Scientific Panel on Contaminats in the Food Chain on a request from the
Commission related to the potential increase of consumer health risk by a possible increase of the existing
maximun levels for Aflatoxins in almonds, hazelnuts and pistachios and derived products. EFSA J 446, 1-127.
EFSA, 2006. Opinion of the Scientific Panel on Contaminats in the Food Chain on a request from the
commision related to Ochratoxin A in food. EFSA J 365, 1-56.
Ehrlich, V., Darroudi, F., Uhl, M., Steinkellner, H., Gann, M., Majer, B.J., Eisenbauer, M. and
Knasmuller, S., 2002. Genotoxic effects of ochratoxin A in human-derived hepatoma (Hep G2) cells. Food
Chem Toxicol 40, 1085-1090.
El Golli, E., Hassen, W., Bouslimi, A., Bouaziz, C., Ladjimi, M.M. and Bacha, H., 2006. Induction of
Hsp 70 in Vero cells in response to mycotoxins cytoprotection by sub-lethal heat shock and by Vitamin E
Toxicol Lett 166, 122-130.
El Golli-Bennour, E., Kouidhi, B., Bouslimi, A., Abid-Essefi, S., Hassen, W. and Bacha, H., 2010.
Cytotoxicity and genotoxicity induced by aflatoxin B1, ochratoxin A, and their combination in cultured Vero
cells. J Biochem Mol Toxicol 24, 42-50.
EC, 2002. Commission Regulation (EC) No 472/2002 of 12 March 2002 amending Regulation (EC)
No 466/2001 setting maximum levels for certain contaminants in foodstuffs (Text with EEA relevance). L
75/18.
EC, 2006. Commission Regulation (EC) No 1881/2006 of 19 December 2006 setting maximum levels
for certain contaminants in foodstuffs (Text with EEA relevance). OJ L 364, 20.12.2006, p. 5–24.
Hassen, W., El Golli, E., Baudrimont, I., Mobio, A.T., Ladjimi, M.M., Creppy, E.E. and Bacha, H.,
2005. Cytotoxicity and Hsp 70 induction in Hep G2 cells in response to zearalenone and cytoprotection by
sub-lethal heat shock. Toxicology 207, 293-301.
Heussner, A.H., Dietrich, D.R. and O’Brien, E., 2006. In vitro investigation of individual and combined
cytotoxic effects of ochratoxin A and other selected mycotoxins on renal cells. Toxicol In vitro 20, 332-341.

OTA reduces AFB1 genotoxicity in vitro
81
IARC, 1987. IARC Monographs on the Evaluation of Carcinogenic Risks to Humans. Overall
Evaluations of Carcinogenicity: An Updating of IARC Monographs Volumes 1 to 42. Supplement 7, 440.
IARC, 1993. IARC Monographs on the Evaluation of Carcinogenic Risks to Humans. Some Naturally
Occurring Substances: Food Items and Constituents, Heterocyclic Aromatic Amines and Mycotoxins. 56, 33.
IARC, 2002. IARC Monographs on the Evaluation of Carcinogenic Risks to Humans. Some Traditional
Herbal Medicines, Some Mycotoxins, Naphthalene and Styrene. 82, 590.
Knasmuller, S., Parzefall, W., Sanyal, R., Ecker, S., Schwab, C., Uhl, M., Mersch-Sundermann, V.,
Williamson, G., Hietsch, G., Langer, T., Darroudi, F. and Natarajan, A.T., 1998. Use of metabolically
competent human hepatoma cells for the detection of mutagens and antimutagens. Mutat Res 402, 185-202.
Mally, A. and Dekant, W., 2005. DNA adduct formation by ochratoxin A: review of the available
evidence. Food Addit Contam 22 Suppl 1, 65-74.
Mally, A., Pepe, G., Ravoori, S., Fiore, M., Gupta, R.C., Dekant, W. and Mosesso, P., 2005. Ochratoxin
a causes DNA damage and cytogenetic effects but no DNA adducts in rats. Chem Res. Toxicol 18, 1253-1261.
Mally, A., Zepnik, H., Wanek, P., Eder, E., Dingley, K., Ihmels, H., Volkel, W. and Dekant, W., 2004.
Ochratoxin A: lack of formation of covalent DNA adducts. Chem Res Toxicol 17, 234-242.
McKean, C., Tang, L., Tang, M., Billam, M., Wang, Z., Theodorakis, C.W., Kendall, R.J. and Wang, J.S.,
2006a. Comparative acute and combinative toxicity of aflatoxin B1 and fumonisin B1 in animals and human
cells. Food Chem Toxicol 44, 868-876.
McKean, C., Tang, L., Billam, M., Tang, M., Theodorakis, C., Kendall, R. and Wang, J., 2006b.
Comparative acute and combinative toxicity of aflatoxin B1 and T-2 toxin in animals and immortalized human
cell lines. J Appl Toxicol 26, 139-147.
McLean, M. and Dutton, M.F., 1995. Cellular interactions and metabolism of aflatoxin: An update.
Pharmac Ther 65, 163-192.
Mosmann, T., 1983. Rapid colorimetric assay for cellular growth and survival: application to
proliferation and cytotoxicity assays. J Immunol Meth 65, 55-63.
OECD Guideline for the testing of chemicals, Number 473. Adopted 21st July 1997. In vitro
Mammalian Chromosome Aberration Tests.

Chapter 3
82
OECD Guideline for the testing of chemicals, Number 487. Adopted 22nd July 2010. In vitro
Mammalian Cell Micronucleus Test.
Otto, M., Hansen, S.H., Dalgaard, L., Dubois, J. and Badolo, L., 2008. Development of an in vitro assay
for the investigation of metabolism-induced drug hepatotoxicity. Cell Biol Toxicol 24, 87-99.
Pfuhler, S., Fellows, M., van Benthem, J., Corvi, R., Curren, R., Dearfield, K., Fowler, P., Frtschl, R.,
Elhajouji, A., Le Hgarat, L., Kasamatsu, T., Kojima, H., Oudraogo, G., Scott, A. and Speit, G., 2011. In vitro
genotoxicity test approaches with better predictivity: Summary of an IWGT workshop. Mutat. Res. .doi:
10.1016/j.mrgentox.2011.03.013.
Ringot, D., Chango, A., Schneider, Y.J. and Larondelle, Y., 2006. Toxicokinetics and toxicodynamics of
ochratoxin A, an update. Chem Biol Interact 159, 18-46.
Sava, V., Velasquez, A., Song, S. and Sanchez-Ramos, J., 2007. Adult hippocampal neural stem
progenitor cells in vitro are vulnerable to the mycotoxin ochratoxin A. Toxicol Sci 98, 187-197.
Sava, V., Reunova, O., Velasquez, A., Harbison, R. and Sanchez-Ramos, J., 2006a. Acute neurotoxic
effects of the fungal metabolite ochratoxin-A. Neurotoxicology 27, 82-92.
Sava, V., Reunova, O., Velasquez, A. and Sanchez-Ramos, J., 2006b. Can low level exposure to
ochratoxin-A cause parkinsonism? J Neurol Sci 249, 68-75.
Sedmíková, M., Reisnerová, H., Dufková, Z., Bárta, I. and Jílek, F., 2001. Potential Hazard of
simultaneous occurrence of aflatoxin B1 and ochratoxin A. Vet Med 46, 169-174.
Simarro Doorten, Y.S., Nijmeijer, S., de Nijs-Tjon, L. and Fink-Gremmels, J., 2006. Metabolism-
mediated Ochratoxin A genotoxicity in the single-cell gel electrophoresis (Comet assay). Food Chem Toxicol
44, 261-270.
Singh, N.P., McCoy, M.T., Tice, R.R. and Schneider, E.L., 1988. A simple technique for quantitation of
low levels of DNA damage in individual cells. Exp Cell Res 175, 184-191.
Smela, M.E., Hamm, M.L., Henderson, P.T., Harris, C.M., Harris, T.M. and Essigmann, J.M., 2002. The
aflatoxin B(1) formamidopyrimidine adduct plays a major role in causing the types of mutations observed in
human hepatocellular carcinoma. Proc Natl Acad Sci USA. 99, 6655-6660.
Speijers, G.J.A., 2004. Combined toxic effects of mycotoxins. Toxicol Lett 153, 91.

OTA reduces AFB1 genotoxicity in vitro
83
Turesky, R.J., 2005. Perspective: ochratoxin A is not a genotoxic carcinogen. Chem Res Toxicol 18,
1082-1090.
Uhl, M., Helma, C. and Knasmuller, S., 1999. Single-cell gel electrophoresis assays with human-derived
hepatoma (Hep G2) cells. Mutat Res 441, 215-224.
Urrego Novoa, J.R. and Diaz, G.J., 2006. Aflatoxins and its mechanisms of toxicity in hepatic cancer.
Rev Fac Med Una 54, 108-116.
Wang, H. and Joseph, J.A., 1999. Quantifying cellular oxidative stress by dichlorofluorescein assay using
microplate reader. Free Radic Biol Med 27, 612-616.

Chapter 4
A poliphenol-enriched cocoa extract reduces free radicals produced by mycotoxins
Laura-Ana Corcuera, Susana Amézqueta, Leire Arbillaga, Ariane Vettorazzi, Sonia Touriño, Jusep Lluis Torres, Adela López de Cerain
Food and Chemical Toxicology 50 (2012) 989-995


PECE reduces free radicals in vitro
87
Resumen
Los polifenoles se caracterizan por la presencia de unidades fenol en su molécula. Estos
compuestos pueden tener propiedades antioxidantes frente a especies reactivas de oxígeno (ROS) del
tipo radicales libres. Se ha obtenido a partir de semillas de cacao un extracto enriquecido en
polifenoles (PECE) con un 28% de procianidinas, la mayoría oligómeros de epicatequina. El PECE
fue muy activo frente a los radicales: ácido 2,2’-azinobis-(3-etilbenzotiazolin-6-sulfonico (ABTS), 1,1-
difenil-2-picrilhidrazilo (DPPH) y tris-(2,4,6-tricloro-3,5-dinitrofenil)metilo (HNTTM); y el ensayo
del tris-(2,3,5,6-tetracloro-4-nitrofenil)metilo (TNPTM) reveló que el PECE no se comportaría como
prooxidante. Por todo ello se consideró que sería un buen candidato como antioxidante en modelos
in vitro. El extracto fue levemente citotóxico en Hep G2 e indujo ROS de forma dosis dependiente
sólo a altas concentraciones cerca del límite de solubilidad. Las propiedades antioxidantes se
ensayaron en Hep G2 tratadas con aflatoxina B1 y/o ocratoxina A. El PECE no fue efectivo frente a
la AFB1, pero aumentó la viabilidad celular y redujo significativamente la cantidad de ROS en células
tratadas con OTA o mezclas AFB1+OTA. Estos resultados concuerdan con el mecanismo oxidativo
de la OTA e indican que los polifenoles del cacao son buenos candidatos como agentes
antioxidantes.
Chapter 4
88
Abstract
Polyphenols are characterized by the presence of phenol units in the molecules. These
compounds may show antioxidant ability by scavenging reactive oxygen species (ROS) of the free
radical type. A polyphenol enriched cocoa extract (PECE) was obtained from cocoa seeds with 28%
of procyanidins which were mainly epicatechin oligomers. PECE was very active as free radical
scavenger against 2,2’-azinobis-(3-ethylbenzothiazoline-6-sulfonic acid (ABTS), 1,1-diphenyl-2-
picrylhydrazyl radical (DPPH) and tris-(2,4,6-trichloro-3,5-dinitrophenyl)methyl (HNTTM) radicals;
and the tris-(2,3,5,6-tetrachloro-4-nitrophenyl)methyl (TNPTM) assay showed that the PECE might
not be pro-oxidant. Thus it was considered a good candidate to be tested in in vitro models. It
showed mild cytotoxic power on Hep G2 cells and induced ROS in a dose-dependent manner being
weak oxidant only at high concentrations near the limit of solubility. The antioxidant properties were
assayed in Hep G2 treated with the mycotoxins aflatoxin B1 (AFB1) and/or ochratoxin A (OTA).
The PECE was not effective against AFB1 but it increased the cell viability and reduced significantly
the amounts of ROS in cells treated with OTA or mixtures of AFB1+OTA. These results are
coherent with the role of oxidative pathways in the mechanism of OTA and indicate that
polyphenols extracted from cocoa may be good candidates as antioxidant agents.

PECE reduces free radicals in vitro
89
Introduction
Polyphenols are secondary metabolism products of plants and constitute one of the most
numerous and widely distributed groups of natural antioxidants in the plant kingdom. They can be
divided into at least 10 different classes depending on their basic structure, being the most important
ones that of flavonoids (Wollgast and Anklam, 2000). Flavonoids act as antioxidants via several
mechanisms including the scavenging of free radicals, chelation of transition metals, as well as the
mediation and inhibition of enzymes (Cos et al., 2004).
Red wine, cranberries, apples, tea and cocoa are among the richest food sources of flavonoids.
Specifically, cocoa is rich in flavan-3-ol monomers, (–)-epicatechin (EC), (+)-catechin (C) and their
related oligomers (procyanidins) (Osman et al., 2004). The mean estimated daily intake of
polyphenols in the diet is 1 g/person/day (Scalbert et al., 2002). It has been estimated that about 90%
of dietary polyphenols are bioaccesible in the small and in the large intestine (Saura-Calixto et al.,
2007). Monomeric (epi)catechins are rapidly metabolized to glucuronide and methyl conjugates in
the small intestine, absorbed into the bloodstream and then further conjugated (glucuronidated,
sulfated) in the liver. Procyanidins that are not absorbed in the small intestine are partially
depolymerized into monomeric units and the remaining polymers reach the colon where they are
metabolized by colonic microbiota into smaller compounds such as phenolic acids, which pass into
the bloodstream and are finally excreted in urine. An array of phenolic metabolites are absorbed in
the intestine and may contribute significantly to antioxidant and other physiological effects in the
gastrointestinal tract and other tissues (Spencer, 2000; Laurent and Rios, 2003; Kwik-Uribe and
Bektash, 2008; Urpi-Sarda et al., 2009; Touriño et al., 2011).
Aflatoxin B1 (AFB1) and ochratoxin A (OTA) are secondary products of several fungi
metabolism mainly found in cereals, grapes, coffee, species, and cocoa and they belong to the most
frequently occurring mycotoxins (Sedmíková et al., 2001). The IARC classified AFB1 and OTA as
class 1 (human carcinogen) and class 2B (possible human carcinogens), respectively (IARC, 1987;
IARC, 1993; IARC, 2002). AFB1 is bioactivated in the liver by P450 cytochrome and the resulting
epoxide metabolite causes the DNA damage by adduct formation (McLean and Dutton, 1995). A
secondary route for AFB1 metabolism involves ROS formation but the mechanisms are still
unknown (Bedard and Massey, 2006). Due to the carcinogenic nature of AFB1, the authorities have
not yet estimated a safe intake and advise the ALARA principle (as low as reasonable achievable).

Chapter 4
90
OTA is a potent nephrocarcinogenic compound in rodents but despite the controversy, it is
considered an indirect genotoxic agent (Arbillaga et al., 2004; Arbillaga et al., 2007; Mally et al., 2004;
Mally et al., 2005; Mally and Dekant, 2005; Turesky, 2005). OTA mechanisms of action have not
been clearly determined but apparently its ability to generate reactive oxygen species (ROS) may
explain the lipid, protein and DNA damage (Ringot et al., 2006). Different official organizations have
suggested safety PTDI between 5 and 17 ng of OTA per kg of body weight. With regard to AFB1
and OTA synergic behavior, it was found that OTA increased the mutagenicity of AFB1, and the
mixture of both not only showed cytotoxic additive effects but also a slight increase in DNA
fragmentation when compared to mycotoxins taken separately in Vero cells (El Golli-Bennour et al.,
2010). In Hep G2 cells, the mixture induced more ROS than each mycotoxin alone but OTA
reduced the AFB1 genotoxicity (Corcuera et al., 2011).
Recently, attention has been focused on inhibitory roles of natural constituents in suppressing
or reducing the toxic action of mycotoxins, and results are not conclusive. In the case of AFB1,
Muto et al. (2001) found that epicatechin (EC) partially inhibited the bioactivation of AFB1 in
Salmonella enterica serovar Typhimurium which expressed human CYPs. However, Lee et al. (2001) could
not find any inhibition in the epoxide synthesis when AFB1 was mixed with mouse liver microsomal
proteins and catechins. Yet a cocoa polyphenol extract was able to suppress acrylamide toxicity,
which has the same bioactivation pathway as AFB1, by improving the redox status and by blocking
the apoptotic pathway activated by acrylamide (Rodriguez-Ramiro et al., 2011). With regard to OTA,
Costa et al. (2007) reported cytoprotective effects of catechins in vitro from OTA-induced cell damage
and a good scavenging power according to inhibition of ROS production. Moreover, Baldi et al.
(2004) found a small but significant protection (10 %) of α-tocopherol towards OTA-induced cell
death in bovine mammary epithelial cells. However, Hundhausen et al. (2005) tested the effect of
different polyphenols on OTA-induced cytotoxicity in Hep G2 liver cells, concluding that these
compounds did not counteract OTA-induced cytotoxicity in working conditions.
In this work, a polyphenol-enriched cocoa extract (PECE) has been prepared and evaluated as
an antioxidant agent in a cell free system and in Hep G2 cells. Once the antioxidant activity was
confirmed, its ability to reduce AFB1 and OTA cytotoxicity and ROS induction has been tested
showing promising results.

PECE reduces free radicals in vitro
91
Materials and methods
Chemicals
Cocoa beans were provided by a national cocoa import factory. Acetone, acid acetic and
chloridric acid were purchased from Panreac (Barcelona, Spain). 1,1-Diphenyl-2-picrylhydrazyl free
radical (DPPH) (95%), 6-hydroxy-2,5,7,8-tetramethyl-chroman-2-carboxylic acid (Trolox) (97%),
2,2’-Azinobis-(3-ethylbenzothiazoline-6-sulfonic acid (ABTS) crystallized diammonium salt, (+)-
catechin (C), (–)-epicatechin (EC), (–)-epicatechin-3-O-gallate (ECG), OTA, AFB1 standards and
cysteamine hydrochloride were purchased from Sigma-Aldrich (St. Louis, MO, USA). 4-β-(2-
aminoethylthio)catechin (Cya-Cat), 4-β-(2 aminoethylthio)epicatechin (Cya-EC), 4-β-(2-
aminoethylthio)epicatechin-3-O-gallate (Cya-ECG) were synthesized and purified from grape
extracts as previously described (Torres and Bobet, 2001). Tris(2,4,6-trichloro-3,5-
dinitrophenyl)methyl (HNTTM) and tris(2,3,5,6-tetrachloro-4-nitrophenyl)methyl (TNPTM) radicals
were synthesized as described (Torres et al., 2003; Torres et al., 2007). For HPLC analysis, HPLC
grade acetonitrile (Scharlab, Barcelona, Spain) and trifluoroacetic acid (TFA) (Fluorochem,
Drebyshire, UK) were used. HPLC grade methanol was purchased from Merck (Darmstadt,
Germany).
PECE preparation
OTA-free cocoa beans (20 g) were milled and lipidic compounds were removed with hexane.
Next, theobromine and related compounds were discarded with ethanol:water:trifluoroacetic acid
(15:84.9:0.1 v/v/v) (3 × 400 mL). Then, polyphenols were extracted with a mixture of
acetone:water:acetic acid (70:29.98:0.02 v/v/v) (3 × 400 mL), the solid discarded by centrifugation
and decantation and the acetone in the solution evaporated under vacuum. Finally, the polyphenolic
extract was freeze-dried and kept in the dark in a N2 atmosphere to avoid product oxidation.
Estimation of polyphenolic composition
The size and composition of the procyanidins were determined by HPLC analysis (Torres and
Selga, 2003). Depolymerized sample was analyzed by HPLC-DAD using a Hitachi Lachrom Elite
HPLC (San Jose, CA, USA) fitted to a Kromasil C18 column (25 × 0.4 cm, 5 µm) from Teknokroma
(Barcelona, Spain). Components were eluted with a binary system 0.1% (v/v) TFA in HPLC grade

Chapter 4
92
water [A] and 0.1% TFA (v/v) in acetonitrile [B], gradient 9.6 to 20% [B] in 22 min, flow rate
1 mL/min. Selected wavelength for the polyphenol quantitative analysis was 214 nm.
Using this methodology, the terminal flavan-3-ols units were released as such by acid cleavage
in the presence of Cya (cysteamine) whereas the extension moieties were released as the Cya
derivatives on the fourth position of the flavanoid system. Calibration curves of terminal units C and
EC and extension units Cya-Cat and Cya-EC were plotted by analyzing 6 standards within the
working range in triplicate. Then the terminal and extension units content in the cocoa extract were
determined and the mean degree of polymerization (mDP) and the mean molecular weight of the
polymer (mMW) were calculated as follows:
Free radical scavenging activity
To study the free radical scavenging activity, the ABTS, DPPH, HNTTM, TNPTM methods
described in Touriño et al. (2008) were applied.
ABTS assay measures the total antioxidant activity, comparing antioxidant activity of the
extract with that of Trolox. In this case, the concentrations of cocoa polyphenolic extract (50 µL)
used to mix with the 1 mM ABTS solution (1950 µL) were 50, 62.5, 75, 100 and 125 µg/mL in
methanol. The Trolox equivalent antioxidant activity (TEAC) of the fractions was expressed as µmol
of Trolox equivalent to 1 mg of cocoa polyphenolic extract.
The free radical scavenging power was also evaluated against two other radicals: DPPH and
HNTTM. These two radicals are used to calculate the stoichiometry of the redox reaction and to
discriminate between hydrogen donation and electron-transfer mechanisms of radical scavenging.
While the DPPH assay measures the combined hydrogen donation and electron-transfer capacity of
the polyphenols, the HNTTM stable radical exerts its action exclusively by electron transfer. For
both DPPH and HNTTM assays, the antiradical power (ARP) is expressed as the inverse of ED50
(µg of extract able to consume one-half the amount of free radical divided by µmol of initial DPPH
or HNTTM). The concentrations of cocoa polyphenolic extract to be mixed with the radical solution
EcCatunitsalternmolTotal
ECCyaCatCyaEcCatnmolTotalmDP
min
EcCatunitsalternmolTotal
ECCyaCatCyaEcCatngTotalmMW
min

PECE reduces free radicals in vitro
93
were 20, 70, 100, 150, 200 and 300 µg/mL of methanol in the case of 60 µM DPPH and 0.5, 2.5, 5,
15, 35 and 50 µg/mL of chloroform:methanol 2:1 in the case of 120 µM HNTTM.
The specific reactivity of TNPTM radical with the most reducing positions (e.g. pyrogallol
group) was compared with the hydrogen donation ability (DPPH) and global electron transfer
capacity (HNTTM) in order to provide valuable information regarding the ability of some
components to engage in putatively prooxidant/toxic effects involving electron transfer to oxygen.
The concentrations of PECE to mix with the 80 µM TNPTM solution were 32.5, 65, 97.5 and
130 µg/mL of chloroform:methanol 2:1.
Cell cultures
Hep G2 (hepatocellular carcinoma epithelial cell line) (HB-8065) was obtained from the
American Type Culture Collection (ATCC, Manassas, VA, USA). It was kept in the laboratory
satisfying the requirements for Good Laboratory Practice (GLP) conditions. A master bank was
created on arrival and a working bank was created to perform the assays of this study, controlling the
passing number, which never surpassed 20.
Cells were cultured in monolayer in Dulbecco’s Modified Eagle’s Medium (DMEM, Gibco,
Prat de Llobregat, Barcelona, Spain) supplemented with 10% of fetal calf serum (FCS, Gibco) and
1% of antibiotics (10,000 U/mL penicillin and 10,000 µg/mL streptomycin, Gibco). Cells were
grown at 37ºC and 5% CO2 in a humidified atmosphere.
Cytotoxicity assay
Cell viability was assessed by the MTT assay that measures the reduction of MTT (3-(4,5-
dmethyl-2-thiazolyl)-2,5-diphenyltetrazolium bromide) to formazan by the mitochondrial enzyme
succinate dehydrogenase (Mosmann, 1983). Cells were seeded on 96-well plates and after 24 h of
incubation, cells were washed with PBS and exposed for 24 h to: PECE (5, 25, 50, 75 and
100 mg/L), AFB1 (1.2, 6 and 30 µM), OTA (50, 100 and 200 µM), AFB1 (1.2, 6 and 30 µM)+50µM
OTA. To study the protection of PECE against mycotoxins, cells were pretreated during 24 h with
PECE (25 or 50 mg/L), and then, the same concentrations of AFB1, OTA or AFB1+ 50µM OTA
were used. Plates were washed and MTT (5 mg/mL) was added to fresh culture medium to each well
and incubated another 2 h. The supernatant was removed, and the insoluble formazan crystals were
dissolved with 100 µL of DMSO. The absorbance was measured at 540 nm using a
Chapter 4
94
spectrophotometer reader (Titertek Multiskan® MCC/340 MK II). Results were expressed as the
percentage of viability (%) with respect to the control (solvent treated cells) according to the
following formula:
Cells survival values above 70-80% were considered non cytotoxic.
Dichlorofluorescein assay
ROS were determined by using fluorescent probe DCFH-DA (2’,7’-dichlorfluorescein-
diacetate), as Wang and Joseph described (Wang and Joseph, 1999). DCFH-DA crosses the
membranes and is enzymatically hydrolyzed by intracellular esterases in order to form
non fluorescent DCFH (dichlorofluorescein). The latter is rapidly oxidized to form highly
fluorescent DCF (dichlorofluorescein) in the presence of ROS. The DCF fluorescence intensity
parallels the amount of intracellular ROS. Hep G2 cells were incubated for 30 min at 37ºC in serum-
free and phenol red lacking DMEM medium containing 100 mM DCFH-DA. Afterwards, cells were
washed once with PBS and exposed during 24 h to: PECE, AFB1, OTA, AFB1+50µM OTA or to a
pretreatment of PECE during 24 h and then AFB1, OTA or AFB1+50µM OTA, using the same
concentrations as in previous section. ROS were measured using a microplate fluorometer
Fluoroskan Ascent (Thermo Labsystems) at an emission wavelength of 538 nm and an excitation
wavelength of 485 nm. Afterwards, a MTT assay was performed in order to obtain the exact % of
cell survivor in each well. The value of fluorescence was divided per the % of cell survivor at each
concentration in order to obtain the relative fluorescence (RF), which is independent of the cell
viability. Therefore, the relative fluorescence of the negative control would be 1, and values over 1
suggest an increase of intracellular ROS.
Solubility and interactions
The polyphenol extract was dissolved in NaHCO3 (Riedel-deHaën, Seelze, Germany) at
pH 7.4 using an ultrasound bath without exceeding 30ºC. The maximum concentration reached was
100 mg/L. OTA was dissolved in 0.1 M NaHCO3 (pH 7.4) (Riedel-deHaën, Seelze, Germany) to an
initial concentration of 2.48 mM and AFB1 was dissolved in DMSO (Panreac Quimica SAU,
Barcelona, Spain) to an initial concentration of 15.15 mM. All solutions were aliquoted and
100(%)
blankcellscontrol
blankcellstreated
AbsorbanceAbsorbance
AbsorbanceAbsorbanceViability

PECE reduces free radicals in vitro
95
maintained at -20ºC until use. PECE and AFB1 solutions were kept in the dark to avoid light
degradation. The experiments were performed without fetal calf serum (FCS) in order to avoid
serum interactions with the PECE or mycotoxins binding to proteins.
Statistical analysis
Three independent experiments were performed to check cytotoxicity and ROS induction.
Data is presented by descriptive analysis [mean±standard deviation (SD) of the replicated
experiments]. Comparisons were performed by non-parametric Kruskal-Wallis H-test and Mann-
Whitney U-test. P≤0.05 was accepted as the level of significance.
Results
PECE preparation and mean polyphenol composition
A water:acetone 3:7 cocoa extract containing C and EC monomers and oligomers was
prepared as described previously. Calibration curves of C, EC, Cya-Cat and Cya-EC were prepared
covering the working range. Six standards of each compound were analyzed and a linear response
versus concentration was obtained. Sample analyses were carried out in triplicate having a
RSD < 8%. Cocoa extract had 28 % of procyanidins being richer in EC (89%) than in C (11%). The
amount of terminal EC (12%) is clearly lower than the amount of chain EC (77%) with the mean
oligomeric size (mDP) being 4.5 units and the mean molecular weight (mMW) 1,300 g mol-1 (see
table 1).
Free radical scavenging activity in cell-free systems
The free radical scavenging power was evaluated against stable radicals that measure the
electron and proton transfer capacity (ABTS assay and DPPH assay) and radicals which are
exclusively quenched by electron transfer to an anion with subsequent slow proton incorporation
(HNTTM assay). Additionally, pro-oxidant activity of extracts was tested using the TNPTM which
measures the electronic transfer capacity of ROS inducing compounds. Results are presented in table
2.

Chapter 4
96
Cytotoxicity and ROS production
Five different concentrations up to the maximum soluble one were used to test the cytotoxic
effects of PECE. A dose-dependent curve was observed after 24 h of treatment and the cell survival
was over 50% for the entire concentration range (figure 1A); therefore, the IC50 could not be
calculated.
In order to investigate the possible induction of intracellular ROS, the same five PECE
concentrations were chosen. Significant increases of ROS were observed in a dose-dependent
relationship (figure 1B).
PECE protection against mycotoxin toxicity
With the aim of testing the PECE protection capability against AFB1 and OTA toxicity, Hep
G2 cells were incubated with the extract during 24 h prior to mycotoxin treatments. Two PECE
concentrations were chosen: 25 and 50 mg/L. Cell viability of Hep G2 decreased with respect to the
control after being treated with AFB1 or OTA or a mixture of AFB1 (same concentrations as in
single treatments) + 50 µM OTA. PECE pretreatment increased AFB1 induced cytotoxicity (figure
2A), whereas OTA and AFB1 +OTA cytotoxicity were partially counteracted by the pretreatment of
PECE (figure 2 C, D, E and F).
Table 1: Mean oligomeric size of procyanidin units (mDP) and percentages of the different flavonoids in extracts from
cocoa and different sources.
Source of the polyphenolic crude extract
mDP % procyanidin
Catechin Epicatechin References
% terminal % chain % terminal % chain
Theobroma Cocoa seeds (PECE) 4.5 28 10 1 12 77 Present work
Pinus Pinaster 2.3 17 40 13 5 42 Touriño et al., 2005
Pinus Radiata 2.9 36 34 49 5 12 Jerez et al., 2007
Hammamelis Virginiana 2.9 5.8 3.4 6.7 7.9 6.1 Touriño et al., 2008
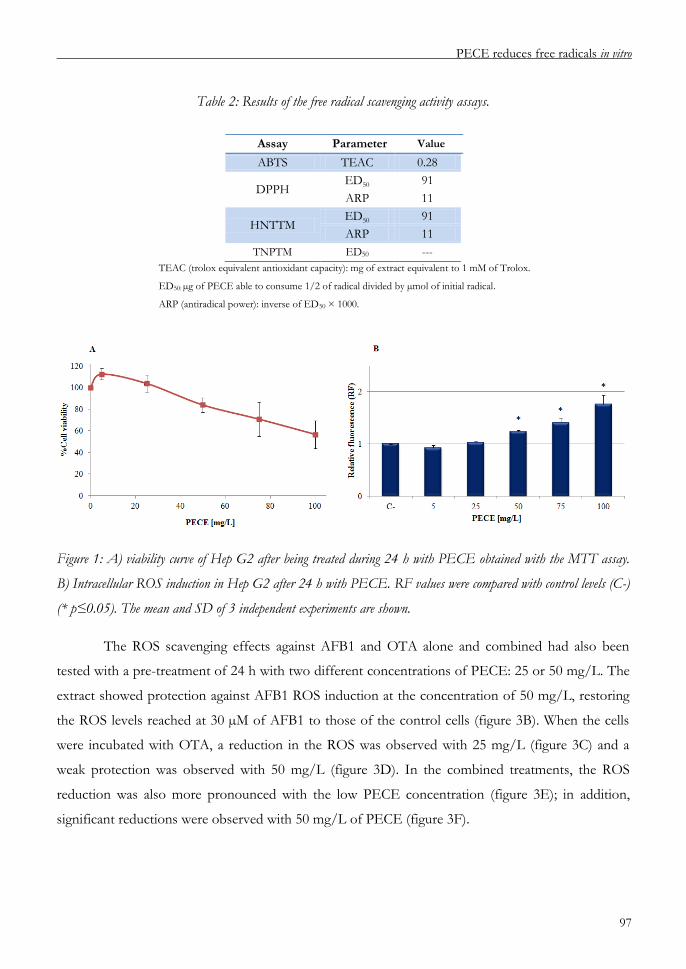
PECE reduces free radicals in vitro
97
Table 2: Results of the free radical scavenging activity assays.
Figure 1: A) viability curve of Hep G2 after being treated during 24 h with PECE obtained with the MTT assay.
B) Intracellular ROS induction in Hep G2 after 24 h with PECE. RF values were compared with control levels (C-)
(* p≤0.05). The mean and SD of 3 independent experiments are shown.
The ROS scavenging effects against AFB1 and OTA alone and combined had also been
tested with a pre-treatment of 24 h with two different concentrations of PECE: 25 or 50 mg/L. The
extract showed protection against AFB1 ROS induction at the concentration of 50 mg/L, restoring
the ROS levels reached at 30 µM of AFB1 to those of the control cells (figure 3B). When the cells
were incubated with OTA, a reduction in the ROS was observed with 25 mg/L (figure 3C) and a
weak protection was observed with 50 mg/L (figure 3D). In the combined treatments, the ROS
reduction was also more pronounced with the low PECE concentration (figure 3E); in addition,
significant reductions were observed with 50 mg/L of PECE (figure 3F).
Assay Parameter Value
ABTS TEAC 0.28
DPPH ED50 91
ARP 11
HNTTM ED50 91
ARP 11
TNPTM ED50 ---
TEAC (trolox equivalent antioxidant capacity): mg of extract equivalent to 1 mM of Trolox.
ED50: µg of PECE able to consume 1/2 of radical divided by µmol of initial radical.
ARP (antiradical power): inverse of ED50 × 1000.
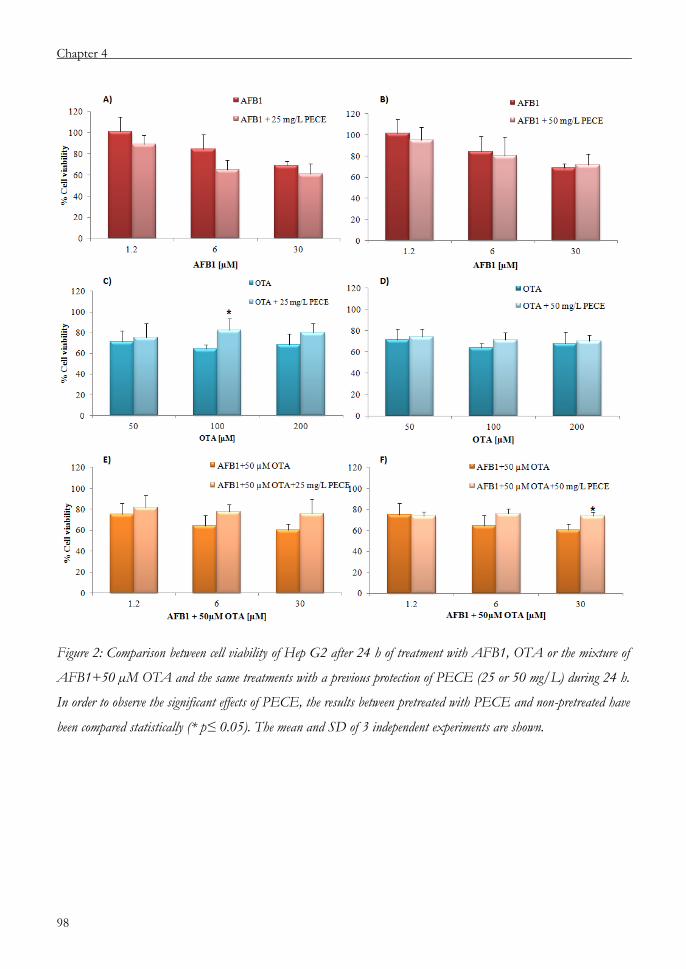
Chapter 4
98
Figure 2: Comparison between cell viability of Hep G2 after 24 h of treatment with AFB1, OTA or the mixture of
AFB1+50 µM OTA and the same treatments with a previous protection of PECE (25 or 50 mg/L) during 24 h.
In order to observe the significant effects of PECE, the results between pretreated with PECE and non-pretreated have
been compared statistically (* p≤ 0.05). The mean and SD of 3 independent experiments are shown.

PECE reduces free radicals in vitro
99
Figure 3: ROS induction in Hep G2 of AFB1, OTA and a mixture of AFB1+50 µM OTA and the protective
effects of a pretreatment of PECE (25 or 50 mg/L) during 24 h against mycotoxins. The ROS induction of each
treatment has been compared to the basal level (C-) (* p≤ 0.05). The significant ROS reduction due to the
pretreatment with PECE has been indicated with the º symbol when p≤ 0.05. The mean and SD of 3 independent
experiments are shown.
Discussion
Baba et al. evaluated the levels of EC and its metabolites in plasma and urine after intake of
chocolate or cocoa by male volunteers. They found that EC was partly absorbed and present in
plasma in the free form or as a component of various non-methylated and methylated conjugates
(Baba et al., 2000). Cocoa polyphenols and alkaloids comprise approximately 14 – 20% of the whole
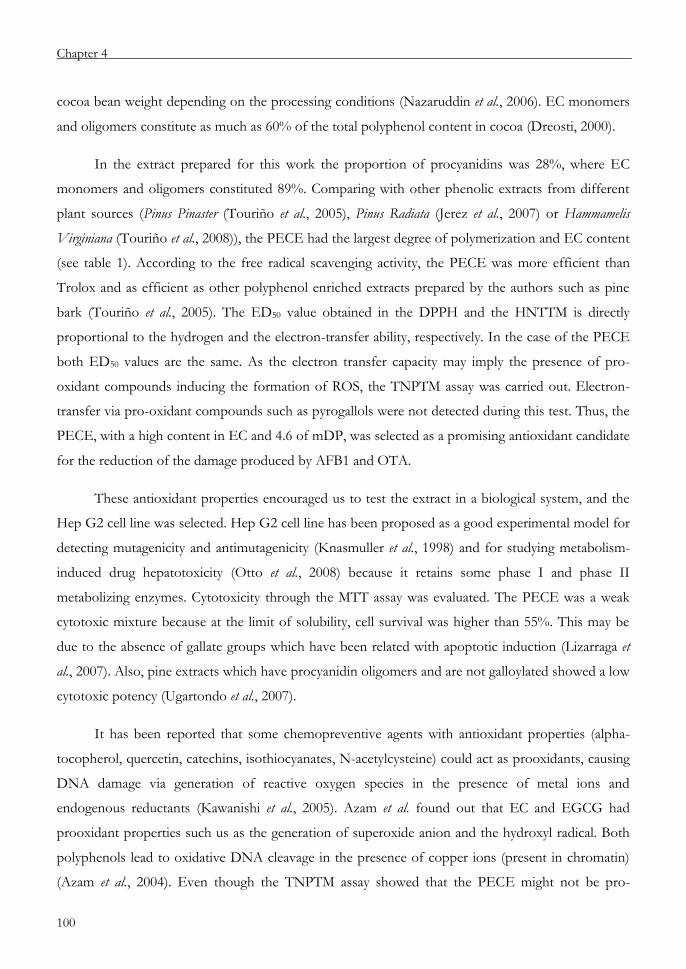
Chapter 4
100
cocoa bean weight depending on the processing conditions (Nazaruddin et al., 2006). EC monomers
and oligomers constitute as much as 60% of the total polyphenol content in cocoa (Dreosti, 2000).
In the extract prepared for this work the proportion of procyanidins was 28%, where EC
monomers and oligomers constituted 89%. Comparing with other phenolic extracts from different
plant sources (Pinus Pinaster (Touriño et al., 2005), Pinus Radiata (Jerez et al., 2007) or Hammamelis
Virginiana (Touriño et al., 2008)), the PECE had the largest degree of polymerization and EC content
(see table 1). According to the free radical scavenging activity, the PECE was more efficient than
Trolox and as efficient as other polyphenol enriched extracts prepared by the authors such as pine
bark (Touriño et al., 2005). The ED50 value obtained in the DPPH and the HNTTM is directly
proportional to the hydrogen and the electron-transfer ability, respectively. In the case of the PECE
both ED50 values are the same. As the electron transfer capacity may imply the presence of pro-
oxidant compounds inducing the formation of ROS, the TNPTM assay was carried out. Electron-
transfer via pro-oxidant compounds such as pyrogallols were not detected during this test. Thus, the
PECE, with a high content in EC and 4.6 of mDP, was selected as a promising antioxidant candidate
for the reduction of the damage produced by AFB1 and OTA.
These antioxidant properties encouraged us to test the extract in a biological system, and the
Hep G2 cell line was selected. Hep G2 cell line has been proposed as a good experimental model for
detecting mutagenicity and antimutagenicity (Knasmuller et al., 1998) and for studying metabolism-
induced drug hepatotoxicity (Otto et al., 2008) because it retains some phase I and phase II
metabolizing enzymes. Cytotoxicity through the MTT assay was evaluated. The PECE was a weak
cytotoxic mixture because at the limit of solubility, cell survival was higher than 55%. This may be
due to the absence of gallate groups which have been related with apoptotic induction (Lizarraga et
al., 2007). Also, pine extracts which have procyanidin oligomers and are not galloylated showed a low
cytotoxic potency (Ugartondo et al., 2007).
It has been reported that some chemopreventive agents with antioxidant properties (alpha-
tocopherol, quercetin, catechins, isothiocyanates, N-acetylcysteine) could act as prooxidants, causing
DNA damage via generation of reactive oxygen species in the presence of metal ions and
endogenous reductants (Kawanishi et al., 2005). Azam et al. found out that EC and EGCG had
prooxidant properties such us as the generation of superoxide anion and the hydroxyl radical. Both
polyphenols lead to oxidative DNA cleavage in the presence of copper ions (present in chromatin)
(Azam et al., 2004). Even though the TNPTM assay showed that the PECE might not be pro-

PECE reduces free radicals in vitro
101
oxidant, the possible induction of ROS was studied in Hep G2, and a dose-response ROS increase
was detected only at high concentrations. For this reason, the two concentrations that were selected
for studying PECE protection against mycotoxin toxicity were: a noncytotoxic concentration which
did not induce ROS (25 mg/L) and the tested concentration that induced a slight cytotoxic effect
(around 80% of cell survival) (50 mg/L). This concentration induced very low but significant levels
of ROS; therefore, this concentration might not be efficient enough in cell protection. However,
50 mg/L was selected due to the fact that antioxidant/prooxidant balance of polyphenols at cellular
levels may be modulated by the presence of other substances (Azam et al., 2004; Chendea et al.,
2010).
The protective treatments with PECE can be performed before, during or after treatment
with mycotoxins. Costa et al. (2007) found excellent protective effects of pure catechin derivatives
(EGCG and ECG) against OTA cytotoxicity, acting as good ROS scavengers. This effect was
detected when the antioxidants were added to LLC-PK1 cells (pig kidney cell line) 24 h before the
mycotoxin with no effects in the co- and post-treatments (Costa et al., 2007). Therefore, Hep G2
cells were incubated with PECE during 24 h before they were treated with the mycotoxins.
Regarding AFB1, the PECE did not reduce the cytotoxicity. Lee et al. (2001) observed that catechins
have no inhibitory effects on the biotransformation of AFB1 to its epoxide. Moreover, the PECE
was not very effective on ROS scavenging and only reduced the ROS levels at the highest
concentration with 50 mg/L. This may indicate that radical formation is not the principal mechanism
of AFB1 cytotoxicity, although it does play a role as a secondary route of action (Bedard and Massey,
2006). Regarding OTA cytotoxicity, both in isolated and combined treatments with AFB1, the cell
survival was improved, in particular with 25 mg/L of PECE, even when AFB1 was present. The
protection was not efficient with 50 mg/L in OTA treated cells, but at least the cell death did not
increase in the presence of PECE. In concordance with this, 25 mg/L of PECE was very effective
reducing ROS formation in all the OTA and combined treatments. Surprisingly, the greater
reduction of ROS was observed with the “prooxidant” concentration of 50 mg/L in the combined
treatment of 30 µM AFB1+50 µM. This observation highlights the dual pro/anti oxidant activity of
the molecules with multiple phenol units according to the redox properties of the molecules that
interact with them. In conclusion, a PECE was prepared and tested as antioxidant agent. It had
encouraging antioxidant properties in the cell free assays and low cytotoxic power in Hep G2 cells.
The PECE reduced ROS generated by the mycotoxins, particularly in isolated OTA treatments or
combined AFB1 and OTA treatments. Thus, polyphenols extracted from cocoa have a good
Chapter 4
102
antioxidant activity and may be efficient reducing the generation of ROS produced by mycotoxins or
other oxidant agents.
Funding
This work was supported by the Science and Innovation Ministry of Spain [AGL2008-
01437/ALI and AGL2006-12210-C03-02/ALI] and by the Government of Navarra, Aquitania and
Catalunya within the framework of the program ITT of the Work Community of Pyrenees [CTP 09-
P14].
Acknowledgments
The author wishes to express her gratitude to Ms. Celia Goñi, Ms. Cecilia Gutierrez and Ms.
Anna Carreras for their help. The authors are grateful to Ms. Laura Stokes for reviewing the English
version of this manuscript. L-A.C. and S. A. wish to express their gratitude to the University of
Navarra-Fundación Caja Navarra and the “Asociación de Amigos” of the University of Navarra.
PECE reduces free radicals in vitro
103
References
Arbillaga, L., Azqueta, A., Ezpeleta, O. and López de Cerain, A., 2007. Oxidative DNA damage
induced by Ochratoxin A in the HK-2 human kidney cell line: evidence of the relationship with cytotoxicity.
Mutagenesis 22, 35-42.
Arbillaga, L., Ezpeleta, O. and López de Cerain, A., 2004. ¿Es la Ocratoxina A una micotoxina
mutagénica? (Is the Ochratoxin A a mutagenic mycotoxine?). Revista de Toxicología 21, 1-10.
Azam, S., Hadi, N., Khan, N.U. and Hadi, S.M., 2004. Prooxidant property of green tea polyphenols
epicatechin and epigallocatechin-3-gallate: implications for anticancer properties. Toxicology In vitro 18, 555-
561.
Baba, S., Osakabe, N., Yasuda, A., Natsume, M., Takizawa, T., Nakamura, T. and Terao, J., 2000.
Bioavailability of (-)-epicatechin upon intake of chocolate and cocoa in human volunteers. Free Radic Res 33,
635-641.
Baldi, A., Losio, M.N., Cheli, F., Rebucci, R., Sangalli, L., Fusi, E., Bertasi, B., Pavoni, E., Carli, S. and
Politis, I., 2004. Evaluation of the protective effects of alpha-tocopherol and retinol against ochratoxin A
cytotoxicity. Br J Nutr 91, 507-512.
Bedard, L.L. and Massey, T.E., 2006. Aflatoxin B1-induced DNA damage and its repair. Cancer Lett
241, 174-183.
Chedea, V.S., Braicu, C. and Socaciu, C., 2010. Antioxidant/prooxidant activity of a polyphenolic grape
seed extract. Food Chem 121, 132-139.
Corcuera, L.A., Arbillaga, L., Vettorazzi, A., Azqueta, A. and López de Cerain, A., 2011. Ochratoxin A
reduces aflatoxin B1 induced DNA damage detected by the comet assay in Hep G2 cells. Food Chem Toxicol
49, 2883-2889.
Cos, P., De Bruyne, T., Hermans, N., Apers, S., Berghe, D. and Vlietinck, A., 2004. Proanthocyanidins
in health care: current and new trends. Curr Med Chem 11, 1345-1359.
Costa, S., Utan, A., Cervellati, R., Speroni, E. and Guerra, M.C., 2007. Catechins: natural free-radical
scavengers against ochratoxin A-induced cell damage in a pig kidney cell line (LLC-PK1). Food Chem Toxicol
45, 1910-1917.
Dreosti, I.E., 2000. Antioxidant polyphenols in tea, cocoa, and wine. Nutrition 16, 692-694.
Chapter 4
104
El Golli-Bennour, E., Kouidhi, B., Bouslimi, A., Abid-Essefi, S., Hassen, W. and Bacha, H., 2010.
Cytotoxicity and genotoxicity induced by aflatoxin B1, ochratoxin A, and their combination in cultured Vero
cells. J Biochem Mol Toxicol 24, 42-50.
Hundhausen, C., Bosch-Saadatmandi, C., Augustin, K., Blank, R., Wolffram, S. and Rimbach, G., 2005.
Effect of vitamin E and polyphenols on ochratoxin A-induced cytotoxicity in liver (Hep G2) cells. J Plant
Physiol 162, 818-822.
IARC, 2002. IARC Monographs on the Evaluation of Carcinogenic Risks to Humans. Some Traditional
Herbal Medicines, Some Mycotoxins, Naphthalene and Styrene. 82, 590.
IARC, 1993. IARC Monographs on the Evaluation of Carcinogenic Risks to Humans. Some Naturally
Occurring Substances: Food Items and Constituents, Heterocyclic Aromatic Amines and Mycotoxins. 56, 33.
IARC, 1987. IARC Monographs on the Evaluation of Carcinogenic Risks to Humans. Overall
Evaluations of Carcinogenicity: An Updating of IARC Monographs Volumes 1 to 42. Supplement 7, 440.
Jerez, M., Touriño, S., Sineiro, J., Torres, J.L. and Núñez, M.J., 2007. Procyanidins from pine bark:
Relationships between structure, composition and antiradical activity. Food Chem 104, 518-527.
Kawanishi, S., Oikawa, S. and Murata, M., 2005. Evaluation for safety of antioxidant chemopreventive
agents. Antiox Redox Sign 7, 1728-1739.
Knasmuller, S., Parzefall, W., Sanyal, R., Ecker, S., Schwab, C., Uhl, M., Mersch-Sundermann, V.,
Williamson, G., Hietsch, G., Langer, T., Darroudi, F. and Natarajan, A.T., 1998. Use of metabolically
competent human hepatoma cells for the detection of mutagens and antimutagens. Mutat Res 402, 185-202.
Kwik-Uribe, C. and Bektash, R., 2008. Cocoa flavanols - measurement, bioavailability and bioactivity.
Asia Pac J Clin Nutr 17 Suppl 1, 280-283.
Laurent and Rios, 2003. Chocolate intake increases urinary excretion of polyphenol-derived phenolic
acids in healthy human subjects. Am J Clin Nutr 77.
Lee, S.E., Campbell, B.C., Molyneux, R.J., Hasegawa, S. and Lee, H.S., 2001. Inhibitory effects of
naturally occurring compounds on aflatoxin B(1) biotransformation. J Agric Food Chem 49, 5171-5177.
Lizárraga, D., Lozano, C., Briedé, J.J., van Delft, J.H., Touriño, S., Centelles, J.J., Torres, J.L. and
Cascante, M., 2007. The importance of polymerization and galloylation for the antiproliferative properties of
procyanidin-rich natural extracts. FEBS J 274, 4802-4811.
PECE reduces free radicals in vitro
105
Mally, A. and Dekant, W., 2005. DNA adduct formation by ochratoxin A: review of the available
evidence. Food Addit Contam 22 Suppl 1, 65-74.
Mally, A., Pepe, G., Ravoori, S., Fiore, M., Gupta, R.C., Dekant, W. and Mosesso, P., 2005. Ochratoxin
a causes DNA damage and cytogenetic effects but no DNA adducts in rats. Chem Res Toxicol 18, 1253-1261.
Mally, A., Zepnik, H., Wanek, P., Eder, E., Dingley, K., Ihmels, H., Volkel, W. and Dekant, W., 2004.
Ochratoxin A: lack of formation of covalent DNA adducts. Chem Res Toxicol 17, 234-242.
McLean, M. and Dutton, M.F., 1995. Cellular interactions and metabolism of aflatoxin: An update.
Pharmac Ther 65, 163-192.
Mosmann, T., 1983. Rapid colorimetric assay for cellular growth and survival: application to
proliferation and cytotoxicity assays. J Immunol Methods 65, 55-63.
Muto, S., Fujita, K., Yamazaki, Y. and Kamataki, T., 2001. Inhibition by green tea catechins of
metabolic activation of procarcinogens by human cytochrome P450. Mutat Res 479, 197-206.
Nazaruddin, R., Seng, L.K., Hassan, O. and Said, M., 2006. Effect of pulp preconditioning on the
content of polyphenols in cocoa beans (Theobroma Cacao) during fermentation. Ind Crops Prod 24, 87-94.
Osman, H., Nasarudin, R. and Lee, S.L., 2004. Extracts of cocoa (Theobroma cacao L.) leaves and their
antioxidation potential. Food Chem 86, 41-46.
Otto, M., Hansen, S.H., Dalgaard, L., Dubois, J. and Badolo, L., 2008. Development of an in vitro assay
for the investigation of metabolism-induced drug hepatotoxicity. Cell Biol Toxicol 24, 87-99.
Ringot, D., Chango, A., Schneider, Y.J. and Larondelle, Y., 2006. Toxicokinetics and toxicodynamics of
ochratoxin A, an update. Chem Biol Interact 159, 18-46.
Rodríguez-Ramiro, I., Ramos, S., Bravo, L., Goya, L. and Martín, M., 2011. Procyanidin B2 and a cocoa
polyphenolic extract inhibit acrylamide-induced apoptosis in human Caco-2 cells by preventing oxidative stress
and activation of JNK pathway. J. Nutr. Biochem. doi:10.1016/j.jnutbio.2010.10.005.
Saura-Calixto, F., Serrano, J. and Goñi, I., 2007. Intake and bioaccessibility of total polyphenols in a
whole diet. Food Chem 101, 492-501.
Scalbert, A., Morand, C., Manach, C. and Rémésy, C., 2002. Absorption and metabolism of polyphenols
in the gut and impact on health. Biomed Pharmacother 56, 276-282.

Chapter 4
106
Sedmíková, M., Reisnerová, H., Dufková, Z., Bárta, I. and Jílek, F., 2001. Potential Hazard of
simultaneous occurrence of aflatoxin B1 and ochratoxin A. Vet Med 46, 169-174.
Spencer, 2000. Decomposition of Cocoa Procyanidins in the Gastric Milieu. Biochem Biophys Res
Commun 272.
Torres, J.L., Carreras, A., Jiménez, A., Brillas, E., Torrelles, X., Rius, J. and Juliá, L., 2007. Reducing
Power of Simple Polyphenols by Electron-Transfer Reactions Using a New Stable Radical of the PTM Series,
Tris(2,3,5,6-tetrachloro-4-nitrophenyl)methyl Radical. J Org Chem 72, 3750-3756.
Torres, J.L., Varela, B., Brillas, E. and Juliá, L., 2003. Tris(2,4,6-trichloro-3,5-dinitrophenyl)methyl
radical: a new stable coloured magnetic species as a chemosensor for natural polyphenols. Chem Comm 1, 74-
75.
Torres, J.L. and Bobet, R., 2001. New Flavanol Derivatives from Grape (Vitis vinifera) Byproducts.
Antioxidant Aminoethylthioa-flavan-3-ol Conjugates from a Polymeric Waste Fraction Used as a Source of
Flavanols. J Agric Food Chem 49, 4627-4634.
Touriño, S., Pérez-Jiménez, J., Mateos-Martín, M.L., Fuguet, E., Vinardel, M.P., Cascante, M. and
Torres, J.L., 2011. Metabolites in Contact with the Rat Digestive Tract after Ingestion of a Phenolic-Rich
Dietary Fiber Matrix. J Agric Food Chem 59, 5955-5963.
Touriño, S., Lizárraga, D., Carreras, A., Lorenzo, S., Ugartondo, V., Mitjans, M., Vinardell, M., Juliá, L.,
Cascante, M. and Torres, J.L., 2008. Highly galloylated tannin fractions from witch hazel (Hamamelis
virginiana) bark: electron transfer capacity, in vitro antioxidant activity, and effects on skin-related cells. Chem
Res Toxicol 21, 696-704.
Torres, J. and Selga, A., 2003. Procyanidin size and composition by thiolysis with cysteamine
hydrochloride and chromatography. Chromatographia 57, 441-445.
Touriño, S., Selga, A., Jiménez, A., Juliá, L., Lozano, C., Lizárraga, D., Cascante, M. and Torres, J.L.,
2005. Procyanidin fractions from pine (Pinus pinaster) bark: radical scavenging power in solution, antioxidant
activity in emulsion, and antiproliferative effect in melanoma cells. J Agric Food Chem 53, 4728-4735.
Turesky, R.J., 2005. Perspective: ochratoxin A is not a genotoxic carcinogen. Chem Res Toxicol 18,
1082-1090.
PECE reduces free radicals in vitro
107
Ugartondo, V., Mitjans, M., Touriño, S., Torres, J.L. and Vinardell, M., 2007. Comparative antioxidant
and cytotoxic effect of procyanidin fractions from grape and pine. Chem Res Toxicol 20, 1543-1548.
Urpí-Sardá, M., Monagas, M., Khan, N., Lamuela-Raventos, R.M., Santos-Buelga, C., Sacanella, E.,
Castell, M., Permanyer, J., and Andres-Lacueva,C., 2009. Epicatechin, procyanidins, and phenolic microbial
metabolites after cocoa intake in humans and rats. Anal Bioanal Chem 394, 1545-1556.
Wang, H. and Joseph, J.A., 1999. Quantifying cellular oxidative stress by dichlorofluorescein assay using
microplate reader. Free Radic Biol Med 27, 612-616.
Wollgast, J. and Anklam, E., 2000. Review on polyphenols in Theobroma cacao: changes in
composition during the manufacture of chocolate and methodology for identification and quantification. Food
Res Int. 33, 423-447.


Validation of a UHPLC-FLD analytical method for the simultaneous quantification of aflatoxin
B1 and ochratoxin A in rat plasma, liver and kidney
Chapter 5
Laura-Ana Corcuera, María Ibáñez-Vea, Ariane Vettorazzi, Elena González-Peñas,
Adela López de Cerain
Journal of Chromatography B, 879 (2011) 2733–2740

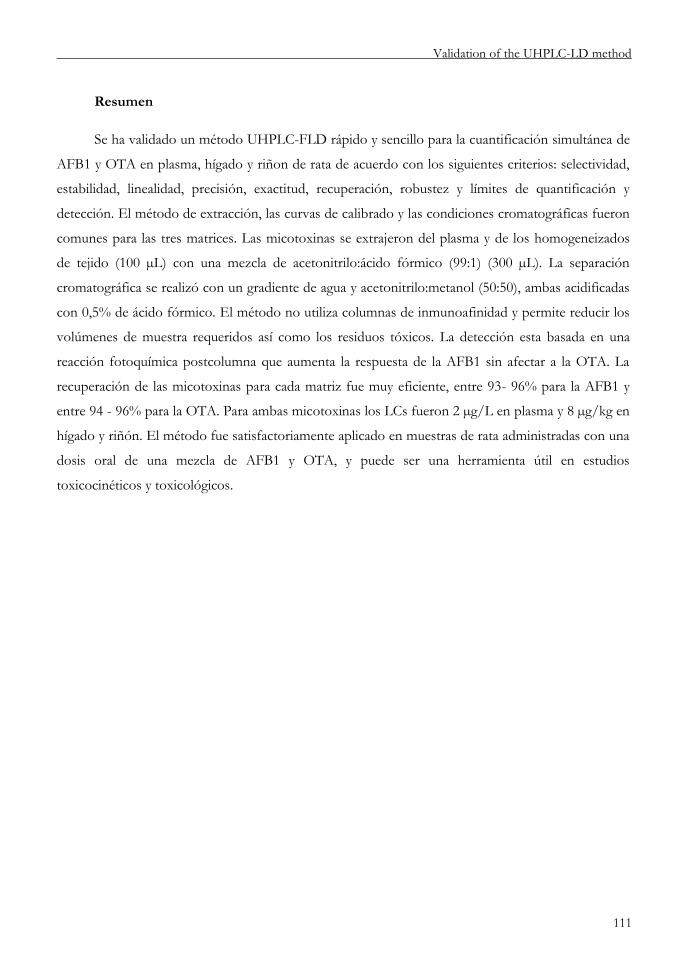
Validation of the UHPLC-LD method
111
Resumen
Se ha validado un método UHPLC-FLD rápido y sencillo para la cuantificación simultánea de
AFB1 y OTA en plasma, hígado y riñon de rata de acuerdo con los siguientes criterios: selectividad,
estabilidad, linealidad, precisión, exactitud, recuperación, robustez y límites de quantificación y
detección. El método de extracción, las curvas de calibrado y las condiciones cromatográficas fueron
comunes para las tres matrices. Las micotoxinas se extrajeron del plasma y de los homogeneizados
de tejido (100 µL) con una mezcla de acetonitrilo:ácido fórmico (99:1) (300 µL). La separación
cromatográfica se realizó con un gradiente de agua y acetonitrilo:metanol (50:50), ambas acidificadas
con 0,5% de ácido fórmico. El método no utiliza columnas de inmunoafinidad y permite reducir los
volúmenes de muestra requeridos así como los residuos tóxicos. La detección esta basada en una
reacción fotoquímica postcolumna que aumenta la respuesta de la AFB1 sin afectar a la OTA. La
recuperación de las micotoxinas para cada matriz fue muy eficiente, entre 93- 96% para la AFB1 y
entre 94 - 96% para la OTA. Para ambas micotoxinas los LCs fueron 2 µg/L en plasma y 8 µg/kg en
hígado y riñón. El método fue satisfactoriamente aplicado en muestras de rata administradas con una
dosis oral de una mezcla de AFB1 y OTA, y puede ser una herramienta útil en estudios
toxicocinéticos y toxicológicos.

Chapter 5
112
Abstract
A rapid and simple method for the simultaneous quantification of AFB1 and OTA in rat
plasma, liver and kidney by UHPLC-FLD has been successfully validated according to the following
criteria: selectivity, stability, linearity, precision, accuracy, recovery, robustness and limits of
quantification and detection. The extraction method, calibration curves and chromatographic
conditions are common for the three matrices. Plasma and homogenized tissue samples (100 µL)
were extracted with acetonitrile-formic acid mixture (99:1) (300 µL). Chromatographic separation
was performed with a mixture of water and acetonitrile:methanol (50:50), both acidified with 0.5% of
formic acid using a gradient profile. The method avoids the use of immunoaffinity columns and
allows reduction of sample and solvent volumes as well as toxic wastes. The detection is based on a
photochemical reaction which enhances the AFB1 response without affecting the OTA signal before
reaching the fluorescent detector. The mycotoxin recovery for each matrix was very efficient,
between 93 - 96% for AFB1 and between 94- 96% for OTA. For both mycotoxins the LOQs were
2 µg/L in plasma and 8 µg/kg in liver and kidney. The method has successfully been applied to rat
samples after a single oral administration of a mixture of AFB1 and OTA and it could be a useful
tool in toxicokinetic and toxicological studies.
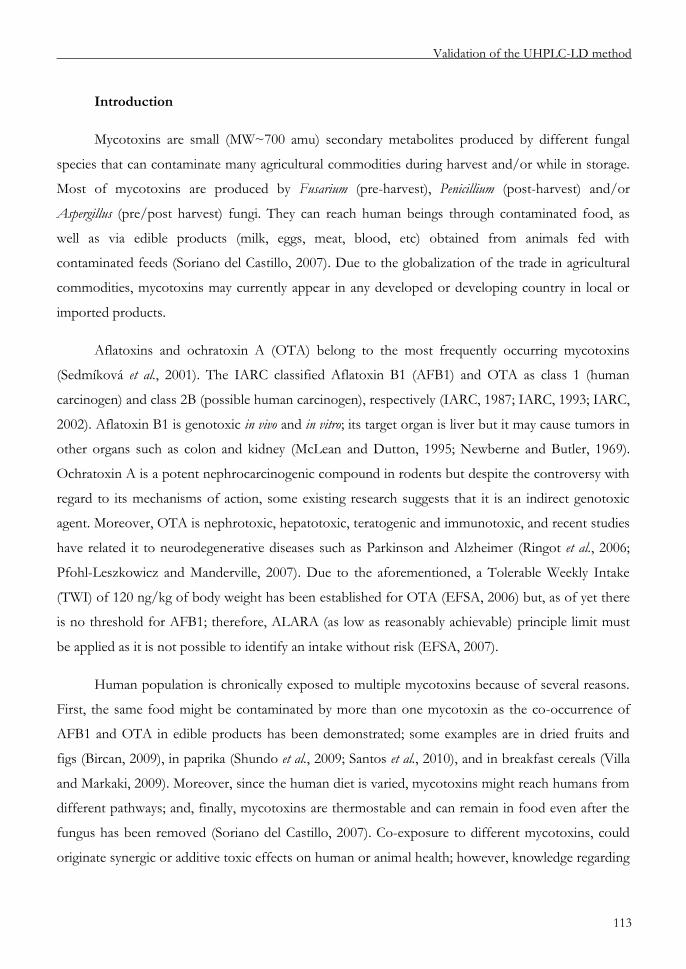
Validation of the UHPLC-LD method
113
Introduction
Mycotoxins are small (MW~700 amu) secondary metabolites produced by different fungal
species that can contaminate many agricultural commodities during harvest and/or while in storage.
Most of mycotoxins are produced by Fusarium (pre-harvest), Penicillium (post-harvest) and/or
Aspergillus (pre/post harvest) fungi. They can reach human beings through contaminated food, as
well as via edible products (milk, eggs, meat, blood, etc) obtained from animals fed with
contaminated feeds (Soriano del Castillo, 2007). Due to the globalization of the trade in agricultural
commodities, mycotoxins may currently appear in any developed or developing country in local or
imported products.
Aflatoxins and ochratoxin A (OTA) belong to the most frequently occurring mycotoxins
(Sedmíková et al., 2001). The IARC classified Aflatoxin B1 (AFB1) and OTA as class 1 (human
carcinogen) and class 2B (possible human carcinogen), respectively (IARC, 1987; IARC, 1993; IARC,
2002). Aflatoxin B1 is genotoxic in vivo and in vitro; its target organ is liver but it may cause tumors in
other organs such as colon and kidney (McLean and Dutton, 1995; Newberne and Butler, 1969).
Ochratoxin A is a potent nephrocarcinogenic compound in rodents but despite the controversy with
regard to its mechanisms of action, some existing research suggests that it is an indirect genotoxic
agent. Moreover, OTA is nephrotoxic, hepatotoxic, teratogenic and immunotoxic, and recent studies
have related it to neurodegenerative diseases such as Parkinson and Alzheimer (Ringot et al., 2006;
Pfohl-Leszkowicz and Manderville, 2007). Due to the aforementioned, a Tolerable Weekly Intake
(TWI) of 120 ng/kg of body weight has been established for OTA (EFSA, 2006) but, as of yet there
is no threshold for AFB1; therefore, ALARA (as low as reasonably achievable) principle limit must
be applied as it is not possible to identify an intake without risk (EFSA, 2007).
Human population is chronically exposed to multiple mycotoxins because of several reasons.
First, the same food might be contaminated by more than one mycotoxin as the co-occurrence of
AFB1 and OTA in edible products has been demonstrated; some examples are in dried fruits and
figs (Bircan, 2009), in paprika (Shundo et al., 2009; Santos et al., 2010), and in breakfast cereals (Villa
and Markaki, 2009). Moreover, since the human diet is varied, mycotoxins might reach humans from
different pathways; and, finally, mycotoxins are thermostable and can remain in food even after the
fungus has been removed (Soriano del Castillo, 2007). Co-exposure to different mycotoxins, could
originate synergic or additive toxic effects on human or animal health; however, knowledge regarding

Chapter 5
114
this aspect or regarding the influence of co-ocurrence on toxicokinetic or toxicological characteristics
of the mycotoxins is still scarce.
Reference literature reports numerous methods for individual quantification of AFB1 or
OTA, most of which are applied to foodstuffs, but also applied to animal matrices such as poultry
(Gregory III et al., 1983), fish meat (Papp et al., 2002), eggs (Herzallah, 2009), milk (Herzallah, 2009;
Valenta, 1998), swine (De Saeger et al., 2004), and meat and meat products (Herzallah, 2009; Valenta,
1998). Nevertheless, very few of these studies are suitable for application in complex biological
samples and/or during toxicological studies because they use large volumes of sample, which is not
easily available when working with laboratory animals. Moreover, most of these studies do not report
validation data, which is very important so as to provide evidence of the reliability of the results
(Bressolle et al., 1996).
The development and validation of methods for the simultaneous determination of the most
important mycotoxins in biological matrices would be very useful because they would be adequate
tools for toxicokinetic and toxicology studies that investigate the effects of co-exposure, minimizing
the cost of the analysis and the use of laboratory animals.
In this paper, a UHPLC-FLD method with simultaneous extraction and analytical
quantification procedures for AFB1 and OTA and in rat plasma, kidney and liver has been validated
and successfully applied in biological samples, demonstrating its usefulness for toxicological or
toxicokinetic studies.
Materials and methods
Safety precautions
Aflatoxin B1 and ochratoxin A are toxic substances. They were always manipulated in
solution, avoiding the formation of dust and aerosols. Nitrile gloves were used for all procedures
carried out and during the manipulation of treated animals or contaminated samples FPP3 masks
were used.
Reagents
For the analytical standards, AFB1 was purchased as a solution of 2 mg/L in acetonitrile
(ACN) and OTA was purchased as a solution of 10 mg/L in ACN, both from OEKANAL® Fluka

Validation of the UHPLC-LD method
115
(Schnelldorf, Germany) as certified reference materials. For oral administration, mycotoxins were
purchased in powder from Sigma (Steinheim, Germany) and they were dissolved in 0.1 M NaHCO3
(Riedel-de Haën, Seelze, Germany), adjusted to pH 7.4 with HCl and maintained at -20ºC until their
use. For the tissue homogenates, sodium phosphate buffer (0.05 M, pH 6.50) was prepared by
adding 6.90 g of NaH2PO4.H2O (Merck, Darmstadt, Germany) to 900 mL of type II water. The pH
of the dissolution was adjusted to 6.5 with NaOH (Agilent technologies, Waldbronn, Germany) and
the volume was adjusted to 1 L. All reagents used for the HPLC analysis were of analytical grade.
ACN and methanol (MeOH) HPLC grade and formic acid were obtained from Sigma Aldrich (St.
Quentin Fallavier, France). Millipore type I water was obtained daily from a Milli-Q water-purifying
system (Millipore, Bedford, MA, USA).
Standard solutions
Working standard solutions (mixture of AFB1 and OTA) were prepared by appropriate
dilution of the commercial standards with ACN and MeOH to a proportion of 50:50 v/v. Four
working solutions were prepared (750, 300, 30 and 3 µg/L of AFB1 and OTA) and stored at -20ºC.
The calibration standards were prepared by evaporating volumes of working standard solutions (after
being kept at room temperature during 30 min) under a stream of nitrogen and then the residues
were dissolved in 200 µL of mobile phase. The calibration standards were kept in the injection tray at
4ºC without illumination until analysis.
Animals
The in vivo experiments were approved by the Ethics Committee on Animal Experimentation
of the University of Navarra.
Ten-week-old male and female Fisher 344 (F344) rats, purchased from Harlan (Horst, The
Netherlands), were used. On the day of arrival, the animals were weighed (weight variation did not
exceed ± 20% (OECD, 1984; OECD, 2009)) and then distributed to polycarbonate cages with
stainless steel covers for one week in order to allow acclimatization to the environmental conditions:
12 h day/night cycle, temperature 22 ± 2ºC, relative humidity 55 ± 10%, standard diet (Harlan
Iberica, Spain) and water ad libitum.
Plasma, kidney and liver used as blank samples for the validation of the method were obtained
from 12 non-treated animals (6 male and 6 female). In the application of the method, two male rats
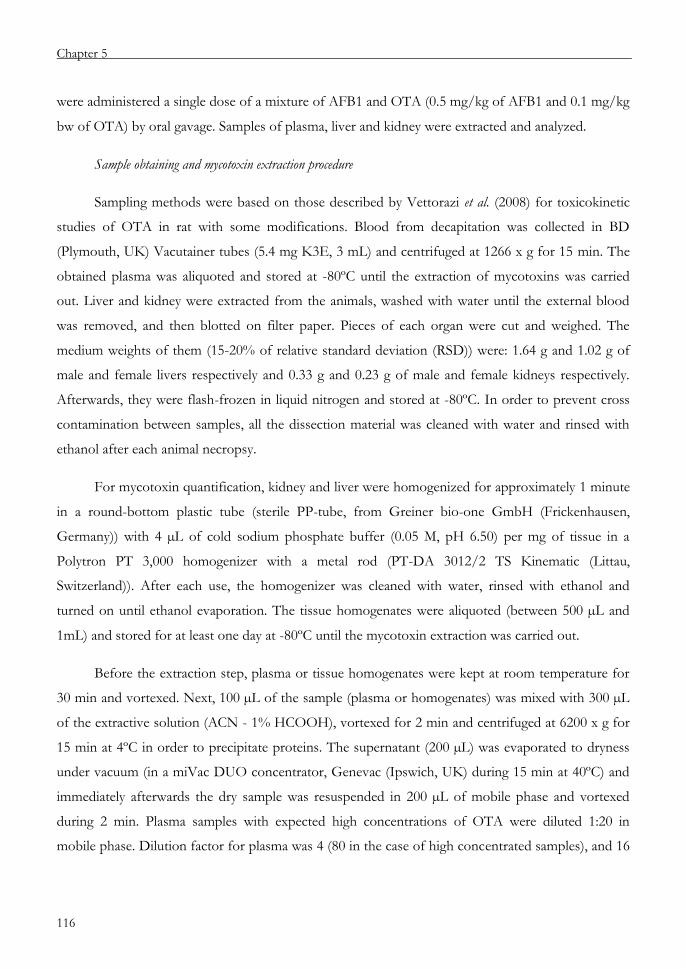
Chapter 5
116
were administered a single dose of a mixture of AFB1 and OTA (0.5 mg/kg of AFB1 and 0.1 mg/kg
bw of OTA) by oral gavage. Samples of plasma, liver and kidney were extracted and analyzed.
Sample obtaining and mycotoxin extraction procedure
Sampling methods were based on those described by Vettorazi et al. (2008) for toxicokinetic
studies of OTA in rat with some modifications. Blood from decapitation was collected in BD
(Plymouth, UK) Vacutainer tubes (5.4 mg K3E, 3 mL) and centrifuged at 1266 x g for 15 min. The
obtained plasma was aliquoted and stored at -80ºC until the extraction of mycotoxins was carried
out. Liver and kidney were extracted from the animals, washed with water until the external blood
was removed, and then blotted on filter paper. Pieces of each organ were cut and weighed. The
medium weights of them (15-20% of relative standard deviation (RSD)) were: 1.64 g and 1.02 g of
male and female livers respectively and 0.33 g and 0.23 g of male and female kidneys respectively.
Afterwards, they were flash-frozen in liquid nitrogen and stored at -80ºC. In order to prevent cross
contamination between samples, all the dissection material was cleaned with water and rinsed with
ethanol after each animal necropsy.
For mycotoxin quantification, kidney and liver were homogenized for approximately 1 minute
in a round-bottom plastic tube (sterile PP-tube, from Greiner bio-one GmbH (Frickenhausen,
Germany)) with 4 µL of cold sodium phosphate buffer (0.05 M, pH 6.50) per mg of tissue in a
Polytron PT 3,000 homogenizer with a metal rod (PT-DA 3012/2 TS Kinematic (Littau,
Switzerland)). After each use, the homogenizer was cleaned with water, rinsed with ethanol and
turned on until ethanol evaporation. The tissue homogenates were aliquoted (between 500 µL and
1mL) and stored for at least one day at -80ºC until the mycotoxin extraction was carried out.
Before the extraction step, plasma or tissue homogenates were kept at room temperature for
30 min and vortexed. Next, 100 µL of the sample (plasma or homogenates) was mixed with 300 µL
of the extractive solution (ACN - 1% HCOOH), vortexed for 2 min and centrifuged at 6200 x g for
15 min at 4ºC in order to precipitate proteins. The supernatant (200 µL) was evaporated to dryness
under vacuum (in a miVac DUO concentrator, Genevac (Ipswich, UK) during 15 min at 40ºC) and
immediately afterwards the dry sample was resuspended in 200 µL of mobile phase and vortexed
during 2 min. Plasma samples with expected high concentrations of OTA were diluted 1:20 in
mobile phase. Dilution factor for plasma was 4 (80 in the case of high concentrated samples), and 16

Validation of the UHPLC-LD method
117
for kidney and liver. The pH attained in the extraction step was approximately 2.6. Samples were
filtered and placed in vials in the HPLC tray at 4ºC in darkness until injection
Apparatus and chromatographic conditions
UHPLC analyses were performed with an Agilent Technologies 1200 liquid chromatographic
system equipped with a fluorescence detector (G1321A model) controlled by ChemStation B.03.02
software (Hewlett-Packard). Mycotoxins were separated on an Ascentis® Express C18 column
(150 mm x 2.1 mm; 2.7 µm) from Supelco (PA, USA). The mobile phase was a mixture of an organic
phase (A) (MeOH-ACN, 50:50, v/v) and water (B), both acidified with 0.5% of formic acid. The
injection volume was 40 µL and the flow rate was 0.9 mL/min. Chromatography was performed at
60ºC. Proportion of both organic and aqueous phases was switching between isocratic and gradient
profiles during the entire analysis procedure. The elution program starts isocratic until minute 2.4
with 30% of A, then from 2.4 to 2.5 min the organic phase increases up to 43%, from minute 2.5 to
8.3 min another isocratic profile at 43% of A, from minute 8.3 to 10.0 there is a last increase up to
65% of A and finally, from minute 10.0 the system returns to 30% of A to restore the starting
conditions during 5 min. The retention times under these conditions were 2.5 min for AFB1 and
8.4 min for OTA. Before the sample entered the fluorescence detection cell, a photoderivatization
device (AURA Industries, NY, USA) with a mercury lamp (λ = 254 nm) and a knitted reactor coil of
0.25 mL (5 m x 0.25 mm) was included. During the first 4 min of analysis, fluorescence conditions
were optimized for AFB1 (excitation 366 nm and emission 433 nm wavelengths), and after that for
OTA (excitation 225 nm and emission 461 nm wavelengths)
The chromatographic separation was evaluated for each matrix at the limit of quantification
level using the following parameters: retention time (tR,) retention factor (k'), symmetry, peak width
at half height (wh), number of theoretical plates (N) and resolution (Rs).
Validation of the UHPLC-FLD method
The analytical method was validated for each mycotoxin according to the following method
performance characteristics: selectivity, stability, linearity, precision and accuracy (within- and
between-day variability), recovery (in intermediate precision conditions), limits of detection (LOD)
and quantification (LOQ), and robustness. Selectivity, LOD, LOQ, recovery and stability were
studied for each matrix. For this purpose, a pool of blank samples of plasma, kidney or liver
obtained from 12 animals (6 male and 6 female) was used.

Chapter 5
118
Selectivity of the method was improved by using a photochemical reactor (PHRED) before a
fluorescence detector with blank plasma and tissue homogenates. However, the ability of the method
to distinguish AFB1 and OTA from other endogenous components was evaluated for the 3 matrices
by analyzing and comparing blank samples before and after being spiked with the mycotoxins at
LOQ levels. Moreover, due to the fact that OTA basal levels were detected in plasma, samples that
are naturally contaminated with OTA were analyzed and afterwards spiked with a standard solution
in order to see an increase of the area of the corresponding peak. In addition, in both cases (naturally
contaminated and spiked) the samples were reanalyzed after changing the % of organic component
in the mobile phase in order to delay OTA peak and therefore be able to observe the presence or
absence of broadening, shoulders or others interfering peaks.
The stability of mycotoxins was determined in the working solution, during storage of samples
at -80ºC and in the chromatograph tray before analysis at 4ºC. Three concentrations of working
solutions (1, 10 and 100 µg/L) stored at -20ºC were analyzed during 8 weeks. Mycotoxin stability in
the HPLC chromatographic tray was evaluated for the three matrices by analyzing the extracts of
spiked samples (40 µg/L plasma and 160 µg/kg liver/kidney) just after preparation and over a period
of 15 h. Moreover, the stability of mycotoxins in plasma and in tissue homogenates stored at -80ºC
has also been determined by analyzing spiked samples (40 µg/L plasma and 160 µg/kg liver/kidney)
24 h, 1 week, 1 month and 6 months after preparation.
For each mycotoxin, two calibration curves were plotted from 0.5 up to 150 µg/L using
calibration standards. The range was split into two: a low calibration curve from 0.5 to 30 µg/L, with
eight data points; and a high calibration curve from 30 to 150 µg/L with six data points. Three
replicates of each calibration standard were analyzed. Within- and between-day precision and
accuracy of the linearity were studied by analyzing three replicate calibrations standards at 0.5, 2, 15,
30, 90 and 150 µg/L on one day (within-day) and on three different days (between-day).
Due to the fact that adequate reference biological spiked materials were not available,
fortification was carried out with known concentrations of mycotoxins in order to establish the
recovery and precision of the method. AFB1 and OTA were added to blank plasma, liver or kidney
homogenate pools in order to obtain 2, 8, 120, 600 µg/L in plasma, and 8, 32, 480, 2,400 µg/kg in
organs, in triplicate. The corresponding volume of the working standard was evaporated under a
stream of nitrogen and resuspended in 100 µL of blank plasma, kidney or liver homogenate by
mixing in vortex for 2 min. Mycotoxins were then extracted as described in section 2.4 and then
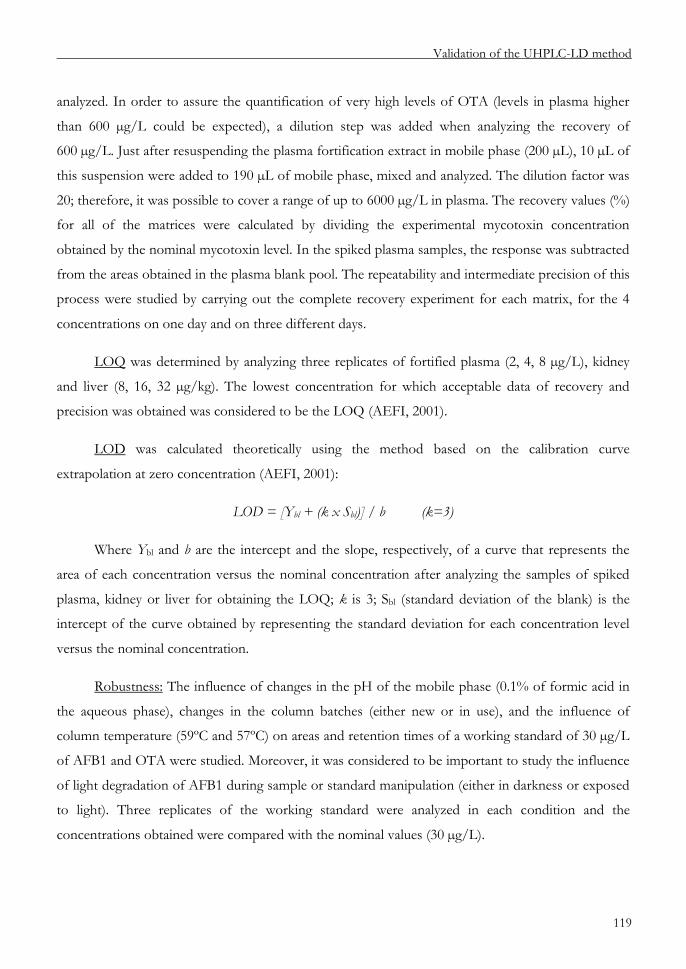
Validation of the UHPLC-LD method
119
analyzed. In order to assure the quantification of very high levels of OTA (levels in plasma higher
than 600 µg/L could be expected), a dilution step was added when analyzing the recovery of
600 µg/L. Just after resuspending the plasma fortification extract in mobile phase (200 µL), 10 µL of
this suspension were added to 190 µL of mobile phase, mixed and analyzed. The dilution factor was
20; therefore, it was possible to cover a range of up to 6000 µg/L in plasma. The recovery values (%)
for all of the matrices were calculated by dividing the experimental mycotoxin concentration
obtained by the nominal mycotoxin level. In the spiked plasma samples, the response was subtracted
from the areas obtained in the plasma blank pool. The repeatability and intermediate precision of this
process were studied by carrying out the complete recovery experiment for each matrix, for the 4
concentrations on one day and on three different days.
LOQ was determined by analyzing three replicates of fortified plasma (2, 4, 8 µg/L), kidney
and liver (8, 16, 32 µg/kg). The lowest concentration for which acceptable data of recovery and
precision was obtained was considered to be the LOQ (AEFI, 2001).
LOD was calculated theoretically using the method based on the calibration curve
extrapolation at zero concentration (AEFI, 2001):
LOD = [Ybl + (k x Sbl)] / b (k=3)
Where Ybl and b are the intercept and the slope, respectively, of a curve that represents the
area of each concentration versus the nominal concentration after analyzing the samples of spiked
plasma, kidney or liver for obtaining the LOQ; k is 3; Sbl (standard deviation of the blank) is the
intercept of the curve obtained by representing the standard deviation for each concentration level
versus the nominal concentration.
Robustness: The influence of changes in the pH of the mobile phase (0.1% of formic acid in
the aqueous phase), changes in the column batches (either new or in use), and the influence of
column temperature (59ºC and 57ºC) on areas and retention times of a working standard of 30 µg/L
of AFB1 and OTA were studied. Moreover, it was considered to be important to study the influence
of light degradation of AFB1 during sample or standard manipulation (either in darkness or exposed
to light). Three replicates of the working standard were analyzed in each condition and the
concentrations obtained were compared with the nominal values (30 µg/L).

Chapter 5
120
The acceptance/rejection criterions used were:
- Stability: peak areas ± 10% of the peak areas obtained just after sample preparation (0 h).
- Linearity: the determination coefficient (r2) higher than 0.990, the slope interval not having
to include zero (p≤0.05) and the intercept interval having to include zero (p≤0.05), the
representation of residuals versus the estimated values having to rise to a distribution of the
points at random and not having to reflect any trend, and the RSD (relative standard
deviation) between response factors lower than 10%. ± 10% RSD and ±10% standard error
of the mean (SE) for all the concentrations excepting the lower one, which is the limit of
quantification, and whose accepted accuracy and precision was within ±15%.
- Recovery: ± 10% RSD in repeatability and intermediate precision conditions.
- Robustness: ±10% of standard error of the mean (SE).
Results and discussion
Up to now, many OTA determination studies have been performed on different biological
samples and animal species using a wide variety of techniques (Ringot et al., 2006; Vettorazzi et al.,
2008; Mantle, 2008; Zepnik et al., 2003; Vettorazzi et al., 2009; Zöllner and Mayer-Helm, 2006).
However, there is a lack of modern techniques (LC/MS and HPLC) for studying the presence of
AFB1 in body fluids or tissues, and most of the methods were initially limited to their use in food
matrices (Herzallah, 2009; Siraj et al., 1981), although later they were modified for their application to
toxicological studies. Moreover, no validated UHPLC-FLD methods for simultaneous determination
of OTA and AFB1 in plasma, kidney and liver have been previously described in laboratory animals,
in spite of the fact that these methods would be of great interest for toxicological or toxicokinetic
studies of mycotoxins.
Sample obtaining and mycotoxin extraction and cleanup.
For aflatoxins determination, chromatographic methods described by Siraj et al. (1981),
Gregory (1982), Lamplugh (1983a,b) were not suitable for toxicological studies conducted with small
animals. Coulombe and Sharma (1985) and Wong and Hsieh (1981) among others, used radioactivity
quantification methods in order to achieve enough sensitivity and recovery for the tiny samples that
are generated during toxicological studies. Plakas et al. (1991) combined HPLC quantification with

Validation of the UHPLC-LD method
121
14C-labeled AFB1 detection. In the case of OTA, Vettorazzi et al. (2008) validated a method
successfully applied in a study of OTA toxicokinetics in rats (Vettorazzi et al., 2009).
The sampling method has been inspired in the work described by Vettorazzi et al. (2008) for
detecting OTA in plasma, liver and kidney of rats. OTA was extracted from the matrix with an
organic solvent (ethanol) in very acid conditions using trichloroacetic acid (TCA). Unfortunately, this
extraction process was not suitable for the simultaneous extraction of AFB1 and OTA because the
pH conditions were too low for the AFB1 stability and because TCA, a trihaloacetic acid such as
TFA (used for AFB1 derivatization (Lamplugh, 1983b; Kok, 1994), gives undesired chemical
reactions. On the other hand, mycotoxins bind proteins (Newberne and Butler, 1969; Ringot et al.,
2006; Urrego Novoa and Díaz, 2006) and the extraction step needs low pH conditions to release
OTA and AFB1 and to precipitate the proteins (Valenta, 1998). In addition, ACN obtained clearer
extracts than ethanol in preliminary studies. Therefore, proteins from samples were precipitated with
acidified ACN (1:3 ratio). Combinations of ACN-HCOOH (10%, pH 2.62 and 1%, pH 2.63), ACN-
H3PO4 (1%, pH 2.72 and 0.5%, pH 2.84) and ACN-HCl (0.05%, pH 2.59) were assayed. After
analysis of the resulting extracts, ACN-HCOOH 1% yielded clean enough extracts and recovery
values over 90% for both mycotoxins in the three matrices.
With the procedure described, the simultaneous extraction of both mycotoxins has been
achieved only starting from 100 µL of plasma or 25 mg of tissue and covering a range of 2-6000
µg/L in rat plasma and 8-2,400 µg/L in rat kidney and liver. Only one solvent step extraction is
needed, avoiding immunoaffinity column clean up and toxic solvents such as chloroform, ethyl
acetate or dichloromethane which cause health and environmental hazards.
Development of the UHPLC-FLD quantitative analytical method
Chromatographic conditions were investigated in order to achieve the best separation and
resolution of peaks so as to allow quantification. The method starts with an isocratic set which
permits the elution of the polar components extracted with the mycotoxins. Due to its polar
properties, AFB1 appears early in the chromatogram. The front peaks corresponding to liver and
kidney matrices are larger than those corresponding to plasma (figure 1). OTA needs an increase in
the organic proportion of the eluent and it had to be delayed for up to minute 8.4 because several
interfering peaks appear in kidney and liver, something that does not occur with plasma samples.
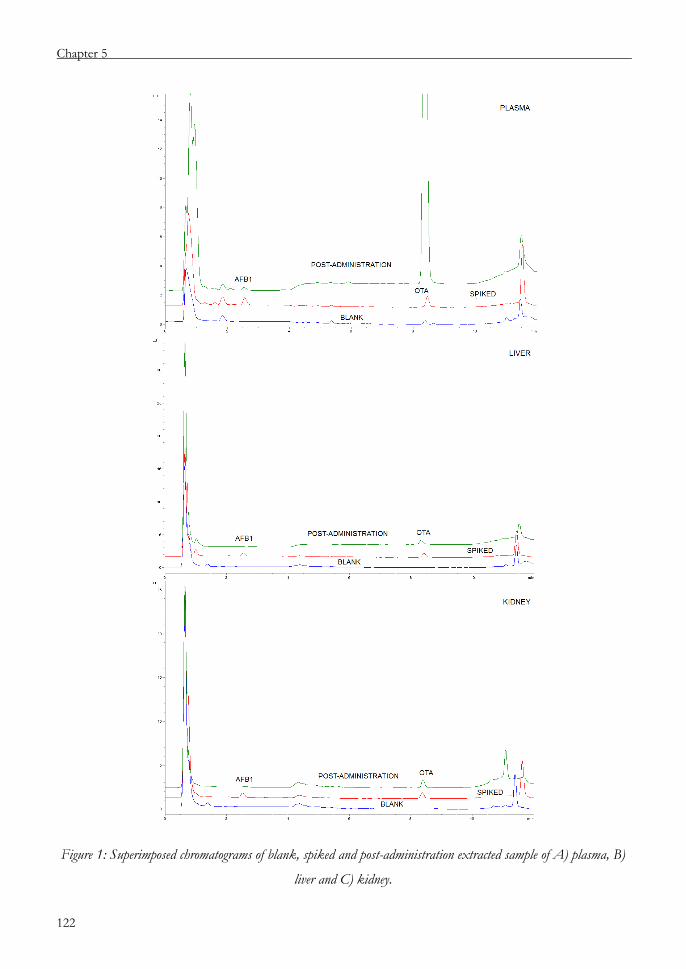
Chapter 5
122
Figure 1: Superimposed chromatograms of blank, spiked and post-administration extracted sample of A) plasma, B)
liver and C) kidney.

Validation of the UHPLC-LD method
123
Aflatoxin B1 and ochratoxin A have fluorescent properties that make them good candidates
for their detection with the use of fluorescence. However, it is well known than AFB1 suffers
quenching in aqueous solvents; therefore, derivatization reactions would be necessary to quantify low
levels. Either pre-column or post-column derivatization could be possible (Kok, 1994; Holcomb et
al., 1992; Joshua, 1993). Pre-column derivatization was initially discarded in order to obtain a simple
and quick method. In addition, post-column iodine or bromine (Kobra cell) derivatization was also
discarded because both reagents need to add extra pumps and chemical reactors to the UHPLC
system. Furthermore, iodine derivatization decreases OTA peak intensity (Kok, 1994). The
derivatization was performed with a photo-chemical reactor made with a knitted coil and a mercury
lamp placed in line just after the column (Joshua, 1993). The PHRED makes derivatization fast and
easy, and minimizes intervention of the analyst. The AFB1 signal is approximately 15 times more
intense with the lamp on while OTA response remains unaffected.
Due to the fact that the same method has been applied for two mycotoxins in three different
matrices, the effect of possible interferences of the matrix at the limit of quantification level has been
studied for each one of them. There were no substantial differences in the chromatographic
parameters for the same mycotoxin in the three matrices (see table 1).
Table 1: Chromatography parameters of AFB1 and OTA obtained at the concentration of the limit of quantification
in plasma, liver or kidney.
Validation of the method
The method was selective for kidney and liver because no interference peaks appeared at the
retention time of AFB1 or OTA in blank samples. In the case of plasma, no interference peaks
appeared at the retention time of AFB1; however, basal OTA levels were detected in blank plasma.
The experiments made in order to assure selectivity for OTA (reanalysis of spiked blank
AFB1 OTA
Plasma Liver Kidney Plasma Liver Kidney
Retention time (tR) (min) 2.54 2.59 2.58 8.38 8.50 8.48
Retention factor (k') 2.45 2.95 3.05 10.38 11.97 12.29
Symmetry 0.77 0.78 0.65 0.94 1.09 0.97
Peak width at half height (wh) 0.13 0.13 0.14 0.11 0.12 0.11
Number of theoretical plates (N) 2099 2115 1935 29631 28867 31130
Resolution (Rs) 3.11 7.61 9.26 21.41 20.58 20.58
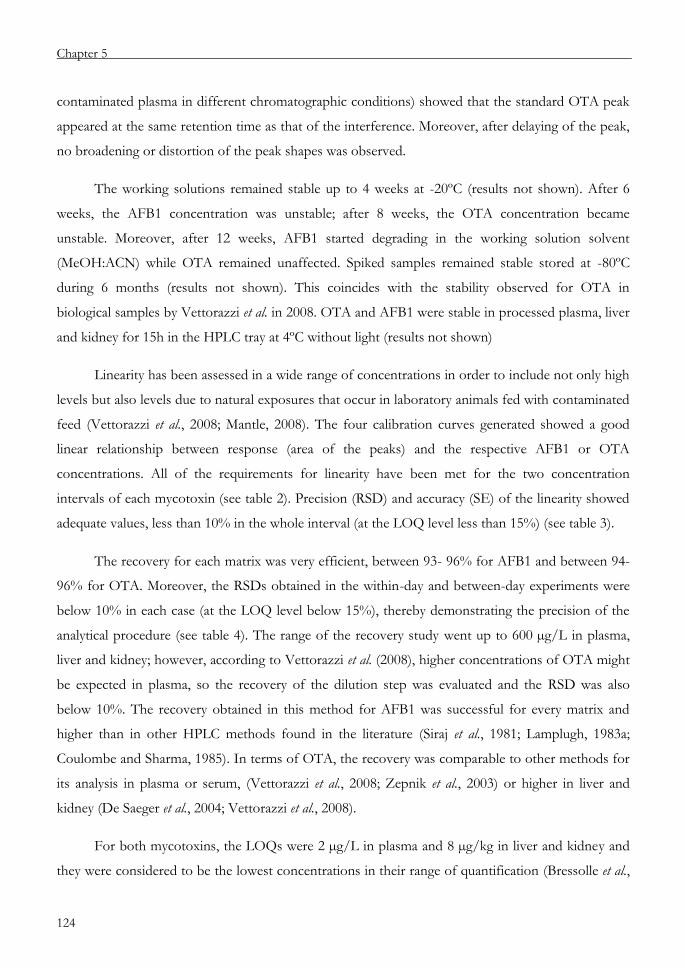
Chapter 5
124
contaminated plasma in different chromatographic conditions) showed that the standard OTA peak
appeared at the same retention time as that of the interference. Moreover, after delaying of the peak,
no broadening or distortion of the peak shapes was observed.
The working solutions remained stable up to 4 weeks at -20ºC (results not shown). After 6
weeks, the AFB1 concentration was unstable; after 8 weeks, the OTA concentration became
unstable. Moreover, after 12 weeks, AFB1 started degrading in the working solution solvent
(MeOH:ACN) while OTA remained unaffected. Spiked samples remained stable stored at -80ºC
during 6 months (results not shown). This coincides with the stability observed for OTA in
biological samples by Vettorazzi et al. in 2008. OTA and AFB1 were stable in processed plasma, liver
and kidney for 15h in the HPLC tray at 4ºC without light (results not shown)
Linearity has been assessed in a wide range of concentrations in order to include not only high
levels but also levels due to natural exposures that occur in laboratory animals fed with contaminated
feed (Vettorazzi et al., 2008; Mantle, 2008). The four calibration curves generated showed a good
linear relationship between response (area of the peaks) and the respective AFB1 or OTA
concentrations. All of the requirements for linearity have been met for the two concentration
intervals of each mycotoxin (see table 2). Precision (RSD) and accuracy (SE) of the linearity showed
adequate values, less than 10% in the whole interval (at the LOQ level less than 15%) (see table 3).
The recovery for each matrix was very efficient, between 93- 96% for AFB1 and between 94-
96% for OTA. Moreover, the RSDs obtained in the within-day and between-day experiments were
below 10% in each case (at the LOQ level below 15%), thereby demonstrating the precision of the
analytical procedure (see table 4). The range of the recovery study went up to 600 µg/L in plasma,
liver and kidney; however, according to Vettorazzi et al. (2008), higher concentrations of OTA might
be expected in plasma, so the recovery of the dilution step was evaluated and the RSD was also
below 10%. The recovery obtained in this method for AFB1 was successful for every matrix and
higher than in other HPLC methods found in the literature (Siraj et al., 1981; Lamplugh, 1983a;
Coulombe and Sharma, 1985). In terms of OTA, the recovery was comparable to other methods for
its analysis in plasma or serum, (Vettorazzi et al., 2008; Zepnik et al., 2003) or higher in liver and
kidney (De Saeger et al., 2004; Vettorazzi et al., 2008).
For both mycotoxins, the LOQs were 2 µg/L in plasma and 8 µg/kg in liver and kidney and
they were considered to be the lowest concentrations in their range of quantification (Bressolle et al.,
Validation of the UHPLC-LD method
125
1996; ICH, 2005). The limits of quantification obtained for AFB1 using the photoderivatization
instrument were satisfactory and better than others found in bibliography for HPLC methods
(Gregory III et al., 1983; Gregory, 1982; Lamplugh, 1983a; Lamplugh, 1983b). They were also
comparable with radioactivity detection that uses very small amounts of sample (Coulombe and
Sharma, 1985; Wong and Hsieh, 1980; Plakas et al., 1991; Kok, 1994; Urrego Novoa and Díaz, 2006;
Marzuki and Norred, 1984). For OTA, quantification limits are comparable to or better than those
of other HPLC methods that use 2-100 times more sample volume (Valenta, 1998; De Saeger et al.,
2004; Vettorazzi et al., 2008). The calculated LODs for AFB1 were as follows: 0.1 µg/L in plasma
and 0.01 µg/kg in kidney and liver; the calculated LODs for OTA were: 0.3 µg/L in plasma and
0.01 µg/kg in kidney and liver.

Tab
le 2
: L
inea
rity
dat
a ca
lcul
ated
with
thre
e re
plic
ates
of ea
ch c
once
ntra
tion
of th
e ra
nge
Tab
le 3
: P
recisi
on a
nd a
ccur
acy
of t
he ins
trum
enta
l sy
stem
Myco
tox
in
Ran
ge
Cu
rve e
qu
ati
on
D
ete
rmin
ati
on
co
eff
icie
nt
(r2 )
Slo
pe l
imit
s In
terc
ep
t li
mit
s R
SD
(%)
resp
on
se
facto
r Sta
nd
ard
(µ
g/L
) P
lasm
a (µ
g/L
) L
iver
/K
idn
ey
(µg/
kg)
AF
B1
0.5
-30
2-1
20
8-4
80
y=2.1
1x+
0.0
6
0.9
988
(2.0
4; 2.1
8)
(-0.9
9; 1.1
0)
2.5
30-1
50
120-6
00
480-2
400
y=2.4
8x-7
.78
0.9
975
(2.3
1; 2.6
5)
(-23.7
2; 8.1
5)
6.1
OT
A
0.5
-30
2-1
20
8-4
80
y=2.5
2x+
0.1
9
0.9
989
(2.4
3; 2.6
0)
(-1.0
1; 1.3
8)
3.5
30-1
50
120-6
00
480-2
400
y=2.9
0x-7
.45
0.9
965
(2.6
6; 3.1
4)
(-29.5
6; 14.6
6)
6.3
Myco
tox
in
Co
ncen
trati
on
(µ
g/
L)
R
ep
eata
bil
ity
(wit
hin
-day)
(n=
3)
In
term
ed
iate
pre
cis
ion
(b
etw
een
-day)
(n=
9)
M
ean
R
SD
(%
) SE
(%
)
Mea
n
RSD
(%
) SE
(%
)
AF
B1
0.5
0
0.4
35
7.3
13.0
0.4
39
5.6
12.2
2.0
2.1
0
4.1
5.3
1.9
8
5.7
1.0
15
14.9
4.0
0.3
16.1
5.9
7.2
30
31.7
6.4
5.8
30.0
6.0
0.0
90
84.7
8.6
5.8
88.9
6.5
1.1
150
147
2.1
1.7
153
3.8
2.4
OT
A
0.5
0
0.4
50
8.6
9.9
0.4
46
7.8
10.8
2.0
2.0
1
2.8
0.6
2.1
8
6.5
9.2
15
14.5
3.5
3.6
15.7
6.3
4.6
30
31.1
6.3
3.7
29.6
5.9
1.2
90
87.1
8.3
3.2
91.2
6.9
1.4
150
153
2.0
2.1
158
3.4
5.6

Tab
le 4
: R
ecov
ery
stud
y fo
r A
FB
1 a
nd O
TA
in
plas
ma,
liv
er a
nd k
idne
y
Myco
tox
in
C
on
cen
trati
on
(µ
g/
L)a
(µ
g/
kg
)b
R
ep
eata
bil
ity (
wit
hin
-day)
In
term
ed
iate
pre
cis
ion
(b
etw
een
-day)
R
eco
ver
y (%
) n
=3
RSD
(%
) n
=3
Glo
bal
re
cover
y (%
) n
=12
RSD
(%
) n
=12
R
eco
ver
y (%
) n
=9
RSD
(%
) n
=9
Glo
bal
re
cover
y (%
) n
=36
RSD
(%
) n
=36
AF
B1
Pla
sma
2
89.1
1.5
93.8
5.7
85.4
4.1
93.0
8.9
8
95.1
2.6
97.1
5.5
120
101.5
1.6
102.9
2.1
600
89.7
1.0
86.7
5.0
(d
=20)*
30
99.0
5.5
103.4
6.6
Liv
er
8
97.9
4.1
95.8
6.0
92.2
10.4
95.2
8.1
32
94.8
2.5
97.8
5.2
480
101.9
2.9
102.5
2.3
2400
88.6
2.9
88.2
2.7
Kid
ney
8
94.2
3.3
97.0
5.8
100.7
6.2
96.0
8.1
32
102.0
1.9
94.3
9.7
480
101.0
2.3
100.0
3.1
2400
91.2
6.5
88.7
5.4
OT
A
Pla
sma
2
97.9
1.5
96.5
7.5
92.8
5.8
96.0
8.9
8
88.3
3.6
91.5
5.6
120
106.6
1.9
108.7
2,1
600
93.1
0.8
91.2
4.8
(d=
20)*
30
96.1
5.8
103.2
7.9
Liv
er
8
82.5
4.9
91.3
10.0
90.3
8.7
94.4
8.8
32
89.5
4.5
89.7
5.4
480
105.4
3.0
105.9
2.4
2400
90.3
2.8
91.5
2.8
Kid
ney
8
91.4
4.9
96.9
7.1
85.1
8.5
94.5
9.7
32
95.4
5.7
91.6
5.6
480
105.6
2.0
106.1
2.5
2400
95.1
6.6
95.3
4.4
a :
µg/
L f
or
pla
sma,
b :µ
g/kg
for
liver
an
d k
idn
ey
*: r
eco
ver
y st
ud
y o
f th
e d
iluti
on
ste
p (
d=
20)
of
pla
sma

Chapter 5
128
In the study of robustness (see table 5), the pH of the mobile phase had a significant impact
on the quantification of OTA. An increase in the pH yielded a decrease in the OTA signal, whereas
AFB1 signal remains without changes. Ochratoxin A has been described as a weak acid and it is
important to maintain a pH below 4.4 in order to assure that OTA molecule is in its protonated
form (Valenta, 1998). In addition, different lots of columns were tested and the quantification was
satisfactory while the retention times appeared to be affected. On the other hand, peak areas did not
change after slight differences in column temperature. Due to the high pressure conditions of the
chromatography, slight changes in temperature, column batches or flow affected the pressure; as a
result, the retention times were affected but the quantification was considered to be robust.
Moreover, it was very important to keep samples in the dark during their obtainment or
manipulation due to the fact that AFB1 degrades easily when exposed to light.
Table 5: Study of robustness with standards: % of HCOOH in mobile phase, different column batches, changes in
column temperatures and exposure to light.
Application to real samples
The method was successfully applied in real samples obtained from rats that received
administration of a mixture of AFB1 and OTA (0.5 mg/kg bw and 0.1 mg/kg bw, respectively) in a
single dose by oral gavage (see table 6). The analytical results have been corrected with the recovery
value for each mycotoxin. The highest level found in plasma for OTA was 919 µg/L, the dilution
step (d=20) was applied and permitted quantification. On the contrary, low levels of AFB1 have
been detected in plasma samples (<LOD). In kidney and liver, comparable levels of OTA have been
found in both organs, and AFB1 was at a very low level in both of them.
AFB1 OTA
Concentration (µg/L)
Retention time
(min)
Concentration (µg/L)
Retention time(min)
Mean SE (%) Mean SE (%) Mean SE (%) Mean SE (%)
Nominal 30 2.55 30 8.43
0.1% HCOOH 30.0 0.0 2.53 0.7 25.7 14.2 8.33 1.1
Column batch A 29.4 2.0 2.21 13.0 30.6 2.0 7.48 11.3
Column batch B 27.7 7.5 2.38 6.3 30.6 1.9 7.81 7.3
Column at 59 ºC 29.0 3.2 2.55 0.0 30.0 0.1 8.33 1.2
Column at 57 ºC 29.3 2.2 2.65 4.1 30.1 0.3 8.69 3.1
Day light exposure degraded 28.7 4.5 8.38 0.6

Validation of the UHPLC-LD method
129
Table 6: Concentration of AFB1 and OTA in plasma (µg/L), liver and kidney (µg/kg) from rats administered
AFB1+OTA (0.5 mg/kg bw and 0.1 mg/kg bw, respectively) by oral gavage
Conclusions
A rapid and simple method for the simultaneous quantification of AFB1 and OTA in rat
plasma, liver and kidney by UHPLC-FLD has been validated and successfully applied. The process is
economical because only low volumes of solvents are needed, and the use of immunoaffinity
columns is not necessary in the purification process. In addition, this method uses a low-volume
column that permits working under high pressure conditions, thereby giving high resolution in short
time assays. The two most important advantages of this method are that it enables the simultaneous
quantification of AFB1 and OTA in three biological matrices, and that only 100 µL of plasma or
25 mg of tissue are sufficient enough for obtaining results in a wide range of concentrations, with
adequate recovery and LOD and LOQ values. These characteristics make it very useful for carrying
out experimental work in toxicokinetic and toxicological studies.
Acknowledgements
The authors are grateful to Ms. Laura Stokes for reviewing the English version of this
manuscript. This work has received financial support (Ref. AGL2008-01437) from the Education
and Science Ministry of Spain. We thank the Project of Research of University of Navarra (PIUNA
Projects) and CAN Foundation (Caja Navarra; “Proyectos: Tú eliges, tú decides”) for the financial
support and grants received.
Concentration (µg/L)a (µg/kg)b
Sample AFB1 OTA
Plasma
1 9.77 427
2 3.06 919
3 0.127c 543
4 <LOD 528
5 1.69c 549
6 <LOD 422
7 <LOD 424
8 <LOD 420
Liver 1 <LOD 35.5
2 <LOD 31.7
Kidney 1 6.06c 42.6
2 6.58c 41.5
a :µg/L for plasma, b :µg/kg for liver and kidney
c :<LOQ

Chapter 5
130
References
AEFI, 2001. Validación de Métodos Analíticos.
Bircan, C., 2009. Incidence of ochratoxin A in dried fruits and co-occurrence with aflatoxins in dried
figs. Food Chem Toxicol 47, 1996-2001.
Bressolle, F., Bromet-Petit, M. and Audran, M., 1996. Validation of liquid chromatographic and gas
chromatographic methods Applications to pharmacokinetics. J Chromatogr B 686, 3-10.
Coulombe Jr, R.A. and Sharma, R.P., 1985. Clearance and excretion of intratracheally and orally
administered aflatoxin B1 in the rat. Food Chem Toxicol 23, 827-830.
De Saeger, S., Dumoulin, F. and Van Peteghem, C., 2004. Quantitative determination of ochratoxin A
in kidneys by liquid chromatography/mass spectrometry. Rapid Commun Mass Sp 18, 2661-2668.
EFSA, 2006. Opinion of the Scientific Panel on Contaminats in the Food Chain on a request from the
commision related to Ochratoxin A in food. EFSA J 365, 1-56.
EFSA, 2007. Opinion of the Scientific Panel on Contaminats in the Food Chain on a request from the
Commission related to the potential increase of consumer health risk by a possible increase of the existing
maximun levels for Aflatoxins in almonds, hazelnuts and pistachios and derived products. EFSA J 446, 1-127.
Gregory III, J.F., Goldstein, S.L. and Edds, G.T., 1983. Metabolite distribution and rate of residue
clearance in Turkeys fed a diet containing aflatoxin B1. Food Chem Toxicol 21, 463-467.
Gregory, J.F., 1982. Quantification of aflatoxin metabolites in animal tissues using high performance
liquid chromatography. J Assoc Off Anal Chem 65, 869-75.
Herzallah, S.M., 2009. Determination of aflatoxins in eggs, milk, meat and meat products using HPLC
fluorescent and UV detectors. Food Chem 114, 1141-1146.
Holcomb, M., Wilson, D.M., Trucksess, M.W. and Thompson Jr., H.C., 1992. Determination of
aflatoxins in food products by chromatography. J Chromatogr A 624, 341-352.
IARC, 1987. IARC Monographs on the Evaluation of Carcinogenic Risks to Humans. Overall
Evaluations of Carcinogenicity: An Updating of IARC Monographs Volumes 1 to 42. Supplement 7, 440.
IARC, 1993. IARC Monographs on the Evaluation of Carcinogenic Risks to Humans. Some Naturally
Occurring Substances: Food Items and Constituents, Heterocyclic Aromatic Amines and Mycotoxins. 56, 33.

Validation of the UHPLC-LD method
131
IARC, 2002. IARC Monographs on the Evaluation of Carcinogenic Risks to Humans. Some Traditional
Herbal Medicines, Some Mycotoxins, Naphthalene and Styrene. 82, 590.
ICH, 2005. ICH Harmonised Tripartite Guideline, Q2(R1): Validation of Analitical Procedures: Text
and Methodology, International Conference of Harmonisation of Technical Requirements for Registration of
Pharmaceutical for Human Use.
Joshua, H., 1993. Determination of aflatoxins by reversed-phase high-performance liquid
chromatography with post-column in-line photochemical derivatization and fluorescence detection. J
Chromatogr A 654, 247-254.
Kok, W.T., 1994. Derivatization reactions for the determination of aflatoxins by liquid chromatography
with fluorescence detection. J Chromatography B 659, 127-137.
Lamplugh, S.M., 1983a. Analysis of aflatoxins in human sera, urine and liver. Clin Biochem 16, 371-371.
Lamplugh, S.M., 1983b. Comparison of three methods for the extraction of aflatoxins from human
serum in combination with a high-performance liquid chromatographic assay. J Chromatogr B 273, 442-448.
Mantle, P.G., 2008. Interpretation of the pharmacokinetics of ochratoxin A in blood plasma of rats,
during and after acute or chronic ingestion. Food Chem Toxicol 46, 1808-1816.
Marzuki, A. and Norred, W.P., 1984. Effects of saturated and unsaturated dietary fat on aflatoxin B1
metabolism. Food Chem Toxicol 22, 383-389.
McLean, M. and Dutton, M.F., 1995. Cellular interactions and metabolism of aflatoxin: An update.
Pharmac Ther 65, 163-192.
Newberne, P.M. and Butler, W.H., 1969. Acute and chronic effects of aflatoxin on the liver of domestic
and laboratory animals: a review. Cancer Res 29, 236-250.
OECD, 1984. OECD Guidelines for the Testing of Chemicals, Number 417: Toxicokinetics.
OECD, 2009. OECD Guidelines for the Testing of Chemicals. Draft proposal for a revised TG417:
Toxicokinetics.
Papp, E., H-Otta, K., Záray, G. and Mincsovics, E., 2002. Liquid chromatographic determination of
aflatoxins. Microchemi J 73, 39-46.
Pfohl-Leszkowicz, A. and Manderville, R.A., 2007. Ochratoxin A: An overview on toxicity and
carcinogenicity in animals and humans. Mol Nutr Food Res 51, 61-99.

Chapter 5
132
Plakas, S.M., Loveland, P.M., Bailey, G.S., Blazer, V.S. and Wilson, G.L., 1991. Tissue disposition and
excretion of 14C-labelled aflatoxin B1 after oral administration in channel catfish. Food Chem Toxicol 29, 805-
808.
Ringot, D., Chango, A., Schneider, Y.J. and Larondelle, Y., 2006. Toxicokinetics and toxicodynamics of
ochratoxin A, an update. Chem Biol Interact 159, 18-46.
Santos, L., Marín, S., Sanchis, V. and Ramos, A.J., 2010. Co-occurrence of aflatoxins, ochratoxin A and
zearalenone in Capsicum powder samples available on the Spanish market. Food Chem 122, 826-830.
Sedmíková, M., Reisnerová, H., Dufková, Z., Bárta, I. and Jílek, F., 2001. Potential Hazard of
simultaneous occurrence of aflatoxin B1 and ochratoxin A. Veter Med 46, 169-174.
Shundo, L., de Almeida, A.P., Alaburda, J., Lamardo, L.C.A., Navas, S.A., Ruvieri, V. and Sabino, M.,
2009. Aflatoxins and ochratoxin A in Brazilian paprika. Food Control 20, 1099-1102.
Siraj, M.Y., Hayes, A.W., Unger, P.D., Hogan, G.R., Ryan, N.J. and Wray, B.B., 1981. Analysis of
aflatoxin B1 in human tissues with high-pressure liquid chromatography. Toxicol Appl Pharmacol 58, 422-430.
Soriano del Castillo, J.M., 2007. Micotoxinas En Alimentos. Díaz de Santos, Madrid.
Urrego Novoa, J.R. and Diaz, G.J., 2006. Aflatoxins and its mechanisms of toxicity in hepatic cancer.
Rev Fac Med Una 54, 108-116.
Valenta, H., 1998. Chromatographic methods for the determination of ochratoxin A in animal and
human tissues and fluids. J Chromatogr A 815, 75-92.
Vettorazzi, A., Gonzalez-Penas, E., Troconiz, I.F., Arbillaga, L., Corcuera, L.A., Gil, A.G. and de
Cerain, A.L., 2009. A different kinetic profile of ochratoxin A in mature male rats. Food Chem Toxicol 47,
1921-1927.
Vettorazzi, A., Gonzalez-Penas, E., Arbillaga, L., Corcuera, L.A. and López de Cerain, A., 2008. Simple
high-performance liquid chromatography-fluorescence detection method for plasma, kidney and liver of rat as
a tool for toxicology studies. J. Chromatogr A 1215, 100-106.
Villa, P. and Markaki, P., 2009. Aflatoxin B1 and ochratoxin A in breakfast cereals from athens market:
Occurrence and risk assessment. Food Control 20, 455-461.
Wong, Z.A. and Hsieh, D.P.H., 1980. The comparative metabolism and toxicokinetics of aflatoxin B1
in the monkey, rat, and mouse. Toxicol Appl Pharmacol 55, 115-125.

Validation of the UHPLC-LD method
133
Zepnik, H., Völkel, W. and Dekant, W., 2003. Toxicokinetics of the mycotoxin ochratoxin A in F 344
rats after oral administration. Toxicol Appl Pharmacol 192, 36-44.
Zöllner, P. and Mayer-Helm, B., 2006. Trace mycotoxin analysis in complex biological and food
matrices by liquid chromatography–atmospheric pressure ionisation mass spectrometry. J Chromatogr A 1136,
123-169.


An approach to the toxicity and toxicokinetics of aflatoxin B1 and ochratoxin A after
simultaneous oral administration to F344 rats
Chapter 6
Laura-Ana Corcuera, Ariane Vettorazzi, Leire Arbillaga, Elena González-Peñas,
Adela López de Cerain
Submitted to Food and Chemical Toxicology

Toxicokinetic and toxicological approach
137
Resumen
Las micotoxinas son producidas por hongos y llegan al ser humano a través de alimentos
contaminados. Algunas de las más peligrosas son la aflatoxina B1 (AFB1) y la ocratoxina A (OTA)
que han sido clasificadas por la IARC como de clase 1 (carcinógeno humano) y de clase 2B (posible
carcinógeno humano), respectivamente. Algunos autores han observado que tanto la AFB1 como la
OTA pueden formar asociaciones sinérgicas in vivo con otras micotoxinas, por tanto sería interesante
estudiar el comportamiento tóxico y toxicocinético de la mezcla de ellas.
Se ha realizado un estudio preliminar administrando una dosis única de 0,25 mg/kg pc de
AFB1 y 0,5 mg/kg pc de OTA por vía oral a ratas F344. Se obtuvieron muestras de sangre 0.5, 2, 4,
6, 8, y 24 h después de la administración, y tras 8, 24, 48, 72 y 96 h los animales fueron sacrificados
para obtener muestras de plasma, hígado, riñón, bazo y placas de Peier.
Los resultados bioquímicos e histopatológicos mostraron toxicidad aguda en el hígado
provocada por la AFB1. No hubo toxicidad relevante en riñón ni órganos del sistema inmune. Según
los resultados cinéticos, la absorción y metabolismo de la AFB1 son extremadamente rápidos.
Solamente se encontró el 1% de la dosis inicial 10 minutos después de la administración, menos del
10% de la dosis en hígado tras 8 h, fue indetectable en riñón y los metabolitos desaparecieron del
organismo tras 24 h. La concentración de OTA en plasma, hígado y riñón y algunos de los
parámetros cinéticos son comparables con los resultados de Vettorazzi et al. (2010) bajo las mismas
condiciones experimentales, por lo que parece que la AFB1 no afecta al perfil cinético de la OTA.

Chapter 6
138
Abstract
Mycotoxins are produced by fungal species that reach human beings through contaminated
food. Some of the most dangerous are aflatoxin B1 (AFB1) and ochratoxin A (OTA), classified by
the IARC as class 1 (human carcinogen) and class 2B (possible human carcinogen), respectively.
Some authors have found synergetic effects in vivo in the combination of AFB1 and OTA with other
mycotoxins so it would be interesting to study their toxic and toxicokinetic behaviour together.
A preliminary toxicokinetic study with F344 rats has been carried out. Both AFB1
(0.25 mg/kg bw) and OTA (0.5 mg/kg bw) were administered together by oral gavage. Blood was
extracted 0.5, 2, 4, 6, 8, and 24 h after administration. Furthermore, at 8, 24, 48, 72, 96 h the animals
were sacrificed in order to determine mycotoxin concentration in plasma, kidney, liver, spleen and
Peyer’s patches.
The biochemical and histopathological results pointed to acute toxicity in liver due to AFB1.
No remarkable toxicity was observed in kidneys or immunological organs. According to the kinetic
results, the absorption of AFB1 was very fast and it metabolized rapidly. Only 1% of the dose was
found in plasma after 10 min and less than 10% was observed in liver; it was undetectable in kidney
and metabolites were undetectable after 24 h. The OTA concentration profiles in plasma, liver and
kidney and some of the kinetic parameters are similar to those observed by Vettorazzi et al. (2010)
under the same conditions as those used in this experiment; therefore, AFB1 did not change OTA
kinetic profile.

Toxicokinetic and toxicological approach
139
Introduction
Mycotoxins are secondary metabolites produced by different fungal species that can be found
in many agricultural commodities and processed food (Bennett and Klich, 2003). Aflatoxin B1
(AFB1) and ochratoxin A (OTA) are some of the most relevant mycotoxins due to their toxic effects
and demonstrated human exposure (EFSA, 2006; EFSA, 2007).
According to WHO, in the EU, daily exposure to aflatoxins is between 2 and 77 ng of AFB1
per person. The International Agency for Research on Cancer (IARC) concluded that there was
sufficient evidence in humans of the carcinogenicity of naturally occurring AFB1 (IARC, 1987;
IARC, 1993); therefore, the authorities can not estimate a safe intake and advise the ALARA
principle (as low as reasonable achievable) (EC, 2002). It has been described that, in humans, orally
administered AFB1 follows a two-compartment model of absorption and elimination, with a rapid
distribution phase followed by a slower elimination phase (EFSA, 2007). In rats, intestinal absorption
of AFB1 is very fast and follows first-order kinetics (Ramos and Hernandez, 1996). Absorbed AFB1
reaches the liver through the portal system and is bioactivated by P450 cytochromes. The resulting
epoxide attacks DNA-forming adducts (McLean and Dutton, 1995). AFB1 metabolism is well
known (McLean and Dutton, 1995; El-Khatib et al., 1998; Smela et al., 2002; Bedard and Massey,
2006); on the contrary, data regarding kinetics of AFB1 in humans and in laboratory animals are
sometimes contradictory or incomplete. In the majority of the studies, the authors used methods that
could not detect the AFB1 molecule or differentiate it from the resulting metabolites (Wong and
Hsieh, 1980; Coulombe Jr and Sharma, 1985; Cupid et al., 2004; Jubert et al., 2009; Firmin et al.,
2010).
With regard to OTA, this mycotoxin is a potent nephrocarcinogenic compound in rodents
and, despite the controversy, it is considered to be an indirect genotoxic agent (Arbillaga et al., 2004;
Arbillaga et al., 2007; Mally et al., 2004; Mally et al., 2005; Mally and Dekant, 2005; Turesky, 2005).
The IARC classified OTA as a possible carcinogenic compound (IARC, 1987; IARC, 2002). OTA
mechanisms of action are not clearly determined but apparently, its ability to generate reactive
oxygen species (ROS) may explain the lipid, protein and DNA damage (Ringot et al., 2006). Different
official organizations have suggested a safe PTDI (provisional tolerable daily intake) between 5 and
17 ng of OTA per kg of body weight and the levels found in plasma in humans in different countries
ranges between 0.01 and 75 µg/L (Coronel et al., 2010). In most animal species, the kinetic behavior
of OTA has been described as a two compartment open model, although recent data regarding the

Chapter 6
140
accumulation in kidneys suggest that these models are too simple and should be re-analyzed using
multi-compartment models (EFSA, 2006). Upon absorption from the gastrointestinal tract, OTA
binds to serum proteins (approximately 99%). Considerable variations in serum half-lives across
species have been reported due to the affinity and degree of protein binding (O'Brien and Dietrich,
2005). Reabsorption of OTA from the intestine back to the circulation, as a consequence of biliary
recycling, favors the systemic redistribution of OTA towards the different tissues. In addition,
reabsorption of OTA occurs in the kidney proximal and distal tubules which enhance accumulation
in blood, liver and kidney and explains the long life of OTA in plasma and tissues (Ringot et al.,
2006). Vettorazzi et al. have performed a series of kinetic studies and reported that sex, gender and
fasting conditions may have an impact on the kinetic profile of OTA (Vettorazzi et al., 2009;
Vettorazzi et al., 2010; Vettorazzi et al., 2011).
Human and animal population is exposed to multiple mycotoxins because the same food
might be contaminated by more than one mycotoxin, and mycotoxins might reach humans from
different sources. Co-exposure to different mycotoxins, could originate synergic or additive toxic
effects on human or animal health; however, knowledge regarding this aspect or regarding the
influence of co-ocurrence on toxicokinetic or toxicological characteristics of the mycotoxins is still
scarce. There are toxicological studies using mixtures of AFB1 and OTA in swine, rabbits, rats, etc.
and the results show synergetic, additive or antagonic associations depending on the endpoint
analyzed (Huff and Doerr, 1981; Huff et al., 1983; Wangikar et al., 2004; Wangikar et al., 2005). In a
large study combining AFB1 and OTA, the mixture showed no interaction regarding the
measurement of mortality, weight gain and most serum biological parameters but the anaplasic and
hiperchromatic nuclei, necrosis and bile duct proliferation observed were more pronounced in the
combined toxin group after 4 months (Rati et al., 1981). However, multi-exposure to mycotoxins has
not been taken into account in any of the kinetic studies published to date.
The main objective of this work was to study the kinetic behavior of AFB1 and OTA after a
single oral dose of both mycotoxins in rats, in order to investigate possible changes in their
pharmacokinetic profile in relation to those reported in previous studies, due to the presence of both
mycotoxins; another objective was to determine whether or not this kinetic behavior could have a
role in their interaction. Moreover, toxicity parameters were studied so as to obtain a more ample
approach to the mixture interaction (ICH, 1994).
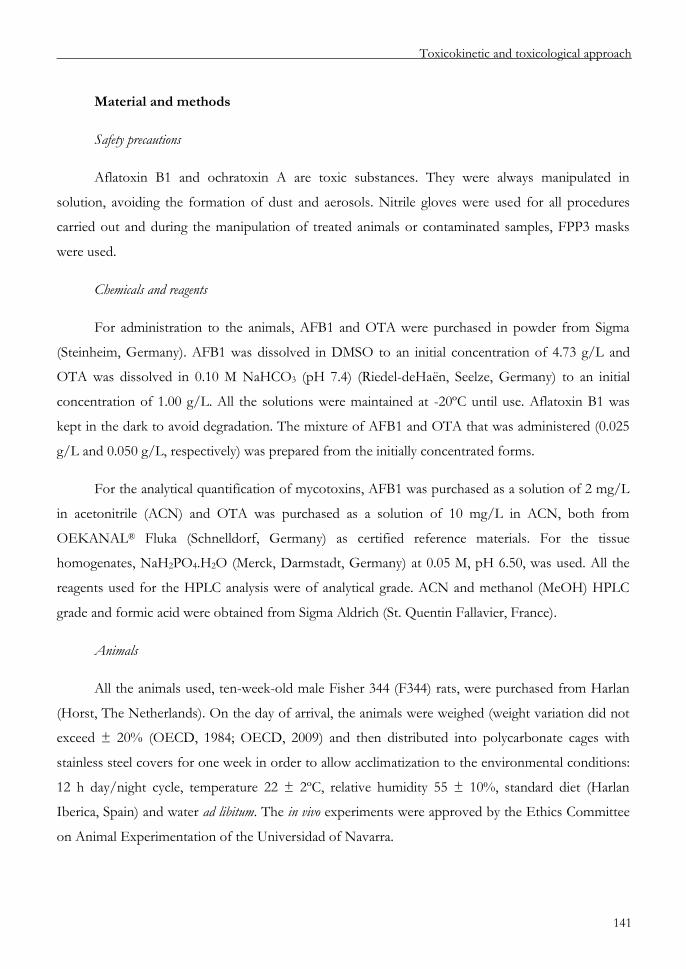
Toxicokinetic and toxicological approach
141
Material and methods
Safety precautions
Aflatoxin B1 and ochratoxin A are toxic substances. They were always manipulated in
solution, avoiding the formation of dust and aerosols. Nitrile gloves were used for all procedures
carried out and during the manipulation of treated animals or contaminated samples, FPP3 masks
were used.
Chemicals and reagents
For administration to the animals, AFB1 and OTA were purchased in powder from Sigma
(Steinheim, Germany). AFB1 was dissolved in DMSO to an initial concentration of 4.73 g/L and
OTA was dissolved in 0.10 M NaHCO3 (pH 7.4) (Riedel-deHaën, Seelze, Germany) to an initial
concentration of 1.00 g/L. All the solutions were maintained at -20ºC until use. Aflatoxin B1 was
kept in the dark to avoid degradation. The mixture of AFB1 and OTA that was administered (0.025
g/L and 0.050 g/L, respectively) was prepared from the initially concentrated forms.
For the analytical quantification of mycotoxins, AFB1 was purchased as a solution of 2 mg/L
in acetonitrile (ACN) and OTA was purchased as a solution of 10 mg/L in ACN, both from
OEKANAL® Fluka (Schnelldorf, Germany) as certified reference materials. For the tissue
homogenates, NaH2PO4.H2O (Merck, Darmstadt, Germany) at 0.05 M, pH 6.50, was used. All the
reagents used for the HPLC analysis were of analytical grade. ACN and methanol (MeOH) HPLC
grade and formic acid were obtained from Sigma Aldrich (St. Quentin Fallavier, France).
Animals
All the animals used, ten-week-old male Fisher 344 (F344) rats, were purchased from Harlan
(Horst, The Netherlands). On the day of arrival, the animals were weighed (weight variation did not
exceed ± 20% (OECD, 1984; OECD, 2009) and then distributed into polycarbonate cages with
stainless steel covers for one week in order to allow acclimatization to the environmental conditions:
12 h day/night cycle, temperature 22 ± 2ºC, relative humidity 55 ± 10%, standard diet (Harlan
Iberica, Spain) and water ad libitum. The in vivo experiments were approved by the Ethics Committee
on Animal Experimentation of the Universidad of Navarra.
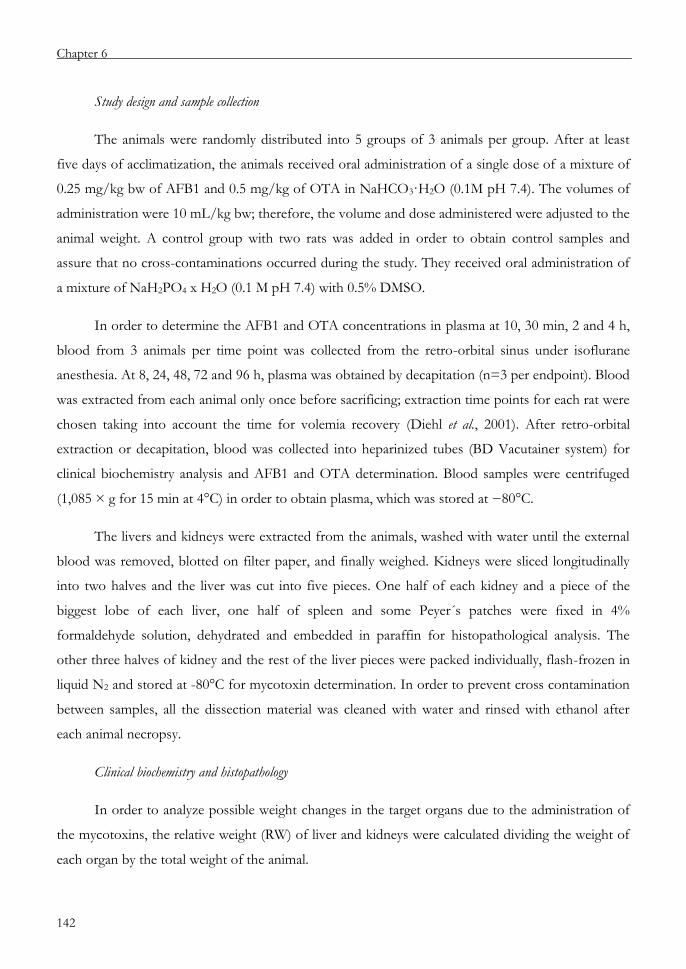
Chapter 6
142
Study design and sample collection
The animals were randomly distributed into 5 groups of 3 animals per group. After at least
five days of acclimatization, the animals received oral administration of a single dose of a mixture of
0.25 mg/kg bw of AFB1 and 0.5 mg/kg of OTA in NaHCO3·H2O (0.1M pH 7.4). The volumes of
administration were 10 mL/kg bw; therefore, the volume and dose administered were adjusted to the
animal weight. A control group with two rats was added in order to obtain control samples and
assure that no cross-contaminations occurred during the study. They received oral administration of
a mixture of NaH2PO4 x H2O (0.1 M pH 7.4) with 0.5% DMSO.
In order to determine the AFB1 and OTA concentrations in plasma at 10, 30 min, 2 and 4 h,
blood from 3 animals per time point was collected from the retro-orbital sinus under isoflurane
anesthesia. At 8, 24, 48, 72 and 96 h, plasma was obtained by decapitation (n=3 per endpoint). Blood
was extracted from each animal only once before sacrificing; extraction time points for each rat were
chosen taking into account the time for volemia recovery (Diehl et al., 2001). After retro-orbital
extraction or decapitation, blood was collected into heparinized tubes (BD Vacutainer system) for
clinical biochemistry analysis and AFB1 and OTA determination. Blood samples were centrifuged
(1,085 × g for 15 min at 4°C) in order to obtain plasma, which was stored at −80°C.
The livers and kidneys were extracted from the animals, washed with water until the external
blood was removed, blotted on filter paper, and finally weighed. Kidneys were sliced longitudinally
into two halves and the liver was cut into five pieces. One half of each kidney and a piece of the
biggest lobe of each liver, one half of spleen and some Peyer´s patches were fixed in 4%
formaldehyde solution, dehydrated and embedded in paraffin for histopathological analysis. The
other three halves of kidney and the rest of the liver pieces were packed individually, flash-frozen in
liquid N2 and stored at -80°C for mycotoxin determination. In order to prevent cross contamination
between samples, all the dissection material was cleaned with water and rinsed with ethanol after
each animal necropsy.
Clinical biochemistry and histopathology
In order to analyze possible weight changes in the target organs due to the administration of
the mycotoxins, the relative weight (RW) of liver and kidneys were calculated dividing the weight of
each organ by the total weight of the animal.

Toxicokinetic and toxicological approach
143
Biochemical analyses of plasma samples were performed with a Hitachi 911™ (Roche
Diagnostics) analyzer using the protocols obtained from Roche for the determination of the standard
parameters in plasma: total protein (g/dL), albumin (g/dL), glucose (mg/dL), aspartate transaminase
(AST) (U/L), alanine transaminase (ALT) (U/L), alkaline phosphatase (U/L) and urea (mg/dL).
For the histopathological examination, paraffin sections (3 µm) were cut, mounted onto glass
slides, and dewaxed and stained with hematoxylin and eosin (H&E). In the observation and
evaluation of each sample, the systemic anatomopathological protocol was applied, with special
attention to:
Normalcy or alteration of the architecture and proportions of the cutaneous structures.
Presence of circulatory phenomena.
Evaluation and quantification of degenerative or necrotic phenomena.
Existence or absence of inflammatory phenomena, types and intensity.
Abnormal growths: atrophy, hyperplasia, hypertrophy, neoplasia.
Particular or special findings.
The evaluation of some of these alterations (circulatory, degeneration and/or necrosis,
inflammation and growth abnormalities) was carried out by calculating the different “fields” with the
adequate increases for their correct observation, using a scale from 0 to 5 in order to express the
results obtained. Whenever necessary, measurements are taken by means of the calibrated digital
system.
Determination of mycotoxins in plasma, liver and kidney
The concentration of mycotoxins in plasma and tissues was determined by UHPLC with
fluorescence detection. The extraction procedure and the UHPLC-FLD quantification method was
previously set up and validated for these biological samples (Corcuera et al., 2011). Kidney and liver
were homogenized in a round-bottom plastic tube with 4µL of cold sodium phosphate buffer
(0.05 M, pH 6.50) per mg of tissue. The tissue homogenates were aliquoted and stored for at least
one day at -80ºC until the mycotoxin extraction was carried out. The plasma samples or the tissue
homogenates were kept at room temperature for 30 min before the extraction step. Next, 100 µL of
plasma or tissue homogenate were treated with 300 µL of the extractive solution (ACN acidified with
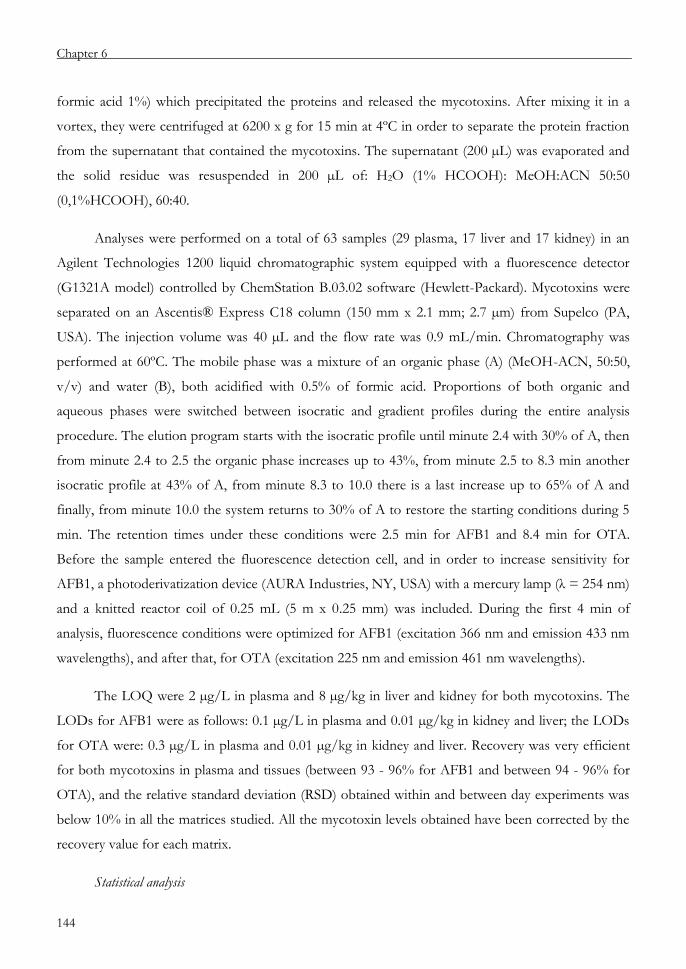
Chapter 6
144
formic acid 1%) which precipitated the proteins and released the mycotoxins. After mixing it in a
vortex, they were centrifuged at 6200 x g for 15 min at 4ºC in order to separate the protein fraction
from the supernatant that contained the mycotoxins. The supernatant (200 µL) was evaporated and
the solid residue was resuspended in 200 µL of: H2O (1% HCOOH): MeOH:ACN 50:50
(0,1%HCOOH), 60:40.
Analyses were performed on a total of 63 samples (29 plasma, 17 liver and 17 kidney) in an
Agilent Technologies 1200 liquid chromatographic system equipped with a fluorescence detector
(G1321A model) controlled by ChemStation B.03.02 software (Hewlett-Packard). Mycotoxins were
separated on an Ascentis® Express C18 column (150 mm x 2.1 mm; 2.7 µm) from Supelco (PA,
USA). The injection volume was 40 µL and the flow rate was 0.9 mL/min. Chromatography was
performed at 60ºC. The mobile phase was a mixture of an organic phase (A) (MeOH-ACN, 50:50,
v/v) and water (B), both acidified with 0.5% of formic acid. Proportions of both organic and
aqueous phases were switched between isocratic and gradient profiles during the entire analysis
procedure. The elution program starts with the isocratic profile until minute 2.4 with 30% of A, then
from minute 2.4 to 2.5 the organic phase increases up to 43%, from minute 2.5 to 8.3 min another
isocratic profile at 43% of A, from minute 8.3 to 10.0 there is a last increase up to 65% of A and
finally, from minute 10.0 the system returns to 30% of A to restore the starting conditions during 5
min. The retention times under these conditions were 2.5 min for AFB1 and 8.4 min for OTA.
Before the sample entered the fluorescence detection cell, and in order to increase sensitivity for
AFB1, a photoderivatization device (AURA Industries, NY, USA) with a mercury lamp (λ = 254 nm)
and a knitted reactor coil of 0.25 mL (5 m x 0.25 mm) was included. During the first 4 min of
analysis, fluorescence conditions were optimized for AFB1 (excitation 366 nm and emission 433 nm
wavelengths), and after that, for OTA (excitation 225 nm and emission 461 nm wavelengths).
The LOQ were 2 µg/L in plasma and 8 µg/kg in liver and kidney for both mycotoxins. The
LODs for AFB1 were as follows: 0.1 µg/L in plasma and 0.01 µg/kg in kidney and liver; the LODs
for OTA were: 0.3 µg/L in plasma and 0.01 µg/kg in kidney and liver. Recovery was very efficient
for both mycotoxins in plasma and tissues (between 93 - 96% for AFB1 and between 94 - 96% for
OTA), and the relative standard deviation (RSD) obtained within and between day experiments was
below 10% in all the matrices studied. All the mycotoxin levels obtained have been corrected by the
recovery value for each matrix.
Statistical analysis
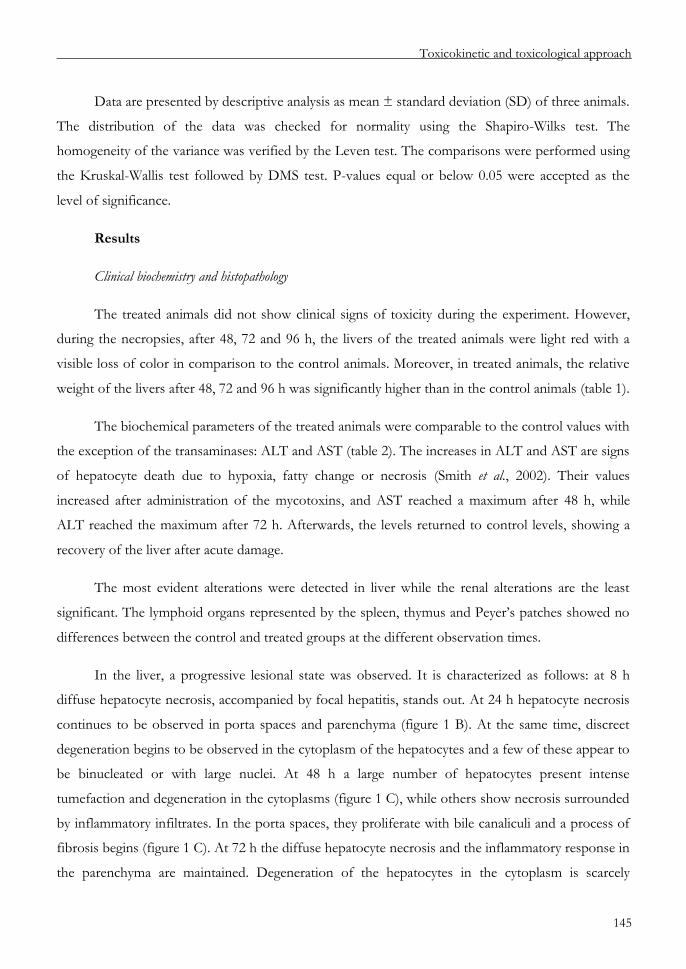
Toxicokinetic and toxicological approach
145
Data are presented by descriptive analysis as mean ± standard deviation (SD) of three animals.
The distribution of the data was checked for normality using the Shapiro-Wilks test. The
homogeneity of the variance was verified by the Leven test. The comparisons were performed using
the Kruskal-Wallis test followed by DMS test. P-values equal or below 0.05 were accepted as the
level of significance.
Results
Clinical biochemistry and histopathology
The treated animals did not show clinical signs of toxicity during the experiment. However,
during the necropsies, after 48, 72 and 96 h, the livers of the treated animals were light red with a
visible loss of color in comparison to the control animals. Moreover, in treated animals, the relative
weight of the livers after 48, 72 and 96 h was significantly higher than in the control animals (table 1).
The biochemical parameters of the treated animals were comparable to the control values with
the exception of the transaminases: ALT and AST (table 2). The increases in ALT and AST are signs
of hepatocyte death due to hypoxia, fatty change or necrosis (Smith et al., 2002). Their values
increased after administration of the mycotoxins, and AST reached a maximum after 48 h, while
ALT reached the maximum after 72 h. Afterwards, the levels returned to control levels, showing a
recovery of the liver after acute damage.
The most evident alterations were detected in liver while the renal alterations are the least
significant. The lymphoid organs represented by the spleen, thymus and Peyer’s patches showed no
differences between the control and treated groups at the different observation times.
In the liver, a progressive lesional state was observed. It is characterized as follows: at 8 h
diffuse hepatocyte necrosis, accompanied by focal hepatitis, stands out. At 24 h hepatocyte necrosis
continues to be observed in porta spaces and parenchyma (figure 1 B). At the same time, discreet
degeneration begins to be observed in the cytoplasm of the hepatocytes and a few of these appear to
be binucleated or with large nuclei. At 48 h a large number of hepatocytes present intense
tumefaction and degeneration in the cytoplasms (figure 1 C), while others show necrosis surrounded
by inflammatory infiltrates. In the porta spaces, they proliferate with bile canaliculi and a process of
fibrosis begins (figure 1 C). At 72 h the diffuse hepatocyte necrosis and the inflammatory response in
the parenchyma are maintained. Degeneration of the hepatocytes in the cytoplasm is scarcely

Chapter 6
146
evident. The fibrosis and proliferation of bile canaliculi in the porta spaces as well as focal fibrosis of
the parenchyma are notable (figure 1 D). This fibrosis is interpreted as small areas of cicatrization
due to the loss of hepatocytes. Together, these findings can be defined as the very initial stages of
cirrhosis. At 96 h hepatocyte necrosis is no longer observed and the inflammatory response is either
stabilized or has decreased. The cytoplasm of the hepatocytes presents tumefaction and moderate
degeneration. Proliferation of bile canaliculi and portal fibrosis are largely present (figure 1 E) as well
as regenerative phenomena in the hepatocytes with numerous binucleated cells (figure 1 F).
In the kidney, the proximal convoluted tubules progressively lost the renal glucogen. At the
same time, in the glomerules, hypercellularity was observed due to the infiltration of inflammatory
cells, resulting in glomerulonephritis. Over time, sclerosis and moderate glomerular atrophy were
observed. The alterations in the renal tubules were not evident and even though there was an
increase of interstitial nephritis and interstitial fibrosis observed as of 48 h, no previous serious
tubular lesion was found.
Plasma and tissue mycotoxin concentrations
After administration of mycotoxins, levels of OTA were found in plasma and tissues at all the
timepoints, and very low levels of OTA were detected in control samples (<LOQ), presumably due
to OTA contamination of standard diet of animals (Vettorazzi et al., 2009; Zepnik et al., 2003;
Mantle, 2008). The amount in plasma increased as of 10 min and reached a maximum at 2h
(Cmax obs = 4,326.6 µg/L) and afterwards, it slowly decreased, with a plasma half live of
approximately 48 h (figure 2A). The plasma concentration that Vettorazzi et al. (2010) obtained in a
previous work with adult male F344 rats in similar experimental conditions has been overlapped in
chart A in order to compare the kinetic curve with the data from this work. In tissues, the OTA
concentration was similar in liver and kidney, reaching maximum levels at 8 h (figure 2B).
AFB1 could only be quantified in plasma at 10 and 30 min. In liver, levels below the LOQ
were observed 8 h after administration, and no AFB1 was detected in kidney. In plasma,
chromatograms showed a wide front peak, very different from the control or AFB1 spiked plasma
samples. This indicated the presence of new compounds with more hydrophilic properties than
AFB1 or OTA. In order to enlarge the front peak, chromatographic conditions were modulated and
at least 8 different peaks appeared (figure 3). They had maximums at 30 min and then decreased in a
time-dependant manner until 24 h. After 48 h, no peaks appeared in the front.

Toxicokinetic and toxicological approach
147
Figure 1: Microscopic images of liver samples. A progressive lesional state can be observed. A) Normal liver of a
control sample. B) Focal cell necrosis and discrete degeneration of cytoplasm after 24 h. C) Intense tumefaction of
hepatocytes, cell proliferation and initial fibrosis in porta spaces after 24 h. D) Necrosis and inflammatory response
maintained fibrosis around bile canaliculi in porta spaces after 72 h. E) Moderate tumefaction of cytoplasms,
proliferation of bile canaliculy and portal fibrosis after 96 h, and also F) binucleated hepatocytes in a regenerative
fenomena.
A) C- B) 24h
C) 48h D) 72h
E) 96h F) 96h
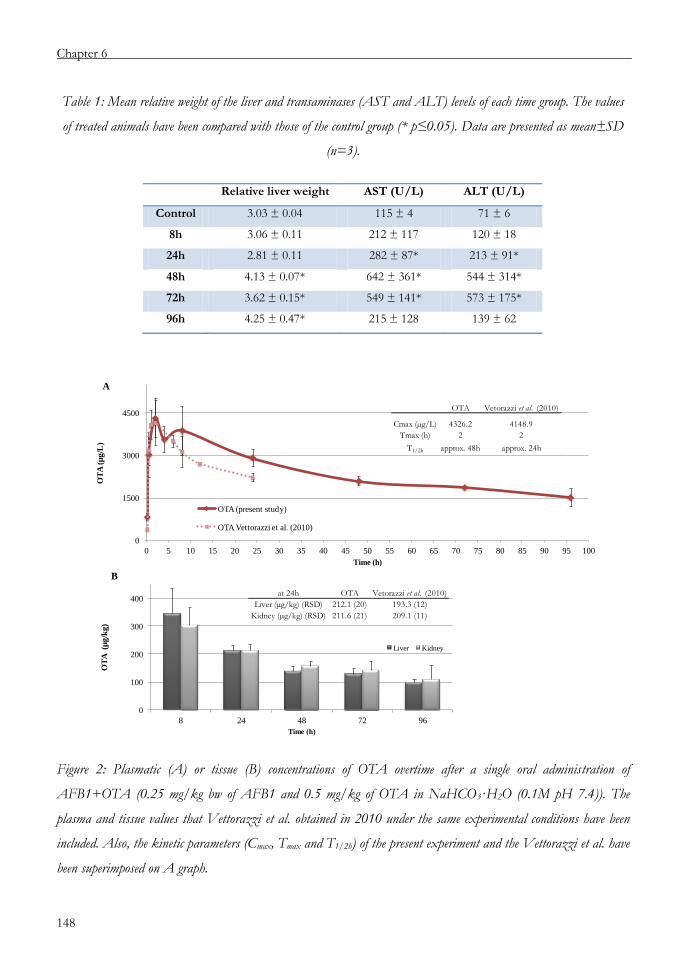
Chapter 6
148
Table 1: Mean relative weight of the liver and transaminases (AST and ALT) levels of each time group. The values
of treated animals have been compared with those of the control group (* p≤0.05). Data are presented as mean±SD
(n=3).
Figure 2: Plasmatic (A) or tissue (B) concentrations of OTA overtime after a single oral administration of
AFB1+OTA (0.25 mg/kg bw of AFB1 and 0.5 mg/kg of OTA in NaHCO3·H2O (0.1M pH 7.4)). The
plasma and tissue values that Vettorazzi et al. obtained in 2010 under the same experimental conditions have been
included. Also, the kinetic parameters (Cmax, Tmax and T1/2h) of the present experiment and the Vettorazzi et al. have
been superimposed on A graph.
Relative liver weight AST (U/L) ALT (U/L)
Control 3.03 ± 0.04 115 ± 4 71 ± 6
8h 3.06 ± 0.11 212 ± 117 120 ± 18
24h 2.81 ± 0.11 282 ± 87* 213 ± 91*
48h 4.13 ± 0.07* 642 ± 361* 544 ± 314*
72h 3.62 ± 0.15* 549 ± 141* 573 ± 175*
96h 4.25 ± 0.47* 215 ± 128 139 ± 62
0
1500
3000
4500
0 5 10 15 20 25 30 35 40 45 50 55 60 65 70 75 80 85 90 95 100
OT
A (µ
g/L
)
Time (h)
OTA (present study)
OTA Vettorazzi et al. (2010)
A
0
100
200
300
400
8 24 48 72 96
OT
A (
µg
/kg
)
Time (h)
Liver Kidney
B
OTA Vetorazzi et al. (2010)
Cmax (µg/L) 4326.2 4148.9
Tmax (h) 2 2
T1/2h approx. 48h approx. 24h
at 24h OTA Vetorazzi et al. (2010)
Liver (µg/kg) (RSD) 212.1 (20) 193.3 (12)
Kidney (µg/kg) (RSD) 211.6 (21) 209.1 (11)
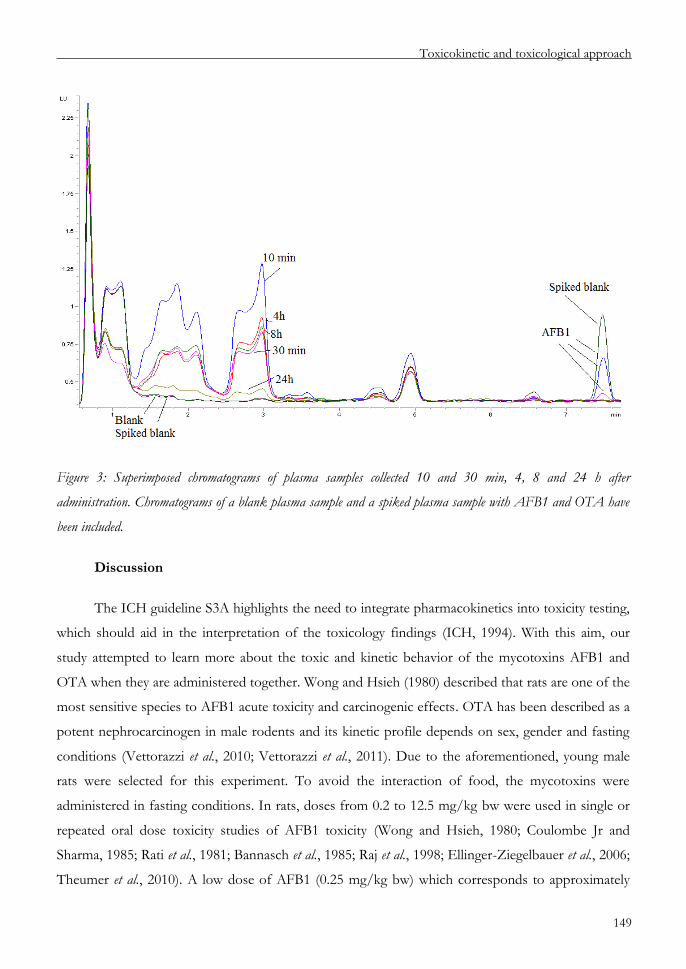
Toxicokinetic and toxicological approach
149
Figure 3: Superimposed chromatograms of plasma samples collected 10 and 30 min, 4, 8 and 24 h after
administration. Chromatograms of a blank plasma sample and a spiked plasma sample with AFB1 and OTA have
been included.
Discussion
The ICH guideline S3A highlights the need to integrate pharmacokinetics into toxicity testing,
which should aid in the interpretation of the toxicology findings (ICH, 1994). With this aim, our
study attempted to learn more about the toxic and kinetic behavior of the mycotoxins AFB1 and
OTA when they are administered together. Wong and Hsieh (1980) described that rats are one of the
most sensitive species to AFB1 acute toxicity and carcinogenic effects. OTA has been described as a
potent nephrocarcinogen in male rodents and its kinetic profile depends on sex, gender and fasting
conditions (Vettorazzi et al., 2010; Vettorazzi et al., 2011). Due to the aforementioned, young male
rats were selected for this experiment. To avoid the interaction of food, the mycotoxins were
administered in fasting conditions. In rats, doses from 0.2 to 12.5 mg/kg bw were used in single or
repeated oral dose toxicity studies of AFB1 toxicity (Wong and Hsieh, 1980; Coulombe Jr and
Sharma, 1985; Rati et al., 1981; Bannasch et al., 1985; Raj et al., 1998; Ellinger-Ziegelbauer et al., 2006;
Theumer et al., 2010). A low dose of AFB1 (0.25 mg/kg bw) which corresponds to approximately

Chapter 6
150
3% of LD50 (Wong and Hsieh, 1980; EFSA, 2007) was administered in order to avoid strong acute
toxicity of AFB1. The single OTA dose selected (0.5 mg/kg bw) was approximately the carcinogenic
dose described by the NTP studies during 24 months (0.7 mg/kg bw). It corresponds to 2.5% of the
LD50 (NTP, 1989), it has been used in recent studies (Zepnik et al., 2003), and it was the same as that
used by Vettorazzi et al. (2009); therefore, some comparisons could be made.
Although there were no signs of general toxicity during the experiment, the biochemical and
histopathological results pointed to acute toxicity in liver and no toxicity in kidney or other organs.
The signs of hepatotoxicity appeared 48 h after administration, with paleness of livers, increases in
transaminases, cell necrosis and inflammatory infiltration. However, the liver started a repairing
process after 72 h and its effects were evident after 96 h because AST and ALT almost returned to
normal values. At that time, the regenerative phenomena were evident by the numerous binucleated
cells present. These findings coincide with the observations made by of Rati et al. (1981) regarding
acute toxicity of AFB1, and it appears that the AFB1 and/or its toxic metabolites are eliminated
(metabolized and excreted) in a range of 48-96 h. No remarkable toxicity was observed in kidneys or
immunological organs (spleen, thymus and Peyer’s patches) so OTA did not cause acute toxicity at
this dose, as expected. In conclusion, the acute toxic effects observed after the combined treatment
of AFB1 and OTA were mostly due to AFB1 effect.
According to the evident signs of toxicity in liver, high AFB1 levels might have been expected
in plasma and liver at least at the early time points of collection, and detectable levels in plasma
during at least 72 h. Surprisingly, only an astonishing 1% of the administered dose was found in
plasma after 10 min and 0.4% after 30 min. The liver levels were lower than the LOQ (8 µg/kg) at all
time points and AFB1 was undetectable in kidney. For this reason, it was not possible to calculate
any kinetic parameter. These findings suggest that the absorption of AFB1 was very fast, and that the
molecule was rapidly metabolized in the liver. Moreover, almost nothing of the un-metabolized
AFB1 was distributed outside the liver in plasma to kidneys. The compounds detected in the front
peak are assumed to be AFB1 metabolites because they have not been detected in spiked plasma
sample with AFB1 and OTA nor in recent OTA kinetic studies (Vettorazzi et al., 2009; Vettorazzi et
al., 2011; Vettorazzi et al., 2007). These compounds had a maximum at 30 min, decreased in a time-
dependent manner until 24 h, after which they were undetectable. Coulombe and Sharma (1985)
described a two compartmental model for AFB1 kinetics in rats, reaching the maximum
concentration after 3 h and with the plasma half life being 91.8 h. A more recent study found the
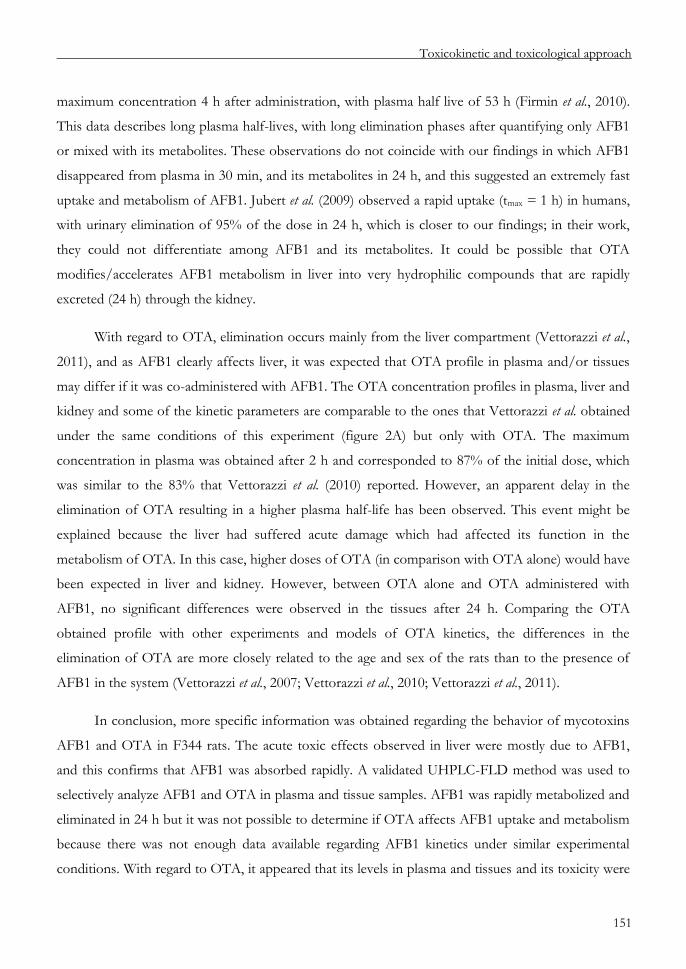
Toxicokinetic and toxicological approach
151
maximum concentration 4 h after administration, with plasma half live of 53 h (Firmin et al., 2010).
This data describes long plasma half-lives, with long elimination phases after quantifying only AFB1
or mixed with its metabolites. These observations do not coincide with our findings in which AFB1
disappeared from plasma in 30 min, and its metabolites in 24 h, and this suggested an extremely fast
uptake and metabolism of AFB1. Jubert et al. (2009) observed a rapid uptake (tmax = 1 h) in humans,
with urinary elimination of 95% of the dose in 24 h, which is closer to our findings; in their work,
they could not differentiate among AFB1 and its metabolites. It could be possible that OTA
modifies/accelerates AFB1 metabolism in liver into very hydrophilic compounds that are rapidly
excreted (24 h) through the kidney.
With regard to OTA, elimination occurs mainly from the liver compartment (Vettorazzi et al.,
2011), and as AFB1 clearly affects liver, it was expected that OTA profile in plasma and/or tissues
may differ if it was co-administered with AFB1. The OTA concentration profiles in plasma, liver and
kidney and some of the kinetic parameters are comparable to the ones that Vettorazzi et al. obtained
under the same conditions of this experiment (figure 2A) but only with OTA. The maximum
concentration in plasma was obtained after 2 h and corresponded to 87% of the initial dose, which
was similar to the 83% that Vettorazzi et al. (2010) reported. However, an apparent delay in the
elimination of OTA resulting in a higher plasma half-life has been observed. This event might be
explained because the liver had suffered acute damage which had affected its function in the
metabolism of OTA. In this case, higher doses of OTA (in comparison with OTA alone) would have
been expected in liver and kidney. However, between OTA alone and OTA administered with
AFB1, no significant differences were observed in the tissues after 24 h. Comparing the OTA
obtained profile with other experiments and models of OTA kinetics, the differences in the
elimination of OTA are more closely related to the age and sex of the rats than to the presence of
AFB1 in the system (Vettorazzi et al., 2007; Vettorazzi et al., 2010; Vettorazzi et al., 2011).
In conclusion, more specific information was obtained regarding the behavior of mycotoxins
AFB1 and OTA in F344 rats. The acute toxic effects observed in liver were mostly due to AFB1,
and this confirms that AFB1 was absorbed rapidly. A validated UHPLC-FLD method was used to
selectively analyze AFB1 and OTA in plasma and tissue samples. AFB1 was rapidly metabolized and
eliminated in 24 h but it was not possible to determine if OTA affects AFB1 uptake and metabolism
because there was not enough data available regarding AFB1 kinetics under similar experimental
conditions. With regard to OTA, it appeared that its levels in plasma and tissues and its toxicity were

Chapter 6
152
not affected by the presence of AFB1, but its elimination could be affected. However, further
investigations should be carried out in order to confirm this hypothesis.
Acknowledgments
The author wishes to express her gratitude to Ms. Celia Goñi and Ms. Cecilia Gutierrez. The
authors are grateful to Ms. Laura Stokes for reviewing the English version of this manuscript. L-A.C.
wishes to express their gratitude to the University of Navarra-Fundación Caja Navarra, and the
“Asociación de Amigos” of the University of Navarra.
Funding
This work was supported by the Science and Innovation Ministry of Spain [AGL2008-
01437/ALI and AGL2006-12210-C03-02/ALI] The authors thank the Project of Research of
University of Navarra (PIUNA Projects) and CAN Foundation (Caja Navarra; “Proyectos: Tú eliges,
tú decides”) for the financial support and grants received

Toxicokinetic and toxicological approach
153
References
Arbillaga, L., Azqueta, A., Ezpeleta, O. and Lopez de Cerain, A., 2007. Oxidative DNA damage
induced by Ochratoxin A in the HK-2 human kidney cell line: evidence of the relationship with cytotoxicity.
Mutagenesis 22, 35-42.
Arbillaga, L., Ezpeleta, O. and Lopez de Cerain, A., 2004. ¿Es la Ocratoxina A una micotoxina
mutagénica? (Is the Ochratoxin A a mutagenic mycotoxine?). Revista de Toxicología 21, 1-10.
Bannasch, P., Benner, U., Enzmann, H. and Hacker, H.J., 1985. Tigroid cell foci and neoplastic nodules
in the liver of rats treated with a single dose of aflatoxin B1. Carcinogenesis 6, 1641-1648.
Bedard, L.L. and Massey, T.E., 2006. Aflatoxin B1-induced DNA damage and its repair. Cancer Lett
241, 174-183.
Bennett, J.W. and Klich, M., 2003. Mycotoxins. Clin Microbiol Rev. 16, 497-516.
Corcuera, L.A., Ibáñez-Vea, M., Vettorazzi, A., González-Peñas, E. López de Cerain, A., 2011.
Validation of a UHPLC-FLD analytical method for the simultaneous quantification of aflatoxin B1 and
ochratoxin a in rat plasma, liver and kidney. J Chromatogr B 879, 2733-2740.
Coronel, M.B., Sanchis, V., Ramos, A.J. and Marin, S., 2010. Review. Ochratoxin A: presence in human
plasma and intake estimation. Food Sci Technol Int 16, 5-18.
Coulombe Jr, R.A. and Sharma, R.P., 1985. Clearance and excretion of intratracheally and orally
administered aflatoxin B1 in the rat. Food Chem Toxicol 23, 827-830.
Cupid, B.C., Lightfoot, T.J., Russell, D., Gant, S.J., Turner, P.C., Dingley, K.H., Curtis, K.D., Leveson,
S.H., Turteltaub3, K.W. and Garner, R.C., 2004. The formation of AFB1-macromolecular adducts in rats and
humans at dietary levels of exposure. Food Chem Toxicol 42, 559-569.
Diehl, K.H., Hull, R., Morton, D., Pfister, R., Rabemampianina, Y., Smith, D., Vidal, J.M. and van de
Vorstenbosch, C., 2001. A good practice guide to the administration of substances and removal of blood,
including routes and volumes. J Appl Toxicol 21, 15-23.
EFSA, 2006. Opinion of the Scientific Panel on Contaminats in the Food Chain on a request from the
commision related to Ochratoxin A in food. EFSA J 365, 1-56.

Chapter 6
154
EFSA, 2007. Opinion of the Scientific Panel on Contaminats in the Food Chain on a request from the
Commission related to the potential increase of consumer health risk by a possible increase of the existing
maximun levels for Aflatoxins in almonds, hazelnuts and pistachios and derived products. EFSA J 446, 1-127.
El-Khatib, H.N., Akeila, M.A. and Abou El-magd, M.K., 1998. The mutagenic activity of aflatoxin B1
in rat bone marrow. Toxicol Lett 95, 176-176.
Ellinger-Ziegelbauer, H., Ahr, H.-J., Gmuender, H., Pallez, C. and Koenig, J., 2006. Characteristic
expression profiles induced by carcinogens in rat liver. Toxicol Lett 164, S293-S294.
EC, 2002. Commission Regulation (EC) No 472/2002 of 12 March 2002 amending Regulation (EC)
No 466/2001 setting maximum levels for certain contaminants in foodstuffs (Text with EEA relevance). L
75/18.
Firmin, S., Gandia, P., Morgavi, D.P., Houin, G., Jouany, J.P., Bertin, G. and Boudra, H., 2010.
Modification of aflatoxin B1 and ochratoxin A toxicokinetics in rats administered a yeast cell wall preparation.
Food Addit Contam 27, 1153-1160.
Huff, W.E., Doerr, J.A., Wabeck, C.J., Chaloupka, G.W., May, J.D. and Merkley, J.W., 1983. Individual
and combined effects of aflatoxin and ochratoxin A on bruising in broiler chickens. Poult Sci 62, 1764-1771.
Huff, W.E. and Doerr, J.A., 1981. Synergism between aflatoxin and ochratoxin A in broiler chickens.
Poult Sci 60, 550-555.
IARC, 1987. IARC Monographs on the Evaluation of Carcinogenic Risks to Humans. Overall
Evaluations of Carcinogenicity: An Updating of IARC Monographs Volumes 1 to 42. Supplement 7, 440.
IARC, 1993. IARC Monographs on the Evaluation of Carcinogenic Risks to Humans. Some Naturally
Occurring Substances: Food Items and Constituents, Heterocyclic Aromatic Amines and Mycotoxins. 56, 33.
IARC, 2002. IARC Monographs on the Evaluation of Carcinogenic Risks to Humans. Some Traditional
Herbal Medicines, Some Mycotoxins, Naphthalene and Styrene. 82, 590.
ICH, 1994. Note for guidance of toxicokinetics: The assessment of systemic exposure in toxicity studies
S3A.
Jubert C., Mata J., Bench, G., Dashwood, R., Pereira, C., Tracewell, W., Turteltaub, K., Williams, D.
and Bailey, G., 2009. Effects of chlorophyll and chlorophyllin on low-dose aflatoxin B (1) pharmacokinetics in
human volunteers. Cancer Prev Res 2 (12), 1015-1022.

Toxicokinetic and toxicological approach
155
Mally, A. and Dekant, W., 2005. DNA adduct formation by ochratoxin A: review of the available
evidence. Food Addit Contam 22 Suppl 1, 65-74.
Mally, A., Pepe, G., Ravoori, S., Fiore, M., Gupta, R.C., Dekant, W. and Mosesso, P., 2005. Ochratoxin
a causes DNA damage and cytogenetic effects but no DNA adducts in rats. Chem Res Toxicol 18, 1253-1261.
Mally, A., Zepnik, H., Wanek, P., Eder, E., Dingley, K., Ihmels, H., Volkel, W. and Dekant, W., 2004.
Ochratoxin A: lack of formation of covalent DNA adducts. Chem Res Toxicol 17, 234-242.
Mantle, P.G., 2008. Interpretation of the pharmacokinetics of ochratoxin A in blood plasma of rats,
during and after acute or chronic ingestion. Food Chem Toxicol 46, 1808-1816.
McLean, M. and Dutton, M.F., 1995. Cellular interactions and metabolism of aflatoxin: An update.
Pharmac Ther 65, 163-192.
NTP, 1989. Toxicology and carcinogenesis studies of ochratoxin A (CAS No 303-47-9) in F344/N rats
(gavage studies). Natl Toxicol Program Tech Rep Ser 358, 1-142.
O'Brien, E. and Dietrich, D.R., 2005. Ochratoxin A: The Continuing Enigma. Crit Rev Toxicol 35, 33-
60.
OECD, 2009. OECD Guidelines for the Testing of Chemicals. Draft proposal for a revised TG417:
Toxicokinetics.
OECD, 1984. OECD Guidelines for the Testing of Chemicals, Number 417: Toxicokinetics.
Raj, H.G., Gupta, K., Rohil, V., Bose, M., Biswas, G., Singh, S.K., Jain, S.C., Parmar, V.S., Olsen, C.E.
and Wengel, J., 1998. Aflatoxin B1-induced micronuclei and cell cycle alterations in lung and bone marrow
cells and their modulation by Piper argyrophyllum extract. Teratog Carcinog Mutagen 18, 249-261.
Ramos, A.J. and Hernandez, E., 1996. In situ absorption of aflatoxins in rat small intestine.
Mycopathologia 134, 27-30.
Rati, E.R., Basappa, S.C., Sreenivasa Murthy, V., Ramesh, H.P., Ramesh, B.S. and Singh, G.B., 1981.
The sinergistic effect of aflatoxin B1 and ochratoxin A in rats. J. Food Scie Tech 18, 176-179.
Ringot, D., Chango, A., Schneider, Y.J. and Larondelle, Y., 2006. Toxicokinetics and toxicodynamics of
ochratoxin A, an update. Chem. Biol. Interact. 159, 18-46.
Chapter 6
156
Smela, M.E., Hamm, M.L., Henderson, P.T., Harris, C.M., Harris, T.M. and Essigmann, J.M., 2002. The
aflatoxin B(1) formamidopyrimidine adduct plays a major role in causing the types of mutations observed in
human hepatocellular carcinoma. Proc Natl Acad Sci USA. 99, 6655-6660.
Smith, G.S., Hall, R.L. and Walker, R.M., 2002. 6 - Applied Clinical Pathology in Preclinical Toxicology
Testing, in: Wanda M. Haschek A2Colin G. Rousseaux and Matthew A. WalligA2 Wanda M. Haschek, Colin
G.Rousseaux, Matthew A. Wallig (Eds). Academic Press, San Diego, pp. 123-156.
Theumer, M.G., Cánepa, M.C., López, A.G., Mary, V.S., Dambolena, J.S. and Rubinstein, H.R., 2010.
Subchronic mycotoxicoses in Wistar rats: Assessment of the in vivo and in vitro genotoxicity induced by
fumonisins and aflatoxin B1, and oxidative stress biomarkers status. Toxicology 268, 104-110.
Turesky, R.J., 2005. Perspective: ochratoxin A is not a genotoxic carcinogen. Chem Res Toxicol 18,
1082-1090.
Vettorazzi, A., Arbillaga, L., Gil, A., González-Peñas, E. and López de Cerain, A., 2007. Influence of
the vehicle in the distribution and accumulation of ochratoxin A after oral administration in F-344 rats. Toxicol
Lett, 172, S204-S190.
Vettorazzi, A., Gonzalez-Penas, E., Troconiz, I.F., Arbillaga, L., Corcuera, L.A., Gil, A.G. and López de
Cerain, A., 2009. A different kinetic profile of ochratoxin A in mature male rats. Food Chem Toxicol 47, 1921-
1927.
Vettorazzi, A., Trocóniz, I.F., Gonzalez-Peñas, E., Corcuera, L.A., Arbillaga, L., Gil, A.G., Nagy, J.M.,
Mantle, P.G. and López de Cerain, A., 2010. Effects of fasting and gender on ochratoxin A toxicokinetics in
F344 rats. Food and Chemical Toxicology 48, 3159-3166.
Vettorazzi, A., de Trocóniz, I.F., González-Peñas, E., Arbillaga, L., Corcuera, L., Gil, A.G. and López
de Cerain, A., 2011. Kidney and liver distribution of ochratoxin A in male and female F344 rats. Food Chem
Toxicol 49, 1935-1942.
Wangikar, P.B., Dwivedi, P. and Sinha, N., 2004. Effect in rats of simultaneous prenatal exposure to
ochratoxin A and aflatoxin B1. I. Maternal toxicity and fetal malformations. Birth defects research.Part B, Dev
Rep Toxicol 71, 343-351.
Wangikar, P.B., Dwivedi, P., Sinha, N., Sharma, A.K. and Telang, A.G., 2005. Teratogenic effects in
rabbits of simultaneous exposure to ochratoxin A and aflatoxin B1 with special reference to microscopic
effects. Toxicology 215, 37-47.

Toxicokinetic and toxicological approach
157
Wong, Z.A. and Hsieh, D.P.H., 1980. The comparative metabolism and toxicokinetics of aflatoxin B1
in the monkey, rat, and mouse. Toxicol Appl Pharmacol 55, 115-125.
Zepnik, H., Völkel, W. and Dekant, W., 2003. Toxicokinetics of the mycotoxin ochratoxin A in F 344
rats after oral administration. Toxicol Appl Pharmacol 192, 36-44.


Ochratoxin A reduces Aflatoxin B1 genotoxicity: Simultaneous application of the
in vivo micronucleus and comet assays
Chapter 7
Laura-Ana Corcuera, Ariane Vettorazzi, Leire Arbillaga, Noemi Pérez,
Jose Antonio García Jalón, Ana Gloria Gil, Elena González-Peñas,
Adela López de Cerain
In preparation

General disscusion
Chapter 8
General discussion

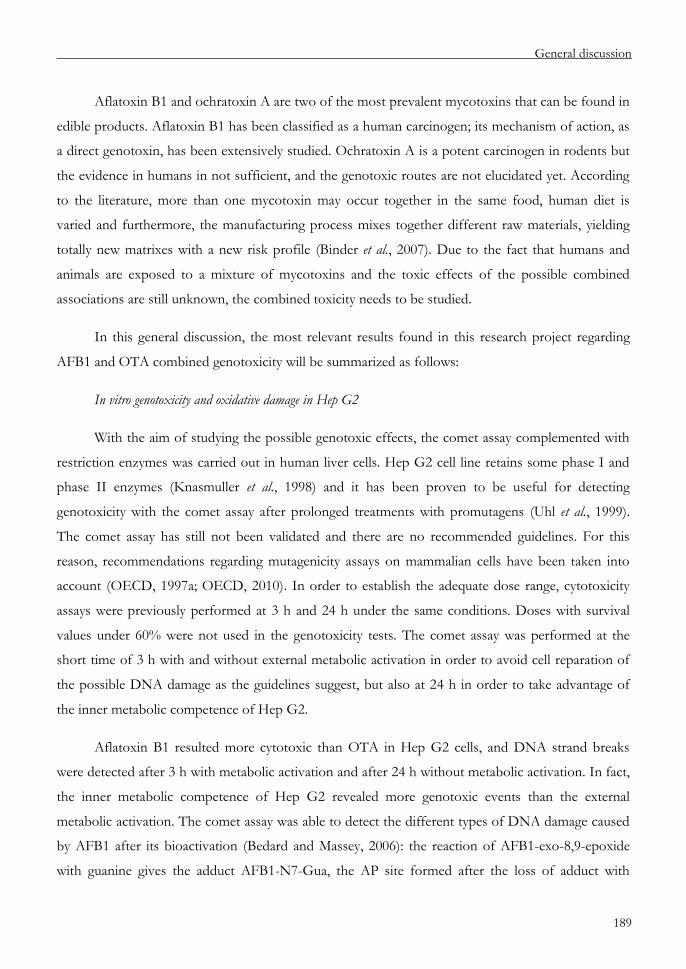
General discussion
189
Aflatoxin B1 and ochratoxin A are two of the most prevalent mycotoxins that can be found in
edible products. Aflatoxin B1 has been classified as a human carcinogen; its mechanism of action, as
a direct genotoxin, has been extensively studied. Ochratoxin A is a potent carcinogen in rodents but
the evidence in humans in not sufficient, and the genotoxic routes are not elucidated yet. According
to the literature, more than one mycotoxin may occur together in the same food, human diet is
varied and furthermore, the manufacturing process mixes together different raw materials, yielding
totally new matrixes with a new risk profile (Binder et al., 2007). Due to the fact that humans and
animals are exposed to a mixture of mycotoxins and the toxic effects of the possible combined
associations are still unknown, the combined toxicity needs to be studied.
In this general discussion, the most relevant results found in this research project regarding
AFB1 and OTA combined genotoxicity will be summarized as follows:
In vitro genotoxicity and oxidative damage in Hep G2
With the aim of studying the possible genotoxic effects, the comet assay complemented with
restriction enzymes was carried out in human liver cells. Hep G2 cell line retains some phase I and
phase II enzymes (Knasmuller et al., 1998) and it has been proven to be useful for detecting
genotoxicity with the comet assay after prolonged treatments with promutagens (Uhl et al., 1999).
The comet assay has still not been validated and there are no recommended guidelines. For this
reason, recommendations regarding mutagenicity assays on mammalian cells have been taken into
account (OECD, 1997a; OECD, 2010). In order to establish the adequate dose range, cytotoxicity
assays were previously performed at 3 h and 24 h under the same conditions. Doses with survival
values under 60% were not used in the genotoxicity tests. The comet assay was performed at the
short time of 3 h with and without external metabolic activation in order to avoid cell reparation of
the possible DNA damage as the guidelines suggest, but also at 24 h in order to take advantage of
the inner metabolic competence of Hep G2.
Aflatoxin B1 resulted more cytotoxic than OTA in Hep G2 cells, and DNA strand breaks
were detected after 3 h with metabolic activation and after 24 h without metabolic activation. In fact,
the inner metabolic competence of Hep G2 revealed more genotoxic events than the external
metabolic activation. The comet assay was able to detect the different types of DNA damage caused
by AFB1 after its bioactivation (Bedard and Massey, 2006): the reaction of AFB1-exo-8,9-epoxide
with guanine gives the adduct AFB1-N7-Gua, the AP site formed after the loss of adduct with
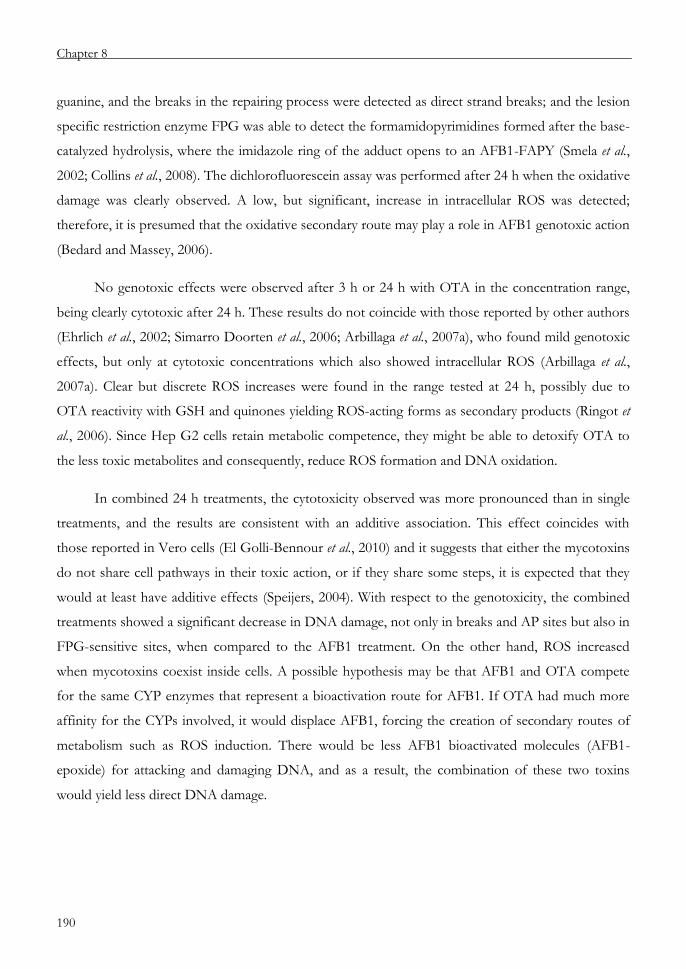
Chapter 8
190
guanine, and the breaks in the repairing process were detected as direct strand breaks; and the lesion
specific restriction enzyme FPG was able to detect the formamidopyrimidines formed after the base-
catalyzed hydrolysis, where the imidazole ring of the adduct opens to an AFB1-FAPY (Smela et al.,
2002; Collins et al., 2008). The dichlorofluorescein assay was performed after 24 h when the oxidative
damage was clearly observed. A low, but significant, increase in intracellular ROS was detected;
therefore, it is presumed that the oxidative secondary route may play a role in AFB1 genotoxic action
(Bedard and Massey, 2006).
No genotoxic effects were observed after 3 h or 24 h with OTA in the concentration range,
being clearly cytotoxic after 24 h. These results do not coincide with those reported by other authors
(Ehrlich et al., 2002; Simarro Doorten et al., 2006; Arbillaga et al., 2007a), who found mild genotoxic
effects, but only at cytotoxic concentrations which also showed intracellular ROS (Arbillaga et al.,
2007a). Clear but discrete ROS increases were found in the range tested at 24 h, possibly due to
OTA reactivity with GSH and quinones yielding ROS-acting forms as secondary products (Ringot et
al., 2006). Since Hep G2 cells retain metabolic competence, they might be able to detoxify OTA to
the less toxic metabolites and consequently, reduce ROS formation and DNA oxidation.
In combined 24 h treatments, the cytotoxicity observed was more pronounced than in single
treatments, and the results are consistent with an additive association. This effect coincides with
those reported in Vero cells (El Golli-Bennour et al., 2010) and it suggests that either the mycotoxins
do not share cell pathways in their toxic action, or if they share some steps, it is expected that they
would at least have additive effects (Speijers, 2004). With respect to the genotoxicity, the combined
treatments showed a significant decrease in DNA damage, not only in breaks and AP sites but also in
FPG-sensitive sites, when compared to the AFB1 treatment. On the other hand, ROS increased
when mycotoxins coexist inside cells. A possible hypothesis may be that AFB1 and OTA compete
for the same CYP enzymes that represent a bioactivation route for AFB1. If OTA had much more
affinity for the CYPs involved, it would displace AFB1, forcing the creation of secondary routes of
metabolism such as ROS induction. There would be less AFB1 bioactivated molecules (AFB1-
epoxide) for attacking and damaging DNA, and as a result, the combination of these two toxins
would yield less direct DNA damage.

General discussion
191
In vitro protection against oxidative damage
Natural constituents such as polyphenols have been widely studied as protectors against
cytotoxicity and oxidative damage caused by exposure to harmful substances. With respect to
mycotoxins, polyphenol protection evidence is not conclusive. Muto et al. (2001) found that
epicatechin (EC) partially inhibited the bioactivation of AFB1 in CYPs expressing bacteria. However,
Lee et al. (2005) could not find any inhibition in the epoxide synthesis when AFB1 was mixed with
mouse liver microsomal proteins and catechins. Costa et al. (2007) found excellent protective effects
of catechin derivatives against OTA cytotoxicity, acting as good ROS scavengers in a pig kidney cell
line (LLC-PK1). However, Hundhausen et al. (2005) found no protection from OTA induced
cytotoxicity in Hep G2 cells.
A polyphenol-enriched extract (PECE) was obtained from cocoa seeds. The extract contained
the highest proportion of epicatechin procyanidins compared to other phenolic extracts from plant
sources (Touriño et al., 2005; Jerez et al., 2007; Touriño et al., 2008; Touriño et al., 2011), and it
showed effective antiradical activity in cell-free systems. These antioxidant properties encouraged us
to test the extract in a biological system (Hep G2 cell line). The PECE, like other extracts with non-
galloylated procyanidin oligomers (Ugartondo et al., 2007), was a weak cytotoxic mixture (at the limit
of solubility, cell survival was higher than 55%) and induced ROS only at cytotoxic concentrations
(cell survival less than 80%). Therefore, it was selected as a promising antioxidant candidate for
reducing the damage produced by AFB1 and OTA.
With regard to AFB1, the PECE did not reduce the cytotoxicity. Moreover, the PECE was
not very effective on ROS scavenging and only reduced the ROS levels at the highest concentration
with 50 mg/L. This may indicate that radical formation is not the principal mechanism of AFB1
cytotoxicity, although it does play a role as a secondary route of action (Bedard and Massey, 2006).
With regard to OTA treatments, both in isolated and combined treatments with AFB1, cell survival
improved. Coinciding with this, PECE was very effective reducing ROS formation in all of the OTA
and combined treatments, showing that OTA ROS induction is directly related with its cytotoxicity
(Arbillaga et al., 2007a; Arbillaga et al., 2007b). Surprisingly, the greatest reduction of ROS was
observed with the “prooxidant” concentration of 50 mg/L. This observation highlights the dual pro-
oxidant/antioxidant activity of the molecules with multiple phenol units according to the redox
properties of the molecules that interact with them. Therefore, polyphenols extracted from cocoa

Chapter 8
192
have a good antioxidant activity and may be efficient in reducing the generation of ROS produced by
mycotoxins or other oxidant agents.
In vivo toxicity: toxicokinetic approach and combined genotoxicity
In order to give a global response regarding the genotoxicity in vivo of AFB1 or OTA alone
and combined, it is essential to answer more questions than just in the cases where there is DNA
damage after the treatments. It is important to describe the general status of the animals. In addition,
the serum biochemical parameters may give clues regarding how organs have been affected and the
histopathological status of target organs may show the kind of cellular damage that has occurred
during molecule metabolism. The ICH guideline S3A highlights the need to integrate toxicokinetics
into toxicity testing, which should aid in the interpretation of the toxicology findings (ICH, 1994).
Basic toxicokinetic parameters provide information on the potential for accumulation of the test
substance in tissues and/or organs and the potential for induction of biotransformation (OECD,
2009). Moreover, in our opinion, the DNA damage should be studied not only in bone marrow or
lymphocytes but also in expected target tissues.
In order to determine the genotoxicity of AFB1, OTA, and the combination of both, it was
decided to first study the toxicity and the toxicokinetic behavior of the mixture, because there was no
previous data available regarding the possible interactions during absorption, metabolism or toxic
effects. It is essential to use well defined and fully validated analytical methods in order to obtain
reliable results that can be satisfactorily interpreted (Bressolle et al., 1996).
Validation of a method for quantifying AFB1 and OTA in plasma and tissues
A rapid and simple method for the simultaneous quantification of AFB1 and OTA in rat
plasma, liver and kidney by UHPLC-FLD has been successfully set up and validated. The extraction
method, calibration curves and chromatographic conditions were common for the three matrices.
The sampling has been inspired from the work described by Vettorazzi et al. (2008) for
detecting OTA in plasma, liver and kidney of rats. Once the samples were collected, the mycotoxins
were extracted satisfactorily with a mixture of ACN:formic acid (99:1) in a ratio 1:3 (1 part of sample:
3 parts of extracting mixture). The simultaneous extraction has been achieved only starting from
100 µL of plasma or 25 mg of tissue and covering a range for AFB1 and OTA equivalent to 2-
6,000 µg/L in rat plasma and 8-2,400 µg/kg in rat kidney and liver. Only one solvent step extraction
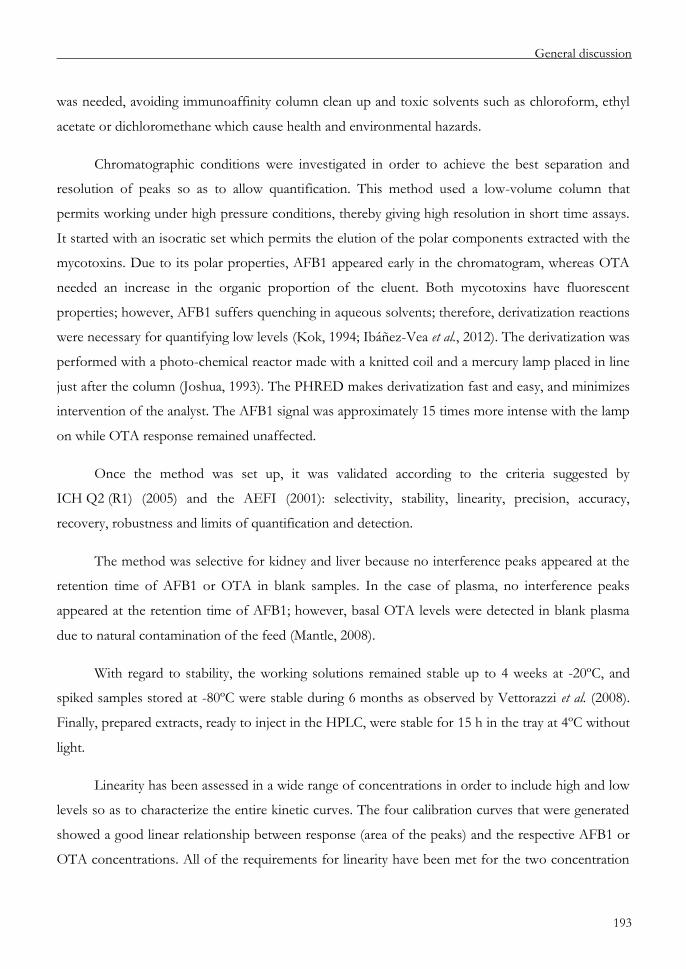
General discussion
193
was needed, avoiding immunoaffinity column clean up and toxic solvents such as chloroform, ethyl
acetate or dichloromethane which cause health and environmental hazards.
Chromatographic conditions were investigated in order to achieve the best separation and
resolution of peaks so as to allow quantification. This method used a low-volume column that
permits working under high pressure conditions, thereby giving high resolution in short time assays.
It started with an isocratic set which permits the elution of the polar components extracted with the
mycotoxins. Due to its polar properties, AFB1 appeared early in the chromatogram, whereas OTA
needed an increase in the organic proportion of the eluent. Both mycotoxins have fluorescent
properties; however, AFB1 suffers quenching in aqueous solvents; therefore, derivatization reactions
were necessary for quantifying low levels (Kok, 1994; Ibáñez-Vea et al., 2012). The derivatization was
performed with a photo-chemical reactor made with a knitted coil and a mercury lamp placed in line
just after the column (Joshua, 1993). The PHRED makes derivatization fast and easy, and minimizes
intervention of the analyst. The AFB1 signal was approximately 15 times more intense with the lamp
on while OTA response remained unaffected.
Once the method was set up, it was validated according to the criteria suggested by
ICH Q2 (R1) (2005) and the AEFI (2001): selectivity, stability, linearity, precision, accuracy,
recovery, robustness and limits of quantification and detection.
The method was selective for kidney and liver because no interference peaks appeared at the
retention time of AFB1 or OTA in blank samples. In the case of plasma, no interference peaks
appeared at the retention time of AFB1; however, basal OTA levels were detected in blank plasma
due to natural contamination of the feed (Mantle, 2008).
With regard to stability, the working solutions remained stable up to 4 weeks at -20ºC, and
spiked samples stored at -80ºC were stable during 6 months as observed by Vettorazzi et al. (2008).
Finally, prepared extracts, ready to inject in the HPLC, were stable for 15 h in the tray at 4ºC without
light.
Linearity has been assessed in a wide range of concentrations in order to include high and low
levels so as to characterize the entire kinetic curves. The four calibration curves that were generated
showed a good linear relationship between response (area of the peaks) and the respective AFB1 or
OTA concentrations. All of the requirements for linearity have been met for the two concentration
Chapter 8
194
intervals of each mycotoxin. Precision (RSD) and accuracy (SE) of the linearity showed adequate
values, less than 10% in the whole interval (at the LOQ level, less than 15%).
The recovery for each matrix was very efficient, between 93 - 96% for AFB1 and between 94-
96% for OTA. Moreover, the RSDs obtained in the within-day and between-day experiments were
below 10% in each case (at the LOQ level, below 15%), thereby demonstrating the precision of the
analytical procedure. The recovery obtained in this method for AFB1 was successful for every matrix
and higher than in other HPLC methods found in the reference literature (Gregory, 1982; Lamplugh,
1983a; Lamplugh, 1983b). In terms of OTA, the recovery was consistent with other methods used
for its analysis in plasma or serum (Vettorazzi et al., 2008; Zepnik et al., 2003), or higher in liver and
kidney (Vettorazzi et al., 2008; Zepnik et al., 2003; De Saeger et al., 2004).
For both mycotoxins, the LOQs were 2 µg/L in plasma and 8 µg/kg in liver and kidney; they
were similar to or better than others found in the reference literature for HPLC methods or
radioactivity detection which used 2 to 100 times more sample volume (Vettorazzi et al., 2008;
Gregory, 1982; Lamplugh, 1983a; Lamplugh, 1983b; De Saeger et al., 2004; Valenta, 1998; Coulombe
and Sharma, 1985). The calculated LODs for AFB1 were as follows: 0.1 µg/L in plasma and
0.01 µg/kg in kidney and liver; the calculated LODs for OTA were: 0.3 µg/L in plasma and
0.01 µg/kg in kidney and liver.
In the study of robustness, changes in the column batch, the pressure or the column
temperature modified the retention times of the peaks but did not affect the quantification.
However, an increase in the pH yielded a decrease in the OTA signal, whereas AFB1 signal remained
stable. OTA has been described as a weak acid and it is important to maintain a pH below 4.4 in
order to assure that the OTA molecule is in its protonated form (Valenta, 1998). Moreover, it is very
important to keep samples in the dark once when they are obtained or being manipulated due to the
fact that AFB1 degrades easily when exposed to light.
The method was successfully applied to real samples obtained from rats that received a
mixture of AFB1 and OTA (0.5 mg/kg bw of AFB1 and 0.1 mg/kg bw of OTA) in a single dose by
oral gavage. Therefore, the analytical method was suitable for the simultaneous detection and
quantification of both mycotoxins during toxicokinetic and toxicological studies.

General discussion
195
Toxicokinetic approach of the combination of mycotoxins
There are no previous in vivo studies regarding the possible interactions between AFB1 and
OTA regarding their absorption, metabolism or elimination. This study intended to obtain data
regarding the toxicity of AFB1 and OTA when they are administered together, to give some basic
kinetic parameters, and to determine if either of the toxins interacts in the kinetics of the other.
Fisher 344 rats were administered a mixture 0.25 mg/kg bw of AFB1 and 0.5 mg/kg bw of OTA
which corresponds approximately to the 3% of the LD50 of each mycotoxin alone. Samples were
collected from 10 min up to 96 h.
Although there were no signs of general toxicity during the experiment, the biochemical and
the histopathological results pointed to acute toxicity in liver. However, the liver started a repairing
process after 72 h. Its effects were evident because the transaminases (ALT, AST), which rose
significantly in 24 h, almost returned to normal values after 96 h. Moreover, at that time, the
regenerative phenomena were evident by the numerous binucleated cells that were present. These
findings were consistent with the observations made by Rati et al. (1981) regarding acute toxicity of
AFB1, and it appeared that the AFB1 and/or its toxic metabolites were eliminated (metabolized and
excreted) in a range of 48 - 96 h. No remarkable toxicity was observed in kidneys or immunological
organs (spleen, thymus and Peyer’s patches) so mycotoxins did not cause acute toxicity at this dose,
as expected. In conclusion, the acute toxic effects observed after the combined treatment of AFB1
and OTA were mostly due to AFB1.
With regard to the evident signs of toxicity in liver, high AFB1 levels might have been
expected in plasma and liver at least at the collected early time points and detectable levels in plasma
during at least 72 h. Previous studies of AFB1 kinetics in rats described a two-compartment model
with long plasma half lives higher than 50 hours after quantifying AFB1 alone or mixed with its
metabolites (Coulombe and Sharma, 1985; Firmin et al., 2010). However, the absorption of AFB1
was very fast and it was rapidly metabolized. Only an astonishing 1% of the dose was found in
plasma after 10 min and 0.4% was found after 30 min, with the liver levels lower than the LOQ
(8 µg/kg) (Corcuera et al., 2011b) at all times, and AFB1 was undetectable in kidney. Moreover,
almost none of the un-metabolized AFB1 was distributed in plasma outside the liver to the kidneys.
In the plasma chromatograms, new peaks appeared in the front that could be related with AFB1
metabolites because they have not been detected in recent OTA kinetic studies (Vettorazzi et al.,
2007; Vettorazzi et al., 2009; Vettorazzi et al., 2011) or during the validation of the method with

Chapter 8
196
spiked plasma samples. The new peaks had a maximum at 30 min, decreased in a time-dependent
way until 24 h, and then were undetectable. Unfortunately, the front peaks of liver and kidney
samples were too big to be able to find little increases of the metabolites. Our observations described
an extremely fast uptake and metabolism of AFB1 which is completely metabolized in 30 min and
eliminated in 24 h. In humans, Jubert et al. (2009) observed a rapid uptake (Tmax = 1 h), and urinary
elimination of 95% of the dose in 24 h, which is more consistent with our findings; in this work, they
were not able to differentiate between AFB1 and its metabolites.
The OTA concentration profiles in plasma, liver and kidney and some of the kinetic
parameters are similar to the ones that Vettorazzi et al. (2010) obtained under the same conditions of
this experiment but only with OTA. The maximum concentration in plasma was obtained after 2 h
and corresponded to 87% of the initial dose that was similar to the 83% that Vettorazi et al. (2010)
reported. However, an apparent delay in the elimination of OTA resulted in a higher plasma half-life.
This event might be explained because the liver had suffered acute damage which had affected its
functions in the metabolism of OTA, and the OTA elimination occurs mainly in the liver
compartment. In this case, higher doses of OTA (when compared to OTA alone) would have been
expected in plasma, liver and kidney. However, no significant differences were observed in tissues
after 24 h between OTA alone and OTA administered with AFB1. Upon comparing the OTA
profile obtained with other experiments and models of OTA kinetics, the differences in the OTA
elimination could be related more to the age and the sex of the rats than to the presence of AFB1 in
the system (Vettorazzi et al., 2007; Vettorazzi et al., 2010; Vettorazzi et al., 2011).
Combined genotoxicity in vivo
The ICH S2 (R1) draft guideline on genotoxicity testing and data interpretation recommends
integrating in vivo genotoxicity assays into preclinical toxicity studies when the dose levels are
justifiable and the protocols are compatible (ICH, 2011). Moreover, if several in vivo genotoxicity
tests could be integrated into one single study; this would reduce animal use. With this aim, the in vivo
micronucleus assay in bone marrow and the in vivo comet assay in liver and kidney have been
performed. Going a step forward, in this study, general toxicity and organ exposure data were taken
into account in order to give a wider perspective of the results.
In the previous study, the toxicokinetic profile of a single oral dose of AFB1+OTA was
studied. It showed that the absorption of AFB1 was extremely fast, the metabolism occurred

General discussion
197
exclusively in liver, and its metabolites were excreted in 24 h. With regard to OTA, this mycotoxin
was also rapidly absorbed, followed by a long elimination process with high levels in plasma and
tissues during more than 96 h. General liver deterioration was observed but there was no toxicity in
kidney or any other organs. All these signs suggested mild acute toxicity due to AFB1. This valuable
information helped us to design the dose range and the time endpoints of the in vivo genotoxicity
tests.
Although Bowen et al. (2011) suggested a design for the comet and MN assays giving three
repeated administrations (0, 24, 45 h), in this study the mycotoxins, alone or combined, were
administered only once, because we tried to avoid excessive acute toxicity in the liver. Excessive
toxicity can confound the ability to determine genotoxicity in the comet assay (Vasquez, 2010). The
OECD guideline suggests using both sexes (OECD, 1997b), but this study was carried out using
only male rats due to the following reasons: Madle et al. (2005) observed that AFB1 induced more
MN in male rats and mice than in females and OTA is more carcinogenic in male rodents
(Castegnaro et al., 1998; EFSA, 2006). One oral dose of AFB1 (0.25 mg/kg bw), OTA
(0.5 mg/kg bw) or the mixture was administered to F344 rats. After 3 h or 24 h, samples were
collected in order to perform the comet assay in liver and kidney and the micronucleus test in bone
marrow, and so as to check the biochemical status in plasma and to study the histopathological
changes in liver and kidney. In addition, samples of liver and kidney were saved in order to perform
microarray analysis on the gene expression changes occurring during the treatments, but this study is
still in progress and it is not a part of this thesis.
No signs of general toxicity were observed but the biochemical analysis revealed mild acute
liver damage after 24 h in the groups treated with AFB1 as expected. Surprisingly, the biochemical
liver alterations were more pronounced when AFB1 was administered alone than when it was co-
administered with OTA. The histopathological findings revealed necrosis and inflammation in the
livers of rats treated with AFB1 alone or combined, and once more, the liver damage was less
pronounced in the combined treated samples. A decrease in the absorption or distribution of
mycotoxins was discarded because plasma and tissue levels were similar at 3 h and 24 h in groups
treated with one or both mycotoxins and consistent with the toxicokinetic study and other published
data (Vettorazzi et al., 2009; Vettorazzi et al., 2011). Therefore, the reduced toxic effects might be due
to changes in the bioactivation and/or metabolism of AFB1 as was suggested in the case of in vitro
experiments using human liver cells (Hep G2) (Corcuera et al., 2011a).
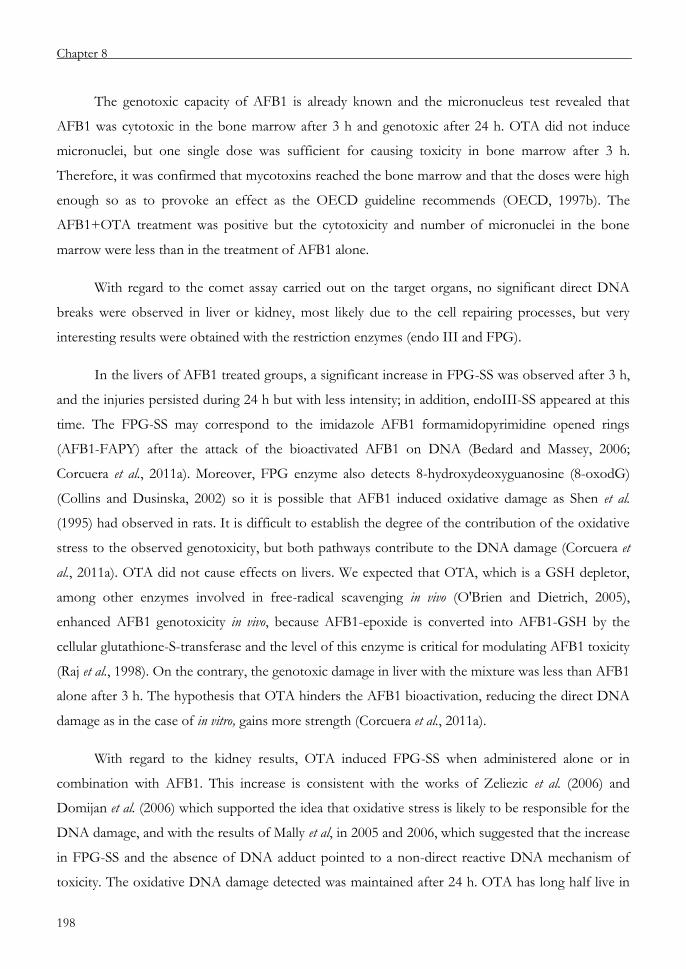
Chapter 8
198
The genotoxic capacity of AFB1 is already known and the micronucleus test revealed that
AFB1 was cytotoxic in the bone marrow after 3 h and genotoxic after 24 h. OTA did not induce
micronuclei, but one single dose was sufficient for causing toxicity in bone marrow after 3 h.
Therefore, it was confirmed that mycotoxins reached the bone marrow and that the doses were high
enough so as to provoke an effect as the OECD guideline recommends (OECD, 1997b). The
AFB1+OTA treatment was positive but the cytotoxicity and number of micronuclei in the bone
marrow were less than in the treatment of AFB1 alone.
With regard to the comet assay carried out on the target organs, no significant direct DNA
breaks were observed in liver or kidney, most likely due to the cell repairing processes, but very
interesting results were obtained with the restriction enzymes (endo III and FPG).
In the livers of AFB1 treated groups, a significant increase in FPG-SS was observed after 3 h,
and the injuries persisted during 24 h but with less intensity; in addition, endoIII-SS appeared at this
time. The FPG-SS may correspond to the imidazole AFB1 formamidopyrimidine opened rings
(AFB1-FAPY) after the attack of the bioactivated AFB1 on DNA (Bedard and Massey, 2006;
Corcuera et al., 2011a). Moreover, FPG enzyme also detects 8-hydroxydeoxyguanosine (8-oxodG)
(Collins and Dusinska, 2002) so it is possible that AFB1 induced oxidative damage as Shen et al.
(1995) had observed in rats. It is difficult to establish the degree of the contribution of the oxidative
stress to the observed genotoxicity, but both pathways contribute to the DNA damage (Corcuera et
al., 2011a). OTA did not cause effects on livers. We expected that OTA, which is a GSH depletor,
among other enzymes involved in free-radical scavenging in vivo (O'Brien and Dietrich, 2005),
enhanced AFB1 genotoxicity in vivo, because AFB1-epoxide is converted into AFB1-GSH by the
cellular glutathione-S-transferase and the level of this enzyme is critical for modulating AFB1 toxicity
(Raj et al., 1998). On the contrary, the genotoxic damage in liver with the mixture was less than AFB1
alone after 3 h. The hypothesis that OTA hinders the AFB1 bioactivation, reducing the direct DNA
damage as in the case of in vitro, gains more strength (Corcuera et al., 2011a).
With regard to the kidney results, OTA induced FPG-SS when administered alone or in
combination with AFB1. This increase is consistent with the works of Zeliezic et al. (2006) and
Domijan et al. (2006) which supported the idea that oxidative stress is likely to be responsible for the
DNA damage, and with the results of Mally et al, in 2005 and 2006, which suggested that the increase
in FPG-SS and the absence of DNA adduct pointed to a non-direct reactive DNA mechanism of
toxicity. The oxidative DNA damage detected was maintained after 24 h. OTA has long half live in

General discussion
199
plasma and high apparent volume of distribution and these two facts may account for prolonged
exposure of cells to the oxidative effects of OTA. No DNA damage was observed in the kidneys of
the AFB1 treated groups, and OTA oxidative damage in kidney was not modified by the presence of
AFB1, so we could say that the oxidative damage observed in kidneys was mostly due to OTA. OTA
did not induce MN in bone marrow although it was cytotoxic in that organ and it induced DNA
oxidative damage in kidney, its target organ.
In conclusion, AFB1 was positive for the bone marrow MN assay and OTA was negative. Co-
exposure reduced both general toxicity and genotoxicity. In target organs, AFB1 increased FPG-SS
in liver and OTA had a similar effect in kidney. Co-exposure decreased AFB1 effect on liver but had
no effect on kidney. Therefore, it has been demonstrated that simultaneous exposure to both
mycotoxins modifies toxic effects. Moreover, the combination of classical genotoxicity tests such as
the MN assay and new techniques such as the comet assay, which can be applied to tissues other
than bone marrow or blood, gives complementary results. This contributes to the 3Rs strategy by
increasing the information that can be obtained from a single animal experiment, and also improves
the risk assessment process by producing results that can be interpreted in a more rational way.

Chapter 8
200
References
Arbillaga, L., Azqueta, A., Ezpeleta, O. and López de Cerain, A., 2007a. Oxidative DNA damage
induced by Ochratoxin A in the HK-2 human kidney cell line: evidence of the relationship with cytotoxicity.
Mutagenesis 22, 35-42.
Arbillaga, L., Azqueta, A., van Delft, J.M. and López de Cerain, A., 2007b. In vitro gene expression data
supporting a DNA non-reactive genotoxic mechanism for ochratoxin A. Toxicol Appl Pharmacol 220, 216-
224.
Asociación Española de Farmacéuticos de la Industria (AEFI), 2001. Validación de Métodos Analíticos.
Bedard, L.L. and Massey, T.E., 2006. Aflatoxin B1-induced DNA damage and its repair. Cancer Lett
241, 174-183.
Binder, E.M., Tan, L.M., Chin, L.J., Handl, J. and Richard, J., 2007. Worldwide occurrence of
mycotoxins in commodities, feeds and feed ingredients. Anim Feed Sci Technol 137, 265-282.
Bowen, D.E., Whitwell, J.H., Lillford, L., Henderson, D., Kidd, D., Mc Garry, S., Pearce, G., Beevers,
C. and Kirkland, D.J., 2011. Evaluation of a multi-endpoint assay in rats, combining the bone-marrow
micronucleus test, the Comet assay and the flow-cytometric peripheral blood micronucleus test. Mutat Res-
Gen Tox En 722, 7-19.
Bressolle, F., Bromet-Petit, M. and Audran, M., 1996. Validation of liquid chromatographic and gas
chromatographic methods Applications to pharmacokinetics. Chromatogr B 686, 3-10.
Castegnaro, M., Mohr, U., Pfohl-Leszkowicz, A., Estève, J., Steinmann, J., Tillmann, T., Michelon, J.
and Bartsch, H., 1998. Sex and strain specific induction of renal tumors by ochratoxin A in rats correlates with
DNA adduction. Int J Cancer 77, 70-75.
Collins, A.R. and Dusinska, M., 2002. Oxidation of cellular DNA measured with the comet assay.
Methods Mol. Biol. 186, 147-159.
Collins, A.R., Oscoz, A.A., Brunborg, G., Gaivao, I., Giovannelli, L., Kruszewski, M., Smith, C.C. and
Stetina, R., 2008. The comet assay: topical issues. Mutagenesis 23, 143-151.
Corcuera, L.A., Arbillaga, L., Vettorazzi, A., Azqueta, A. and López de Cerain, A., 2011a. Ochratoxin A
reduces aflatoxin B1 induced DNA damage detected by the comet assay in Hep G2 cells. Food and Chemical
Toxicology 49, 2883-2889.
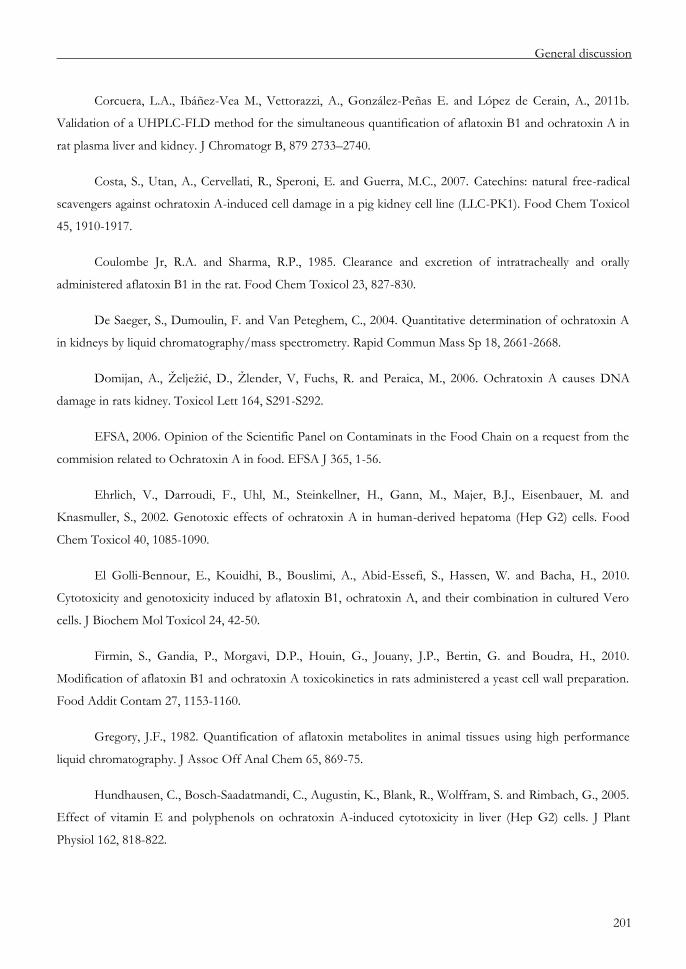
General discussion
201
Corcuera, L.A., Ibáñez-Vea M., Vettorazzi, A., González-Peñas E. and López de Cerain, A., 2011b.
Validation of a UHPLC-FLD method for the simultaneous quantification of aflatoxin B1 and ochratoxin A in
rat plasma liver and kidney. J Chromatogr B, 879 2733–2740.
Costa, S., Utan, A., Cervellati, R., Speroni, E. and Guerra, M.C., 2007. Catechins: natural free-radical
scavengers against ochratoxin A-induced cell damage in a pig kidney cell line (LLC-PK1). Food Chem Toxicol
45, 1910-1917.
Coulombe Jr, R.A. and Sharma, R.P., 1985. Clearance and excretion of intratracheally and orally
administered aflatoxin B1 in the rat. Food Chem Toxicol 23, 827-830.
De Saeger, S., Dumoulin, F. and Van Peteghem, C., 2004. Quantitative determination of ochratoxin A
in kidneys by liquid chromatography/mass spectrometry. Rapid Commun Mass Sp 18, 2661-2668.
Domijan, A., Želježić, D., Žlender, V, Fuchs, R. and Peraica, M., 2006. Ochratoxin A causes DNA
damage in rats kidney. Toxicol Lett 164, S291-S292.
EFSA, 2006. Opinion of the Scientific Panel on Contaminats in the Food Chain on a request from the
commision related to Ochratoxin A in food. EFSA J 365, 1-56.
Ehrlich, V., Darroudi, F., Uhl, M., Steinkellner, H., Gann, M., Majer, B.J., Eisenbauer, M. and
Knasmuller, S., 2002. Genotoxic effects of ochratoxin A in human-derived hepatoma (Hep G2) cells. Food
Chem Toxicol 40, 1085-1090.
El Golli-Bennour, E., Kouidhi, B., Bouslimi, A., Abid-Essefi, S., Hassen, W. and Bacha, H., 2010.
Cytotoxicity and genotoxicity induced by aflatoxin B1, ochratoxin A, and their combination in cultured Vero
cells. J Biochem Mol Toxicol 24, 42-50.
Firmin, S., Gandia, P., Morgavi, D.P., Houin, G., Jouany, J.P., Bertin, G. and Boudra, H., 2010.
Modification of aflatoxin B1 and ochratoxin A toxicokinetics in rats administered a yeast cell wall preparation.
Food Addit Contam 27, 1153-1160.
Gregory, J.F., 1982. Quantification of aflatoxin metabolites in animal tissues using high performance
liquid chromatography. J Assoc Off Anal Chem 65, 869-75.
Hundhausen, C., Bosch-Saadatmandi, C., Augustin, K., Blank, R., Wolffram, S. and Rimbach, G., 2005.
Effect of vitamin E and polyphenols on ochratoxin A-induced cytotoxicity in liver (Hep G2) cells. J Plant
Physiol 162, 818-822.

Chapter 8
202
Ibáñez-Vea, M., González-Peñas, E., Lizarraga, E. and López de Cerain, A., 2012. Co-occurrence of
aflatoxins, ochratoxin A and zearalenone in barley from a northern region of Spain. Food Chem. 132, 35-42.
ICH, 1994. Note for guidance of toxicokinetics: The assessment of systemic exposure in toxicity studies
S3A.
ICH, 2005. ICH Harmonised Tripartite Guideline, Q2(R1): Validation of Analitical Procedures: Text
and Methodology, International Conference of Harmonisation of Technical Requirements for Registration of
Pharmaceutical for Human Use.
ICH, 2011. Guidance on genotoxicity testing and data interpretation for pharmaceuticals intended for
human use S2 R1.
Jerez, M., Touriño, S., Sineiro, J., Torres, J.L. and Núñez, M.J., 2007. Procyanidins from pine bark:
Relationships between structure, composition and antiradical activity. Food Chem 104, 518-527.
Joshua, H., 1993. Determination of aflatoxins by reversed-phase high-performance liquid
chromatography with post-column in-line photochemical derivatization and fluorescence detection. J
Chromatog A 654, 247-254.
Jubert C., Mata J., Bench, G., Dashwood, R., Pereira, C., Tracewell, W., Turteltaub, K., Williams, D.
and Bailey, G., 2009. Effects of chlorophyll and chlorophyllin on low-dose aflatoxin B (1) pharmacokinetics in
human volunteers. Cancer Prev Res 2 (12), 1015-1022.
Knasmuller, S., Parzefall, W., Sanyal, R., Ecker, S., Schwab, C., Uhl, M., Mersch-Sundermann, V.,
Williamson, G., Hietsch, G., Langer, T., Darroudi, F. and Natarajan, A.T., 1998. Use of metabolically
competent human hepatoma cells for the detection of mutagens and antimutagens. Mutat Res 402, 185-202.
Kok, W.T., 1994. Derivatization reactions for the determination of aflatoxins by liquid chromatography
with fluorescence detection. J Chromatogr B 659, 127-137.
Lamplugh, S.M., 1983a. Analysis of aflatoxins in human sera, urine and liver. Clin Biochem 16, 371-371.
Lamplugh, S.M., 1983b. Comparison of three methods for the extraction of aflatoxins from human
serum in combination with a high-performance liquid chromatographic assay. J Chromatogr B 273, 442-448.
Lee, J.K., Choi, E.H., Lee, K.G. and Chun, H.S., 2005. Alleviation of aflatoxin B1-induced oxidative
stress in HepG2 cells by volatile extract from Allii Fistulosi Bulbus. Life Sci 77, 2896-2910.
General discussion
203
Madle, E., Korte, A. and Beek, B., 2005. Species differences in mutagenicity testing: I. Micronucleus
and SCE tests in rats, mice, and Chinese hamsters with aflatoxin B1. Teratog Carcinog Mutagen 6, 1-13.
Mally, A., Pepe, G., Ravoori, S., Fiore, M., Gupta, R.C., Dekant, W. and Mosesso, P., 2005. Ochratoxin
a causes DNA damage and cytogenetic effects but no DNA adducts in rats. Chem Res Toxicol 18, 1253-1261.
Mally, A., Zepnik, H., Wanek, P., Eder, E., Dingley, K., Ihmels, H., Volkel, W. and Dekant, W., 2004.
Ochratoxin A: lack of formation of covalent DNA adducts. Chem Res Toxicol 17, 234-242.
Mantle, P., 2008. Interpretation of the pharmacokinetics of ochratoxin A in blood plasma of rats,
during and after acute or chronic ingestion. Food Chem Toxicol 46, 1808-1816.
Muto, S., Fujita, K., Yamazaki, Y. and Kamataki, T., 2001. Inhibition by green tea catechins of
metabolic activation of procarcinogens by human cytochrome P450. Mutat Res 479, 197-206.
O'Brien, E. and Dietrich, D.R., 2005. Ochratoxin A: The Continuing Enigma. Crit Rev Toxicol 35, 33.
OECD, 1997a. Guideline for the testing of chemicals 473: In vitro Mammalian Chromosome Aberration
Test. OECD guideline.
OECD, 1997b. Guideline for the testing of chemicals 474: Mammalian Erythrocyte Micronucleus Test.
OECD guideline.
OECD, 2009. Guidelines for the Testing of Chemicals. Draft proposal for a revised TG417:
Toxicokinetics.
OECD, 2010. Guideline for the testing of chemicals 487: In vitro Mammalian Cell Micronucleus Test.
OECD guideline.
Raj, H.G., Gupta, K., Rohil, V., Bose, M., Biswas, G., Singh, S.K., Jain, S.C., Parmar, V.S., Olsen, C.E.
and Wengel, J., 1998. Aflatoxin B1-induced micronuclei and cell cycle alterations in lung and bone marrow
cells and their modulation by Piper argyrophyllum extract. Teratog Carcinog Mutagen 18, 249-261.
Rati, E.R., Basappa, S.C., Sreenivasa Murthy, V., Ramesh, H.P., Ramesh, B.S. and Singh, G.B., 1981.
The sinergistic effect of aflatoxin B1 and ochratoxin A in rats. J Food Scie Tech 18, 176-179.
Ringot, D., Chango, A., Schneider, Y.J. and Larondelle, Y., 2006. Toxicokinetics and toxicodynamics of
ochratoxin A, an update. Chem Biol Interact 159, 18-46.
Shen, H.M., Ong, C.N., Lee, B.L. and Shi, C.Y., 1995. Aflatoxin B1-induced 8-hydroxydeoxyguanosine
formation in rat hepatic DNA. Carcinogenesis 16, 419-422.

Chapter 8
204
Simarro Doorten, Y.S., Nijmeijer, S., de Nijs-Tjon, L. and Fink-Gremmels, J., 2006. Metabolism-
mediated Ochratoxin A genotoxicity in the single-cell gel electrophoresis (Comet) assay. Food Chem Toxicol
44, 261-270.
Smela, M.E., Hamm, M.L., Henderson, P.T., Harris, C.M., Harris, T.M. and Essigmann, J.M., 2002. The
aflatoxin B(1) formamidopyrimidine adduct plays a major role in causing the types of mutations observed in
human hepatocellular carcinoma. Proc Natl. Acad Sci USA 99, 6655-6660.
Speijers, G.J.A., 2004. Combined toxic effects of mycotoxins. Toxicol Lett 153, 91.
Touriño, S., Perez-Jiménez, J., Mateos-Martín, M.L., Fuguet, E., Vinardel, M.P., Cascante, M. and
Torres, J.L., 2011. Metabolites in Contact with the Rat Digestive Tract after Ingestion of a Phenolic-Rich
Dietary Fiber Matrix. J Agric Food Chem 59, 5955-5963.
Touriño, S., Lizarraga, D., Carreras, A., Lorenzo, S., Ugartondo, V., Mitjans, M., Vinardell, M., Juli, L.,
Cascante, M. and Torres, J., 2008. Highly galloylated tannin fractions from witch hazel (Hamamelis virginiana)
bark: electron transfer capacity, in vitro antioxidant activity, and effects on skin-related cells. Chem Res Toxicol
21, 696-704.
Touriño, S., Selga, A., Jimnez, A., Juli, L., Lozano, C., Lizrraga, D., Cascante, M. and Torres, J., 2005.
Procyanidin fractions from pine (Pinus pinaster) bark: radical scavenging power in solution, antioxidant activity
in emulsion, and antiproliferative effect in melanoma cells. J Agric Food Chem 53, 4728-4735.
Ugartondo, V., Mitjans, M., Tourio, S., Torres, J. and Vinardell, M., 2007. Comparative antioxidant and
cytotoxic effect of procyanidin fractions from grape and pine. Chem Res Toxicol 20, 1543-1548.
Uhl, M., Helma, C. and Knasmuller, S., 1999. Single-cell gel electrophoresis assays with human-derived
hepatoma (Hep G2) cells. Mutat Res 441, 215-224.
Valenta, H., 1998. Chromatographic methods for the determination of ochratoxin A in animal and
human tissues and fluids. J Chromatogr A 815, 75-92.
Vasquez, M., 2010. Combining the in vivo comet and micronucleus assays: a practical approach to
genotoxicity testing and data interpretation. Mutagenesis 25, 187-199.
Vettorazzi, A., Trocóniz, I.F., Gonzalez-Peñas, E., Corcuera, L.A., Arbillaga, L., Gil, A.G., Nagy, J.M.,
Mantle, P.G. and López de Cerain, A., 2010. Effects of fasting and gender on ochratoxin A toxicokinetics in
F344 rats. Food Chem Toxicol 48, 3159-3166.
General discussion
205
Vettorazzi, A., Gonzalez-Penas, E., Troconiz, I.F., Arbillaga, L., Corcuera, L.A., Gil, A.G. and de
Cerain, A.L., 2009. A different kinetic profile of ochratoxin A in mature male rats. Food Chem Toxicol 47,
1921-1927.
Vettorazzi, A., Gonzalez-Penas, E., Arbillaga, L., Corcuera, L.A. and Lopez de Cerain, A., 2008. Simple
high-performance liquid chromatography-fluorescence detection method for plasma, kidney and liver of rat as
a tool for toxicology studies. J Chromatogr A 1215, 100-106.
Vettorazzi, A., de Trocóniz, I.F., González-Peñas, E., Arbillaga, L., Corcuera, L., Gil, A.G. and de
Cerain, A.L., 2011. Kidney and liver distribution of ochratoxin A in male and female F344 rats. Food Chem
Toxicol 49, 1935-1942.
Vettorazzi, A., Arbillaga, L., Gil, A., González-Peñas, E. and deCerain, A., 2007. Influence of the
vehicle in the distribution and accumulation of ochratoxin A after oral administration in F-344 rats. Toxicol
Lett 172, S204-S190.
Zeljezic, D., Domijan, A.M. and Peraica, M., 2006. DNA damage by ochratoxin A in rat kidney
assessed by the alkaline comet assay. Braz J Med Biol Res 39, 1563.
Zepnik, H., Völkel, W. and Dekant, W., 2003. Toxicokinetics of the mycotoxin ochratoxin A in F 344
rats after oral administration. Toxicol Appl Pharmacol 192, 36-44.


Capítulo 9/Chapter 9
Conclusiones /Conclusions


Conclusiones/Conclusions
209
CONCLUSIONES
1. Con respecto a la genotoxicidad in vitro en células humanas Hep G2:
1.1. La aflatoxina B1 fue mas citotóxica que la ocratoxina A y el efecto conjunto de ambas
fue aditivo.
1.2. La aflatoxina B1 fue genotóxica dependiente de activación metabólica. Se detectaron
roturas en el ADN y lugares sensibles a la FPG. Sin embargo, la ocratoxina A resultó
no genotóxica en las mismas condiciones.
1.3. La coexposición a una mezcla de aflatoxina B1 y ocratoxina A disminuyó el efecto
genotóxico de la aflatoxina B1, tanto en las roturas directas como en el daño
oxidativo.
1.4. Ambas micotoxinas fueron capaces de inducir especies reactivas de oxígeno
intracelulares. El tratamiento conjunto indujo más especies que los tratamientos
individuales, observándose una asociación aditiva.
1.5. El extracto de cacao enriquecido en polifenoles no fue efectivo frente a la aflatoxina
B1, pero redujo significativamente la cantidad de especies reactivas de oxígeno en las
células tratadas con ocratoxina A o la mezcla de ambas micotoxinas. Esto sugiere que
los polifenoles del cacao son buenos candidatos como agentes antioxidantes.
2. Con respecto a la toxicidad y el comportamiento cinético de las micotoxinas en rata:
2.1. Se ha desarrollado y se ha validado un método rápido y sencillo para la determinación
de aflatoxina B1 y ocratoxina A simultáneamente en plasma, hígado y riñón. La
validación del método se ha realizado conforme a los siguientes criterios: selectividad,
linealidad, precisión y exactitud, límites de detección y cuantificación, recuperación,
estabilidad y robustez. En todos los casos se han obtenido resultados aceptables según
los objetivos establecidos.
2.2. La pequeña cantidad de muestra necesaria, el bajo volumen de disolventes utilizado,
así como los límites de detección y cuantificación alcanzados hacen que este método
haya podido ser empleado en estudios cinéticos en rata.
Capítulo 9 / Chapter 9
210
2.3. La mezcla 0,25 mg/kg pc de aflatoxina B1 y 0,5 mg/kg pc de ocratoxina A provocó
un cuadro de hepatotoxicidad aguda que se recuperó al cabo de 96 h. Se puso de
manifiesto por un aumento de transaminasas y por el estudio histológico.
2.4. El estudio cinético demostró que la absorción y metabolismo de la molécula de
aflatoxina B1 son extremadamente rápidos, ya que sólo se observo un 1% de la dosis
en plasma tras 10 min, niveles inferiores al 10% de la dosis en hígado tras 8 h, fue
indetectable en riñón y los metabolitos desaparecieron del organismo en 24 h.
2.5. Parece que la presencia de aflatoxina B1 no afecta a la cinética de la ocratoxina A ya
que el valor máximo y el perfil cinético observado fueron comparables a los
encontrados en estudios cinéticos previos de la ocratoxina A en las mismas
condiciones.
3. Con respecto a la genotoxicidad conjunta in vivo:
3.1. La presencia de ocratoxina A disminuyó la hepatotoxicidad aguda de la aflatoxina B1
que se puso de manifiesto por un descenso de las transaminasas, menor daño
histológico y menores pesos relativos del hígado.
3.2. La AFB1 indujo muy significativamente micronúcleos y toxicidad en médula osea. Sin
embargo, la ocratoxina A fue tóxica en médula osea pero no fue capaz de inducir
micronúcleos a esa dosis.
3.3. La presencia de ocratoxina A redujo la citoxicidad y el porcentaje de micronúcleos
inducido por la aflatoxina B1.
3.4. El ensayo del cometa permitió detectar una genotoxicidad órgano específica de tal
manera que la aflatoxina B1 indujo significativamente lugares sensibles a la FPG en
hígado y la ocratoxina A en riñón.
3.5. Las lesiones detectadas por la enzima en el hígado corresponden en su mayoría y
probablemente al aducto AFB1-formamidopirimidina, fruto de un ataque directo del
epóxido al ADN. Sin embargo, las lesiones detectadas en riñón fueron probablemente
8-oxoguaninas debidas al daño oxidativo inducido por la OTA.

Conclusiones/Conclusions
211
3.6. La presencia de ocratoxina A disminuyó las lesiones en el ADN provocadas por la
aflatoxina B1 en el hígado, aunque la coexposición no tuvo efectos en el riñón.
4. En general, la exposición a ambas toxinas simultáneamente supuso una disminución de la
genotoxicidad provocada por la aflatoxina B1 tanto en modelos in vitro como in vivo.
Capítulo 9 / Chapter 9
212
CONCLUSIONS
1. With regard to genotoxicity in vitro in Hep G2 human cell line:
1.1. Aflatoxin B1 was more cytotoxic than ochratoxin A and the combined effect was
additive.
1.2. Aflatoxin B1 was genotoxic with metabolic activation. DNA strand breaks and FPG
sensitive sites were detected. However, ochratoxin A was not genotoxic under the
same conditions.
1.3. Co-exposure to a mixture of aflatoxin B1 and ochratoxin A reduced the genotoxicity
of aflatoxin B1, in the direct strand breaks as well as in the oxidative damage.
1.4. Both mycotoxins were able to induce intracellular reactive oxygen species. The
combined treatment induced more reactive species than the individual treatments,
observing additive association.
1.5. The polyphenol-enriched cocoa extract was not effective against aflatoxin B1 but it
significantly reduced the reactive oxygen species induced by ochratoxin A or the
mixture of mycotoxins. These observations suggest that cocoa polyphenols would be
good candidates as antioxidant agents.
2. With regard to the toxicity and toxicokinetic profile of both mycotoxins in rats:
2.1. A fast and simple analytical method has been developed and validated for the
simultaneous determination and quantification of aflatoxin B1 and ochratoxin A in rat
plasma, liver and kidney. The validation of the method has been performed based on
the following criteria: selectivity, linearity, precision and accuracy, limits of detection
and quantification, recovery, stability and robustness. In accordance with the
validation objectives established, acceptable results have been obtained in each case.
2.2. The small amount of sample needed, the low volume of solvent used, and the limits
of detection and quantification achieved made this method useful for kinetic studies
in rats.

Conclusiones/Conclusions
213
2.3. The mixture of 0.25 mg/kg bw of aflatoxin and 0.5 mg/kg bw of ochratoxin A
caused acute hepatotoxicity in treated rats which recovered after 96 h. This recovery
was revealed by an increase in transaminases and by the histology observations.
2.4. The kinetic study showed that the absorption and metabolism of aflatoxin molecule
are extremely fast, since only 1% of the initial dose was observed after 10 min and less
than 10% of the dose was observed in liver after 8 h. It was undetectable in kidney
and metabolites disappeared from the organism within 24 hours.
2.5. It appears that the presence of aflatoxin B1 does not affect the kinetics of ochratoxin
A because the maximum value and the kinetic profile observed were similar to those
found in previous kinetic studies conducted on ochratoxin A under the same
conditions.
3. With respect to the combined genotoxicity in vivo:
3.1. The presence of ochratoxin A decreased the acute hepatotoxicity of aflatoxin B1
which was demonstrated by a decrease of transaminases, a reduction in histological
damage and lower relative weights of the liver.
3.2. Aflatoxin B1 induced micronuclei and cytotoxicity in bone marrow very significantly.
3.3. The presence of ochratoxin A reduced cytotoxicity and the percentage of micronuclei
induced by aflatoxin B1 in bone marrow.
3.4. The comet assay made the detection of specific organ genotoxicity possible so that
aflatoxin B1 significantly induced FPG-sensitive sites in liver and ochratoxin A in
kidney.
3.5. The majority of lesions detected by the enzyme in the liver are probably the adduct
AFB1-formamidopyrimidine as a result of a direct attack of the epoxide on DNA.
However, kidney lesions were 8-oxoguanines probably due to oxidative damage
induced by OTA.
3.6. The presence of ochratoxin A decreased DNA damage induced by aflatoxin B1 in the
liver, although the co-exposure had no effect on the kidney.

Capítulo 9 / Chapter 9
214
4. In general, the exposure to both toxins simultaneously resulted in a decrease of the
genotoxicity of aflatoxin B1 in both in vitro and in vivo models.


![Discoteca Rubik's [ Estibaliz Souto ]](https://static.fdocuments.es/doc/165x107/568bd8c41a28ab2034a4925a/discoteca-rubiks-estibaliz-souto-.jpg)