Fairholme factesheet cierre 2011
2
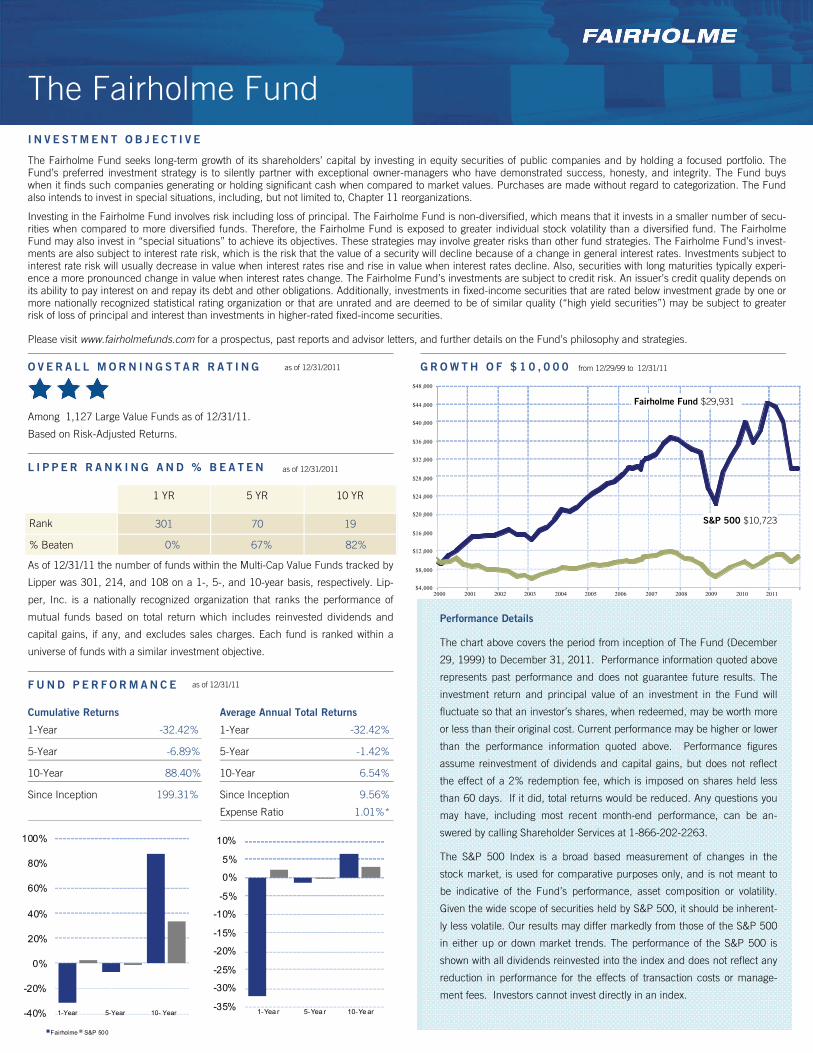
-40% -20% 0% 20% 40% 60% 80% 100% Fairholme S&P 500 Cumulative Returns 1-Year -32.42% 5-Year -6.89% 10-Year 88.40% Since Inception 199.31% Average Annual Total Returns 1-Year -32.42% 5-Year -1.42% 10-Year 6.54% Since Inception 9.56% Expense Ratio 1.01%* INVESTMENT OBJECTIVE The Fairholme Fund seeks long-term growth of its shareholders’ capital by investing in equity securities of public companies and by holding a focused portfolio. The Fund’s preferred investment strategy is to silently partner with exceptional owner-managers who have demonstrated success, honesty, and integrity. The Fund buys when it finds such companies generating or holding significant cash when compared to market values. Purchases are made without regard to categorization. The Fund also intends to invest in special situations, including, but not limited to, Chapter 11 reorganizations. Investing in the Fairholme Fund involves risk including loss of principal. The Fairholme Fund is non-diversified, which means that it invests in a smaller number of secu- rities when compared to more diversified funds. Therefore, the Fairholme Fund is exposed to greater individual stock volatility than a diversified fund. The Fairholme Fund may also invest in “special situations” to achieve its objectives. These strategies may involve greater risks than other fund strategies. The Fairholme Fund’s invest- ments are also subject to interest rate risk, which is the risk that the value of a security will decline because of a change in general interest rates. Investments subject to interest rate risk will usually decrease in value when interest rates rise and rise in value when interest rates decline. Also, securities with long maturities typically experi- ence a more pronounced change in value when interest rates change. The Fairholme Fund’s investments are subject to credit risk. An issuer’s credit quality depends on its ability to pay interest on and repay its debt and other obligations. Additionally, investments in fixed-income securities that are rated below investment grade by one or more nationally recognized statistical rating organization or that are unrated and are deemed to be of similar quality (“high yield securities”) may be subject to greater risk of loss of principal and interest than investments in higher-rated fixed-income securities. Please visit www.fairholmefunds.com for a prospectus, past reports and advisor letters, and further details on the Fund’s philosophy and strategies. OVERALL MORNINGSTAR RATING Among 1,127 Large Value Funds as of 12/31/11. Based on Risk-Adjusted Returns. as of 12/31/2011 LIPPER RANKING AND % BEATEN As of 12/31/11 the number of funds within the Multi-Cap Value Funds tracked by Lipper was 301, 214, and 108 on a 1-, 5-, and 10-year basis, respectively. Lip- per, Inc. is a nationally recognized organization that ranks the performance of mutual funds based on total return which includes reinvested dividends and capital gains, if any, and excludes sales charges. Each fund is ranked within a universe of funds with a similar investment objective. as of 12/31/2011 Performance Details The chart above covers the period from inception of The Fund (December 29, 1999) to December 31, 2011. Performance information quoted above represents past performance and does not guarantee future results. The investment return and principal value of an investment in the Fund will fluctuate so that an investor’s shares, when redeemed, may be worth more or less than their original cost. Current performance may be higher or lower than the performance information quoted above. Performance figures assume reinvestment of dividends and capital gains, but does not reflect the effect of a 2% redemption fee, which is imposed on shares held less than 60 days. If it did, total returns would be reduced. Any questions you may have, including most recent month-end performance, can be an- swered by calling Shareholder Services at 1-866-202-2263. The S&P 500 Index is a broad based measurement of changes in the stock market, is used for comparative purposes only, and is not meant to be indicative of the Fund’s performance, asset composition or volatility. Given the wide scope of securities held by S&P 500, it should be inherent- ly less volatile. Our results may differ markedly from those of the S&P 500 in either up or down market trends. The performance of the S&P 500 is shown with all dividends reinvested into the index and does not reflect any reduction in performance for the effects of transaction costs or manage- ment fees. Investors cannot invest directly in an index. The Fairholme Fund FUND PERFORMANCE as of 12/31/11 1 YR 5 YR 10 YR Rank 301 70 19 % Beaten 0% 67% 82% GROWTH OF $10,000 from 12/29/99 to 12/31/11 1-Year 5-Year 10- Year $4,000 $8,000 $12 ,000 $16 ,000 $20 ,000 $24 ,000 $28 ,000 $32 ,000 $36 ,000 $40 ,000 $44 ,000 $48 ,000 2000 2001 2002 2003 2004 2005 2006 2007 2008 2009 2010 2011 -35% -30% -25% -20% -15% -10% -5% 0% 5% 10% 1-Yea r 5-Yea r 10-Ye ar Fairholme Fund $29,931 S&P 500 $10,723
-
Upload
frank-ragol -
Category
Business
-
view
274 -
download
2
Transcript of Fairholme factesheet cierre 2011
-40%
-20%
0%
20%
40%
60%
80%
100%
Fairholme S&P 500
Cumulative Returns
1-Year -32.42%
5-Year -6.89%
10-Year 88.40%
Since Inception 199.31%
Average Annual Total Returns
1-Year -32.42%
5-Year -1.42%
10-Year 6.54%
Since Inception 9.56%
Expense Ratio 1.01%*
I N V E S T M E N T O B J E C T I V E
The Fairholme Fund seeks long-term growth of its shareholders’ capital by investing in equity securities of public companies and by holding a focused portfolio. The Fund’s preferred investment strategy is to silently partner with exceptional owner-managers who have demonstrated success, honesty, and integrity. The Fund buys when it finds such companies generating or holding significant cash when compared to market values. Purchases are made without regard to categorization. The Fund also intends to invest in special situations, including, but not limited to, Chapter 11 reorganizations.
Investing in the Fairholme Fund involves risk including loss of principal. The Fairholme Fund is non-diversified, which means that it invests in a smaller number of secu-rities when compared to more diversified funds. Therefore, the Fairholme Fund is exposed to greater individual stock volatility than a diversified fund. The Fairholme Fund may also invest in “special situations” to achieve its objectives. These strategies may involve greater risks than other fund strategies. The Fairholme Fund’s invest-ments are also subject to interest rate risk, which is the risk that the value of a security will decline because of a change in general interest rates. Investments subject to interest rate risk will usually decrease in value when interest rates rise and rise in value when interest rates decline. Also, securities with long maturities typically experi-ence a more pronounced change in value when interest rates change. The Fairholme Fund’s investments are subject to credit risk. An issuer’s credit quality depends on its ability to pay interest on and repay its debt and other obligations. Additionally, investments in fixed-income securities that are rated below investment grade by one or more nationally recognized statistical rating organization or that are unrated and are deemed to be of similar quality (“high yield securities”) may be subject to greater risk of loss of principal and interest than investments in higher-rated fixed-income securities.
Please visit www.fairholmefunds.com for a prospectus, past reports and advisor letters, and further details on the Fund’s philosophy and strategies.
O V E R A L L M O R N I N G S T A R R A T I N G
Among 1,127 Large Value Funds as of 12/31/11.
Based on Risk-Adjusted Returns.
as of 12/31/2011
L I P P E R R A N K I N G A N D % B E A T E N
As of 12/31/11 the number of funds within the Multi-Cap Value Funds tracked by
Lipper was 301, 214, and 108 on a 1-, 5-, and 10-year basis, respectively. Lip-
per, Inc. is a nationally recognized organization that ranks the performance of
mutual funds based on total return which includes reinvested dividends and
capital gains, if any, and excludes sales charges. Each fund is ranked within a
universe of funds with a similar investment objective.
as of 12/31/2011
Performance Details
The chart above covers the period from inception of The Fund (December
29, 1999) to December 31, 2011. Performance information quoted above
represents past performance and does not guarantee future results. The
investment return and principal value of an investment in the Fund will
fluctuate so that an investor’s shares, when redeemed, may be worth more
or less than their original cost. Current performance may be higher or lower
than the performance information quoted above. Performance figures
assume reinvestment of dividends and capital gains, but does not reflect
the effect of a 2% redemption fee, which is imposed on shares held less
than 60 days. If it did, total returns would be reduced. Any questions you
may have, including most recent month-end performance, can be an-
swered by calling Shareholder Services at 1-866-202-2263.
The S&P 500 Index is a broad based measurement of changes in the
stock market, is used for comparative purposes only, and is not meant to
be indicative of the Fund’s performance, asset composition or volatility.
Given the wide scope of securities held by S&P 500, it should be inherent-
ly less volatile. Our results may differ markedly from those of the S&P 500
in either up or down market trends. The performance of the S&P 500 is
shown with all dividends reinvested into the index and does not reflect any
reduction in performance for the effects of transaction costs or manage-
ment fees. Investors cannot invest directly in an index.
The Fairholme Fund
F U N D P E R F O R M A N C E as of 12/31/11
1 YR 5 YR 10 YR
Rank 301 70 19
% Beaten 0% 67% 82%
G R O W T H O F $ 1 0 , 0 0 0 from 12/29/99 to 12/31/11
Fairholme Fund $38,430 8
S&P 500 $9,481
1-Year 5-Year 10- Year
$4,000
$8,000
$12 ,000
$16 ,000
$20 ,000
$24 ,000
$28 ,000
$32 ,000
$36 ,000
$40 ,000
$44 ,000
$48 ,000
2000 2001 2002 2003 2004 2005 2006 2007 2008 2009 2010 2011
-35%
-30%
-25%
-20%
-15%
-10%
-5%
0%
5%
10%
1-Yea r 5-Yea r 10-Ye ar
Fairholme Fund $29,931
S&P 500 $10,723
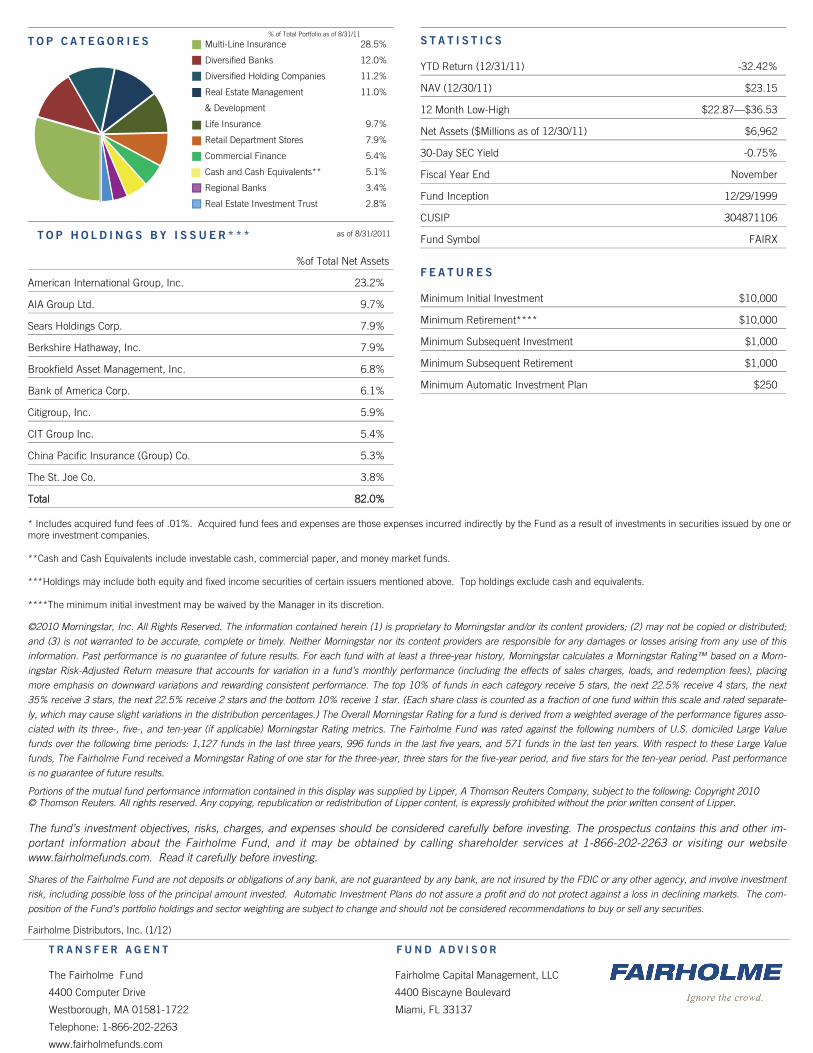
T O P C A T E G O R I E S S T A T I S T I C S
YTD Return (12/31/11) -32.42%
NAV (12/30/11) $23.15
12 Month Low-High $22.87—$36.53
Net Assets ($Millions as of 12/30/11) $6,962
30-Day SEC Yield -0.75%
Fiscal Year End November
Fund Inception 12/29/1999
CUSIP 304871106
Fund Symbol FAIRX
F E A T U R E S
Minimum Initial Investment $10,000
Minimum Retirement**** $10,000
Minimum Subsequent Investment $1,000
Minimum Subsequent Retirement $1,000
Minimum Automatic Investment Plan $250
% of Total Portfolio as of 8/31/11
©2010 Morningstar, Inc. All Rights Reserved. The information contained herein (1) is proprietary to Morningstar and/or its content providers; (2) may not be copied or distributed;
and (3) is not warranted to be accurate, complete or timely. Neither Morningstar nor its content providers are responsible for any damages or losses arising from any use of this
information. Past performance is no guarantee of future results. For each fund with at least a three-year history, Morningstar calculates a Morningstar Rating™ based on a Morn-
ingstar Risk-Adjusted Return measure that accounts for variation in a fund’s monthly performance (including the effects of sales charges, loads, and redemption fees), placing
more emphasis on downward variations and rewarding consistent performance. The top 10% of funds in each category receive 5 stars, the next 22.5% receive 4 stars, the next
35% receive 3 stars, the next 22.5% receive 2 stars and the bottom 10% receive 1 star. (Each share class is counted as a fraction of one fund within this scale and rated separate-
ly, which may cause slight variations in the distribution percentages.) The Overall Morningstar Rating for a fund is derived from a weighted average of the performance figures asso-
ciated with its three-, five-, and ten-year (if applicable) Morningstar Rating metrics. The Fairholme Fund was rated against the following numbers of U.S. domiciled Large Value
funds over the following time periods: 1,127 funds in the last three years, 996 funds in the last five years, and 571 funds in the last ten years. With respect to these Large Value
funds, The Fairholme Fund received a Morningstar Rating of one star for the three-year, three stars for the five-year period, and five stars for the ten-year period. Past performance
is no guarantee of future results.
Portions of the mutual fund performance information contained in this display was supplied by Lipper, A Thomson Reuters Company, subject to the following: Copyright 2010 © Thomson Reuters. All rights reserved. Any copying, republication or redistribution of Lipper content, is expressly prohibited without the prior written consent of Lipper. The fund’s investment objectives, risks, charges, and expenses should be considered carefully before investing. The prospectus contains this and other im-portant information about the Fairholme Fund, and it may be obtained by calling shareholder services at 1-866-202-2263 or visiting our website www.fairholmefunds.com. Read it carefully before investing.
Shares of the Fairholme Fund are not deposits or obligations of any bank, are not guaranteed by any bank, are not insured by the FDIC or any other agency, and involve investment
risk, including possible loss of the principal amount invested. Automatic Investment Plans do not assure a profit and do not protect against a loss in declining markets. The com-
position of the Fund’s portfolio holdings and sector weighting are subject to change and should not be considered recommendations to buy or sell any securities.
Fairholme Distributors, Inc. (1/12)
* Includes acquired fund fees of .01%. Acquired fund fees and expenses are those expenses incurred indirectly by the Fund as a result of investments in securities issued by one or more investment companies. **Cash and Cash Equivalents include investable cash, commercial paper, and money market funds. ***Holdings may include both equity and fixed income securities of certain issuers mentioned above. Top holdings exclude cash and equivalents. ****The minimum initial investment may be waived by the Manager in its discretion.
as of 8/31/2011
Multi-Line Insurance 28.5%
Diversified Banks 12.0%
Diversified Holding Companies 11.2%
Real Estate Management 11.0%
& Development
Life Insurance 9.7%
Retail Department Stores 7.9%
Commercial Finance 5.4%
Cash and Cash Equivalents** 5.1%
Regional Banks 3.4%
Real Estate Investment Trust 2.8%
T O P H O L D I N G S B Y I S S U E R * * *
%of Total Net Assets
American International Group, Inc. 23.2%
AIA Group Ltd. 9.7%
Sears Holdings Corp. 7.9%
Berkshire Hathaway, Inc. 7.9%
Brookfield Asset Management, Inc. 6.8%
Bank of America Corp. 6.1%
Citigroup, Inc. 5.9%
CIT Group Inc. 5.4%
China Pacific Insurance (Group) Co. 5.3%
The St. Joe Co. 3.8%
Total 82.0%
T R A N S F E R A G E N T F U N D A D V I S O R
The Fairholme Fund Fairholme Capital Management, LLC
4400 Computer Drive 4400 Biscayne Boulevard
Westborough, MA 01581-1722 Miami, FL 33137
Telephone: 1-866-202-2263
www.fairholmefunds.com