Resistencia a antimicrobianos y descubrimiento de nuevos antimicrobianos
Upload
sempsphCategory
view
513download
1
Hospital Antimicrobial Use
and Resistances.Point Prevalence Surveys
(EPINE)

� EPINE
� Scope
� representativeness
� Antimicrobial use
� Selected antimicrobial-microorganism
resistances
� Summary

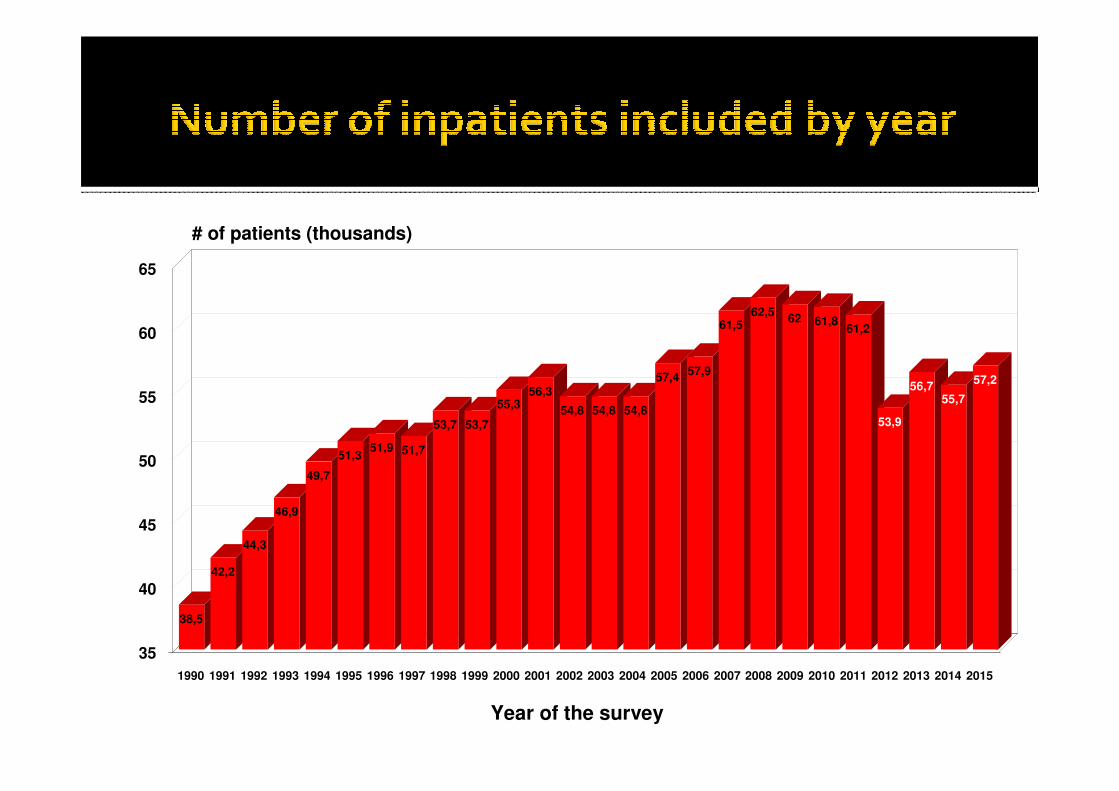
� EPINE: a series of Point Prevalence Surveys
� Anual: since 1990
� National study
� Non compulsory� Representativeness:
� (more than half acute care inpatients)
� Monitoring antimicrobial resistance since 1999� 2012: udpdated ECDC methodology
� Includes data on Community-onset infections

Year of the survey
123
135
163171
186
201206
214
224233
243 243 246241
258 257253
266
276 278287 287
271282
269277
1990 1991 1992 1993 1994 1995 1996 1997 1998 1999 2000 2001 2002 2003 2004 2005 2006 2007 2008 2009 2010 2011 2012 2013 2014 2015
100
150
200
250
300
Number of hospitals
Year of the survey
38,5
42,2
44,3
46,9
49,7
51,351,9 51,7
53,7 53,7
55,356,3
54,8 54,8 54,8
57,457,9
61,562,5
62 61,861,2
53,9
56,755,7
57,2
35
40
45
50
55
60
65
# of patients (thousands)
1990 1991 1992 1993 1994 1995 1996 1997 1998 1999 2000 2001 2002 2003 2004 2005 2006 2007 2008 2009 2010 2011 2012 2013 2014 2015

Size of the Size of the
hospital hospital
Hospitals Hospitals Patients Patients
N N % % N N % %
≤200 beds 126 45,49 10.170 17,79
201 to 500 beds 81 29,24 17.430 30,48
>500 beds 49 17,69 25.937 45,36
Total 277 100,00 57.183 100,00

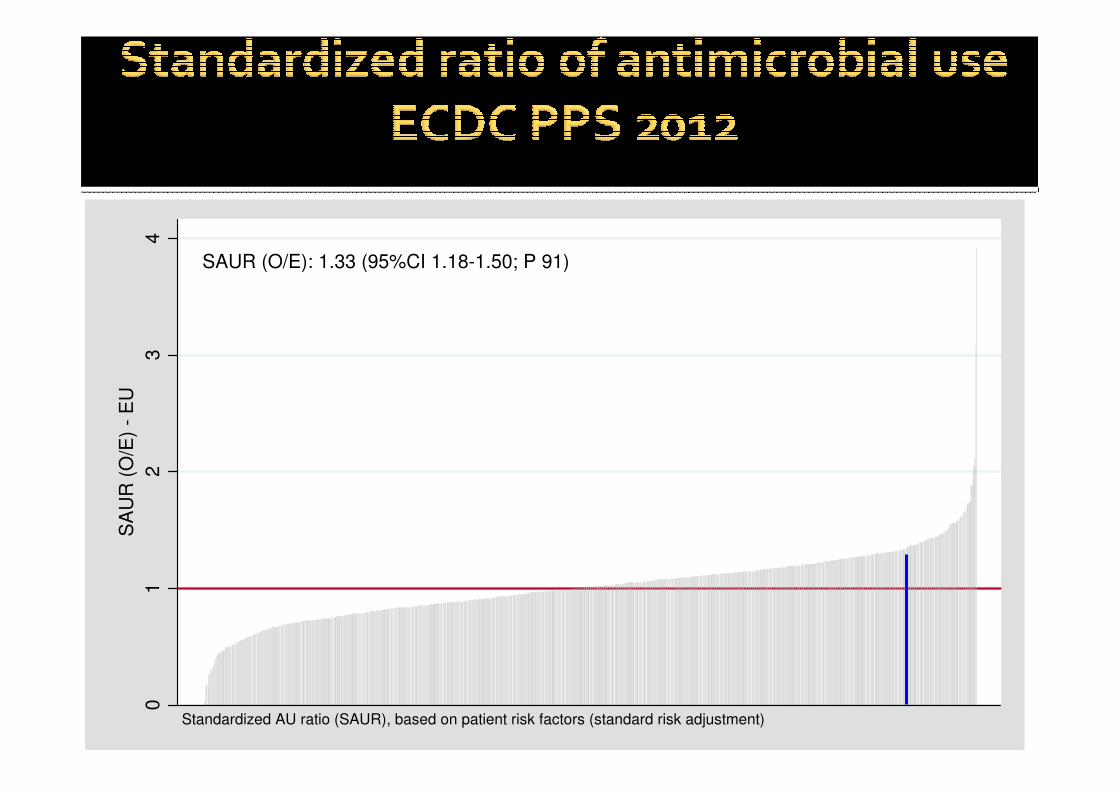
SAUR (O/E): 1.33 (95%CI 1.18-1.50; P 91)
01
23
4
SA
UR
(O
/E)
- E
U
Standardized AU ratio (SAUR), based on patient risk factors (standard risk adjustment)

Prevalence of antimicrobial use%
Year of the survey
Tendencia p<0,0001
33,8 34,5 34,9 34,4 34,635,6 36,1 35,8
36,7 3636,8 37,1 37
38,739,7 39,5
40,7 40,241,6
42,4 41,9
45,7 45,7 45,4 46,1
1990 1991 1992 1993 1994 1995 1996 1997 1998 1999 2000 2002 2003 2004 2005 2006 2007 2008 2009 2010 2011 2012 2013 2014 2015
0
8
16
24
32
40
48
ECDC-PPS

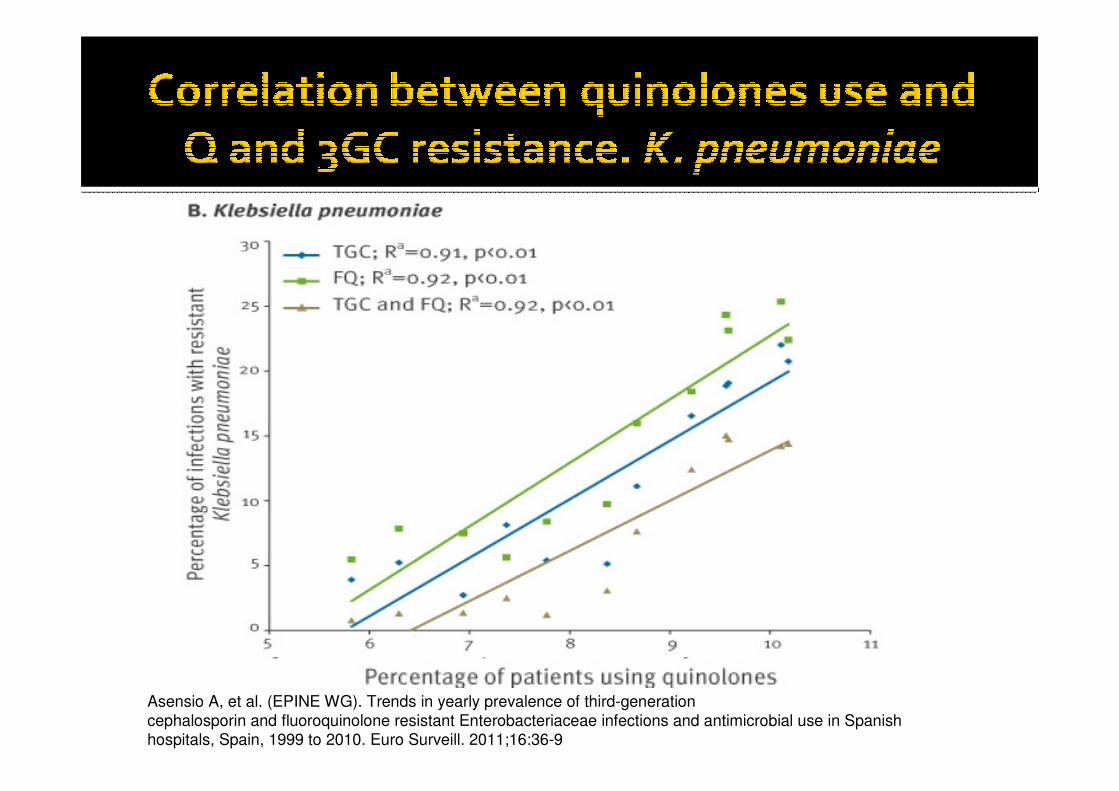
Asensio A, et al. (EPINE WG). Trends in yearly prevalence of third-generation
cephalosporin and fluoroquinolone resistant Enterobacteriaceae infections and antimicrobial use in Spanish
hospitals, Spain, 1999 to 2010. Euro Surveill. 2011;16:36-9
Asensio A, et al. (EPINE WG). Trends in yearly prevalence of third-generation
cephalosporin and fluoroquinolone resistant Enterobacteriaceae infections and antimicrobial use in Spanish hospitals, Spain, 1999 to 2010. Euro Surveill. 2011;16:36-9


EPINE PPS 2012-2015
13,3
7,3
5,3
9,8
2,22,7
13,2
6,7
5
9,7
2,22,7
13,2
6,8
5
10,2
2,3
2,9
13,1
6,5
5,1
10,4
2,3
3
Pen+pen inhib.3-4G cephalosp
CarbapenemsQuinolones
Gly copeptidesAntimy cotics
0
1
2
3
4
5
6
7
8
9
10
11
12
13
14
15
16Prevalence of use (%)
2012 2013 2014 2015


[0,10](10,20](20,40](40,60](60,100]<10 isolates/not incl.
MRSA%(% of S. aureus)
43%

EPINE PPS 1993-2015
2219 18
25 25
29
40
36 37
45
41
4542
44
48 4851
43 43 4340
35
41
19931994
19951996
19971998
19992000
20012002
20032004
20052006
20072008
20092010
20112012
20132014
2015
0
5
10
15
20
25
30
35
40
45
50
55
60Proportion of resistance (%) ECDC-PPS
EPINE PPS 1993-2015
National Hand
Hygiene campaign
EPINE PPS 2012-2015
24 23 22
4340
35
41
36
3028
33
2012 2013 2014 2015
0
10
20
30
40
50
60Proportion of resistance (%)
Surgical Respiratory
Blood other
All EARSS

EPINE PPS 2012-2015
43
40
35
41
3331 32
38
2012 2013 2014 2015
0
5
10
15
20
25
30
35
40
45
50Proportion of resistance (%)
Community
EARSS
Hospital

EPINE PPS 2012-2015
4
5
3
66
8
3
8
1
3
2 2
3
2 2 2
2012 2013 2014 2015
0
1
2
3
4
5
6
7
8
9
10Proportion of resistance (%)
E. faecium EARSS E. faecalis Hosp
E. faecalis Com E. faecium Hosp
E. faecium Com

EPINE PPS 2012-2015
1999 2000 2001 2002 2003 2004 2005 2006 2007 2008 2009 2010 2011 2012 2013 2014 2015
0
5
10
15
20
25
30
35
40
45
50Proportion of resistance (%)
3GC/Escher. coli Carb/Escher. coli
3GC/K. pneumoniae Carbapenem/K. pneumoniae
3GC/Enterobacter spp Carb/Enterobacter spp

EPINE PPS 2012-2015
1413
12
19
1314
20
22
2019 19
2012 2013 2014 2015
0
5
10
15
20
25Proportion of resistance (%)
Hospital
Community
EARS

EPINE PPS 2012-2015
1720
1821 20
25
33
38
4244
38
2012 2013 2014 2015
0
5
10
15
20
25
30
35
40
45
50Proportion of resistance (%)
Hospital
Community
EARS

EPINE PPS 2012-2015
0,8 1,22,3
1213
17
12
2
4
6 6
2012 2013 2014 2015
0
2
4
6
8
10
12
14
16
18
20Proportion of resistance (%)
Community
Hospital
EARS

1999 2000 2001 2002 2003 2004 2005 2006 2007 2008 2009 2010 2011 2012 2013 2014 2015
0
10
20
30
40
50
60
70
80
90
100Proportion of resistance (%)
Carb/P. aeruginosa
Carb/A. baumanii
EPINE PPS 1999-2015
ECDC-PPS

EPINE PPS 2012-2015
16,4 17,6 18,520 21 2123
29
37
3234
2012 2013 2014 2015
0
5
10
15
20
25
30
35
40
45
50Proportion of resistance (%)
Hospital Community P. aeruginosa EARSS

EPINE PPS 2012-2015
68
4338
26
74
63 64 62
2012 2013 2014 2015
0
10
20
30
40
50
60
70
80
90
100Proportion of resistance (%)
Hospital Community EARS

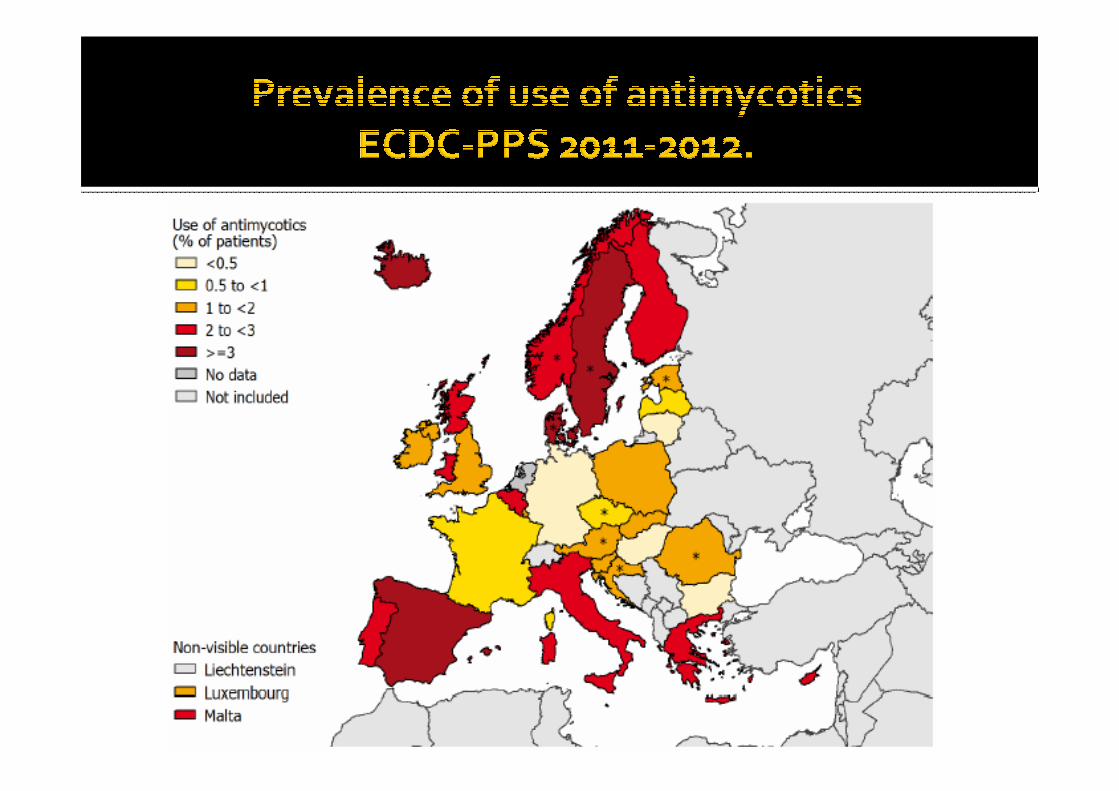
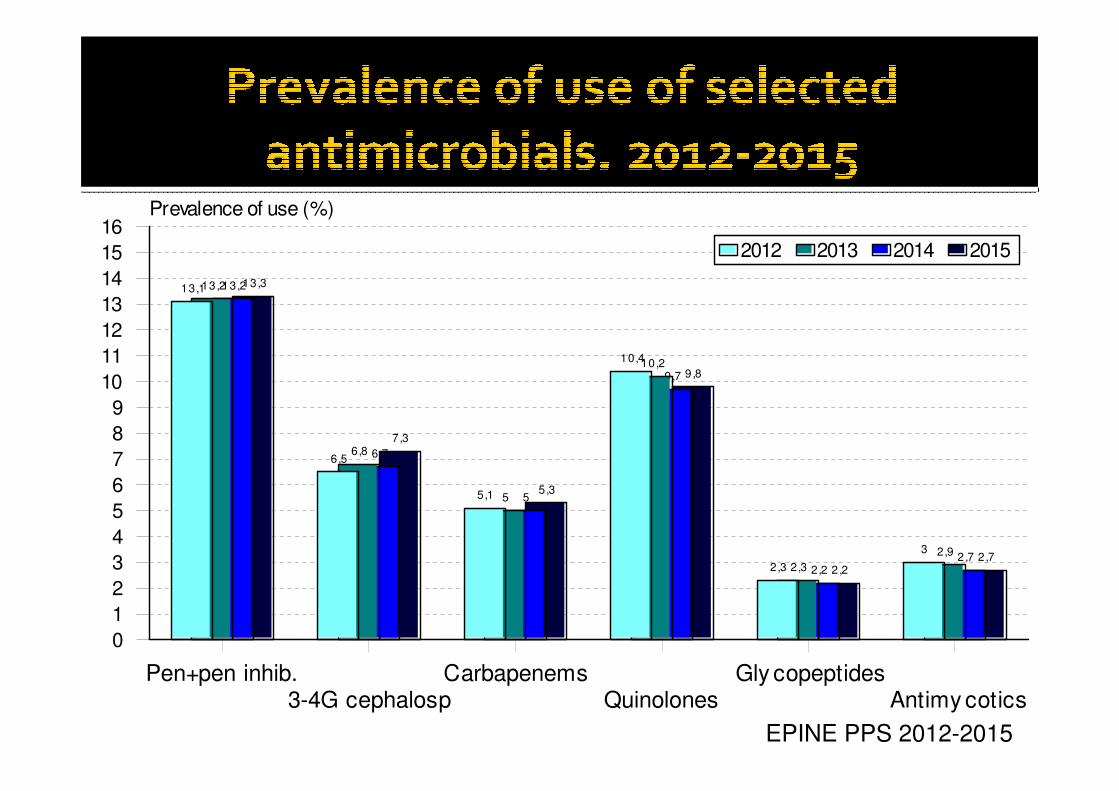
� Antimicrobial use is among the highest in Europe:
� For carbapenems, 3-4G cephalosporins, quinolones and antimycotics
� Former intensive use of quinolones and 3G cephalosporins
� Increase resistance of enterobacteriaceae to Quinolones and 3GC
� Intensive use of carbapenems
� increase resistance of enterobacteriaceae to carbapenems
� Rates of resistance
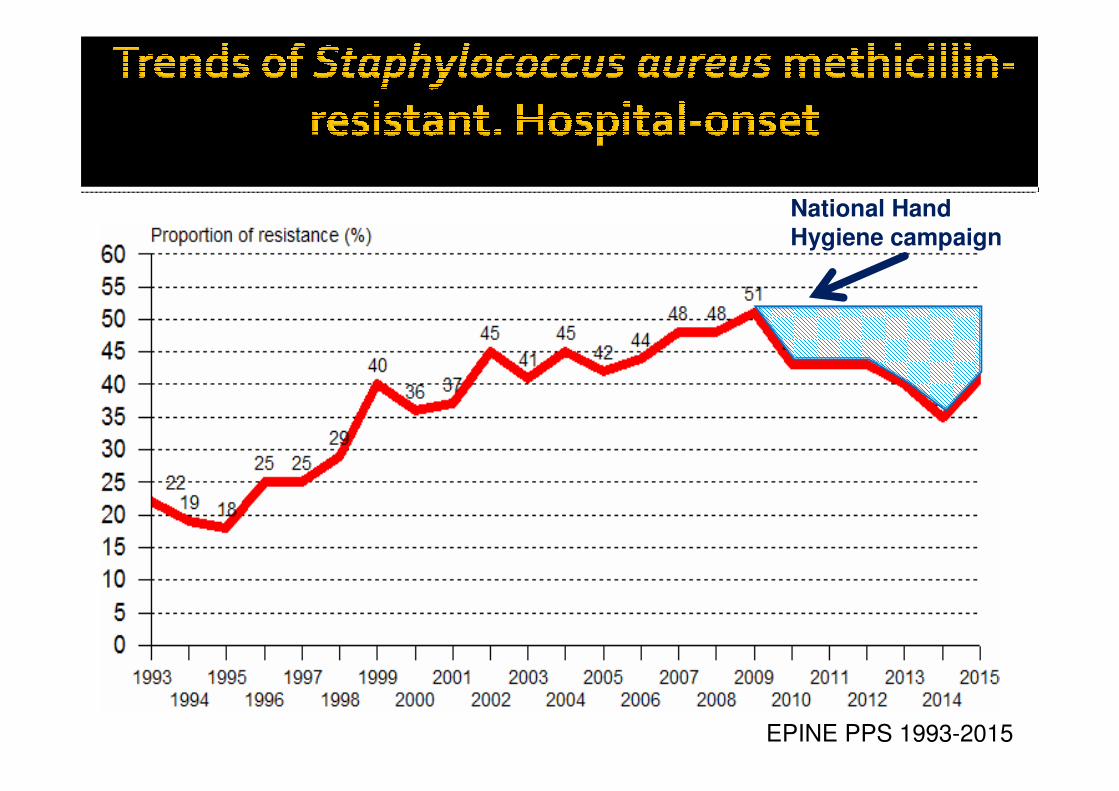
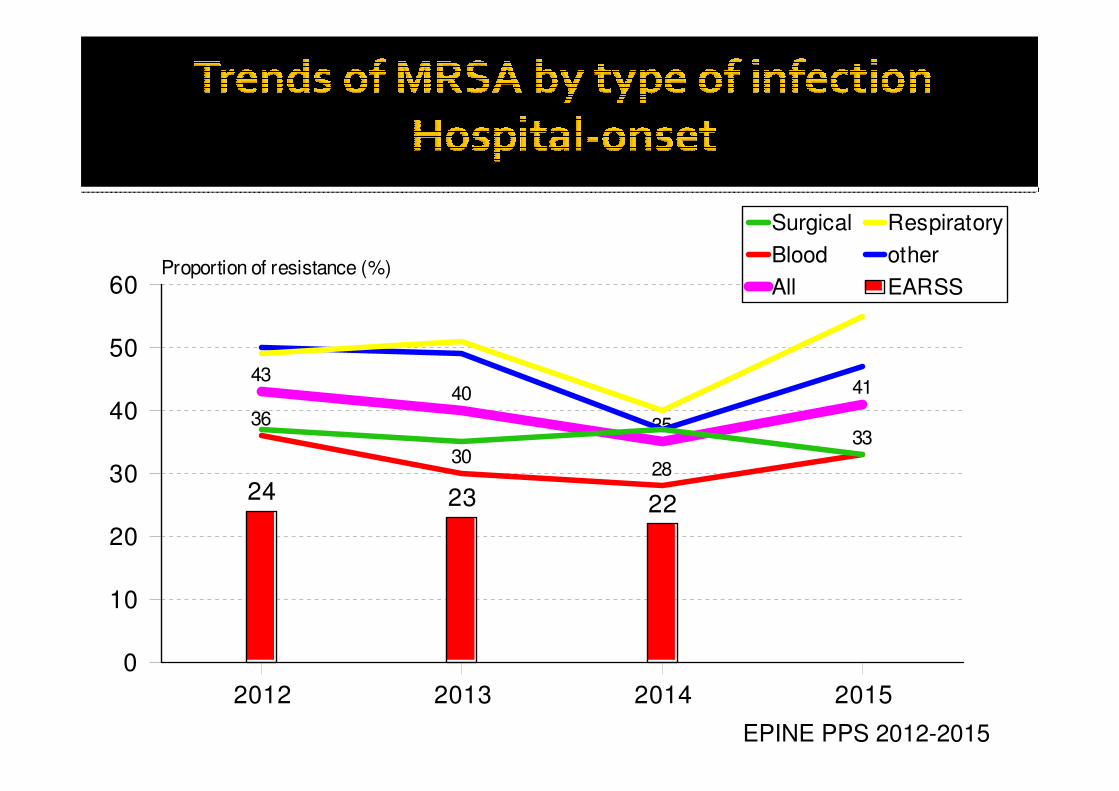
� MRSA:
▪ Is high
▪ Decreasing since 2010 associated to Hand Hygiene campaign
▪ Much higher than that reported by EARSS laboratories
▪ Resistance in the community is increasing toward hospital levels

� Enterobacteriaceae resistances
� E. coli and K pneumoniae 3GC resistance:
▪ high
▪ Community infections: reaching HAI levels
� E. coli resistant to Carbapenem: 1-2% of the HAIs
� K. pneumoniae resistant to carbapenems
▪ High: 12-17% of HAI isolates
▪ Community-onset infections: increasing: 2-6% in 2015
� Non fermenting GN bacilli resistance
� P. aeruginosa resitance to carbapenems is high and increasing in the
last 4 years
� A. baumanii resistant to carbapenem is high but decreasing.
� Rates of resistance reported by PPS are higher than thosereported by EARSS net

Hospital Antimicrobial use
and Resistance.Point Prevalence Surveys
(EPINE)