RESPUESTA FISIOLÓGICA DE Taxodium … · RESPUESTA FISIOLÓGICA DE Taxodium mucronatum Ten. A LOS...
21
129 RESPUESTA FISIOLÓGICA DE Taxodium mucronatum Ten. A LOS INCREMENTOS ATMOSFÉRICOS DE CO 2 Y TEMPERATURA DEL ÚLTIMO SIGLO PHYSIOLOGICAL RESPONSE OF Taxodium mucronatum Ten. TO THE INCREASES OF ATMOSPHERIC CO 2 AND TEMPERATURE IN THE LAST CENTURY Arian Correa-Díaz 1 , Armando Gómez-Guerrero 1* , José Villanueva-Díaz 2 , Lucas C. R. Silva 3 , William R. Horwath 4 , Luis U. Castruita-Esparza 1 , Tomás Martínez-Trinidad 1 , Javier Suárez-Espinosa 1 1 Colegio de Postgraduados, Campus Montecillo. Carretera México-Texcoco km 36.5, 56230. Montecillo, Estado de México, México. ([email protected]). 2 Laboratorio de Dendrocronología, Instituto Nacional de Investigaciones Forestales, Agrícolas y Pecuarias. INIFAP. km 6.5 Margen Derecha del Canal Sacramento, 35140. Gómez Palacio, Durango, México. 3 Environmental Studies Program, Department of Geography, Institute of Ecology and Evolution, University of Oregon. Columbia Hall 248, Eugene, OR 97403, USA. 4 Biogeochemistry and Nutrient Cycling Lab. Department of Land Air and Water Resources. University of California, Davis. One Shields Avenue. Davis CA, 95616, USA. *Autor responsable v Author for correspondence. Recibido: mayo, 2016. Aprobado: junio, 2017. Publicado como ARTÍCULO en Agrociencia 52: 129-149. 2018. RESUMEN El incremento de CO 2 atmosférico puede influir en el creci- miento de la vegetación provocando cierre estomático, cam- bios en la eficiencia de uso de agua o un efecto de fertilización que lleva a mayor crecimiento. Sin embargo, la respuesta de la vegetación depende de las condiciones ambientales y de la fisiología de cada especie. El objetivo del presente estudio fue evaluar composición de isótopos de carbono y oxigeno ( 13 C y 18 O), discriminación neta de 13 C ( 13 C), tasa de creci- miento en área basal (IAB) y eficiencia de uso de agua intrín- seca (iWUE) de Taxodium mucronatum Ten. en los últimos 100 años en tres regiones del centro de México. Las hipótesis fueron: 1) la respuesta fisiológica de T. mucronatum Ten. a la variación climática es diferente entre regiones; 2) los cambios en la tasa de crecimiento en área basal y variables fisiológi- cas de ahuehuete sugieren efectos de fertilización en el últi- mo siglo. Las regiones estudiadas fueron: Estado de México (MEX), Querétaro (QRO) y Morelos (MOR) con precipita- ción de 600, 750 y 1038 mm. En cada sitio se muestrearon nueve árboles para construir una cronología común. En los anillos de crecimiento se analizó 13 C y 18 O para estimar la discriminación ( 13 C), concentración interna de CO 2 (C i ) y la iWUE en el último siglo. Los datos se analizaron como muestras repetidas en el tiempo con espaciado variable. La diferencia entre sitios se probó con un análisis multivariado de la varianza (MANOVA) y pruebas de contrastes. El 13 C en la madera y C i variaron con el régimen de humedad en MEX y MOR. En las últimas cinco décadas, 18 O y la temperatura ABSTRACT The increase of atmospheric CO 2 can influence the growth of vegetation causing stomatal closure, changes in the water- use efficiency, or a fertilization effect that leads to greater growth. However, the response of vegetation depends on the environmental conditions and physiology of each species. The objective of this study was to evaluate the composition of carbon and oxygen isotopes ( 13 C and 18 O), the net discrimination of 13 C ( 13 C), the growth rate in basal area (IAB) and the intrinsic water-use efficiency (iWUE) of Taxodium mucronatum Ten. (Montezuma baldcypress) over the last 100 years in three regions of central Mexico. The hypotheses were: 1) the physiological response of T. mucronatum Ten. to climatic variation is different among regions; 2) changes in the growth rate in basal area and physiological variables of the Montezuma baldcypress tree suggest that fertilization effects took place in the last century. The regions under study were: Estado de México (MEX), Querétaro (QRO), and Morelos (MOR), with 600, 750, and 1038 mm rainfall. Nine trees per site were sampled to build a common chronology. In the growth rings, 13 C and 18 O were analyzed to estimate discrimination ( 13 C), internal CO 2 concentration (C i ), and iWUE in the last century. The data were analyzed as samples repeated over time with variable spacing. The difference between sites was tested with a multivariate analysis of variance (MANOVA) and contrasts tests. The 13 C on wood and C i varied according to the moisture regime in MEX and MOR. In the past five decades, 18 O increased by 4 ‰ and the average annual temperature (AAT) increased from 1.2 to 1.4 °C. Since 1950, 13 C decreased by 1.1 ‰ and iWUE increased by 50 %. The increase in Ca, iWUE, and AAT was related to the IAB decrease in MEX site, and a slight IAB increase in QRO and MOR,
Transcript of RESPUESTA FISIOLÓGICA DE Taxodium … · RESPUESTA FISIOLÓGICA DE Taxodium mucronatum Ten. A LOS...
129
RESPUESTA FISIOLÓGICA DE Taxodium mucronatum Ten. A LOS INCREMENTOS ATMOSFÉRICOS DE CO2 Y TEMPERATURA DEL ÚLTIMO SIGLO
PHYSIOLOGICAL RESPONSE OF Taxodium mucronatum Ten. TO THE INCREASES OF ATMOSPHERIC CO2 AND TEMPERATURE IN THE LAST CENTURY
Arian Correa-Díaz1, Armando Gómez-Guerrero1*, José Villanueva-Díaz2, Lucas C. R. Silva3, William R. Horwath4, Luis U. Castruita-Esparza1, Tomás Martínez-Trinidad1, Javier Suárez-Espinosa1
1Colegio de Postgraduados, Campus Montecillo. Carretera México-Texcoco km 36.5, 56230. Montecillo, Estado de México, México. ([email protected]). 2Laboratorio de Dendrocronología, Instituto Nacional de Investigaciones Forestales, Agrícolas y Pecuarias. INIFAP. km 6.5 Margen Derecha del Canal Sacramento, 35140. Gómez Palacio, Durango, México. 3Environmental Studies Program, Department of Geography, Institute of Ecology and Evolution, University of Oregon. Columbia Hall 248, Eugene, OR 97403, USA. 4Biogeochemistry and Nutrient Cycling Lab. Department of Land Air and Water Resources. University of California, Davis. One Shields Avenue. Davis CA, 95616, USA.
*Autor responsable v Author for correspondence.Recibido: mayo, 2016. Aprobado: junio, 2017.Publicado como ARTÍCULO en Agrociencia 52: 129-149. 2018.
Resumen
El incremento de CO2 atmosférico puede influir en el creci-miento de la vegetación provocando cierre estomático, cam-bios en la eficiencia de uso de agua o un efecto de fertilización que lleva a mayor crecimiento. Sin embargo, la respuesta de la vegetación depende de las condiciones ambientales y de la fisiología de cada especie. El objetivo del presente estudio fue evaluar composición de isótopos de carbono y oxigeno (13C y 18O), discriminación neta de 13C (13C), tasa de creci-miento en área basal (IAB) y eficiencia de uso de agua intrín-seca (iWUE) de Taxodium mucronatum Ten. en los últimos 100 años en tres regiones del centro de México. Las hipótesis fueron: 1) la respuesta fisiológica de T. mucronatum Ten. a la variación climática es diferente entre regiones; 2) los cambios en la tasa de crecimiento en área basal y variables fisiológi-cas de ahuehuete sugieren efectos de fertilización en el últi-mo siglo. Las regiones estudiadas fueron: Estado de México (MEX), Querétaro (QRO) y Morelos (MOR) con precipita-ción de 600, 750 y 1038 mm. En cada sitio se muestrearon nueve árboles para construir una cronología común. En los anillos de crecimiento se analizó 13C y 18O para estimar la discriminación (13C), concentración interna de CO2 (Ci) y la iWUE en el último siglo. Los datos se analizaron como muestras repetidas en el tiempo con espaciado variable. La diferencia entre sitios se probó con un análisis multivariado de la varianza (MANOVA) y pruebas de contrastes. El 13C en la madera y Ci variaron con el régimen de humedad en MEX y MOR. En las últimas cinco décadas, 18O y la temperatura
AbstRAct
The increase of atmospheric CO2 can influence the growth of vegetation causing stomatal closure, changes in the water-use efficiency, or a fertilization effect that leads to greater growth. However, the response of vegetation depends on the environmental conditions and physiology of each species. The objective of this study was to evaluate the composition of carbon and oxygen isotopes (13C and 18O), the net discrimination of 13C (13C), the growth rate in basal area (IAB) and the intrinsic water-use efficiency (iWUE) of Taxodium mucronatum Ten. (Montezuma baldcypress) over the last 100 years in three regions of central Mexico. The hypotheses were: 1) the physiological response of T. mucronatum Ten. to climatic variation is different among regions; 2) changes in the growth rate in basal area and physiological variables of the Montezuma baldcypress tree suggest that fertilization effects took place in the last century. The regions under study were: Estado de México (MEX), Querétaro (QRO), and Morelos (MOR), with 600, 750, and 1038 mm rainfall. Nine trees per site were sampled to build a common chronology. In the growth rings, 13C and 18O were analyzed to estimate discrimination (13C), internal CO2 concentration (Ci), and iWUE in the last century. The data were analyzed as samples repeated over time with variable spacing. The difference between sites was tested with a multivariate analysis of variance (MANOVA) and contrasts tests. The 13C on wood and Ci varied according to the moisture regime in MEX and MOR. In the past five decades, 18O increased by 4 ‰ and the average annual temperature (AAT) increased from 1.2 to 1.4 °C. Since 1950, 13C decreased by 1.1 ‰ and iWUE increased by 50 %. The increase in Ca, iWUE, and AAT was related to the IAB decrease in MEX site, and a slight IAB increase in QRO and MOR,
130
AGROCIENCIA, 1 de enero - 15 de febrero, 2018
VOLUMEN 52, NÚMERO 1
media anual (TMA) aumentaron 4 ‰ y de 1.2 a 2.4 °C, respectivamente. Desde 1950, 13C decreció en 1.1 ‰ y la iWUE aumentó 50 %. El incremento en Ca, iWUE y TMA se relacionó con la disminución de IAB en el sito MEX, y aumento pequeño en IAB en QRO y MOR, lo que indica un efecto diferente de fertilización de CO2 de acuerdo con el gra-diente de humedad.
Palabras clave: ahuehuete, estrés hídrico, isótopos estables, cam-bio climático.
IntRoduccIón
El incremento de CO2 atmosférico (Ca) influye en las relaciones de energía de la atmósfera y la fisiología de las plantas (Saurer et al., 2004;
Huang et al., 2007; Battipaglia et al., 2013). El inter-cambio pasivo de gases entre la hoja y la atmósfera sugiere que el aumento de Ca puede reflejarse en el crecimiento mayor de la vegetación, pues el CO2 es un insumo de la fotosíntesis (A) (Goetz et al., 2011; Pieter y Scott, 2011). Sin embargo, el intercambio de gases entre la vegetación y la atmósfera es complejo y se requiere investigación detallada para explicar los efectos de incremento de Ca en el crecimiento arbó-reo en condiciones ambientales diferentes y especies diversas (Silva et al., 2009; Xu et al., 2009; Roden et al., 2011). Los experimentos controlados indican que al au-mentar Ca las plantas tienden a cerrar los estomas y reducir su conductancia estomática (gs). Este efecto se traduce en un ahorro de agua, que puede condu-cir al aumento en la eficiencia de uso de agua (A/gs), aunque esto no se refleja necesariamente en creci-miento mayor (Saurer et al., 2004; Lammertsma et al., 2011; Xu et al., 2014). El movimiento de CO2, de la atmósfera a las hojas, involucra dos procesos de fraccionamiento isotópico; el primero debido al proceso de difusión a través de los estomas y el segundo por la carboxilación de la enzima RUBIS-CO. Así, el cierre parcial de estomas, causado por un incremento en Ca , también limita la fotosíntesis y modifica la composición de isótopos de carbono y oxígeno en la madera (Farquhar et al., 1989; Mc Carroll y Loader, 2004). De acuerdo con las espe-cies y las condiciones ambientales, el aumento de Ca puede influir de manera positiva o negativa en el crecimiento (Saurer et al., 2004; Peñuelas et al., 2011; Silva et al., 2015).
indicating a different CO2 fertilization effect depending on the moisture gradient.
Keywords: Montezuma baldcypress, hydric stress, stable isotopes, climate change.
IntRoductIon
The increase of atmospheric CO2 (Ca) influences on the energy relations of the atmosphere and the physiology of plants
(Saurer et al., 2004; Huang et al., 2007; Battipaglia et al., 2013). The passive gas exchange between the leaf and the atmosphere suggests that increased Ca can be reflected in increased growth of vegetation, because CO2 is an element of photosynthesis (A) (Goetz et al., 2011; Pieter and Scott, 2011). However, the gas exchange between the vegetation and the atmosphere is complex, and further research is required to explain the effects of increased Ca in tree growth in different environmental conditions and various species (Silva et al., 2009; Xu et al., 2009; Roden et al., 2011). Controlled experiments indicate that when Ca increases, plants tend to close their stomata and reduce their stomatal conductance (gs). This effect results in water saving, which can increase water-use efficiency (A/gs), although this is not necessarily reflected in higher growth (Saurer et al., 2004; Lammertsma et al., 2011; Xu et al., 2014). The movement of CO2 from the atmosphere to the leaves involves two isotopic fractionation processes: the first one as a result of the diffusion process through the stomata; and the second due to the carboxylation of RuBisCO enzyme. Partial stomatal closure, caused by an increase in Ca , also limits photosynthesis and modifies the isotope composition of carbon and oxygen in the wood (Farquhar et al., 1989; Mc Carroll and Loader, 2004). According to the species and environmental conditions, the increase in Ca can have a positive or negative influence in growth (Saurer et al., 2004; Peñuelas et al., 2011; Silva et al., 2015). Carrying out direct studies of gas exchanges between forest species and the atmosphere in natural environments is difficult; therefore, researchers usually resort to stable isotopes techniques in combination with the analysis of tree-rings (Silva et al., 2015; Dietrich et al., 2016). The composition of stable
RESPUESTA FISIOLÓGICA DE Taxodium mucronatum Ten. A LOS INCREMENTOS ATMOSFÉRICOS DE CO2 Y TEMPERATURA DEL ÚLTIMO SIGLO
131CORREA-DÍAZ et al.
El estudio directo del intercambio de gases entre las especies forestales y la atmósfera en ambientes naturales es difícil, por lo que es común recurrir a técnicas de isótopos estables en combinación con el análisis de anillos de crecimiento (Silva et al., 2015; Dietrich et al., 2016). La composición de isótopos es-tables en anillos de crecimiento es una huella natural que sirve como un registro de información del estado hídrico y de la eficiencia de uso de agua en especies forestales que crecieron en décadas o siglos pasados (Mc Carroll y Loader, 2004; Barnard et al., 2012; Gómez-Guerrero et al., 2013). Dado que el carbono y oxígeno son dos elemen-tos integrados a la madera, el análisis de la composi-ción de sus isótopos estables, paralelo con el estudio de los anillos de crecimiento, permite dilucidar los efectos de Ca sobre el crecimiento y estado hídri-co histórico en especies forestales. Mientras que el 13C en los anillos de crecimiento ayuda a identificar eventos pasados de estrés hídrico (sequías) y cam-bios netos de discriminación de 13C de la atmósfera hacia la hoja, el 18O está relacionado con el proceso de evapotranspiración y apertura estomática (Daw-son et al., 2002; Barnard et al., 2012). En tanto que las series de anillos de crecimiento proveen informa-ción de periodos favorables o desfavorables durante el crecimiento de los arboles (Fritts, 1976; Cook y Holmes, 1984). Por la independencia de 13C y 18O, con relación a procesos fisiológicos de las plantas, para recons-truir el desempeño fisiológico de los árboles, se ha recurrido a una estrategia dual de isótopos de 13C, 18O y el análisis de crecimiento del árbol (Barnard et al., 2012; Roden y Farquhar, 2012). La eficiencia de uso de agua intrínseca (iWUE, sus siglas en inglés) estimada desde la composición de isótopos carbono en la madera, es un indicador fisiológico importan-te que permite entender como responden las espe-cies forestales a los cambios de CO2 atmosférico en décadas recientes (Peñuelas et al., 2008; Peñuelas et al., 2011). En este estudio se empleó una técnica dual (13C y 18O) de isótopos estables en la madera en combi-nación con el análisis de los anillos de crecimiento, para investigar la respuesta fisiológica del ahuehue-te (Taxodium mucronatum Ten.) ante el aumento de CO2 atmosférico. Hay estudios en bosques boreales, templados y tropicales, pero las comunidades arbó-reas de ambientes riparios como el ahuehuete no se
isotopes in tree-rings is a natural footprint that serves as a record of the water status and the water-use efficiency in the forest species of previous decades or centuries (Mc Carroll and Loader, 2004; Barnard et al., 2012; Gómez-Guerrero et al., 2013). Given that carbon and oxygen are integrated into the wood, the analysis of the composition of their stable isotopes -along with the study of tree-rings- explains the effects of Ca on the growth and historic water status in forest species. While 13C in growth rings helps to identify past events of hydric stress (droughts) and net changes of 13C discrimination from the atmosphere to the leaf, 18O is related with the evapotranspiration and stomatal opening process (Dawson et al., 2002; Barnard et al., 2012). Meanwhile, the series of tree-rings provide information of favorable or unfavorable periods during the tree growth (Fritts, 1976; Cook and Holmes, 1984). Because 13C and 18O are independent from the physiological processes of plants, a dual strategy of 13C, 18O isotopes, and an analysis of tree growth (Barnard et al., 2012; Roden and Farquhar, 2012) has been used to rebuild the physiological performance of the trees. The intrinsic water-use efficiency (iWUE), estimated from the carbon isotope composition of wood, is an important physiological indicator that explains how forest species respond to the changes on atmospheric CO2 in recent decades (Peñuelas et al., 2008; Peñuelas et al., 2011). In this study, a dual technique (13C and 18O) of stable isotopes in wood was used in combination with the analysis of tree-rings; the objective was to research the physiological response of montezuma baldcypress (Taxodium mucronatum Ten.) in view of the increase of atmospheric CO2. Boreal, temperate, and tropical forests have been studied, but the arboreal communities of riparian zones -such as the Montezuma baldcypress- have not been researched. The Montezuma baldcypress species is sensitive to the amount of rainfall and the quality of water, and is associated with permanent or semi-permanent water reservoirs (Suzán-Azpiri et al., 2007; Villanueva et al., 2010). The objective of this study was to evaluate the isotope composition (13C and 18O), the net discrimination against 13C (13C), the growth rate in basal area, and the iWUE of T. mucronatum Ten. in the last 100 years, in three regions of central Mexico
132
AGROCIENCIA, 1 de enero - 15 de febrero, 2018
VOLUMEN 52, NÚMERO 1
han investigado. El ahuehuete es una especie sensible a la cantidad de precipitación y a la calidad del agua, y se asocia a reservorios permanentes o semiperma-nentes de agua (Suzán-Azpiri et al., 2007; Villanueva et al., 2010). El objetivo del presente estudio fue eva-luar la composición de isótopos (13C y 18O), la dis-criminación neta de 13C (13C), la tasa de crecimien-to en área basal y eficiencia de uso de agua intrínseca (iWUE) de T. mucronatum Ten. en los últimos 100 años, en tres regiones del centro de México con un gradiente de precipitación. Dada la sensibilidad del ahuehuete a la humedad, las variables fisiológicas mencionadas se analizaron con relación a periodos históricos secos y húmedos extremos en el siglo XX. Los periodos extremos se identificaron con métodos dendrocronológicos. Las hipótesis fueron: 1) la respuesta fisiológica de T. mucronatum Ten. a la variación climática es diferente entre regiones; 2) los cambios en la tasa de crecimiento en área basal y variables fisiológicas de ahuehuete sugieren efectos de fertilización en el siglo XX.
mAteRIAles y métodos
Sitios de estudio
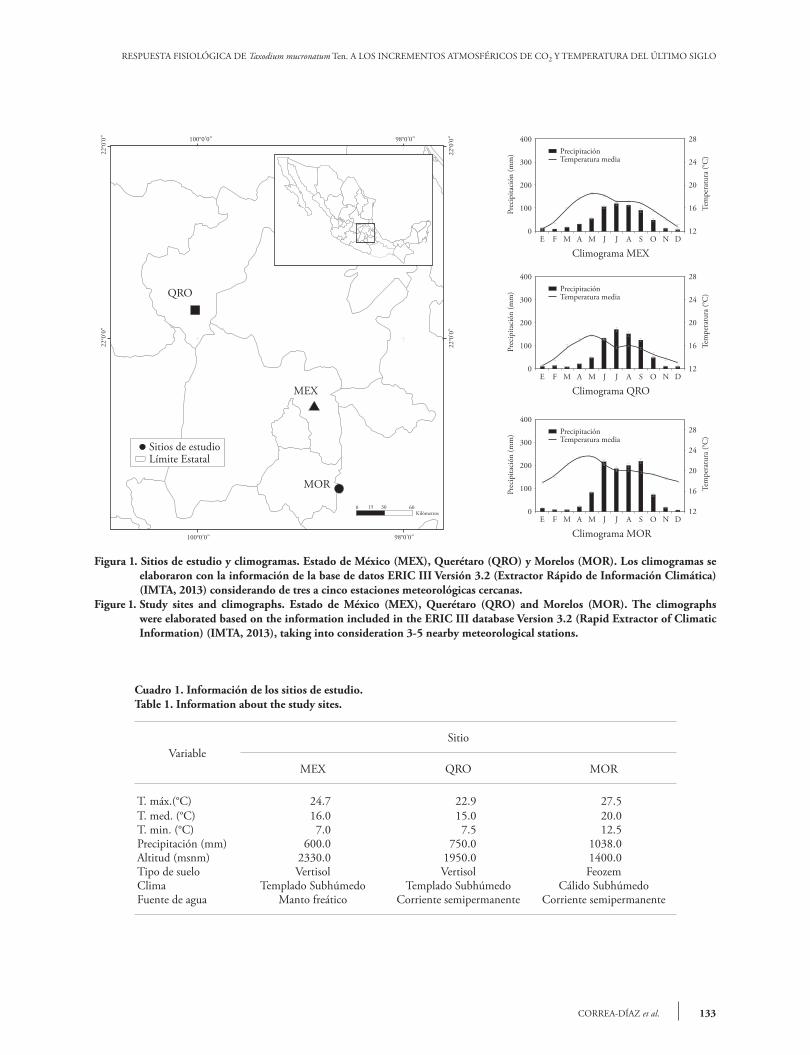
Los tres sitios de estudio se localizan en la región central de México, en poblaciones naturales de T. mucronatum Ten., en el Estado de México (MEX) y los estados de Querétaro (QRO) y Morelos (MOR); entre 18° 43’ 8.4’’ a 20° 33’ 00’’ N y 98° 44’ 06’’ a 100° 05’ 38.4’’ O (Figura 1). El régimen de humedad de los sitios MEX y QRO es ústico y en MOR údico. El régimen térmico de MEX es térmico y el de QRO y MOR isotérmico (Cuadro 1 y Figura 1).
Muestreo y fechado dendrocronológico
Nueve árboles se muestrearon por sitio, procurando una sección transversal del tronco en forma circular. De cada árbol se tomaron tres núcleos de madera distribuidos alrededor del tronco del árbol, a una altura de 1.3 m desde el nivel del suelo, con un taladro de Pressler marca HAGLÖF, modelo BS009 de 12 mm de diámetro interno. Las muestras de madera se secaron a temperatura ambiente y se lijaron con diversos grados de lija, para mejorar el contraste de los anillos de crecimiento. El ancho de anillo total se midió con un sistema VELMEX de precisión 0.001 mm (Robinson y Evans, 1980). El fechado se realizó con técnicas dendrocronológicas estándar (Stokes y Smiley, 1968).
with a rainfall gradient. Given the studied species’ sensitivity to humidity, these physiological variables were analyzed in relation to historically extreme dry and wet periods in the twentieth century. Extreme periods were identified with dendrochronological methods. The hypotheses were: 1) the physiological response of T. mucronatum Ten. to climatic variation is different among regions under study; 2) changes in the growth rate in basal area and the physiological variables of montezuma baldcypress suggest fertilization effects in the twentieth century.
mAteRIAls And methods
Study Sites
The three study sites are located in the central Mexico, in natural T. mucronatum Ten. populations, located in Estado de México (MEX), Querétaro (QRO), and Morelos (MOR); between 18° 43’ 8.4” and 20° 33’ 00” N, and 98° 44’ 06” and 100° 05’ 38.4” W (Figure 1). The moisture regime is ustic in MEX and QRO and udic in MOR. The soil temperature regime of MEX is thermal and the regime of QRO and MOR is isothermal (Table 1 and Figure 1).
Sampling and dendrochronological dating
Nine trees per site were sampled, using circular cross-section trunks as possible. Three increment cores were taken from several points around the trunk, at a height of 1.3 m above the ground level, with a 12-mm internal diameter Pressler increment core (HAGLÖF, model BS009). The wood samples were dried at room temperature and sanded with different grades of sandpaper, in order to improve the contrast of the growth rings. The total ring width was measured with a 0.001-mm precision VELMEX system (Robinson and Evans, 1980). The dating was done with standard dendrochronological techniques (Stokes and Smiley, 1968). The quality of the dating was verified with the COFECHA program (Holmes, 1983).
Estimation of the growth in basal area
The basal area increment (IAB) was estimated from the measurements of the ring width, assuming regular concentric rings. The following formula was used:
IAB R R= −( )−π n n2
12 (1)
RESPUESTA FISIOLÓGICA DE Taxodium mucronatum Ten. A LOS INCREMENTOS ATMOSFÉRICOS DE CO2 Y TEMPERATURA DEL ÚLTIMO SIGLO
133CORREA-DÍAZ et al.
Cuadro 1. Información de los sitios de estudio.Table 1. Information about the study sites.
VariableSitio
MEX QRO MOR
T. máx.(°C) 24.7 22.9 27.5T. med. (°C) 16.0 15.0 20.0T. min. (°C) 7.0 7.5 12.5Precipitación (mm) 600.0 750.0 1038.0Altitud (msnm) 2330.0 1950.0 1400.0Tipo de suelo Vertisol Vertisol FeozemClima Templado Subhúmedo Templado Subhúmedo Cálido SubhúmedoFuente de agua Manto freático Corriente semipermanente Corriente semipermanente
Figura 1. Sitios de estudio y climogramas. Estado de México (MEX), Querétaro (QRO) y Morelos (MOR). Los climogramas se elaboraron con la información de la base de datos ERIC III Versión 3.2 (Extractor Rápido de Información Climática) (IMTA, 2013) considerando de tres a cinco estaciones meteorológicas cercanas.
Figure 1. Study sites and climographs. Estado de México (MEX), Querétaro (QRO) and Morelos (MOR). The climographs were elaborated based on the information included in the ERIC III database Version 3.2 (Rapid Extractor of Climatic Information) (IMTA, 2013), taking into consideration 3-5 nearby meteorological stations.
QRO
MEX
MOR
22°0
’0”
22°0
’0”100°0’0”
100°0’0”
98°0’0”
98°0’0”
0 15 30 60Kilómetros
22°0
’0”
22°0
’0”
Sitios de estudioLímite Estatal
E F M A M J J A S O N D
28
24
20
16
12
400
300
200
100
0
Prec
ipita
ción
(mm
) PrecipitaciónTemperatura media
Tem
pera
tura
(°C
)
Climograma MEX
E F M A M J J A S O N D
28
24
20
16
12
400
300
200
100
0
Prec
ipita
ción
(mm
) PrecipitaciónTemperatura media
Tem
pera
tura
(°C
)
Climograma QRO
E F M A M J J A S O N D
28
24
20
16
12
400
300
200
100
0Pr
ecip
itaci
ón (m
m) Precipitación
Temperatura media
Tem
pera
tura
(°C
)
Climograma MOR
134
AGROCIENCIA, 1 de enero - 15 de febrero, 2018
VOLUMEN 52, NÚMERO 1
where R is the radius and n, the year in which the ring was formed. IAB is a better representation of the tree growth, because (unlike ring width) it remains stable for a longer period, during the development of the tree and it enables a direct interpretation of the growth rate, expressed as area in cm2 year1 (Poage and Tappeiner, 2002). The IAB trend through time was estimated using polynomials of order five and the exponential model.
Identification of extreme humidity events (dry and wet periods)
Geometric and biological trends not related to the climate (competition, suppression, and release) were removed with the ARSTAN program (Cook and Holmes, 1984), which generated a series of standardized annual growth in each population. To highlight low frequency extreme events (dry and wet periods), a spline was inserted in each series of ring width indexes (RWI) (Fritts, 1976; Cook and Peters, 1981). Afterwards, dry and wet periods detected in growth series of T. mucronatum Ten. were compared with other dendroclimatic series developed in Mexico, in order to corroborate common responses to extreme climatic events at the regional level (Fritts, 1991; Stahle et al.., 2009; Cook et al., 2010).
Analysis of isotopes in wood
The three most representative trees of each site -according to their chronological significance- were selected out of the nine trees sampled in the field. A sawdust sample was obtained from each tree and from each identified extreme period (dry and wet). Samples were taken during six-year periods, in order to collect enough sample material and perform the isotope analysis. Four dry periods were analyzed: I: 1895-1900, III: 1947-1952, VI: 1996-2001, and VII: 2007-2012; likewise, three wet periods were analyzed: II: 1910-1915, IV: 1965-1970, and V: 1988-1993. The sawdust samples of each period were weighed on a microbalance (Sartorius, 0.01 mg) and placed in tin and silver capsules (Elemental Microanalysis Limited, Okehampton, Devon, UK) to analyze 13C and 18O, respectively. Determination of 13C was performed using an Europa ANCA GSL elemental analyzer connected to a PDZ Europa 20-20 isotope ratio mass spectrometer (Sercon, Cheshire, UK). Determination of 18O was performed in a HEKAtech HT Oxygen Analyser (Wegberg, Germany) with interface to the abovementioned spectrometer. All the analyzes were performed at the UC Davis Stable Isotope Facility and the values were expressed in terms of their respective standards -13C: VPDB (Vienna Pee Dee Belemnite); 18O: VSMOW (Vienna Standard Mean Ocean Water).
La calidad del fechado se verificó con el programa COFECHA (Holmes, 1983).
Estimación del incremento en área basal
El incremento en área basal (IAB) se estimó a partir de las mediciones de anchura de anillo, asumiendo anillos concéntricos regulares y con la siguiente fórmula:
IAB R R= −( )−π n n2
12 (1)
donde R es el radio y n el año de formación del anillo. La ven-taja del IAB para representar el crecimiento del árbol es que a diferencia del ancho de anillo permanece estable por más tiem-po durante el desarrollo del árbol y permite una interpretación directa de la tasa de crecimiento, expresadas como área en cm2 año1 (Poage y Tappeiner, 2002). La tendencia del IAB a través de tiempo se estimó con polinomios de orden cinco y con el modelo exponencial.
Identificación de eventos extremos de humedad (periodos secos y húmedos)
Las tendencias geométricas y biológicas no relacionadas con el clima (competencia, supresión y liberación) se removieron con el programa ARSTAN (Cook y Holmes, 1984), lo que permi-tió generar una serie de crecimiento anual estandarizada en cada población. Para resaltar eventos extremos de baja frecuencia (pe-riodos secos y húmedos), se insertó una línea flexible suavizada (spline) en cada serie de índice de ancho de anillo (IAA) (Fritts, 1976; Cook y Peters, 1981). Después, los periodos secos y húme-dos detectados en las series de crecimiento de T. mucronatum Ten. se cotejaron con otras series dendroclimáticas desarrolladas en México para corroborar respuestas en común a eventos climá-ticos extremos a nivel regional (Fritts, 1991; Stahle et al., 2009; Cook et al., 2010).
Análisis de isótopos en madera
De los nueve árboles muestreados en campo se seleccionaron los tres más representativos por sitio de acuerdo con su signifi-cancia en la cronología y para cada árbol y cada periodo extremo (seco y húmedo) identificado se obtuvo una muestra de aserrín. Se tomaron muestras por periodos de seis años para recolectar su-ficiente muestra y realizar el análisis de isótopos. Cuatro periodos secos fueron analizados: I: 1895-1900, III: 1947-1952, VI: 1996-2001 y VII: 2007-2012; y tres periodos húmedos: II: 1910-1915, IV: 1965-1970 y V: 1988-1993. Las muestras de aserrín de cada periodo se pesaron en una microbalanza (Sartorius, 0.01 mg) y se
RESPUESTA FISIOLÓGICA DE Taxodium mucronatum Ten. A LOS INCREMENTOS ATMOSFÉRICOS DE CO2 Y TEMPERATURA DEL ÚLTIMO SIGLO
135CORREA-DÍAZ et al.
Estimation of physiological variables (13C, Ci, and iWUE)
The evolution of the carbon isotope composition (12C and 13C) in the atmosphere was taken into account in order to estimate the physiological variables. The abundance of 13C in the plant is expressed in relative source-product terms ( 13C, discrimination of carbon), taking into account the atmospheric variability (2) (Farquhar et al., 1982).
∆13 13 13 131 1000C C C Cair plant air= −( ) +( )δ δ δ/ / (2)
where is the discrimination against 13C, 13Cair is the carbon isotope composition in the air (source), and 13Cplant is the carbon isotope composition of the product (plant biomass). Discrimination of carbon is used in environmental physiology for long periods with changes in the composition of 13C in the atmosphere (pre-industrial vs. present times) (Mc Carroll and Loader, 2004).
Intercellular CO2 concentration (Ci) was estimated with Equation 3.
∆13C a b a= + −( )( )C Ci a/ (3)
where a is the discrimination against 13CO2 while the diffusion through the stoma takes place (4.4 ‰), b is the net discrimination resulting from carboxylation (27 ‰), Ci and Ca are the CO2
internal and environmental concentrations, respectively. Taking
into consideration Fick’s First Law A= ( )( )gCO C Ci a2 / , this equation can be expressed as follows (4).
∆1321 1 6C a b a A H O= + −( ) −( ). /C ga (4)
where A is the assimilation rate of CO2, and gCO2 is the stomatal conductance to CO2. Given that gH2O (or leaf conductance to water vapor) is 1.6 gCO2, the values of 13C can be connected with the A/gH2O quotient; which represents the iWUE of the plant (Farquhar and Richards, 1984; Mc Carroll and Loader, 2004).
Statistical analysis
Data were analyzed using a variable-spacing model of repeated samples in time, using the MIXED procedure of SAS 9.3 (SAS, 2011). Intercepts for each tree and the site were considered to be random; the effect of time, moisture regime, and interaction were tested to (p0.05) (Fitzmaurice et al., 2004). To test the differences between sites, a multivariate analysis of variance
colocaron en capsulas de estaño y plata (Elemental Microanalysis Limited, Okehampton, Devon, UK) para el análisis de 13C y 18O, respectivamente. La determinación de 13C se realizó en un analizador Europa ANCA-GSL acoplado a un espectróme-tro de masas PDZ Europa 20-20 (Sercon, Cheshire, UK) y la determinación de 18O se realizó en un analizador de oxigeno Hekatech HT (Wegberg, Germany) con interface al espectróme-tro de masas mencionado. Todos los análisis se realizaron en el Laboratorio de Isótopos Estables de la Universidad de California Davis y los valores se expresaron en términos de sus respectivos estándares (13C, VPDB- Vienna Pee Dee Belemnite y 18O, VSMOW- Vienna Estándar Mean Ocean Water).
Estimación de variables fisiológicas (13C, Ci y iWUE)
Para estimar las variables fisiológicas se consideró la evolu-ción de la composición de isótopos de carbono (12C y 13C) en la atmósfera. La abundancia de 13C en la planta se expresa en términos relativos de fuente-producto (13C, discriminación de carbono) considerando la variabilidad atmosférica (2) (Farquhar et al., 1982).
∆13 13 13 131 1000C C C Caire planta aire= −( ) +( )δ δ δ/ / (2)
donde es la discriminación contra 13C, 13Caire es la compo-sición de isótopos de carbono en el aire (fuente) y 13Cplanta es la composición de isótopos de carbono del producto (biomasa de la planta). La discriminación de carbono se usa en fisiología ambiental para periodos de tiempo amplios con cambios en la composición de 13C en la atmósfera (época pre-industrial vs. ac-tual) (Mc Carroll y Loader, 2004).
La concentración intercelular de CO2 (Ci ) se estimó con la Ecuación 3.
∆13C a b a= + −( )( )C Ci a/ (3)
donde a es la discriminación contra 13CO2 durante la difusión a través del estoma (4.4 ‰), b es la discriminación neta debido a la carboxilación (27 ‰), Ci y Ca son las concentraciones de CO2 interna y del ambiente, respectivamente. Considerando la Primer Ley de Fick A= ( )( )gCO C Ci a2 / esta ecuación se pue-de expresar de la siguiente forma (4).
∆1321 1 6C a b a A H O= + −( ) −( ). /C ga (4)
donde A es la tasa de asimilación de CO2, gCO2 es la conduc-tancia estomática a CO2, y dado que gH2O o conductancia de
136
AGROCIENCIA, 1 de enero - 15 de febrero, 2018
VOLUMEN 52, NÚMERO 1
la hoja a vapor de agua es 1.6 gCO2, los valores de 13C pueden relacionarse con el cociente entre A/gH2O; que representa la efi-ciencia de uso de agua intrínseca de la planta (iWUE) (Farquhar y Richards, 1984; Mc Carroll y Loader, 2004).
Análisis estadístico
Los datos se analizaron con un modelo de muestras repetidas en el tiempo con espaciado variable, usando el procedimiento MIXTO de SAS 9.3 (SAS, 2011). Los interceptos para cada árbol y el sitio se consideraron aleatorios; el efecto del tiempo, régimen de humedad e interacción se probaron a (p0.05) (Fitzmaurice et al., 2004). Para probar diferencias entre sitios, se realizó un análisis multivariado de la varianza (MANOVA), complementa-do por pruebas de contrastes entre sitios.
Interpretación de las tendencias en las variables fisiológicas
Los cambios en las variables fisiológicas se interpretaron con-siderando los escenarios propuestos por Saurer et al. (2004), y las relaciones entre 13C y 18O con relación a las variables fisiológi-cas (Scheidegger et al., 2000). Los tres escenarios de Saurer et al. (2004) consideran que: 1) Ci es constante (aumento de iWUE); 2) Ci /Ca es constante (aumento de iWUE) y; 3) CiCa es cons-tante (iWUE sin cambios). En el mismo orden, la interpretación es que Ci es independiente de los cambios de Ca, que Ci se ajusta proporcionalmente a los cambios Ca y que los cambios de Ci y Ca ocurren a la misma tasa. Una explicación detallada de estos escenarios se encuentra en Linares y Camarero, (2012). El mé-todo de Scheidegger et al. (2000) emplea relaciones entre 13C y 18O para deducir los cambios en la conductancia estomática (gl), capacidad fotosintética (Amax) y la eficiencia intrínseca de uso de agua (iWUE).
ResultAdos y dIscusIón
Series cronológicas e importancia de los periodos de baja frecuencia
La extensión cronológica varió de 109 a 233 años. Así, los árboles estudiados no se consideran seniles dada la longevidad de T. mucronatum Ten. que puede ser de varios siglos o rebasar el milenio (Villanueva-Díaz et al., 2010). La intercorrelación de la series fue significativa para todos los sitios, entre 0.36 y 0.51; mientras que la sensibilidad me-dia varió de 0.34 a 0.43 (Cuadro 2). Ambos indi-cadores, muestran la influencia y variación de una
(MANOVA) was performed, complemented by contrast tests between sites.
Interpretation of trends in physiological variables
Changes in physiological variables were interpreted considering the scenarios proposed by Saurer et al. (2004), and the relations between 13C and 18O regarding physiological variables (Scheidegger et al., 2000). The three scenarios suggested by Saurer et al. (2004) consider that: 1) Ci is constant (increased iWUE); 2) Ci /Ca is constant (increased iWUE); and, 3) CiCa is constant (unchanged iWUE). Those scenarios are interpreted as follows: Ci is independent of the changes in Ca; Ci proportionally adjusts to the changes in Ca; and the changes in Ci and Ca occur at the same rate. Linares and Camarero (2012) have provided a detailed explanation of these scenarios. The method proposed by Scheidegger et al. (2000) uses the relations between 13C and 18O to infer changes in stomatal conductance (gl), photosynthetic capacity (Amax), and iWUE.
Results And dIscussIon
Chronological series and importance of low frequency periods
The chronological length varied from 109 to 233 years. Thus, the trees studied were not considered senile given that T. mucronatum Ten.’s longevity can reach several centuries or go beyond one-thousand years (Villanueva-Díaz et al., 2010). The inter-correlation of the series was significant for all sites, with values ranging from 0.36 to 0.51; meanwhile mean sensitivity varied from 0.34 to 0.43 (Table 2). Both indicators show the influence and variation of a common climatic signal recorded in the ring width; therefore, the growth series are suitable to detect high and low frequency events (Fritts, 1976; Constant et al., 2010). For example, a 0.32 degree of inter-correlation is considered suitable for general trend purposes (Holmes, 1983). The degree of correlation between series tends to increase in dry places (Stahle et al., 2009), but the higher inter-correlation was found in the intermediate humidity site (QRO). The mean sensitivity is a relative index of how much ring width changes from one year to the next: in this case, the 0.34-0.43 values are expected, because mean sensitivity varies from 0.15 to 0.65, depending on the type of weather. The autocorrelation parameter in chronologies indicates the relationship between the
RESPUESTA FISIOLÓGICA DE Taxodium mucronatum Ten. A LOS INCREMENTOS ATMOSFÉRICOS DE CO2 Y TEMPERATURA DEL ÚLTIMO SIGLO
137CORREA-DÍAZ et al.
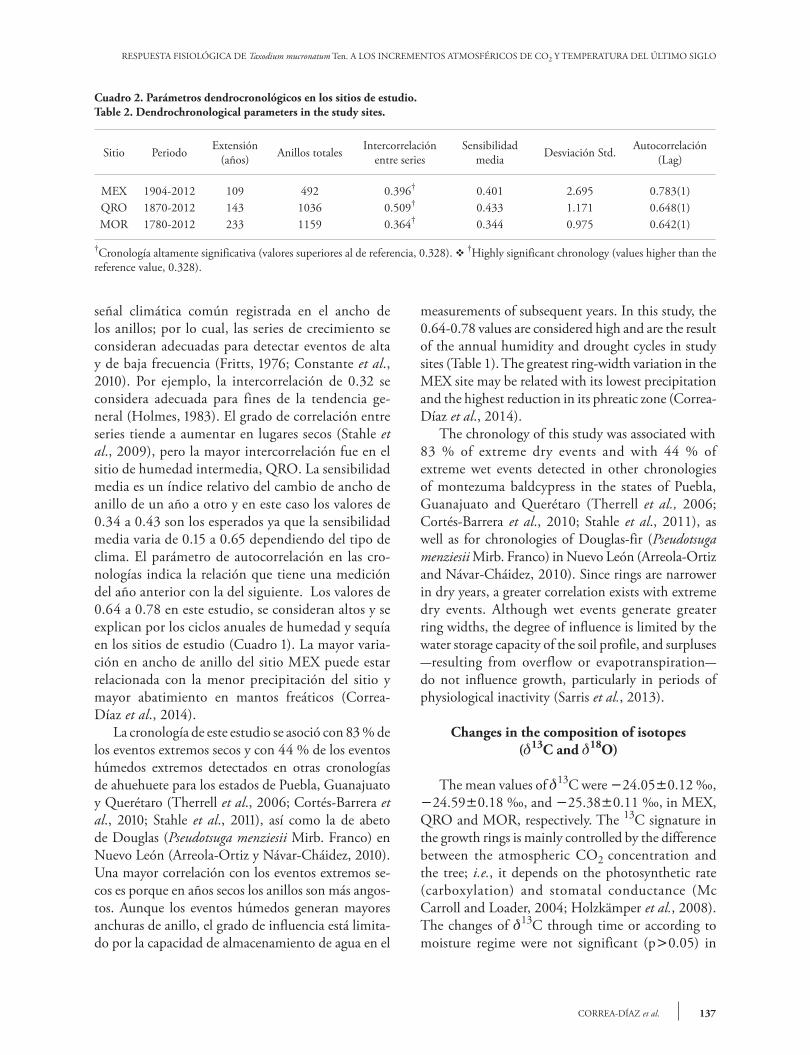
Cuadro 2. Parámetros dendrocronológicos en los sitios de estudio.Table 2. Dendrochronological parameters in the study sites.
Sitio Periodo Extensión(años) Anillos totales Intercorrelación
entre seriesSensibilidad
media Desviación Std. Autocorrelación (Lag)
MEX 1904-2012 109 492 0.396† 0.401 2.695 0.783(1)QRO 1870-2012 143 1036 0.509† 0.433 1.171 0.648(1)MOR 1780-2012 233 1159 0.364† 0.344 0.975 0.642(1)
†Cronología altamente significativa (valores superiores al de referencia, 0.328). v †Highly significant chronology (values higher than the reference value, 0.328).
señal climática común registrada en el ancho de los anillos; por lo cual, las series de crecimiento se consideran adecuadas para detectar eventos de alta y de baja frecuencia (Fritts, 1976; Constante et al., 2010). Por ejemplo, la intercorrelación de 0.32 se considera adecuada para fines de la tendencia ge-neral (Holmes, 1983). El grado de correlación entre series tiende a aumentar en lugares secos (Stahle et al., 2009), pero la mayor intercorrelación fue en el sitio de humedad intermedia, QRO. La sensibilidad media es un índice relativo del cambio de ancho de anillo de un año a otro y en este caso los valores de 0.34 a 0.43 son los esperados ya que la sensibilidad media varia de 0.15 a 0.65 dependiendo del tipo de clima. El parámetro de autocorrelación en las cro-nologías indica la relación que tiene una medición del año anterior con la del siguiente. Los valores de 0.64 a 0.78 en este estudio, se consideran altos y se explican por los ciclos anuales de humedad y sequía en los sitios de estudio (Cuadro 1). La mayor varia-ción en ancho de anillo del sitio MEX puede estar relacionada con la menor precipitación del sitio y mayor abatimiento en mantos freáticos (Correa-Díaz et al., 2014). La cronología de este estudio se asoció con 83 % de los eventos extremos secos y con 44 % de los eventos húmedos extremos detectados en otras cronologías de ahuehuete para los estados de Puebla, Guanajuato y Querétaro (Therrell et al., 2006; Cortés-Barrera et al., 2010; Stahle et al., 2011), así como la de abeto de Douglas (Pseudotsuga menziesii Mirb. Franco) en Nuevo León (Arreola-Ortiz y Návar-Cháidez, 2010). Una mayor correlación con los eventos extremos se-cos es porque en años secos los anillos son más angos-tos. Aunque los eventos húmedos generan mayores anchuras de anillo, el grado de influencia está limita-do por la capacidad de almacenamiento de agua en el
measurements of subsequent years. In this study, the 0.64-0.78 values are considered high and are the result of the annual humidity and drought cycles in study sites (Table 1). The greatest ring-width variation in the MEX site may be related with its lowest precipitation and the highest reduction in its phreatic zone (Correa-Díaz et al., 2014). The chronology of this study was associated with 83 % of extreme dry events and with 44 % of extreme wet events detected in other chronologies of montezuma baldcypress in the states of Puebla, Guanajuato and Querétaro (Therrell et al., 2006; Cortés-Barrera et al., 2010; Stahle et al., 2011), as well as for chronologies of Douglas-fir (Pseudotsuga menziesii Mirb. Franco) in Nuevo León (Arreola-Ortiz and Návar-Cháidez, 2010). Since rings are narrower in dry years, a greater correlation exists with extreme dry events. Although wet events generate greater ring widths, the degree of influence is limited by the water storage capacity of the soil profile, and surpluses -resulting from overflow or evapotranspiration- do not influence growth, particularly in periods of physiological inactivity (Sarris et al., 2013).
Changes in the composition of isotopes (13C and 18O)
The mean values of 13C were 24.050.12 ‰, 24.590.18 ‰, and 25.380.11 ‰, in MEX, QRO and MOR, respectively. The 13C signature in the growth rings is mainly controlled by the difference between the atmospheric CO2 concentration and the tree; i.e., it depends on the photosynthetic rate (carboxylation) and stomatal conductance (Mc Carroll and Loader, 2004; Holzkämper et al., 2008). The changes of 13C through time or according to moisture regime were not significant (p0.05) in
138
AGROCIENCIA, 1 de enero - 15 de febrero, 2018
VOLUMEN 52, NÚMERO 1
perfil del suelo y los excedentes, por escurrimiento o por evapotranspiración, no influyen en el crecimien-to en particular en periodos de inactividad fisiológica (Sarris et al., 2013).
Cambios en la composición de isótopos (13C y 18O)
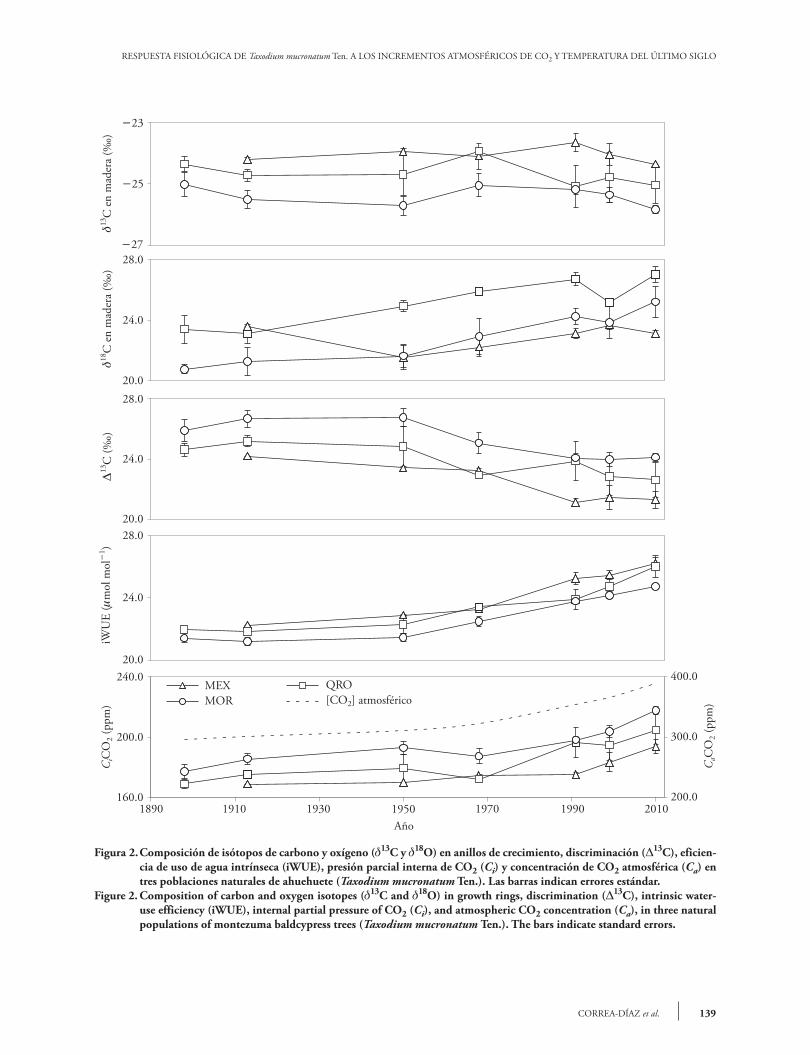
Los valores medios de 13C fueron 24.05 0.12 ‰, 24.590.18 ‰ y 25.380.11 ‰ para MEX, QRO y MOR, respectivamente. La firma de 13C en los anillos de crecimiento es controlada prin-cipalmente por la diferencia entre la concentración de CO2 en la atmósfera y el árbol; es decir, depende de la tasa de fotosíntesis (carboxilación) y conduc-tancia estomática (Mc Carroll y Loader, 2004; Hol-zkämper et al., 2008). Los cambios de 13C a través del tiempo o de acuerdo con el régimen de hume-dad no fueron significativos (p0.05) en los sitios de MEX y QRO. En el sitio MOR los cambios de 13C a través del tiempo fueron dependientes del ré-gimen de humedad (evento seco o húmedo) (Figura 2, Cuadro 3). En este sentido, la composición de 13C en la madera no reflejó los cambios 13C atmosféri-cos como ha ocurrido para otras especies forestales (García-G et al., 2004; Gómez-Guerrero et al., 2013; Silva et al., 2015). Generalmente la firma de 13C re-fleja la dilución de 13C causada por el uso de combus-tibles fósiles (Mc Carroll y Loader, 2004). Aunque las diferencias no fueron significativas en el tiempo, los valores medios de 24.05 ‰, 24.59 ‰ y 25.38 ‰ si presentan diferencias significativas (p0.0001) y reflejan un gradiente esperado de me-nor a mayor humedad en el orden MEX, QRO y MOR, respectivamente. La firma de 13C en madera no muestra los cambios de 13C atmosféricos posi-blemente debido a que los ahuehuetes se desarrollan cerca de reservorios de agua y la discriminación de 13C es estable durante el año. Sin embargo, el cam-bio neto expresado como 13C observado en los tres sitios si indica influencia en el intercambio de gases debido a cambios de Ca (Figura 2). El análisis de contrastes indicó diferencias signi-ficativas (p0.05) de 13C entre los sitios MEX y MOR para los periodos III, IV y VII. No hubo dife-rencias entre periodos de MEX y QRO. Para QRO y MOR sólo el periodo IV fue estadísticamente dife-rente (Cuadro 4). Los sitios con precipitación con-trastante, MEX y MOR, son los únicos que muestran
MEX and QRO. In MOR, the changes of 13C through time depended on the moisture regime (dry or wet event) (Figure 2, Table 3). In this sense, the composition of 13C in the wood did not reflect the 13C changes in the atmosphere, like in other forest species (García-G et al., 2004; Gómez-Guerrero et al., 2013; Silva et al., 2015). Generally, the 13C signature reflects the 13C dilution caused by the use of fossil fuels (Mc Carroll and Loader, 2004). Although the differences were not significant through time, the 24.05 ‰, 24.59 ‰, and 25.38 ‰ mean values do show significant differences (p0.0001), and reflect an expected humidity gradient from lowest to highest (MEX-QRO-MOR). The 13C signature in wood does not show the 13C changes in the atmosphere, possibly because the montezuma baldcypress trees grow near water reservoirs and the discrimination of 13C is stable throughout the year. However, the net change expressed as 13C -observed in all three sites- indicates that changes in Ca do have an influence in gas exchange (Figure 2). The analysis of contrasts indicated significant differences (p0.05) of 13C between the MEX and MOR sites, during periods III, IV, and VII. There were no differences between the MEX and QRO periods. In QRO and MOR, only period IV was statistically different (Table 4). Sites with contrasting rainfall (MEX and MOR) are the only ones that show 13C differences between them, and, if a marginal significance (p0.079) is taken into consideration, the differences are evident from periods III to VII (Table 4). The more negative values of 13C in MOR indicate less discrimination and less hydric stress as a result of the site’s higher humidity (Figure 2). The values of 13C in our study are lower than those reported for Pinus tabulaeformis and P. taiwanensis in subtropical forests in China (Xu et al., 2014); however, they are similar to those reported by Silva et al. (2009) for Araucaria angustifolia in Brazil, and by Gómez-Guerrero et al. (2013) and Silva et al. (2015) for Abies religiosa and Pinus hartwegii in Mexico. The values of 18O were different (p0.05) through time in all three sites, with a 4.0 ‰ mean increase over the last century. The timeregime interaction was not significant anywhere. The contrasts indicated differences between MEX and QRO in periods V and VII. For MOR and QRO, there was a statistical difference of 18O in period V (Table 3 and 4).
RESPUESTA FISIOLÓGICA DE Taxodium mucronatum Ten. A LOS INCREMENTOS ATMOSFÉRICOS DE CO2 Y TEMPERATURA DEL ÚLTIMO SIGLO
139CORREA-DÍAZ et al.
Figura 2. Composición de isótopos de carbono y oxígeno (13C y 18O) en anillos de crecimiento, discriminación (13C), eficien-cia de uso de agua intrínseca (iWUE), presión parcial interna de CO2 (Ci) y concentración de CO2 atmosférica (Ca) en tres poblaciones naturales de ahuehuete (Taxodium mucronatum Ten.). Las barras indican errores estándar.
Figure 2. Composition of carbon and oxygen isotopes (13C and 18O) in growth rings, discrimination (13C), intrinsic water-use efficiency (iWUE), internal partial pressure of CO2 (Ci), and atmospheric CO2 concentration (Ca), in three natural populations of montezuma baldcypress trees (Taxodium mucronatum Ten.). The bars indicate standard errors.
-23
-25
-27
13d
C e
n m
ader
a (‰
)18
dC
en
mad
era
()
‰13
DC
()
‰
28.0
24.0
20.028.0
24.0
20.028.0
24.0
20.0240.0
200.0
160.0
400.0
300.0
200.0
-1
iWU
E (m
mol
mol
)C
CO
(ppm
)i
2
CC
O (p
pm)
a2
1890 1910 1930 1950 1970 1990 2010Año
MEXMOR
QRO[CO ] atmosférico2
140
AGROCIENCIA, 1 de enero - 15 de febrero, 2018
VOLUMEN 52, NÚMERO 1
diferencias entre ellos para 13C, y si se considera una significancia marginal (p0.079), las diferencias son evidentes de los periodos III al VII (Cuadro 4). Los valores más negativos de 13C de MOR indican me-nor discriminación y menor estrés hídrico por la ma-yor humedad en este sitio (Figura 2). Los valores de 13C en nuestro estudio son me-nores que los reportados para Pinus tabulaeformis y P.
The increase of 18O through time in all three sites indicates possible changes in the water source or greater evapotranspiration (Kohn and Welker, 2005). Since there is not data of 18O in rainwater in study sites, it is difficult to separate the water source effect or demonstrate that evapotranspiration (and temperature) increased in the twentieth century. However, when nearby weather stations are taken into
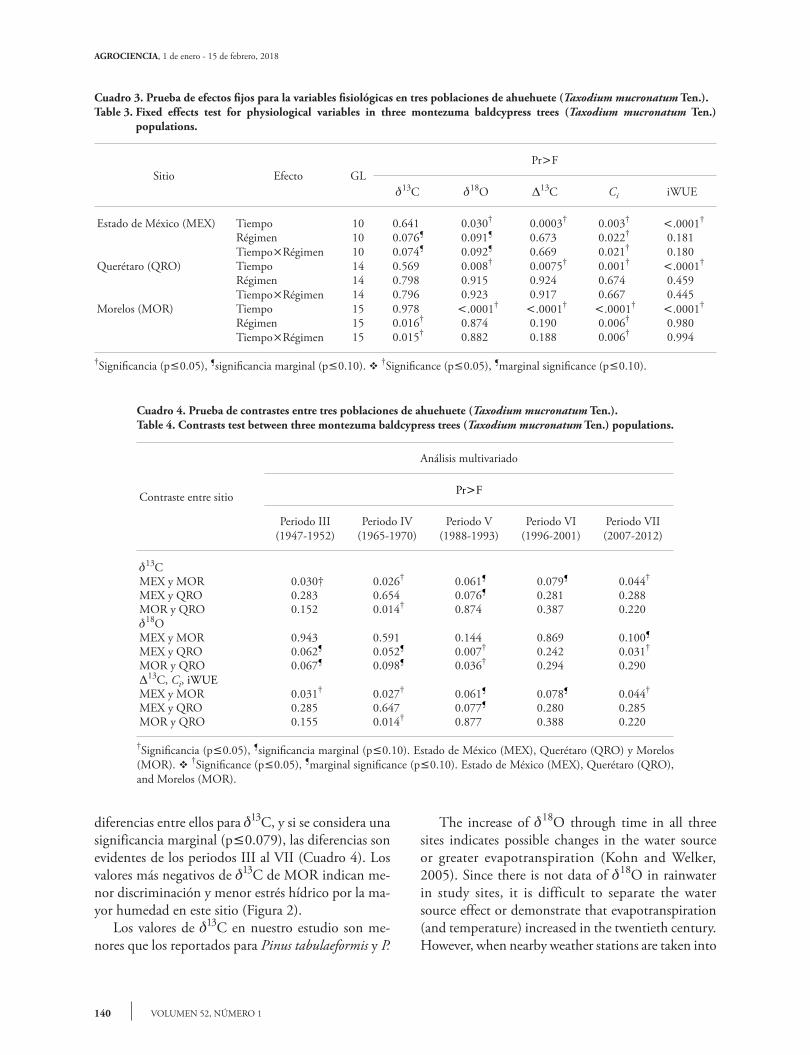
Cuadro 3. Prueba de efectos fijos para la variables fisiológicas en tres poblaciones de ahuehuete (Taxodium mucronatum Ten.).Table 3. Fixed effects test for physiological variables in three montezuma baldcypress trees (Taxodium mucronatum Ten.)
populations.
Sitio Efecto GLPrF
13C 18O 13C Ci iWUE
Estado de México (MEX) Tiempo 10 0.641 0.030† 0.0003† 0.003† .0001†
Régimen 10 0.076¶ 0.091¶ 0.673 0.022† 0.181TiempoRégimen 10 0.074¶ 0.092¶ 0.669 0.021† 0.180
Querétaro (QRO) Tiempo 14 0.569 0.008† 0.0075† 0.001† .0001†
Régimen 14 0.798 0.915 0.924 0.674 0.459TiempoRégimen 14 0.796 0.923 0.917 0.667 0.445
Morelos (MOR) Tiempo 15 0.978 .0001† .0001† .0001† .0001†
Régimen 15 0.016† 0.874 0.190 0.006† 0.980TiempoRégimen 15 0.015† 0.882 0.188 0.006† 0.994
†Significancia (p0.05), ¶significancia marginal (p0.10). v †Significance (p0.05), ¶marginal significance (p0.10).
Cuadro 4. Prueba de contrastes entre tres poblaciones de ahuehuete (Taxodium mucronatum Ten.).Table 4. Contrasts test between three montezuma baldcypress trees (Taxodium mucronatum Ten.) populations.
Contraste entre sitio
Análisis multivariado
PrF
Periodo III(1947-1952)
Periodo IV(1965-1970)
Periodo V(1988-1993)
Periodo VI(1996-2001)
Periodo VII(2007-2012)
13CMEX y MOR 0.030† 0.026† 0.061¶ 0.079¶ 0.044†
MEX y QRO 0.283 0.654 0.076¶ 0.281 0.288MOR y QRO 0.152 0.014† 0.874 0.387 0.22018OMEX y MOR 0.943 0.591 0.144 0.869 0.100¶
MEX y QRO 0.062¶ 0.052¶ 0.007† 0.242 0.031†
MOR y QRO 0.067¶ 0.098¶ 0.036† 0.294 0.29013C, Ci, iWUEMEX y MOR 0.031† 0.027† 0.061¶ 0.078¶ 0.044†
MEX y QRO 0.285 0.647 0.077¶ 0.280 0.285MOR y QRO 0.155 0.014† 0.877 0.388 0.220
†Significancia (p0.05), ¶significancia marginal (p0.10). Estado de México (MEX), Querétaro (QRO) y Morelos (MOR). v †Significance (p0.05), ¶marginal significance (p0.10). Estado de México (MEX), Querétaro (QRO), and Morelos (MOR).
RESPUESTA FISIOLÓGICA DE Taxodium mucronatum Ten. A LOS INCREMENTOS ATMOSFÉRICOS DE CO2 Y TEMPERATURA DEL ÚLTIMO SIGLO
141CORREA-DÍAZ et al.
taiwanensis, en bosques subtropicales de China (Xu et al., 2014), pero similares a los reportados por Silva et al. (2009) para Araucaria angustifolia en Brasil y por Gómez-Guerrero et al. (2013) y Silva et al. (2015) para Abies religiosa y Pinus hartwegii en México. Los valores de 18O fueron diferentes (p0.05) en el tiempo en los tres sitios, con incremento me-dio de 4.0 ‰ en el último siglo. La interacción tiemporégimen no fue significativa en ningún si-tio. Los contrastes indicaron diferencias entre MEX y QRO en los periodos V y VII. Para MOR y QRO hubo diferencia estadística de 18O en el periodo V (Cuadro 3 y 4). El aumento de 18O en el tiempo en los tres si-tios indica posibles cambios en la fuente de agua o mayor evapotranspiración (Kohn y Welker, 2005). Dado que no hay datos de 18O del agua de lluvia en los sitios de estudio, es difícil separar el efecto por la fuente de agua o demostrar que la evapotrans-piración (y temperatura) aumentaron en el siglo XX. Pero al considerar las estaciones meteorológicas cercanas a cada sitio, sí hay evidencia de un aumen-to en la temperatura media anual en los últimos 50 años, entre 1.2 y 1.4 °C en todos los sitios. Por lo an-terior, es probable que el incremento en 4.0 ‰ en los tres sitios de estudio sea un reflejo del aumento de la temperatura y la evapotranspiración que enri-quecieron la firma de 18O en el agua utilizada por los árboles. La explicación de un incremento en evapotrans-piración y temperatura es congruente con la crisis de abastecimiento de agua en los sitios de estudio. De acuerdo con la Comisión Nacional del Agua (CNA) hay un abatimiento 111,755,911 m3 año1 en los acuíferos de sito MEX y de 12 929 028 año1 en el sitio QRO (CNA, 2015). La disminución de agua subterránea condiciona a los árboles de ahuehuete a extender su sistema radical a estratos más profundos con su costo en crecimiento aéreo (Enríquez-Peña y Suzán-Azpiri, 2011).
Variables fisiológicas (13C, Ci y iWUE)
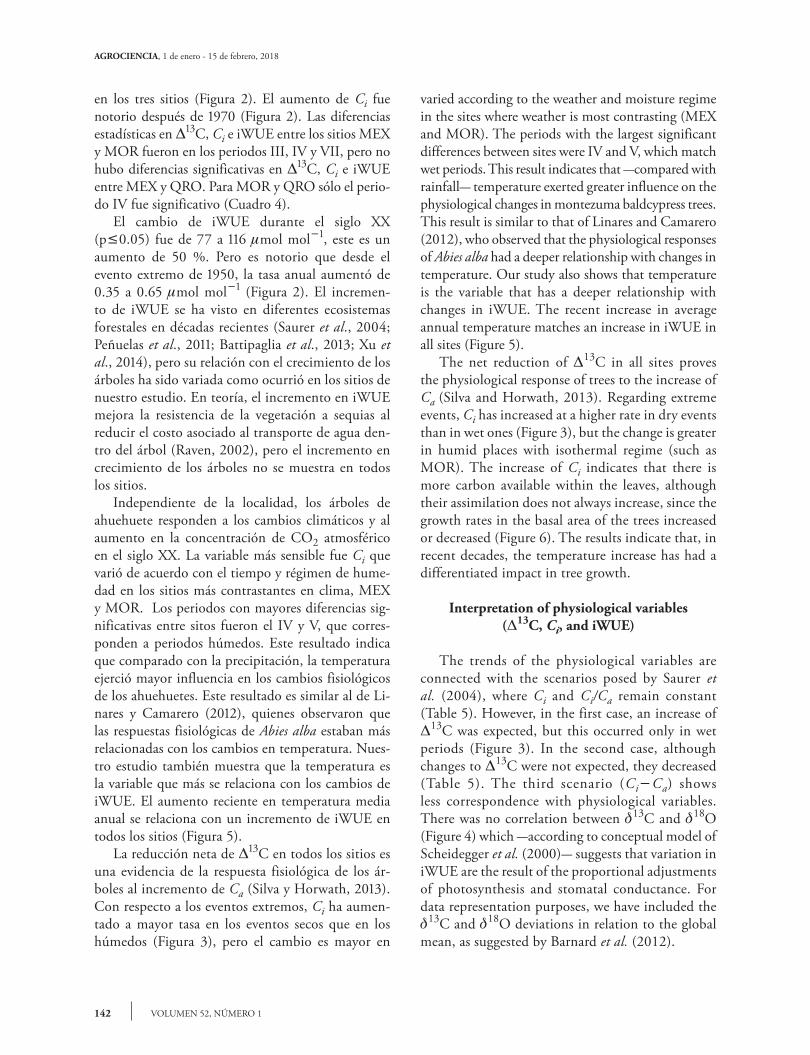
Las diferencias de 13C, Ci y iWUE en el tiempo fueron significativas (p0.05) en los tres sitios. El ré-gimen de humedad y la interacción tiemporégimen fueron significativos para Ci en los sitios MEX y MOR (Cuadro 3). La disminución de 13C y el au-mento de iWUE fue más evidente después de 1950
consideration, there is indeed evidence of an increase in average annual temperature over the last 50 years (1.2-1.4 °C in all sites). Therefore, the 4.0 ‰ increase in the three sites under study is likely a reflection of the temperature and evapotranspiration increase that enriched the 18O signature in the water used by trees. The explanation of an evapotranspiration and temperature increase is congruent with the water supply crisis in the study sites. According to the National Commission for Water (CNA), there is an 111 755 911 m3 year1 reduction in MEX site aquifers and 12 929 028 m3 year1 in the QRO site (CNA, 2015). The groundwater decrease forces the montezuma baldcypress trees to extend their root system to deeper layers and it limits their aerial growth (Enríquez-Peña and Suzán-Azpiri, 2011).
Physiological variables (13C, Ci, and iWUE)
The 13C, Ci and iWUE differences over time were significant (p0.05) in the three sites. The moisture regime and the timeregime interaction were significant for Ci in MEX and MOR (Table 3). The decrease in 13C and increase in iWUE were more evident after 1950 in all three sites (Figure 2). The increase in Ci was noticeable after 1970 (Figure 2). There were statistical differences in 13C, Ci, and iWUE between MEX and MOR in periods III, IV and VII, but there were no significant differences in 13C, Ci, and iWUE between MEX and QRO. For MOR and QRO, only period IV was significant (Table 4). During the twentieth century (p0.05), iWUE increased from 77 to 116 mol mol1 (a 50 % increase). However, it is well-known that the annual rate increased from 0.35 to 0.65 mol mol1 after the extreme event of 1950 (Figure 2). In recent decades, iWUE has increased in different forest ecosystems (Saurer et al., 2004; Peñuelas et al., 2011; Battipaglia et al., 2013; Xu et al., 2014), but it has had a variable relationship with tree growth, including in our study sites. Theoretically, the increase of iWUE improves the drought resistance of vegetation, because it reduces the cost associated with the transport of water within the tree (Raven, 2002), but tree growth does not increase in all sites. Regardless of their locality, montezuma baldcypress trees respond to climate changes and to the increase of atmospheric CO2 concentration in the twentieth century. The most sensitive variable was Ci, which
142
AGROCIENCIA, 1 de enero - 15 de febrero, 2018
VOLUMEN 52, NÚMERO 1
en los tres sitios (Figura 2). El aumento de Ci fue notorio después de 1970 (Figura 2). Las diferencias estadísticas en 13C, Ci e iWUE entre los sitios MEX y MOR fueron en los periodos III, IV y VII, pero no hubo diferencias significativas en 13C, Ci e iWUE entre MEX y QRO. Para MOR y QRO sólo el perio-do IV fue significativo (Cuadro 4). El cambio de iWUE durante el siglo XX (p0.05) fue de 77 a 116 mol mol1, este es un aumento de 50 %. Pero es notorio que desde el evento extremo de 1950, la tasa anual aumentó de 0.35 a 0.65 mol mol1 (Figura 2). El incremen-to de iWUE se ha visto en diferentes ecosistemas forestales en décadas recientes (Saurer et al., 2004; Peñuelas et al., 2011; Battipaglia et al., 2013; Xu et al., 2014), pero su relación con el crecimiento de los árboles ha sido variada como ocurrió en los sitios de nuestro estudio. En teoría, el incremento en iWUE mejora la resistencia de la vegetación a sequias al reducir el costo asociado al transporte de agua den-tro del árbol (Raven, 2002), pero el incremento en crecimiento de los árboles no se muestra en todos los sitios. Independiente de la localidad, los árboles de ahuehuete responden a los cambios climáticos y al aumento en la concentración de CO2 atmosférico en el siglo XX. La variable más sensible fue Ci que varió de acuerdo con el tiempo y régimen de hume-dad en los sitios más contrastantes en clima, MEX y MOR. Los periodos con mayores diferencias sig-nificativas entre sitos fueron el IV y V, que corres-ponden a periodos húmedos. Este resultado indica que comparado con la precipitación, la temperatura ejerció mayor influencia en los cambios fisiológicos de los ahuehuetes. Este resultado es similar al de Li-nares y Camarero (2012), quienes observaron que las respuestas fisiológicas de Abies alba estaban más relacionadas con los cambios en temperatura. Nues-tro estudio también muestra que la temperatura es la variable que más se relaciona con los cambios de iWUE. El aumento reciente en temperatura media anual se relaciona con un incremento de iWUE en todos los sitios (Figura 5). La reducción neta de 13C en todos los sitios es una evidencia de la respuesta fisiológica de los ár-boles al incremento de Ca (Silva y Horwath, 2013). Con respecto a los eventos extremos, Ci ha aumen-tado a mayor tasa en los eventos secos que en los húmedos (Figura 3), pero el cambio es mayor en
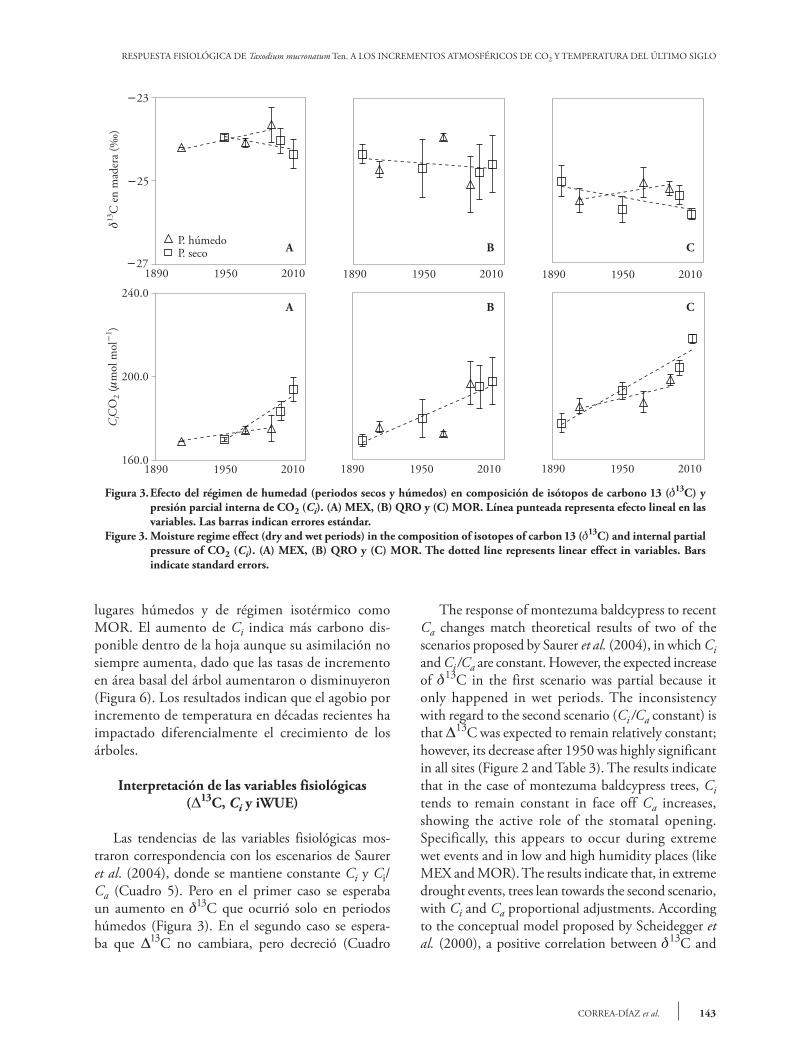
varied according to the weather and moisture regime in the sites where weather is most contrasting (MEX and MOR). The periods with the largest significant differences between sites were IV and V, which match wet periods. This result indicates that -compared with rainfall- temperature exerted greater influence on the physiological changes in montezuma baldcypress trees. This result is similar to that of Linares and Camarero (2012), who observed that the physiological responses of Abies alba had a deeper relationship with changes in temperature. Our study also shows that temperature is the variable that has a deeper relationship with changes in iWUE. The recent increase in average annual temperature matches an increase in iWUE in all sites (Figure 5). The net reduction of 13C in all sites proves the physiological response of trees to the increase of Ca (Silva and Horwath, 2013). Regarding extreme events, Ci has increased at a higher rate in dry events than in wet ones (Figure 3), but the change is greater in humid places with isothermal regime (such as MOR). The increase of Ci indicates that there is more carbon available within the leaves, although their assimilation does not always increase, since the growth rates in the basal area of the trees increased or decreased (Figure 6). The results indicate that, in recent decades, the temperature increase has had a differentiated impact in tree growth.
Interpretation of physiological variables (13C, Ci, and iWUE)
The trends of the physiological variables are connected with the scenarios posed by Saurer et al. (2004), where Ci and Ci/Ca remain constant (Table 5). However, in the first case, an increase of 13C was expected, but this occurred only in wet periods (Figure 3). In the second case, although changes to 13C were not expected, they decreased (Table 5). The third scenario (CiCa) shows less correspondence with physiological variables. There was no correlation between 13C and 18O (Figure 4) which -according to conceptual model of Scheidegger et al. (2000)- suggests that variation in iWUE are the result of the proportional adjustments of photosynthesis and stomatal conductance. For data representation purposes, we have included the 13C and 18O deviations in relation to the global mean, as suggested by Barnard et al. (2012).
RESPUESTA FISIOLÓGICA DE Taxodium mucronatum Ten. A LOS INCREMENTOS ATMOSFÉRICOS DE CO2 Y TEMPERATURA DEL ÚLTIMO SIGLO
143CORREA-DÍAZ et al.
-23
-25
-27
13d
C e
n m
ader
a (
)‰
P. húmedoP. seco
-1
CC
O (m
mol
mol
)i
2
240.0
200.0
160.0
1890 1950 2010 1890 1950 2010 1890 1950 2010
1890 1950 20101890 1950 20101890 1950 2010
A
A
B
B
C
C
Figura 3. Efecto del régimen de humedad (periodos secos y húmedos) en composición de isótopos de carbono 13 (13C) y presión parcial interna de CO2 (Ci). (A) MEX, (B) QRO y (C) MOR. Línea punteada representa efecto lineal en las variables. Las barras indican errores estándar.
Figure 3. Moisture regime effect (dry and wet periods) in the composition of isotopes of carbon 13 (13C) and internal partial pressure of CO2 (Ci). (A) MEX, (B) QRO y (C) MOR. The dotted line represents linear effect in variables. Bars indicate standard errors.
lugares húmedos y de régimen isotérmico como MOR. El aumento de Ci indica más carbono dis-ponible dentro de la hoja aunque su asimilación no siempre aumenta, dado que las tasas de incremento en área basal del árbol aumentaron o disminuyeron (Figura 6). Los resultados indican que el agobio por incremento de temperatura en décadas recientes ha impactado diferencialmente el crecimiento de los árboles.
Interpretación de las variables fisiológicas (13C, Ci y iWUE)
Las tendencias de las variables fisiológicas mos-traron correspondencia con los escenarios de Saurer et al. (2004), donde se mantiene constante Ci y Ci/Ca (Cuadro 5). Pero en el primer caso se esperaba un aumento en 13C que ocurrió solo en periodos húmedos (Figura 3). En el segundo caso se espera-ba que 13C no cambiara, pero decreció (Cuadro
The response of montezuma baldcypress to recent Ca changes match theoretical results of two of the scenarios proposed by Saurer et al. (2004), in which Ci and Ci /Ca are constant. However, the expected increase of 13C in the first scenario was partial because it only happened in wet periods. The inconsistency with regard to the second scenario (Ci /Ca constant) is that 13C was expected to remain relatively constant; however, its decrease after 1950 was highly significant in all sites (Figure 2 and Table 3). The results indicate that in the case of montezuma baldcypress trees, Ci tends to remain constant in face off Ca increases, showing the active role of the stomatal opening. Specifically, this appears to occur during extreme wet events and in low and high humidity places (like MEX and MOR). The results indicate that, in extreme drought events, trees lean towards the second scenario, with Ci and Ca proportional adjustments. According to the conceptual model proposed by Scheidegger et al. (2000), a positive correlation between 13C and

144
AGROCIENCIA, 1 de enero - 15 de febrero, 2018
VOLUMEN 52, NÚMERO 1
-4-4
-2
-2
0
0
2
2
4
4
18d O- promedio (%)18d O
13d
C-
prom
edio
()
13d
C
‰
Figura 4. Desviación de 13C y 18O en anillos de crecimiento con respecto a la media global. Los datos son para los tres sitios, MEX (triángulo), QRO (cuadro) y MOR (círculo).
Figure 4. Deviation of 13C and 18O in growth rings in re-lation to the global mean. Data are for the three sites: MEX (triangle), QRO (square), and MOR (circle).
5). El tercer escenario con CiCa es el que presenta menos correspondencia con las variables fisiológicas. No hubo correlación entre los 13C y 18O (Figura 4) lo que de acuerdo con el modelo conceptual de Scheidegger et al. (2000), sugieren que la variación de iWUE se debe a ajustes proporcionales de la fo-tosíntesis y conductividad estomática. Para la repre-sentación de los datos se muestran las desviaciones de 13C y 18O con respecto a la media global como lo sugieren Barnard et al. (2012). La respuesta del ahuehuete a los cambios recien-tes de Ca coincide con resultados teóricos de dos escenarios de Saurer et al. (2004), con Ci y Ci/Ca constantes. No obstante, para el primer escenario el incremento esperado de 13C fue parcial ya que sólo ocurrió en periodos húmedos. La inconsisten-cia con el segundo escenario (Ci/Ca constante) es que se esperaba que 13C se mostrara relativamen-te constante, pero su disminución después de 1950 fue altamente significativa en todos los sitios (Fi-gura 2 y Cuadro 3). Los resultados indican que en ahuehuete Ci tiende a mantenerse constante ante los aumentos de Ca, mostrando la función activa de la apertura estomática. Específicamente, esto pare-ce ocurrir durante los eventos extremos húmedos y en lugares de baja y alta humedad como en MEX y MOR. Los resultados indican que en los eventos extremos de sequía los árboles tienden al segundo escenario con ajustes proporcionales de Ci y Ca. De acuerdo con el modelo conceptual de Scheidegger et al. (2000) no se observa una correlación positiva entre 13C y 18O (Figura 4) lo que descarta que el incremento de iWUE se deba a una reducción en conductancia estomática (gs ) y niveles estables de fotosíntesis (A). La tendencia horizontal de las desviaciones de 13C y 18O con relación a la me-
18O is not observed (Figure 4); therefore, the idea that the increase of iWUE was caused by the reduction in stomatal conductance (gs) and stable photosynthesis (A) levels was dismissed. The horizontal trend of 13C and 18O deviations with regard to the general mean suggest proportional adjustments of A and support the second scenario proposed by Saurer et al. (2004).
Relation between physiological variables and climate
The Ci and iWUE variables show a linear increase in relation to Ca, in the twentieth century (Figure 5).
Cuadro 5. Tendencia esperada (en color negro) y observada (en color gris) de las variables fisiológicas.Table 5. Expected (black) and observed (gray) trend of the physiological variables.
Escenario Ci Ci/Ca CiCa 13C 13C iWUE
Ci constante Parcial Ci/Ca constante Constante, NO Ci-Ca constante NO Parcial NO Constante, NO
Los escenarios corresponden a los planteados por Saurer et al. (2004). Las tendencias encontradas en este estudio se indican en color gris. Cuando el resultado de este estudio coincide parcialmente o difiere del modelo conceptual, se indica con “Parcial” y “NO”, respectivamente. v Scenarios match those suggested by Saurer et al. (2004). The trends found in this study are indicated in gray. Result that partially match or differ from the conceptual model are indicated with “Partial” and “NO”, respectively.
RESPUESTA FISIOLÓGICA DE Taxodium mucronatum Ten. A LOS INCREMENTOS ATMOSFÉRICOS DE CO2 Y TEMPERATURA DEL ÚLTIMO SIGLO
145CORREA-DÍAZ et al.
dia general sugiere ajustes proporcionales de A y que apoyan el segundo escenario de Saurer et al. (2004).
Relación de variables fisiológicas y clima
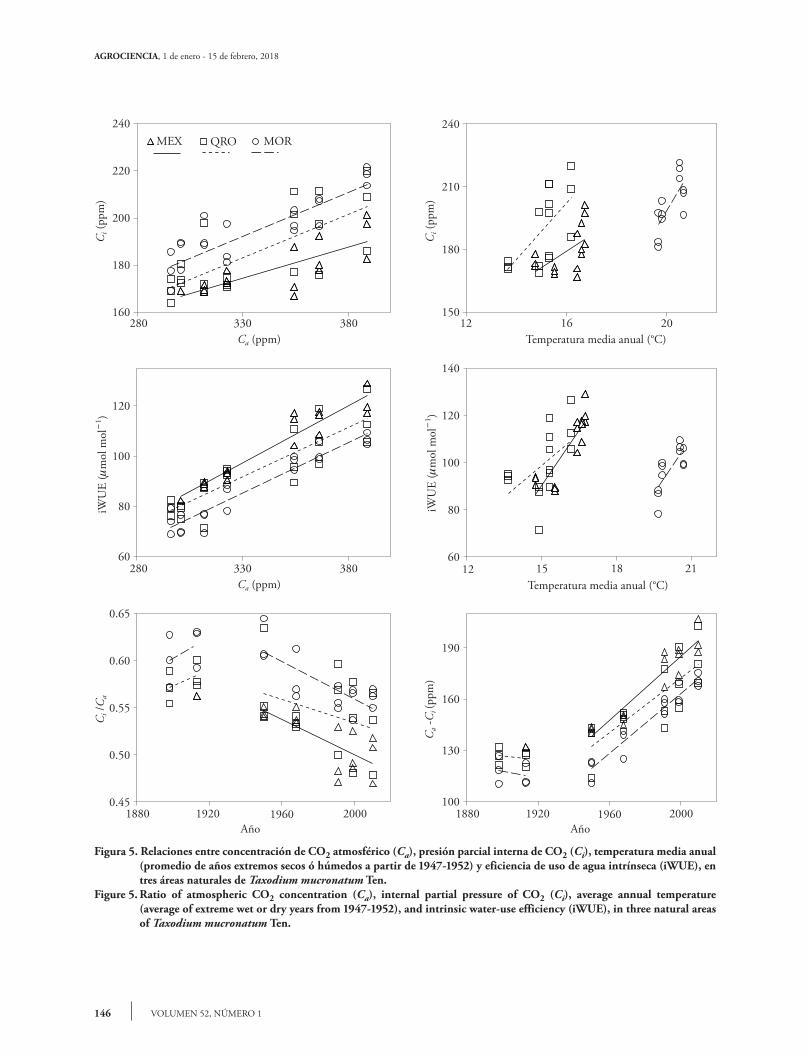
Las variables Ci y iWUE muestran un incremen-to lineal con respecto a Ca, en el siglo XX (Figu-ra 5). Esto podría sugerir que el aumento de CO2 atmosférico se refleja en una mayor concentración del gas en los árboles. Si bien, los valores de Ci en cada sitio son diferentes, se encontró una misma pendiente o tasa de incremento en ambas variables. La temperatura media anual también tiene una función importante en iWUE y Ci, para MEX y QRO, se encontró una relación positiva entre tem-peratura y el incremento de Ci y iWUE, comparado con la temperatura, la precipitación no explicó los cambios en Ci y iWUE. Los resultados de este estu-dio son similares a los encontrados por Silva et al. (2009) en Araucaria angustifolia y por Tognetti et al. (2014) y en Fagus sylvatica y Nothofagus spp. Esta relación también depende del déficit de presión de vapor del lugar donde crecen los árboles; sin embar-go, es posible que también sea reflejo de un proceso de regulación (homeostasis) de las especies foresta-les ante la variación del clima ya que la correlación entre iWUE y Ci tiende a aumentar en las últimas décadas (Tognetti et al., 2014).
Crecimiento en área basal
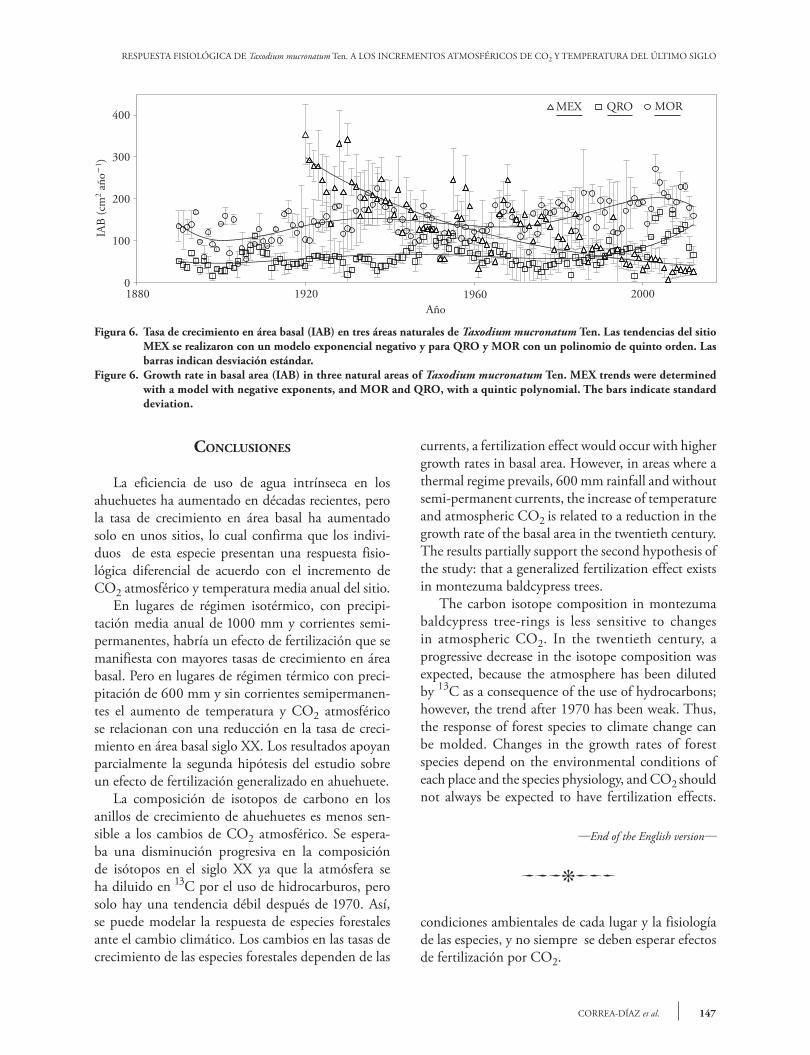
El crecimiento en área basal para los tres sitios, empleando una ecuación exponencial negativa para MEX y ecuaciones polimórficas de orden cinco para QRO y MOR, muestra tres tendencias: reducción en crecimiento, crecimiento estable e incremento de crecimiento, en el orden MEX, QRO y MOR (Fi-gura 6). Pero desde la última década el crecimiento se ha reducido en todos los sitios. En 1920 el IAB de MEX superaba el de los otros sitios, la tasa de creci-miento en MEX, mostró una disminución progresiva de 1920 a 2012, hasta alcanzar valores cuatro a cinco veces menor que en los otros dos sitios, aunque en este sitio estaban los árboles más jóvenes. Una expli-cación probable es que los cambios en disponibilidad de agua y los efectos de cambio de uso de suelo han afectado de manera importante al arbolado (Correa-Díaz et al., 2014).
This could suggest that the increase of atmospheric CO2 is reflected in higher gas concentration in the trees. Although Ci values are different in each site, the same slope or increase rate was found in both variables. The average annual temperature also plays an important role in iWUE and Ci in MEX and QRO; a positive relationship between temperature and Ci and iWUE increase was found; compared with temperature, rainfall did not explain Ci and iWUE changes. The results of this study are similar to those found by Silva et al. (2009) in Araucaria angustifolia and by Tognetti et al. (2014) in Fagus sylvatica and Nothofagus spp. This relation also depends on the steam pressure deficit in the area where trees grow; however, this may also reflect a regulation process (homeostasis) of forest species, in face of climate variation, because the correlation between iWUE and Ci tends to increase in recent decades (Tognetti et al., 2014).
Growth in basal area
The growth in basal area for all three sites, using an equation with negative exponents for MEX and quintic polymorphic equations for QRO and MOR, show three trends: reduction in growth, stable growth, and increased growth, in MEX, QRO, and MOR (Figure 6). However, since the last decade, growth has decreased everywhere. In 1920 MEX’s IAB exceeded that of the other sites; afterwards, its growth rate showed a progressive decrease from 1920 to 2012, until it reached values four to five times lower than in the other two sites, even if the younger trees were found in this site. A probable explanation for this situation is that the woodland has been significantly affected by changes in water availability and the effects of land-use change (Correa- Díaz et al., 2014).
conclusIons
The intrinsic water-use efficiency in montezuma baldcypress trees has increased in recent decades, but the growth rate in their basal area has increased only in some sites, confirming that individuals of this species show a differential physiological response according to the increase of atmospheric CO2 and average annual temperature in the site. In places where an isothermal regime prevails, 1000 mm average annual rainfall and semi-permanent
146
AGROCIENCIA, 1 de enero - 15 de febrero, 2018
VOLUMEN 52, NÚMERO 1
Figura 5. Relaciones entre concentración de CO2 atmosférico (Ca), presión parcial interna de CO2 (Ci), temperatura media anual (promedio de años extremos secos ó húmedos a partir de 1947-1952) y eficiencia de uso de agua intrínseca (iWUE), en tres áreas naturales de Taxodium mucronatum Ten.
Figure 5. Ratio of atmospheric CO2 concentration (Ca), internal partial pressure of CO2 (Ci), average annual temperature (average of extreme wet or dry years from 1947-1952), and intrinsic water-use efficiency (iWUE), in three natural areas of Taxodium mucronatum Ten.
240
220
200
180
160
0.65
0.60
0.55
0.50
0.45
190
160
130
100
120
100
80
60
140
120
100
80
60
240
210
180
150
C (p
pm)
iC
/C ia
C -C a
i (pp
m)
C (p
pm)
i
C (ppm)a
C (ppm)a
Temperatura media anual (°C)
Temperatura media anual (°C)
MEX QRO MOR
280
280
12
12
330
330
16
15
380
380
20
21
-1
iWU
E (m
mol
mol
)
-1
iWU
E (m
mol
mol
)
18
1880 18801920 19201960 19602000 2000Año Año
RESPUESTA FISIOLÓGICA DE Taxodium mucronatum Ten. A LOS INCREMENTOS ATMOSFÉRICOS DE CO2 Y TEMPERATURA DEL ÚLTIMO SIGLO
147CORREA-DÍAZ et al.
Figura 6. Tasa de crecimiento en área basal (IAB) en tres áreas naturales de Taxodium mucronatum Ten. Las tendencias del sitio MEX se realizaron con un modelo exponencial negativo y para QRO y MOR con un polinomio de quinto orden. Las barras indican desviación estándar.
Figure 6. Growth rate in basal area (IAB) in three natural areas of Taxodium mucronatum Ten. MEX trends were determined with a model with negative exponents, and MOR and QRO, with a quintic polynomial. The bars indicate standard deviation.
MEX QRO MOR
1880 1920 1960 2000Año
400
300
200
100
0
2-
1IA
B (c
m a
ño)
conclusIones
La eficiencia de uso de agua intrínseca en los ahuehuetes ha aumentado en décadas recientes, pero la tasa de crecimiento en área basal ha aumentado solo en unos sitios, lo cual confirma que los indivi-duos de esta especie presentan una respuesta fisio-lógica diferencial de acuerdo con el incremento de CO2 atmosférico y temperatura media anual del sitio. En lugares de régimen isotérmico, con precipi-tación media anual de 1000 mm y corrientes semi-permanentes, habría un efecto de fertilización que se manifiesta con mayores tasas de crecimiento en área basal. Pero en lugares de régimen térmico con preci-pitación de 600 mm y sin corrientes semipermanen-tes el aumento de temperatura y CO2 atmosférico se relacionan con una reducción en la tasa de creci-miento en área basal siglo XX. Los resultados apoyan parcialmente la segunda hipótesis del estudio sobre un efecto de fertilización generalizado en ahuehuete. La composición de isotopos de carbono en los anillos de crecimiento de ahuehuetes es menos sen-sible a los cambios de CO2 atmosférico. Se espera-ba una disminución progresiva en la composición de isótopos en el siglo XX ya que la atmósfera se ha diluido en 13C por el uso de hidrocarburos, pero solo hay una tendencia débil después de 1970. Así, se puede modelar la respuesta de especies forestales ante el cambio climático. Los cambios en las tasas de crecimiento de las especies forestales dependen de las
currents, a fertilization effect would occur with higher growth rates in basal area. However, in areas where a thermal regime prevails, 600 mm rainfall and without semi-permanent currents, the increase of temperature and atmospheric CO2 is related to a reduction in the growth rate of the basal area in the twentieth century. The results partially support the second hypothesis of the study: that a generalized fertilization effect exists in montezuma baldcypress trees. The carbon isotope composition in montezuma baldcypress tree-rings is less sensitive to changes in atmospheric CO2. In the twentieth century, a progressive decrease in the isotope composition was expected, because the atmosphere has been diluted by 13C as a consequence of the use of hydrocarbons; however, the trend after 1970 has been weak. Thus, the response of forest species to climate change can be molded. Changes in the growth rates of forest species depend on the environmental conditions of each place and the species physiology, and CO2 should not always be expected to have fertilization effects.
—End of the English version—
pppvPPP
condiciones ambientales de cada lugar y la fisiología de las especies, y no siempre se deben esperar efectos de fertilización por CO2.
148
AGROCIENCIA, 1 de enero - 15 de febrero, 2018
VOLUMEN 52, NÚMERO 1
AgRAdecImIento
Al Consejo Nacional de Ciencia y Tecnología (CONACyT) y la Universidad de California que mediante el programa UC-MEXUS (Proyecto CN-13-546) proveyeron apoyo financiero para la realización del trabajo.
lIteRAtuRA cItAdA
Arreola-Ortiz, M. R., y J. D. J. Návar-Cháidez. 2010. Análisis de sequías y productividad con cronologías de Pseudotsuga menziesii Rob. & Fern., y su asociación con el Niño en el nordeste de México. Invest. Geográf. 71: 7-20.
Barnard, H. R., J. R. Brooks, and B. J. Bond. 2012. Applying the dual-isotope conceptual model to interpret physiological trends under uncontrolled conditions. Tree Physiol. 32: 1183-1198.
Battipaglia, G., M. Saurer, P. Cherubini, C. Calfapietra, H. R. McCarthy, R. J. Norby, and M. Francesca Cotrufo. 2013. Elevated CO2 increases tree-level intrinsic water use efficiency: insights from carbon and oxygen isotope analyses in tree rings across three forest FACE sites. New Phytol. 197: 544-554.
CAN (Comisión Nacional del Agua). 2015. Actualización de la disponibilidad media anual en el acuífero Texcoco 1507, Estado de México. CNA. México. 34 p.
Constante G., V., J. Villanueva D., J. Cerano P., y A. Estrada J. 2010. Parámetros para definir el potencial dendrocronológico. Folleto Técnico No.19. ISBN: 978-607-425-475-4. INIFAP CENID-RASPA. Goméz Palacio, Durango. México 40 p.
Cook, E. R., and K. Peters. 1981. The smoothing spline: A new approach to standardizing forest interior tree-ring width series for dendroclimatic studies. Tree-Ring Bull. 41: 45-53.
Cook, E. R., and R. L. Holmes. 1984. Program ARSTAN and users manual. Laboratory of Tree-Ring Research. University of Arizona. Tucson, AZ. 15 p.
Cook, E. R., R. Seager, R. R. Heim, R. S. Vose, C. Herweijer, and C. Woodhouse. 2010. Megadroughts in North America: placing IPCC projections of hydroclimatic change in a long-term palaeoclimate context. J. Quaternary Sci. 25: 48-61.
Correa-Díaz, A., A. Gómez-Guerrero, J. Villanueva-Díaz, L. U. Castruita-Esparza, T. Martínez-Trinidad, y R. Cervantes-Martínez. 2014. Análisis dendroclimático de Ahuehuete (Taxodium mucronatum Ten.) en el centro de México. Agrociencia 48: 537-551.
Cortés-Barrera, E. N., J. Villanueva-Díaz, J. Estrada-Ávalos, C. Nieto de Pascual P., V. Guerra-Cruz, y O. Vázquez-Cuecuecha. 2010. Utilización de Taxodium mucronatum Ten. Para determinar la variación estacional de la precipitación en Guanajuato. Rev. Ciencias For. Mex. 1: 113-120.
Dawson, T. E., S. Mambelli, A. H. Plamboeck, P. H. Templer, and K. P. Tu. 2002. Stable isotopes in plant ecology. Annu. Rev. Ecol. Syst. 33: 507-559.
Dietrich, R., F. W. Bell, L. C. Silva, A. Cecile, W. R. Horwath, and M. Anand. 2016. Climatic sensitivity, water‐use efficiency, and growth decline in boreal jack pine (Pinus
banksiana) forests in Northern Ontario. J. Geo. Res. Biogeo. 121: 2761-2774.
Enríquez-Peña, G., y H. Suzán-Azpiri. 2011. Estructura poblacional de Taxodium mucronatum en condiciones contrastantes de perturbación en el estado de Querétaro, México. Rev. Mex. Biodiv. 82: 153-167.
Farquhar, G. D., M. H. O’Leary, and J. A. Berry. 1982. On the relationship between carbon isotope discrimination and intercellular carbon dioxide concentration in leaves. Aust. J. Plant Physiol. 9: 121-137.
Farquhar, G., and R. Richards. 1984. Isotopic composition of plant carbon correlates with water-use efficiency of wheat genotypes. Funct. Plant Biol. 11: 539-552.
Farquhar, G., J. R. Ehleringer, and K. T. Hubick. 1989. Carbon isotope discrimination and photosynthesis. Annual Rev. Plant Physiol. Plant Mol. Biol. 40: 503-537.
Fitzmaurice, G. M., N. M. Laird, and J. H. Ware. 2004. Applied Longitudinal Analysis. Department of Biostatics Harvard University. Boston, MA. 740 p.
Fritts, H. C. 1976. Tree Rings and Climate. Academic Press. New York, NY, USA. 567 p.
Fritts, H. C. 1991. Reconstructing Large-Scale Climatic Patterns from Tree-Ring data. Tucson, AZ (United States). University of Arizona Press. 286 p.
García-G, R., A. Gómez, J. López-U, J. Vargas-H, and W. R. Horwath. 2004. Tree growth and 13C among populations of Pinus greggii Engelm. at two contrasting sites in central Mexico. For. Ecol. Manage. 198: 237-247.
Goetz, S., H. Epstein, U. Bhatt, G. Jia, J. Kaplan, H. Lischke, Q. Yu, A. Bunn, A. Lloyd, D. Alcaraz-Segura, P. Beck, J. Comiso, M. Raynolds, and D. Walker. 2011. Recent Changes in Arctic Vegetation: Satellite Observations and Simulation Model Predictions. In: Gutman, G., and A. S. Reissell. (eds). Eurasian Arctic Land Cover and Land Use in a Changing Climate. Springer Netherlands. pp: 9-36.
Gómez-Guerrero, A., L. C. R. Silva, M. Barrera-Reyes, B. Kishchuk, A. Velázquez-Martínez, T. Martínez-Trinidad, F. O. Plascencia-Escalante, and W. R. Horwath. 2013. Growth decline and divergent tree ring isotopic composition (13C and 18O) contradict predictions of CO2 stimulation in high altitudinal forests. Global Change Biol. 19: 1748-1758.
Holmes, R. L. 1983. Computer-assisted quality control in tree-ring dating and measurement. Tree-Ring Bull. 43: 69-78.
Holzkämper S., P. Kuhry, S. Kultti, B. Gunnarson, and E. Sonninen. 2008. Stable isotopes in tree rings as proxies for winter precipitation changes in the russian arctic over the past 150 years. Geochronometria 32: 37-46.
Huang, J.-G., Y. Bergeron, B. Denneler, F. Berninger, and J. Tardif. 2007. Response of forest trees to increased atmospheric CO2. Crit. Rev. Plant Sci. 26: 265-283.
IMTA. 2013. ERIC III Versión 3.2, Extractor Rápido de Información Climática. 1 CD. Instituto Mexicano de Tecnología del Agua-Secretaría del Medio Ambiente y Recursos Naturales-IMTA. Jiutepec, Morelos.
Kohn, M. J., and J. M. Welker. 2005. On the temperature correlation of 18O in modern precipitation. Earth and Planet. Sci. Lett. 231: 87-96.
Lammertsma, E. I., H. J. d. Boer, S. C. Dekker, D. L. Dilcher, A. F. Lotter, and F. Wagner-Cremer. 2011. Global CO2 rise
RESPUESTA FISIOLÓGICA DE Taxodium mucronatum Ten. A LOS INCREMENTOS ATMOSFÉRICOS DE CO2 Y TEMPERATURA DEL ÚLTIMO SIGLO
149CORREA-DÍAZ et al.
leads to reduced maximum stomatal conductance in Florida vegetation. P. Natl. Acad. Sci. USA 108: 4035-4040.
Linares, J. C., and J. J. Camarero. 2012. From pattern to process: linking intrinsic water-use efficiency to drought-induced forest decline. Global Change Biol. 18: 1000-1015.
Mc Carroll, D., and N. J. Loader. 2004. Stable isotopes in tree rings. Quat. Sci. Rev. 23: 771-801.
Peñuelas, J., J. M. Hunt, R. Ogaya, and A. S. Jump. 2008. Twentieth century changes of tree-ring 13C at the southern range-edge of Fagus sylvatica: increasing water-use efficiency does not avoid the growth decline induced by warming at low altitudes. Global Change Biol. 14: 1076-1088.
Peñuelas, J., J. G. Canadell, and R. Ogaya. 2011. Increased water-use efficiency during the 20th century did not translate into enhanced tree growth. Global Ecol. Biogeogr. 20: 597-608.
Pieter, S. A. B., and J. G. Scott. 2011. Satellite observations of high northern latitude vegetation productivity changes between 1982 and 2008: ecological variability and regional differences. Environ. Res. Lett. 6: 045501.
Poage, N. J., and I. Tappeiner, J. C. 2002. Long-term patterns of diameter and basal area growth of old-growth Douglas-fir trees in western Oregon. Can. J. Forest Res. 32: 1232-1243.
Raven, J. A. 2002. Selection pressures on stomatal evolution. New Phytol. 153: 371-386.
Robinson, W. J., and R. Evans. 1980. A microcomputer-based tree-ring measuring system. Tree-Ring Bull. 40: 59-64.
Roden, J. S., J. A. Johnstone, and T. E. Dawson. 2011. Regional and watershed-scale coherence in the stable-oxygen and carbon isotope ratio time series in tree rings of coast redwood (Sequoia sempervirens). Tree-Ring Res. 67: 71-86.
Roden, J. S., and G. D. Farquhar. 2012. A controlled test of the dual-isotope approach for the interpretation of stable carbon and oxygen isotope ratio variation in tree rings. Tree Physiol. 32: 490-503.
Sarris, D., R. Siegwolf, and C. Koerner. 2013. Inter- and intra-annual stable carbon and oxygen isotope signals in response to drought in Mediterranean pines. Agr. Forest Meteorol. 168: 59-68.
SAS. 2011. Statistical Analysis System. SAS/ETS 9.3 User’s Guide. Cary, NC. SAS Institute Inc.
Saurer, M., R. T. W. Siegwolf, and F. H. Schweingruber. 2004. Carbon isotope discrimination indicates improving water-use efficiency of trees in northern Eurasia over the last 100 years. Global Change Biol. 10: 2109-2120.
Scheidegger Y., M. Saurer, M. Bahn, and R. Siegwolf. 2000. Linking stable oxygen and carbon isotopes with stomatal conductance and photosynthetic capacity: A conceptual model. Oecologia 125: 350-357.
Silva, L. C. R., M. Anand, J. M. Oliveira, and V. D. Pillar. 2009. Past century changes in Araucaria angustifolia (Bertol.) Kuntze water use efficiency and growth in forest and grassland ecosystems of southern Brazil: implications for forest expansion. Global Change Biol. 15: 2387-2396.
Silva, L. C. R., and W. R. Horwath. 2013. Explaining global increases in water use efficiency: why have we overestimated responses to rising atmospheric CO2 in natural forest ecosystems? PLoS One 8: e53089.
Silva, L. C., A. Gómez‐Guerrero, T. A. Doane, and W. R. Horwath. 2015. Isotopic and nutritional evidence for species‐and site‐specific responses to N deposition and elevated CO2 in temperate forests. J. Geophys. Res-Biogeo. 120: 1110-1123.
Stahle, D. W., E. R. Cook, J. V. Diaz, F. K. Fye, D. J. Burnette, D. Griffin, R. A. Soto, R. Seager, and R. R. Heim. 2009. Early 21st‐Century drought in Mexico. Eos, Trans. A. G. U. 90: 89-90.
Stahle, D. W., J. Villanueva D., D. J. Burnette, J. Cerano P., R. R. Heim Jr., F. K. Fye, R. Acuña S., M. D. Therrell, M. K. Cleaveland, and D. K. Stahle. 2011. Major Mesoamerican droughts of the past millennium. Geophys. Res. Lett. 38: 1-4.
Stokes, M. A., and T. L. Smiley. 1968. An Introduction to Tree-Ring Dating. University of Chicago Press. Chicago. 73 p.
Suzán-Azpiri, H., G. Enríquez-Peña, and G. Malda-Barrera. 2007. Population structure of the mexican baldcypress (Taxodium mucronatum Ten) in Querétaro, México. For. Ecol. Manage. 242: 243-249.
Therrell, M., D. Stahle, J. Diaz, E. C. Oviedo and M. Cleaveland. 2006. Tree-Ring reconstructed maize yield in Central Mexico: 1474-2001. Climatic Change 74: 493-504.
Tognetti, R., F. Lombardi, B. Lasserre, P. Cherubini, and M. Marchetti. 2014. Tree-ring stable isotopes reveal twentieth-century increases in water-use efficiency of Fagus sylvatica and Nothofagus spp. in Italian and Chilean mountains. PloS one 9: e113136.
Villanueva-Díaz, J., J. Cerano-Paredes, D. Stahle, V. Constante-García, L. Vázquez-Salem, J. Estrada-Ávalos, y J. Benavides. 2010. Árboles longevos de México. Ensayo. Rev. Cien. For. Méx. 1: 7-30.
Xu, Z., C. Chen, J. He, and J. Liu. 2009. Trends and challenges in soil research 2009: linking global climate change to local long-term forest productivity. J. Soil. Sediment. 9: 83-88.
Xu, Y., W. Li, X. Shao, Z. Xu, and P. Nugroho. 2014. Long-term trends in intrinsic water-use efficiency and growth of subtropical Pinus tabulaeformis Carr. and Pinus taiwanensis Hayata in central China. J. Soil. Sediment. 14: 917-927.