
Regional development and capital structure of SMEs · ISSN: 1131 - 6837 Cuadernos de Gestión Vol....
24
ISSN: 1131 - 6837 Cuadernos de Gestión Vol. 18 - Nº 1 (2018), pp. 37-60 37 Regional development and capital structure of SMEs Desarrollo regional y estructura de capital de las PYME FILIPPO DI PIETRO 1 MARÍA-JOSÉ PALACÍN-SÁNCHEZ 1 JOSÉ L. ROLDÁN 2 Universidad de Sevilla (España) Recibido el 17 de marzo de 2015, aceptado el 2 de mayo de 2016 Publicado online el 25 de enero de 2017 Nº de clasificación JEL: G32, R50 DOI: 10.5295/cdg.150530fd Abstract: This article studies the influence of regional institutional environment, measured as regional development, on capital structure of small and medium-sized enterprises (SMEs). Furthermore, the standard firm-factor deter- minants and the business sector of the firm are also incorporated. To this end, a sample of 6,560 Spanish firms for 2007 is analysed, where all regions of Spain and all sectors, except the financial sector, are considered. Spain provides a suitable and unexplored laboratory for the analysis of regional differences in the financial structure of SMEs, since, on the one hand, SMEs constitute the most relevant firms in this country, and on the other hand, Spain shows regional disparities at various levels. Moreover, the empirical analysis uses Partial Least Squares (PLS), a variance-based structural equation modelling (SEM). In this respect, PLS has several clear advantages to multiple linear regression (MLR). Thanks to this study, how each of these factors explains the variation in the capital structure could be shown. Moreover, the results show that although firm factors and the business sector explain a large proportion of the variance of capital structure of SMEs, it is important to take into account the regional institutional environment to better ascertain the level of debt of SMEs in a single country. Keywords: Capital structure, SMEs, regional development, PLS, business sector. Resumen: Este artículo estudia la influencia del entorno institucional regional, medido a través del desarrollo regio- nal, en la estructura de capital de las pequeñas y medianas empresas (PYME). Además, este estudio también con- sidera los factores de empresa clásicos determinantes de las decisiones de financiación y el sector de actividad de la empresa. Para el análisis empírico, se toma una muestra de 6.560 PYME españolas donde todas las regiones de España y todos los sectores, excepto el financiero, son considerados. España ofrece un laboratorio adecuado e inexplorado para el análisis de las diferencias regionales en la estructura financiera de las PYME, ya que, por una parte, las PYME son las empresas más preponderantes en el mismo y por otro lado, España muestra diferen- cias regionales a varios niveles. Como metodología se utiliza un modelo de ecuaciones estructurales basado en 1 Departamento de Economía Financiera y Dirección de Operaciones, Avenida Ramón y Cajal 1, 41018 Sevilla (España). [email protected]; [email protected] 2 Departamento de Administración de Empresas y Marketing, Avenida Ramón y Cajal 1, 41018 Sevilla (España). [email protected]
Transcript of Regional development and capital structure of SMEs · ISSN: 1131 - 6837 Cuadernos de Gestión Vol....
ISSN: 1131 - 6837 Cuadernos de Gestión Vol. 18 - Nº 1 (2018), pp. 37-60 37
Regional development and capital structure of SMEs
Desarrollo regional y estructura de capital de las PYME
Filippo di pietro1
María-José palacín-sánchez1
José l. roldán 2
Universidad de Sevilla (España)Recibido el 17 de marzo de 2015, aceptado el 2 de mayo de 2016Publicado online el 25 de enero de 2017Nº de clasificación JEL: G32, R50DOI: 10.5295/cdg.150530fd
Abstract:
This article studies the influence of regional institutional environment, measured as regional development, on capital structure of small and medium-sized enterprises (SMEs). Furthermore, the standard firm-factor deter-minants and the business sector of the firm are also incorporated. To this end, a sample of 6,560 Spanish firms for 2007 is analysed, where all regions of Spain and all sectors, except the financial sector, are considered. Spain provides a suitable and unexplored laboratory for the analysis of regional differences in the financial structure of SMEs, since, on the one hand, SMEs constitute the most relevant firms in this country, and on the other hand, Spain shows regional disparities at various levels. Moreover, the empirical analysis uses Partial Least Squares (PLS), a variance-based structural equation modelling (SEM). In this respect, PLS has several clear advantages to multiple linear regression (MLR). Thanks to this study, how each of these factors explains the variation in the capital structure could be shown. Moreover, the results show that although firm factors and the business sector explain a large proportion of the variance of capital structure of SMEs, it is important to take into account the regional institutional environment to better ascertain the level of debt of SMEs in a single country.
Keywords:
Capital structure, SMEs, regional development, PLS, business sector.
Resumen:
Este artículo estudia la influencia del entorno institucional regional, medido a través del desarrollo regio-nal, en la estructura de capital de las pequeñas y medianas empresas (PYME). Además, este estudio también con-sidera los factores de empresa clásicos determinantes de las decisiones de financiación y el sector de actividad de la empresa. Para el análisis empírico, se toma una muestra de 6.560 PYME españolas donde todas las regiones de España y todos los sectores, excepto el financiero, son considerados. España ofrece un laboratorio adecuado e inexplorado para el análisis de las diferencias regionales en la estructura financiera de las PYME, ya que, por una parte, las PYME son las empresas más preponderantes en el mismo y por otro lado, España muestra diferen-cias regionales a varios niveles. Como metodología se utiliza un modelo de ecuaciones estructurales basado en
1 Departamento de Economía Financiera y Dirección de Operaciones, Avenida Ramón y Cajal 1, 41018 Sevilla (España). [email protected]; [email protected] Departamento de Administración de Empresas y Marketing, Avenida Ramón y Cajal 1, 41018 Sevilla (España). [email protected]

Regional development and capital structure of SMEs
Cuadernos de Gestión Vol. 18 - Nº 1 (2018), pp. 37-60 ISSN: 1131 - 683738
la varianza (Partial Least Squares-PLS). A este respecto, PLS ofrece una serie de ventajas claras sobre el análisis de regresión lineal múltiple. Gracias a este estudio, se ha podido identificar cómo cada una de las variables ana-lizadas explica la variación en la estructura de capital. Además, los resultados muestran que aunque los factores de empresa y el sector de actividad explican una gran proporción de la varianza de la estructura de capital de las PYME, es importante tener en cuenta el entorno institucional regional para determinar mejor el nivel de deuda de las PYME en un país determinado.
Palabras clave:
Estructura capital, PYME, desarrollo regional, PLS, sector de actividad.
Filippo di Pietro / María-José Palacín-Sánchez / José L. Roldán
ISSN: 1131 - 6837 Cuadernos de Gestión Vol. 18 - Nº 1 (2018), pp. 37-60 39
1. INTRODUCTION
One of the lines of research in corporate finance is the study of the determinants of capital structure of small and medium-sized enterprises; these companies have tradition-ally been given little attention in financial research in favour of large and listed compa-nies, despite the fact that SMEs constitute the most predominant type of companies in the majority of developed countries. According to this line of research, financing decisions seem to be influenced by a number of factors related to the characteristics of the firm, the characteristics of the business sector, and the institutional characteristics of the geograph-ical area within which the company does business. The majority of empirical studies have focused on the relevance of firm factors on the capital structure of firm, and there is a broad consensus on those firm factors that show a significant relationship with the level of firm debt, such as size, asset structure, profitability, growth, and age of the firm. These effects are clearly shown for SMEs in empirical studies, such as those of Van der Wijst and Turik (1993), Chittenden et al. (1996), Michaelas et al. (1999), Sogorb-Mira (2005), Heyman et al. (2008), Bhaird and Lucey (2010) and Degryse et al. (2012).
From early on, the business sector was also considered among the factors that influence the capital structure of the firm (Titman and Wessels 1988; Harris and Raviv 1991). The empirical evidence shows a relationship between the sector and the level of debt in SMEs (Michaelas et al. 1999; Hall et al. 2000; Bhaird and Lucey 2010; Degryse et al. 2012) al-though the nature of that relationship remains unclear (Michaelas et al. 1999; Bhaird and Lucey 2010).
Finally, and more recently, the institutional environment of the geographical area where a company resides began to be considered as a factor that affects its financing decisions (La Porta et al. 1998; Demirgüç-Kunt and Maksimovic 1999). The reasons for this influence on the choice in capital structure lie in the institutional differences that could exist between zones in terms of the financial system, legal system, tax system, and/or national culture. In the field of SMEs, Giannetti (2003), Utrero-Gonzalez (2007), Hall et al. (2004), Psil-laki and Daskalakis (2009) and Jõeveer (2013) show significant differences in the capital structure of firms located in different countries, which are related to institutional factors of the particular country. Even those very few studies that compare firms across regions of a single country, show differences in the level of debt of SMEs due to differences in the re-gional institutional system. From this regional perspective, La Rocca et al. (2010) in Italy; and Palacín-Sánchez et al. (2013) and Palacín-Sánchez and di Pietro (2016) in Spain, are highlighted.
To explain the level of debt, this paper explores the effect of regional institutional en-vironment on the capital structure of SMEs belonging to a single country, together with the remaining factors mentioned above: firm factors and business sector. Thanks to this innovation, how each of these factors explains the variation in the capital structure could be identified. To this end, a sample of 6,560 Spanish firms for 2007 is analysed, where all regions of Spain and all sectors, except the financial sector, are considered.
To test the research model, a variance-based structural equation modelling (SEM) is used in the form of Partial Least Squares (PLS). In this respect, PLS has several clear advantages to multiple linear regression (MLR). Without any pretensions to being exhaus-tive, in accordance with Chin (1998), regarding MLR, PLS allows: (1) modelling relation-
Regional development and capital structure of SMEs
Cuadernos de Gestión Vol. 18 - Nº 1 (2018), pp. 37-60 ISSN: 1131 - 683740
ships among multiple predictor and criterion variables, (2) including latent variables, and (3) modelling errors in measurements for observed variables. In addition, path coefficients generated by PLS are more likely to be closer to the true values than those provided by MLR (Sosik et al. 2009). On the other hand, PLS has been selected to covariance-based structural equation modelling (CBSEM) (Chin 2010), among other reasons, because this study is mainly focused on the prediction of the key dependent variable (that is, capital structure), this research has both an exploratory and incremental character, the research model is highly complex, and formative variables are used.
In this study, Spain provides a suitable and unexplored laboratory for the analysis of regional differences in the financial structure of SMEs, since, on the one hand, SMEs con-stitute the most relevant firms in this country, and on the other hand, Spain shows regional disparities at various levels. Furthermore, the choice of regions as the local unit of analysis in Spain is fully justified because they have been shown to be relevant in previous studies of corporate finance, such as Palacín-Sánchez et al. (2013) and Palacín-Sánchez and di Pietro (2016); and in studies of the field of economics, such as Carbó et al. (2003), Carbó et al. (2009), and Cuadrado-Roura (2010), which show regional differences in the financial system or in economic growth.
This article is relevant for corporate finance literature in several ways. First, the influ-ence of regional institutional environment on financial structure through a dummy is not introduced, nor is splitting the sample based on the geographical area of the company such as Hall et al. (2004), Psikalli and Daskalakis (2009), Palacín-Sánchez et al. (2013) did, but instead a quantitative variable that reflects the regional institutional system in a generic way is introduced. Following Demirgüç-Kunt and Maksimovic (1999), who obtained an initial assessment of the differences in debt by comparing firms for a sample of countries at different levels of economic development, the economic development variable is chosen. Moreover, this variable can be taken as the result of many institutional factors (Fan et al. 2012). On the other hand, to reflect the regional development, not only is the gross domes-tic product (GDP) per capita taken, which is the world standard benchmark of developed countries, but a set of variables representing regional development according to European Union (EU) standards is also introduced. This remains an unexplored field, and hence no strong theory exists that explains the relationships between these variables and debt. The methodology used, PLS, facilitates the introduction of these multiple variables and ex-plores their relationship on the capital structure.
Second, until now, of the very few studies that exist, which take into account the insti-tutional environment, some choose not to consider the business sector (Hall et al. 2004; Psikalli and Daskalakis 2009; Palacín-Sánchez et al. 2013), or introduce the sector using industry dummy variables (La Rocca et al. 2010; Hernández-Cánovas and Koeter-Kant 2011; Jõeveer 2013). Their approaches ignore the indirect effect of the sector on certain firm characteristics (such as asset structure, and profitability). However, in this article, whether the sector influences the capital structure decisions in a direct way and/or in an indirect way is analysed.
Third, empirical studies on the effects of regional asymmetries on SME finance are very scarce, and hence this research is highly relevant since Spain is not alone in facing significant regional disparities (Palacín-Sánchez et al. 2013). Many countries, such as cer-tain members of the European Union, Australia, the United States, China, India, Brazil, and
Filippo di Pietro / María-José Palacín-Sánchez / José L. Roldán
ISSN: 1131 - 6837 Cuadernos de Gestión Vol. 18 - Nº 1 (2018), pp. 37-60 41
Russia, also present differences in the regional institutional environment; the effect of these divergences on their capital structure remains unexplored. If SMEs are experiencing prob-lems, then the economy follows suit; therefore any factors, including those of regional dif-ferences, which may explain financial problems for SMEs, merit in-depth study. Further-more, policymakers should understand the effect of these divergences on firms, specifically on the capital structure of firms, and should try to eliminate these asymmetries by working at company level, society level, and at regulation level, both nationally and regionally.
The study results show that although firm factors and the business sector explain a large proportion of the variance of capital structure of SMEs, it is important to take into account the regional institutional environment to better ascertain the level of debt of SMEs in a single country. Moreover, the proxy considered to define the regional institutional system, which is regional development, has a negative relation with capital structure.
The remainder of the paper is structured as follows. Section 2 reviews the literature (theory and evidence) on the determinants of capital structure. The empirical methodology is discussed in Section 3. Section 4 contains the results. The conclusions are presented in Section 5.
2. LITERATURE REVIEW: THEORY AND EVIDENCE
Differences in capital structure can be caused by differences in firm characteristics, in the business sectors, and in the institutional system between zones/regions in which compa-nies operate, thereby causing differences in the conditions of access to financing of SMEs. Therefore, various patterns of debt can be observed that depend on certain characteristics of the company, the sector, and/or the geographical zone. In general, the relationships be-tween these factors and the capital structure choices on SMEs are basically explained by two main theories (López-Gracia and Sogorb-Mira 2008). On the one hand, the trade-off theory that suggests that there is an optimum capital structure for each firm. On the other hand, the pecking order theory which postulates that firms adjust their corporate financial decisions to a hierarchy due to asymmetric information problems between the managers and the investors in relation to external funding.
2.1. Regional institutional environment
Differences between geographical areas within which companies operate, or rather be-tween their institutional environments, can cause variations in the financial structure of firms across such areas since the conditions of access to external finance are different (La Porta et al. 1998; Demirgüç-Kunt and Maksimovic 1999).
According to finance literature, numerous factors define the institutional environment, such as the legal system, financial system, tax system and national culture. In order to as-certain their effect on the capital structure of firms, two of the most relevant institutional factors are briefly recalled. These are the legal system and the financial sector. Firstly, the legal system of a country and the protection it offers to investors determine the possibil-ities of access to external resources due to the risk of insolvency and the difficulties of liquidating distressed firms or distressed firm assets. When the legal system is inefficient and costly to use, the lenders opt for the use of instruments of short-term debt, in order to
Regional development and capital structure of SMEs
Cuadernos de Gestión Vol. 18 - Nº 1 (2018), pp. 37-60 ISSN: 1131 - 683742
reduce the risks, and shareholders are reticent to provide more resources (Demirgüç-Kunt and Maksimovic 1999). Furthermore, another major characteristic of the legal systems is the level of corruption in the execution of the law, which also influences the capital structure of companies (Djankov et al. 2003).
Secondly, the banking sector, as one of the key components of the financial system, directly influences the financial structure of firms since its mission is to provide them with resources (Demirgüç-Kunt and Maksimovic 1999). A developed financial sector facilitates access to debt, especially for SMEs, given that it channels savings into credit more efficiently. Moreover, as Diamond (1984) argues, these intermediaries enjoy economies of scale in obtaining informa-tion about client companies. This allows them to reduce the problems of asymmetric informa-tion, which are especially pronounced for SMEs.
Within a country, the existence of regional differences in institutional environment also explains differences in the financial structure of firms across regions, especially in the case of SMEs. Regional markets are therefore highly relevant for SMEs but not for large and listed companies, which can access not only international and domestic markets to raise funds but also any national financial intermediary regardless of location. Studies from a regional perspective, such as those of La Rocca et al. (2010) in Italy; Palacín-Sanchez et al. (2013) and Palacín-Sánchez and di Pietro (2016) in Spain, confirm this idea.
Each and every one of the institutional environment factors of a geographical area influenc-es its degree of development. In fact, this can be taken as the result of many institutional factors (Fan et al. 2012). Therefore, to obtain an initial assessment of the effects of the institutional system on debt, economic development is considered which involves more refinements than the simple consideration of the geographical area as a dummy variable. Several studies have taken the level of development of countries to make a first assessment of the differences in levels of corporate debt across countries (Demirgüç-Kunt and Maksimovic 1999; Fan et al. 2012). Moreover, this evidence shows a relationship between the level of development and the level of debt. Specifically, Demirguç-Kunt and Maksimovic (1999) find that firms have more long-term debt in developed economies; Fan et al. (2012) conclude that total debt is positively related to economic development: however, while long-term debt is greater in more highly developed economies, short-term debt is greater in less developed economies. Nevertheless, the unit of analysis of both these studies is that of country and not region, and their samples consider only large listed companies and not SMEs.
In this article, SMEs across Spanish regions are studied. Therefore, regional development is used to reflect the institutional environment. This analysis is entirely relevant since, according to Cuadrado-Roura (2010), there are disparities between Spanish regions. In fact, the differenc-es between the most and least developed regions have increased in recent years. It is true that the convergence of Spanish regions towards the EU average has taken place, although regional convergence within Spain is limited. These development differences between regions are due to a variety of historical and cultural reasons and to the differences in the regional institutional factors thanks to the fact that each region is self-governing.
Consequently, the research question is stated as follows:H1: Does the regional institutional environment, measured as regional development, signif-
icantly affect firm leverage?No sign can be associated to this relation since the level of regional development is the
result of a set of institutional factors, of which a number can have had a positive impact on debt
Filippo di Pietro / María-José Palacín-Sánchez / José L. Roldán
ISSN: 1131 - 6837 Cuadernos de Gestión Vol. 18 - Nº 1 (2018), pp. 37-60 43
and other factors could have had a negative effect. For instance, a more efficient regional legal system and/or a more developed regional financial system can favour higher level of company debt, but also bring greater amounts of external equity. Therefore, the empirical evidence must define the sign of this relationship.
2.2. Firm Factors
In accordance with existing theoretical and empirical studies, the main characteristics of the SME that can affect its capital structure are presented. Specifically, size, asset structure, profita-bility, growth, and age are considered. A brief discussion of these factors, highlighting the most common results observed, is carried out below.
Size. With regard to SMEs, most empirical research verifies that firm size is positively re-lated to debt (Michaelas et al. 1999; Fama and French 2002; Cassar and Holmes 2003; Hall et al. 2004; Sogorb-Mira 2005; Degryse et al. 2012; Salas-Fumás 2014). This finding, according to the pecking order theory of capital structure (POT), suggests that firm size helps to resolve the asymmetric information problems between management and external investors. Therefore, larger firms have fewer information problems since their financial information may be of higher quality, and hence their access to credit is easier. This result is also suggested in the several euro area bank lending surveys conducted by the European Central Bank (Maudos 2014).
Asset structure. Asset structure shows the proportion of fixed assets. The majority of empir-ical studies find a positive effect of asset structure on SME debt (Michaelas et al. 1999; Hall et al. 2004; Sogorb-Mira 2005; Heyman et al. 2008; Degryse et al. 2012); while a few studies ob-tain contrary or non-significant results (Giannetti 2003; Psillaki and Daskalakis 2009; Palacín-Sánchez et al. 2013). This positive relation, following the pecking order theory, suggests that fixed assets can be used as a loan guarantee, which helps to reduce the problems of asymmetric information (Myers 1977). However, this remains more significant for long-term debt than for short-term debt (Hall et al. 2000).
Growth. The empirical research on SMEs has almost always verified that growth is pos-itively related to debt (Michaelas et al. 1999; Sogorb-Mira 2005; Degryse et al. 2012). This result, according to the pecking order theory, suggests that the fastest growing companies are likely to exhaust their internal resources and hence are forced to borrow.
Profitability. Most empirical evidence shows a negative relationship between SME debt and profitability (Van der Wijst and Thurik 1993; Michaelas et al. 1999; Sogorb-Mira 2005; Heyman et al. 2008; Degryse et al. 2012). This finding is in line with the pecking order theory and suggests that the most profitable firms generate more internal resources and have less debt.
Age. A negative relation between age of the firm and leverage has been shown in empirical studies on SMEs such as those by Jordan et al. (1998), Michaelas et al. (1999), Hall et al. (2000, 2004), Hernández-Cánovas and Martinez-Solano (2006) and Bhaird and Lucey (2010). This result, according to the pecking order theory, suggests that older firms have less debt due to their greater capability of generating internal funding.
2.3. Business sector
Harris and Raviv (1991) already established that firms within a particular business sec-tor show similar capital structure. Following Hall et al. (2000), two arguments explaining
Regional development and capital structure of SMEs
Cuadernos de Gestión Vol. 18 - Nº 1 (2018), pp. 37-60 ISSN: 1131 - 683744
the connection between sector and capital structure can be found. On the one hand, busi-ness sector averages, including those for leverage, can be used by firms as targets (this is in line with the trade–off theory of capital structure (TOT)). This is particularly important for SMEs since their management has limited benchmarks (Ang 1991). On the other hand, those firms belonging to the same sector of activity should present similarity in capital structure, since the assets and needs for external resources vary considerably from sector to sector (Myers 1984). In this case, the level of debt of a firm depends on its assets and its requirements for funds (this is in line with the pecking order theory). According to these theories, the effect of industry on the capital structure can be either direct or indirect through firm-factor determinants.
Most empirical evidence of sectoral effects in single country finds SME leverage varies across industries (Michaelas et al. 1999; Hall et al. 2000; Lopez-Gracia and Aybar-Arias 2000; Bhaird and Lucey 2010; Degryse et al. 2012; Salas-Fumás 2014). Moreover, the firm variable which shows the largest variation across sectors is that of asset structure (Hall et al. 2000; Bhaird and Lucey 2010). On the other hand, Balakrishnan and Fox (1993) and Jordan et al. (1998) conclude that the effect of the type of industry carries less importance than firm factors in explaining the capital structure of SMEs.
Among the scarce evidence that makes comparisons between geographical areas and con-siders the direct sectoral effect on the financial structure of SMEs, La Rocca et al. (2010), Hernandez-Canovas and Koeter-Kant (2011) and Jõeveer (2012) deserve mention. These studies include the industry dummy variable and it seems that their findings remain consist-ent when controlling for the sector. Moreover, Jõeveer (2013) shows that, for small firms, country factors are more significant as leverage determinants than the business sector.
3. METHODOLOGY
3.1. Procedures / sample
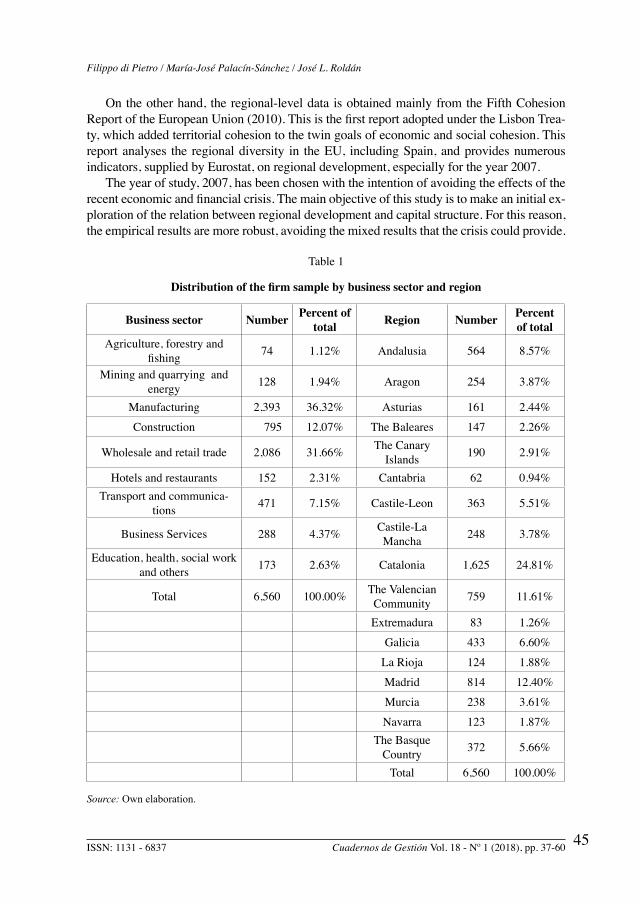
The firm-level data used in this research has been collected from the SABI (Sistema de Análisis de Balances Ibéricos) database. This database contains financial statements of more than one million non-financial Spanish firms. Those firms whose parameters are within the European Commission`s (2003) definition of an SME in the year 2007 have been selected: (a) a number of employees equal to or greater than 10 and less than 250; (b) operating income of over two million euros and less than fifty million euros; (c) total assets over two million euros and less than forty-three million euros. Moreover, the firms selected are active and have positive equity resources and positive net incomes in the year analysed. Finally, the sample consists of 6,560 Spanish SMEs (66.5 per cent small firms and 33.5 per cent medium firms). The firms of the sample are present in all business sectors, except the financial sector, and all the 17 Spanish regions. Table 1 shows the distribution of SMEs by sector (using the Standard Industrial Classification of Economic Activities 2007, the sam-ple is divided into nine groups) and by region. The most important sector, manufacturing, is followed by the wholesale and retail trade, while Catalonia constitutes the region with the most SMEs in the sample, followed by Madrid.
Filippo di Pietro / María-José Palacín-Sánchez / José L. Roldán
ISSN: 1131 - 6837 Cuadernos de Gestión Vol. 18 - Nº 1 (2018), pp. 37-60 45
On the other hand, the regional-level data is obtained mainly from the Fifth Cohesion Report of the European Union (2010). This is the first report adopted under the Lisbon Trea-ty, which added territorial cohesion to the twin goals of economic and social cohesion. This report analyses the regional diversity in the EU, including Spain, and provides numerous indicators, supplied by Eurostat, on regional development, especially for the year 2007.
The year of study, 2007, has been chosen with the intention of avoiding the effects of the recent economic and financial crisis. The main objective of this study is to make an initial ex-ploration of the relation between regional development and capital structure. For this reason, the empirical results are more robust, avoiding the mixed results that the crisis could provide.
Table 1
Distribution of the firm sample by business sector and region
Business sector Number Percent of total Region Number Percent
of totalAgriculture, forestry and
fishing 74 1.12% Andalusia 564 8.57%
Mining and quarrying and energy 128 1.94% Aragon 254 3.87%
Manufacturing 2,393 36.32% Asturias 161 2.44%
Construction 795 12.07% The Baleares 147 2.26%
Wholesale and retail trade 2,086 31.66% The Canary Islands 190 2.91%
Hotels and restaurants 152 2.31% Cantabria 62 0.94%Transport and communica-
tions 471 7.15% Castile-Leon 363 5.51%
Business Services 288 4.37% Castile-La Mancha 248 3.78%
Education, health, social work and others 173 2.63% Catalonia 1,625 24.81%
Total 6,560 100.00% The Valencian Community 759 11.61%
Extremadura 83 1.26%
Galicia 433 6.60%
La Rioja 124 1.88%
Madrid 814 12.40%
Murcia 238 3.61%
Navarra 123 1.87%The Basque
Country 372 5.66%
Total 6,560 100.00%
Source: Own elaboration.
Regional development and capital structure of SMEs
Cuadernos de Gestión Vol. 18 - Nº 1 (2018), pp. 37-60 ISSN: 1131 - 683746
3.2. Measures
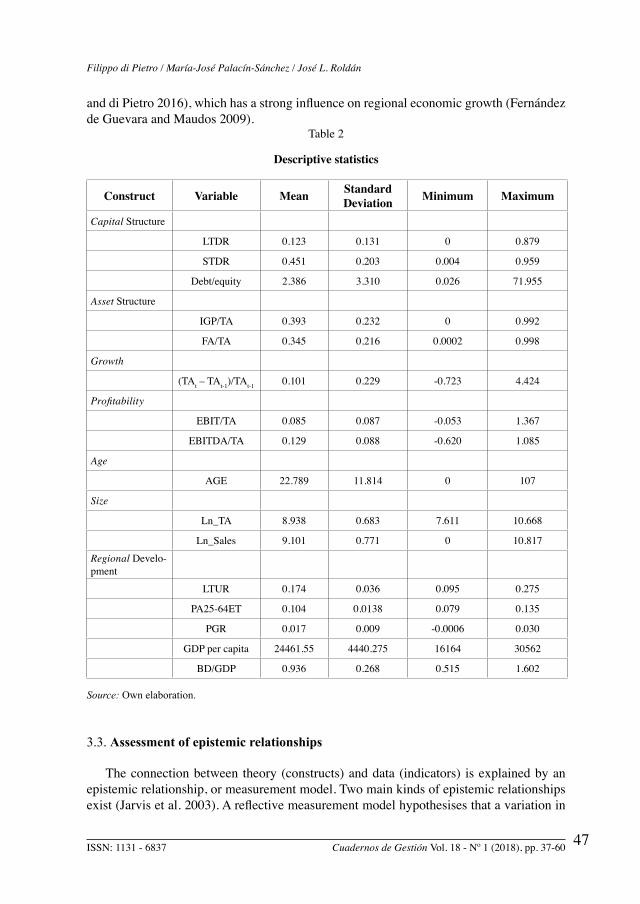
Table 2 shows the descriptive statistics of the variables considered. They have been chosen based on the literature concerning capital structure. In order to define capital struc-ture, three measures have been used: long-term debt ratio (LTDR), short-term debt ratio (STDR) and the debt-to-equity ratio. The first two ratios are estimated by dividing the corresponding debt by total assets3. Most research in this area uses one or two capital struc-ture measures and regresses them against a battery of independent variables. However, consideration of only one measure or of two separate measures fails to take into account that capital structure theories suppose a different impact for each type of debt. For instance, Titman and Wessels (1988), using a factor-analysis technique, use several proxies of cap-ital structure to study the impact of different determinants; Chang et al. (2009) use three measures in covariance-based structural equation modelling (SEM). The latter work, as far as is known, is the first that focuses on the study of SME capital structure by jointly using more than one indicator.
A. Independent Constructs
Firm factors are defined as follows. Asset structure is estimated as stocks plus fixed assets on total assets (IGP/TA) and as net fixed assets on total assets (FA/TA). Growth is defined as growth of total assets (TAt – TAt-1)/TAt-1. Profitability is measured as the ratio be-tween earnings before interest and taxes and total assets (EBIT/TA), and the ratio between earnings before interest, taxes, amortization and depreciation and total assets (EBITDA/TA). Age is estimated as the years since the creation of the firm (AGE). Size is defined as the natural logarithm of total assets (Ln_TA) and the natural logarithm of sales (Ln_Sales). On the other hand, the business sector is introduced as sectorial dummy variables. Fi-nally, regional development is measured by four indicators from Fifth Cohesion Report: long-term unemployment rate (LTUR), participation of adults aged 25-64 in education and training (PA25-64ET), population growth rate (PGR), GDP per capita, and bank deposits on GDP (BD/GDP). While, GDP per capita is the most common measure employed to indicate the level of development, the other three indicators also represent regional devel-opment in accordance with European Union standards4. Moreover, bank deposits on GDP (BD/GDP) is also considered to define regional development5. This variable is a classic proxy to define the degree of development of the regional banking sector (Palacín-Sánchez
3 Short-Term debt ratio includes bank credit and trade credit.4 The regional development indicators available in the Fifth Cohesion Report can be classified into five main categories: economic situation (GDP per capita, GDP per person employed, GDP growth); population (population growth rate, population density); employment/unemployment (employment rate ages 20-64, female employment rate ages 20-64, employment rate ages 55-64, unemployment rate, female unemployment rate, youth unemployment rate, long-term unemployment); education (population aged 25-64 with low educational attainment, population aged 25-64 with medium educational attainment, population aged 25-64 with high educational attainment, population aged 30-34 with high educational attainment, participation of adults aged 25-64 in education and training); and R&D Expenditure. In order to avoid potential multicollinearity problems between these indicators in the statistical analysis, four indicators have had to be selected. Specifically, those with a variance inflation factor (VIF) below 3.3.5 These bank data are obtained from the Bank of Spain.
Filippo di Pietro / María-José Palacín-Sánchez / José L. Roldán
ISSN: 1131 - 6837 Cuadernos de Gestión Vol. 18 - Nº 1 (2018), pp. 37-60 47
and di Pietro 2016), which has a strong influence on regional economic growth (Fernández de Guevara and Maudos 2009).
Table 2
Descriptive statistics
Construct Variable Mean Standard Deviation Minimum Maximum
Capital Structure
LTDR 0.123 0.131 0 0.879
STDR 0.451 0.203 0.004 0.959
Debt/equity 2.386 3.310 0.026 71.955
Asset Structure
IGP/TA 0.393 0.232 0 0.992
FA/TA 0.345 0.216 0.0002 0.998
Growth
(TAt – TAt-1)/TAt-1 0.101 0.229 -0.723 4.424
Profitability
EBIT/TA 0.085 0.087 -0.053 1.367
EBITDA/TA 0.129 0.088 -0.620 1.085
Age
AGE 22.789 11.814 0 107
Size
Ln_TA 8.938 0.683 7.611 10.668
Ln_Sales 9.101 0.771 0 10.817
Regional Develo-pment
LTUR 0.174 0.036 0.095 0.275
PA25-64ET 0.104 0.0138 0.079 0.135
PGR 0.017 0.009 -0.0006 0.030
GDP per capita 24461.55 4440.275 16164 30562
BD/GDP 0.936 0.268 0.515 1.602
Source: Own elaboration.
3.3. Assessment of epistemic relationships
The connection between theory (constructs) and data (indicators) is explained by an epistemic relationship, or measurement model. Two main kinds of epistemic relationships exist (Jarvis et al. 2003). A reflective measurement model hypothesises that a variation in
Regional development and capital structure of SMEs
Cuadernos de Gestión Vol. 18 - Nº 1 (2018), pp. 37-60 ISSN: 1131 - 683748
an underlying common latent factor makes clear the covariation between measures. The indicators are, here, reflective of the unobserved theoretical construct. They therefore co-vary with that latent variable’s level. A formative measurement model, meanwhile, shows that a combination of the measures affects the composite latent construct. Manifest varia-bles, which are also called formative indicators, bring about the latent variable. As a result, they cause or add to the construct.
Following the four criteria suggested by Jarvis et al. (2003), it has been determined that capital structure, asset structure, and size are reflective constructs. For its part, the regional development variable has been categorized as a formative construct. These criteria are not applicable to the growth and age variables because they are measured by one indicator, nor can they be applied to the sector variable since it has been modelled as a dummy variable (Falk and Miller 1992).
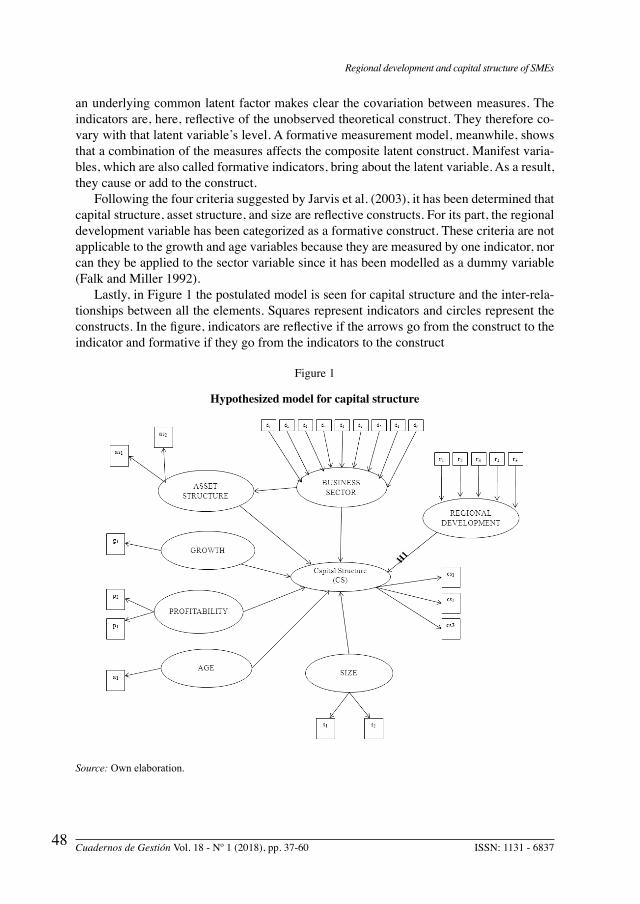
Lastly, in Figure 1 the postulated model is seen for capital structure and the inter-rela-tionships between all the elements. Squares represent indicators and circles represent the constructs. In the figure, indicators are reflective if the arrows go from the construct to the indicator and formative if they go from the indicators to the construct
Figure 1
Hypothesized model for capital structure
Source: Own elaboration.
Filippo di Pietro / María-José Palacín-Sánchez / José L. Roldán
ISSN: 1131 - 6837 Cuadernos de Gestión Vol. 18 - Nº 1 (2018), pp. 37-60 49
As said by Lohmoller (1989) the basic PLS algorithm follows a two-stage approach. The latent constructs’ scores are iteratively estimated via a four-step process in the first stage. In the second stage, the final estimates of coefficients are calculated (outer weights, loadings, and path coefficients) using the ordinary least squares method for each partial re-gression in the model (Hair et al. 2011). Applying both processes, the PLS algorithm aims to minimize the residual variances of dependent variables (Chin 1998)6.
3.4. Data analysis
Partial least squares (PLS) path modelling was used to evaluate the research model represented in Figure 1. This is an approach to structural equation modelling (SEM) which social sciences have employed for a long time and which has lately been remarked to a great extent in numerous business fields of study. Examples of these are marketing (Hair et al. 2011), strategic management (Hair et al. 2012), operation management (Peng and Lai 2012), and accountancy (Lee et al. 2011). SEM can carry out a holistic analysis using one of two different statistical methods. These are covariance-based SEM (CBSEM), as in software such as LISREL, EQS and AMOS, and variance-based (or component-based) SEM. This latter is PLS (Henseler et al. 2009). CBSEM has been the best-known SEM ap-proach till not long ago. However, social science researchers have been showing a growing interest in PLS.
PLS, through a sole analysis which is methodical and exhaustive, allows the assess-ing of measurement and structural models to be considered (Roldán and Sánchez-Franco 2012). The following explains why PLS has in this work been preferred to CBSEM: first, this work aims to predict the dependent variable -capital structure- (Chin 2010); second, as well as its exploratory approach (Peng and Lai 2012), this study is interactive, by which it is meant that it offers an incremental approach given that its original basis was a model that new measures and structural paths have later been added to (Chin 2010); third, our research model is complex (Peng and Lai 2012) in both its number of variables (manifest and latent) and in its hypothesised relationships; fourth, the measurement model deals with formative variables (Chin 2010); fifth, it has distinct measurement scales, which are in the form of ratio and nominal scaled variables (Hair et al. 2012); sixth, using PLS is recommended due to the fact that this work employs secondary data (Gefen et al. 2011). SmartPLS has specifically been utilized (Ringle et al. 2005).
Furthermore, according to Haenlein and Kaplan (2004) regarding multiple linear re-gression (MLR) analysis, PLS surmounts certain limitations: (a) the hypothesis of a simple model structure; (b) the supposition that all variables can be regarded as observable; and (c) the assumption that the measurement of all variables are error-free. Moreover, Sosik et al. (2009) show that PLS has many additional advantages over MLR. Specifically, with PLS the following are not needed: (1) normality of data distributions; (2) observation in-dependence; and (3) variable metric uniformity. PLS also allows there to be more consist-ency between the meaning of measurement items and how they are explained in a research model. In other words, it is possible to integrate both reflective and formative measurement models with PLS, which is what has been done in this work. Finally, Sosik et al. (2009)
6 For more details see Tenenhaus et al. (2005).
Regional development and capital structure of SMEs
Cuadernos de Gestión Vol. 18 - Nº 1 (2018), pp. 37-60 ISSN: 1131 - 683750
show that the regression coefficients provided by PLS are more likely to be closer to the true values than those provided by MLR.
4. EMPIRICAL RESULTS
Roldán and Sánchez-Franco (2012) suggest two stages in the PLS analysis: first, the as-sessment of the measurement model; and second, the analysis of the structural model. This succession permits appropriate indicators of constructs to be available before attempting to reach conclusions concerning the relationships included in the structural model (Hair et al. 2011).
4.1. Measurement model
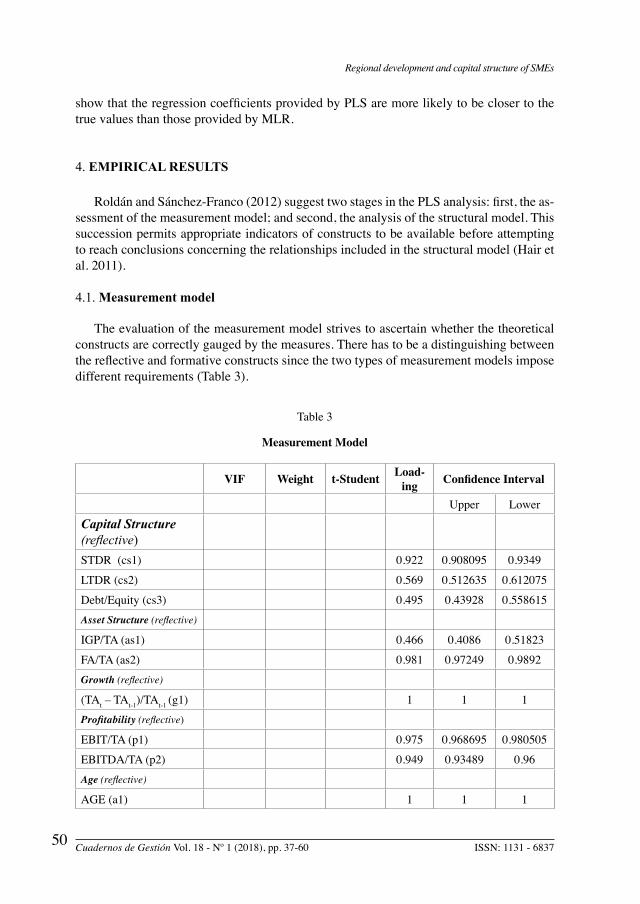
The evaluation of the measurement model strives to ascertain whether the theoretical constructs are correctly gauged by the measures. There has to be a distinguishing between the reflective and formative constructs since the two types of measurement models impose different requirements (Table 3).
Table 3
Measurement Model
VIF Weight t-Student Load-ing Confidence Interval
Upper Lower
Capital Structure (reflective)STDR (cs1) 0.922 0.908095 0.9349
LTDR (cs2) 0.569 0.512635 0.612075
Debt/Equity (cs3) 0.495 0.43928 0.558615Asset Structure (reflective)
IGP/TA (as1) 0.466 0.4086 0.51823
FA/TA (as2) 0.981 0.97249 0.9892Growth (reflective)
(TAt – TAt-1)/TAt-1 (g1) 1 1 1Profitability (reflective)
EBIT/TA (p1) 0.975 0.968695 0.980505
EBITDA/TA (p2) 0.949 0.93489 0.96Age (reflective)
AGE (a1) 1 1 1
Filippo di Pietro / María-José Palacín-Sánchez / José L. Roldán
ISSN: 1131 - 6837 Cuadernos de Gestión Vol. 18 - Nº 1 (2018), pp. 37-60 51
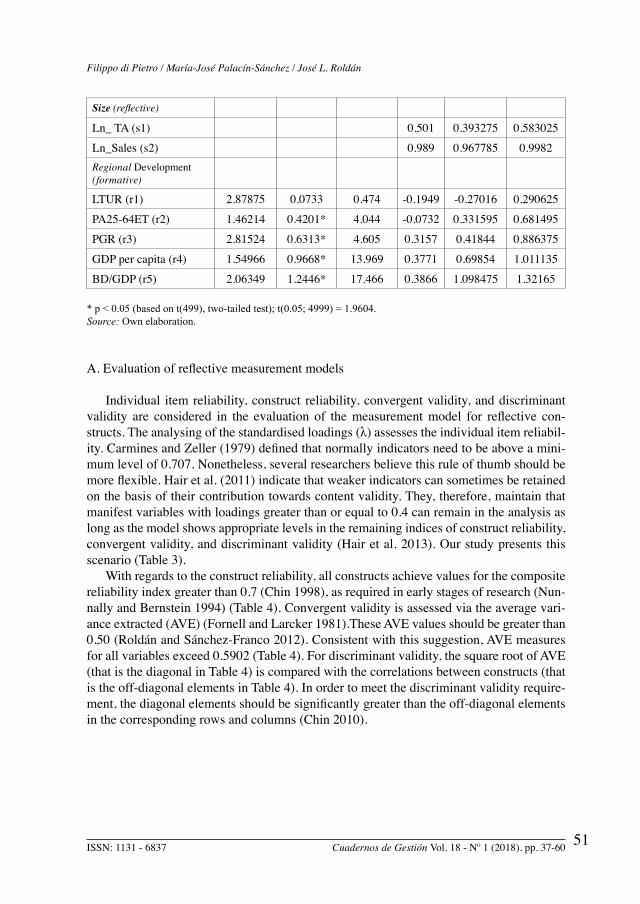
Size (reflective)
Ln_ TA (s1) 0.501 0.393275 0.583025
Ln_Sales (s2) 0.989 0.967785 0.9982Regional Development(formative)
LTUR (r1) 2.87875 0.0733 0.474 -0.1949 -0.27016 0.290625
PA25-64ET (r2) 1.46214 0.4201* 4.044 -0.0732 0.331595 0.681495
PGR (r3) 2.81524 0.6313* 4.605 0.3157 0.41844 0.886375
GDP per capita (r4) 1.54966 0.9668* 13.969 0.3771 0.69854 1.011135
BD/GDP (r5) 2.06349 1.2446* 17.466 0.3866 1.098475 1.32165
* p < 0.05 (based on t(499), two-tailed test); t(0.05; 4999) = 1.9604.Source: Own elaboration.
A. Evaluation of reflective measurement models
Individual item reliability, construct reliability, convergent validity, and discriminant validity are considered in the evaluation of the measurement model for reflective con-structs. The analysing of the standardised loadings (λ) assesses the individual item reliabil-ity. Carmines and Zeller (1979) defined that normally indicators need to be above a mini-mum level of 0.707. Nonetheless, several researchers believe this rule of thumb should be more flexible. Hair et al. (2011) indicate that weaker indicators can sometimes be retained on the basis of their contribution towards content validity. They, therefore, maintain that manifest variables with loadings greater than or equal to 0.4 can remain in the analysis as long as the model shows appropriate levels in the remaining indices of construct reliability, convergent validity, and discriminant validity (Hair et al. 2013). Our study presents this scenario (Table 3).
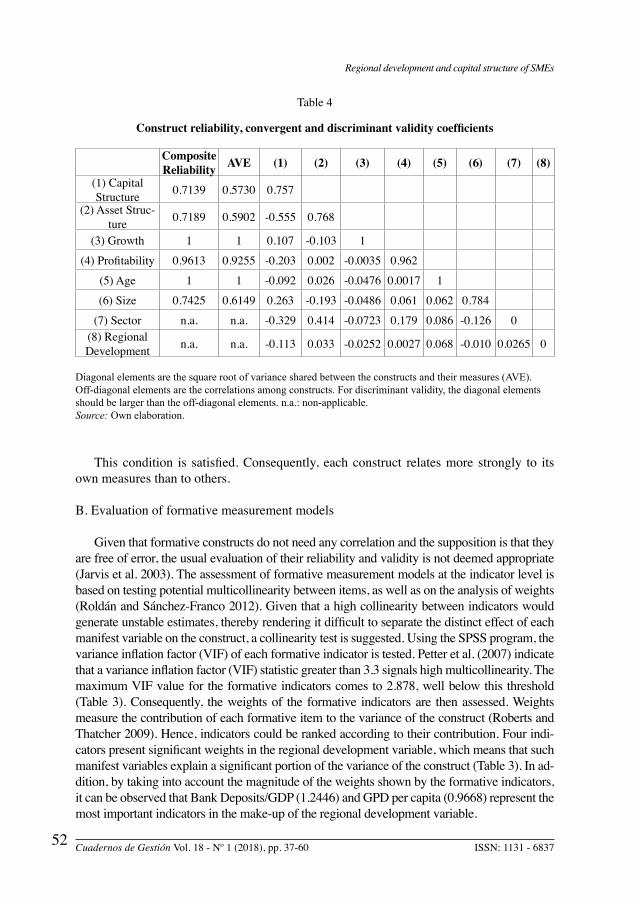
With regards to the construct reliability, all constructs achieve values for the composite reliability index greater than 0.7 (Chin 1998), as required in early stages of research (Nun-nally and Bernstein 1994) (Table 4). Convergent validity is assessed via the average vari-ance extracted (AVE) (Fornell and Larcker 1981).These AVE values should be greater than 0.50 (Roldán and Sánchez-Franco 2012). Consistent with this suggestion, AVE measures for all variables exceed 0.5902 (Table 4). For discriminant validity, the square root of AVE (that is the diagonal in Table 4) is compared with the correlations between constructs (that is the off-diagonal elements in Table 4). In order to meet the discriminant validity require-ment, the diagonal elements should be significantly greater than the off-diagonal elements in the corresponding rows and columns (Chin 2010).
Regional development and capital structure of SMEs
Cuadernos de Gestión Vol. 18 - Nº 1 (2018), pp. 37-60 ISSN: 1131 - 683752
Table 4
Construct reliability, convergent and discriminant validity coefficients
Composite Reliability AVE (1) (2) (3) (4) (5) (6) (7) (8)
(1) Capital Structure 0.7139 0.5730 0.757
(2) Asset Struc-ture 0.7189 0.5902 -0.555 0.768
(3) Growth 1 1 0.107 -0.103 1
(4) Profitability 0.9613 0.9255 -0.203 0.002 -0.0035 0.962
(5) Age 1 1 -0.092 0.026 -0.0476 0.0017 1
(6) Size 0.7425 0.6149 0.263 -0.193 -0.0486 0.061 0.062 0.784
(7) Sector n.a. n.a. -0.329 0.414 -0.0723 0.179 0.086 -0.126 0(8) Regional Development n.a. n.a. -0.113 0.033 -0.0252 0.0027 0.068 -0.010 0.0265 0
Diagonal elements are the square root of variance shared between the constructs and their measures (AVE). Off-diagonal elements are the correlations among constructs. For discriminant validity, the diagonal elements should be larger than the off-diagonal elements. n.a.: non-applicable.Source: Own elaboration.
This condition is satisfied. Consequently, each construct relates more strongly to its own measures than to others.
B. Evaluation of formative measurement models
Given that formative constructs do not need any correlation and the supposition is that they are free of error, the usual evaluation of their reliability and validity is not deemed appropriate (Jarvis et al. 2003). The assessment of formative measurement models at the indicator level is based on testing potential multicollinearity between items, as well as on the analysis of weights (Roldán and Sánchez-Franco 2012). Given that a high collinearity between indicators would generate unstable estimates, thereby rendering it difficult to separate the distinct effect of each manifest variable on the construct, a collinearity test is suggested. Using the SPSS program, the variance inflation factor (VIF) of each formative indicator is tested. Petter et al. (2007) indicate that a variance inflation factor (VIF) statistic greater than 3.3 signals high multicollinearity. The maximum VIF value for the formative indicators comes to 2.878, well below this threshold (Table 3). Consequently, the weights of the formative indicators are then assessed. Weights measure the contribution of each formative item to the variance of the construct (Roberts and Thatcher 2009). Hence, indicators could be ranked according to their contribution. Four indi-cators present significant weights in the regional development variable, which means that such manifest variables explain a significant portion of the variance of the construct (Table 3). In ad-dition, by taking into account the magnitude of the weights shown by the formative indicators, it can be observed that Bank Deposits/GDP (1.2446) and GPD per capita (0.9668) represent the most important indicators in the make-up of the regional development variable.
Filippo di Pietro / María-José Palacín-Sánchez / José L. Roldán
ISSN: 1131 - 6837 Cuadernos de Gestión Vol. 18 - Nº 1 (2018), pp. 37-60 53
4.2. Structural model
The assessment of the structural model is based on the algebraic sign, magnitude and significance of the structural path coefficients, the R2 values, and the Q2 (redundancy) test for predictive relevance. With the aim to assess the statistical significance of the path coefficients, a bootstrapping process (5,000 resamples) was applied in order to generate standard errors and t-statistics (Hair et al. 2011). The bootstrapping confidence interval of standardized regression coefficients is additionally reported7.
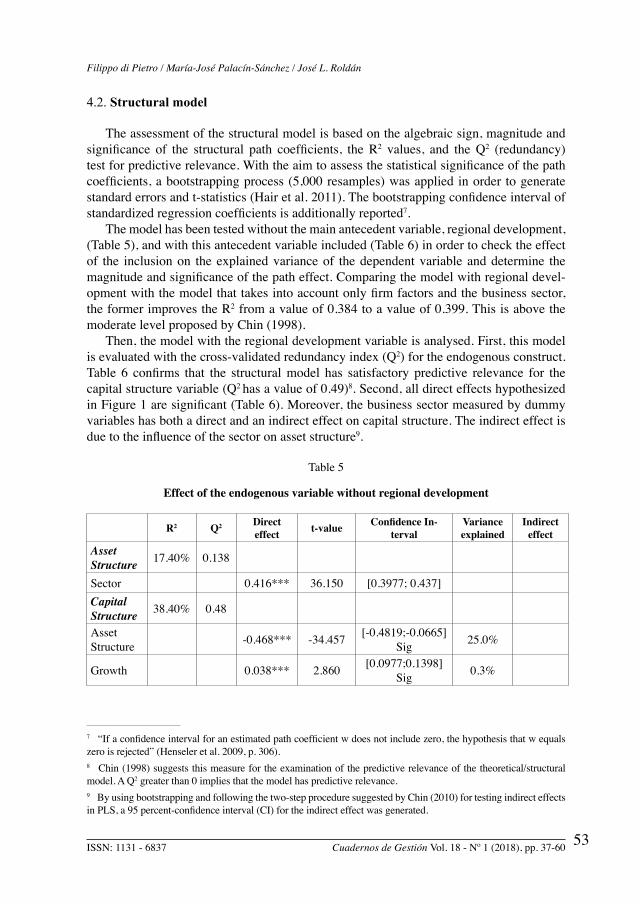
The model has been tested without the main antecedent variable, regional development, (Table 5), and with this antecedent variable included (Table 6) in order to check the effect of the inclusion on the explained variance of the dependent variable and determine the magnitude and significance of the path effect. Comparing the model with regional devel-opment with the model that takes into account only firm factors and the business sector, the former improves the R2 from a value of 0.384 to a value of 0.399. This is above the moderate level proposed by Chin (1998).
Then, the model with the regional development variable is analysed. First, this model is evaluated with the cross-validated redundancy index (Q2) for the endogenous construct. Table 6 confirms that the structural model has satisfactory predictive relevance for the capital structure variable (Q2 has a value of 0.49)8. Second, all direct effects hypothesized in Figure 1 are significant (Table 6). Moreover, the business sector measured by dummy variables has both a direct and an indirect effect on capital structure. The indirect effect is due to the influence of the sector on asset structure9.
Table 5
Effect of the endogenous variable without regional development
R2 Q2 Direct effect t-value Confidence In-
tervalVarianceexplained
Indirect effect
Asset Structure 17.40% 0.138
Sector 0.416*** 36.150 [0.3977; 0.437]Capital Structure 38.40% 0.48
Asset Structure -0.468*** -34.457 [-0.4819;-0.0665]
Sig 25.0%
Growth 0.038*** 2.860 [0.0977;0.1398]Sig 0.3%
7 “If a confidence interval for an estimated path coefficient w does not include zero, the hypothesis that w equals zero is rejected” (Henseler et al. 2009, p. 306).8 Chin (1998) suggests this measure for the examination of the predictive relevance of the theoretical/structural model. A Q2 greater than 0 implies that the model has predictive relevance.9 By using bootstrapping and following the two-step procedure suggested by Chin (2010) for testing indirect effects in PLS, a 95 percent-confidence interval (CI) for the indirect effect was generated.
Regional development and capital structure of SMEs
Cuadernos de Gestión Vol. 18 - Nº 1 (2018), pp. 37-60 ISSN: 1131 - 683754
Profitabi-lity -0.213*** -14.417 [-0.2397;-
0.079Sig 3.9%
Age -0.084*** -7.355 [-0.1045;-0.0633]Sig 0.78%
Size 0.214*** 19.836 [0.1750;0.2197]Sig 6.1%
Sector -0.049*** -3.652 [-0.108;-0.0495]Sig 1.8% -0.089
*** p < 0.001; ** p < 0.01; * p < 0.05; (based on t(4999), one-tailed test)t(0.05, 4999) = 1.645; t(0.01, 4999) = 2.327; t(0.001, 4999) = 3.092Source: Own elaboration.
Table 6
Effect of the endogenous variable
R2 Q2 Direct effect t-value Confidence
IntervalVarianceexplained
Indirect effect
Asset Structure 17.30% 0.138
Sector 0.416 32.957 [0.3977; 0.437]Capital
Structure 39.90% 0.49
Asset Structure -0.486*** -48.119 [-0.5419;-0.5134]Sig 27.0%
Growth 0.055* 2.179 [0.0024;0.0385]Sig 0.6%
Profitability -0.202*** -11.363 [-0.1431;-0.1008]Sig 4.1%
Age -0.078*** -4.49 [-0.567;-0.5111]Sig 0.7%
Size 0.181*** 17.5317 [0.1634;0.1964]Sig 4.8%
Sector -0.055*** -3.472 [-0067;-0.024]Sig 1.8% -0.2021Regional Devel-
opment -0.087*** -7.6528 [-0.1188;-0.0853]Sig 1.0%
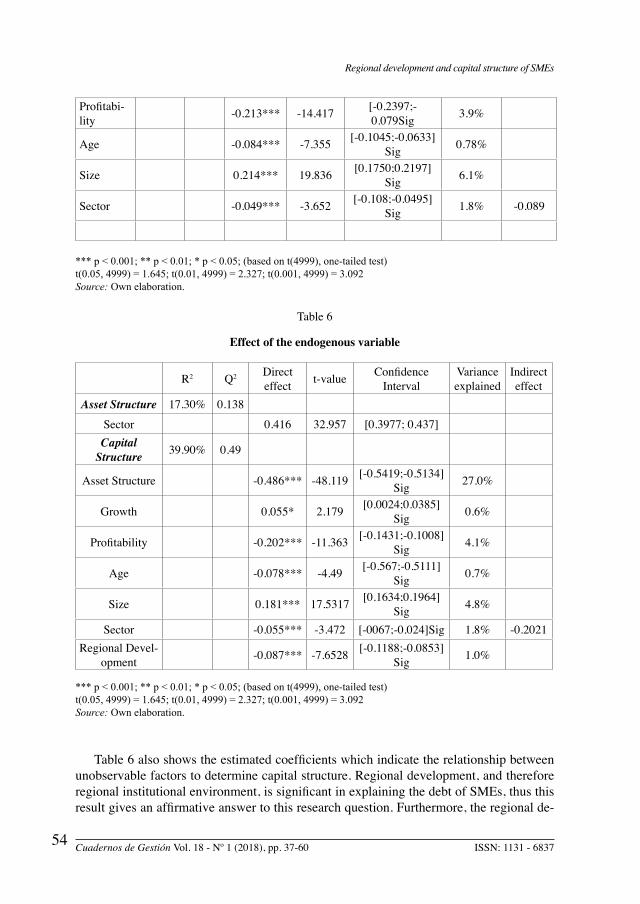
*** p < 0.001; ** p < 0.01; * p < 0.05; (based on t(4999), one-tailed test)t(0.05, 4999) = 1.645; t(0.01, 4999) = 2.327; t(0.001, 4999) = 3.092Source: Own elaboration.
Table 6 also shows the estimated coefficients which indicate the relationship between unobservable factors to determine capital structure. Regional development, and therefore regional institutional environment, is significant in explaining the debt of SMEs, thus this result gives an affirmative answer to this research question. Furthermore, the regional de-
Filippo di Pietro / María-José Palacín-Sánchez / José L. Roldán
ISSN: 1131 - 6837 Cuadernos de Gestión Vol. 18 - Nº 1 (2018), pp. 37-60 55
velopment construct has a substantive impact10. On the other hand, the relation of regional development with capital structure is negative. This negative sign indicates that the more highly developed the region where the SME is located, the less debt and the more outside equity the firm uses. A possible explanation is that less developed regions have fewer re-sources of their own to invest, and therefore must rely on debt. Moreover, in these regions, the local government has probably pressured financial institutions, especially the savings banks that do business in their area, to grant external financing (credits) to new investment projects and thereby to further the economic development. The study by Fan et al. (2012) also obtained a negative relationship.
On the other hand, all firm factors are significant. In general, the sign of these relation-ships between the firm determinants considered and the capital structure is consistent with the capital structure literature. Asset structure has a negative relation with capital structure. Empirical research has found evidence in both directions. The negative sign, in this case, could be due to the fact that the SMEs whose short-term debt carries the greatest weight within the total debt have been analysed and logically the asset structure favours the long-term debt because, as the POT theory postulates, fixed assets can be used as a guarantee. In this sense, SMEs with greater fixed assets (asset structure) use less short-term debt and, in general, less debt than SMEs with smaller fixed assets (asset structure). Moreover, the signs of growth, profitability, age, and size are the same as those expected by the theories and the empirical evidence in capital structure. Growth and size have a positive effect on leverage, while profitability and age have a negative effect.
Finally, Table 6 shows the amount of variance that each antecedent variable explains on the capital structure. Asset structure, with 27 percent, has the largest explanatory power of capital structure variation, followed by firm size (4.8 percent), and profitability (4.1 percent). The remaining constructs all explain similar percentages of variance. It is worth mentioning that regional development explains more variance of capital structure than growth and age, (1 percent compared to 0.6 percent and 0.7 percent, respectively), how-ever these two latter variables have been used much more in empirical research of capital structure. Overall, it is true that firm factors and the business sector (indirect and direct effects) explain a greater capital structure variation than does the regional variable.
5. CONCLUSIONS
By means of employing a sample of Spanish SMEs and a PLS technique, this article analyses the effect of regional institutional environment, measured as regional develop-ment, on the capital structure of SMEs belonging to a single country, together with the
10 Cohen’s f2 (Cohen 1988) is calculated in order to evaluate if the regional development construct has a substantive impact. This mean estimates the following equation: f2 = (R2 included– R2 excluded)/(1- R2 included), where R2
included is the R2 calculated with the regional development construct and the R2 excluded is the R2 calculated without the regional development construct. The f2 is equal to 0.025. This value exceeds the minimum threshold of 0.02 shown by Cohen. As Mathieson et al. (2001) show, multiplying f2 by (n - k - 1) - where n is the sample size and k is the number of independent constructs - provides a pseudo F test for testing the significance of the f2 statistic with 1 and n - k degrees of freedom. The pseudo F test in this case is equal to 162.3. This means a significant effect at the 0.01 level.
Regional development and capital structure of SMEs
Cuadernos de Gestión Vol. 18 - Nº 1 (2018), pp. 37-60 ISSN: 1131 - 683756
more traditional factors commonly used in order to explain the level of debt: firm factors and business sector. Overall, our evidence is in line with those studies in corporate finance that jointly consider firm factors, the business sector, and country/regional institutional factors to explain the financial decisions of SMEs.
Firstly, the regional institutional system is significant in explaining the debt of SMEs. It is therefore relevant to take regional institutional environment into account in order to better ascertain the cross-regional differences in debt within a single country. Moreover, the relationship between the regional factor, measured as level of development, and capital structure is negative. This result suggests that the debt of SMEs is higher in less developed Spanish regions. A possible explanation is that less developed regions, which are poorer, have fewer resources of their own to invest, and therefore must rely on debt. Moreover, in the developed regions, regional institutional factors might favour the use of debt and especially that of external equity.
Secondly, all the firm factors considered herein are significant in the explanation of fi-nancing decisions. Furthermore, the business sector has both a direct and an indirect effect via asset structure on capital structure. Finally, firm factors and business sector explain a greater capital structure variation than does the regional construct.
This study has major implications for SME management and particularly for SME en-trepreneurs. One of the strategic variables to be decided when launching a business is its location. According to these results, this decision requires the consideration of the effects of the regional institutional system (for which the regional development may be a good indicator) on capital structure, especially when bearing in mind the difficulties of accessing finance for small businesses.
For future research, it would be interesting to identify the each individual regional fac-tor that influences the financing decisions of SMEs. Furthermore, not only the Spanish case should be investigated, but also those of other countries where the regional unit of analysis presents itself as relevant.
6. REFERENCES
Ang, J., 1991. Small business uniqueness and the theory of financial management. Journal of Small Business Finance, 1 (1), 1-13.
Balakrishnan, S. and Fox, I., 1993. Asset specificity, firm heterogeneity and capital struc-ture. Strategic Management Journal, 14 (1), 3–16.
Bhaird, C. and Lucey, B., 2010. Determinants of capital structure in Irish SMEs. Small Business Economics, 35, 357-375.
Carbó, S., Humphrey, D. and Rodríguez-Fernández, F., 2003. Deregulation, bank compe-tition and regional growth. Regional Studies, 37 (3), 227–237.
Carbó, S., Rodríguez-Fernández, F. and Udell, G., 2009. Bank market power and SME financing constraints. Review of Finance, 13, 309–340.
Carmines, E.G. and Zeller, R.A., 1979. Reliability and Validity Assessment. Beverly Hills, CA: Sage.
Cassar, G. and Holmes, S., 2003. Capital structure and financing of SMEs: Australian evi-dence. Accounting and Finance, 43, 123–147.
Filippo di Pietro / María-José Palacín-Sánchez / José L. Roldán
ISSN: 1131 - 6837 Cuadernos de Gestión Vol. 18 - Nº 1 (2018), pp. 37-60 57
Chang, C., Lee, A. C. and Lee C. F., 2009. Determinants of capital structure choice: A structural equation modeling approach. The Quarterly Review of Economics and Fi-nance, 49 (2), 197-213.
Chin, W.W., 1998. The Partial Least Squares approach to structural equation modelling, In Marcoulides, G.A. eds. Modern Methods for Business Research., Mahwah, NJ: Law-rence Erlbaum Associates, 295-336.
Chin, W. W., 2010. How to write up and report PLS analyses In: Esposito Vinzi, V., Chin, W.W., Henseler, J. and Wang, H. eds. Handbook of partial least squares: Concepts, methods and applications. Berlin, Germany: Springer-Verlag, 655–690.
Chittenden, F., Hall, G. and Hutchinson, P., 1996. Small firm growth, access to capital markets and financial structure: review of issues and an empirical investigation. Small Business Economics, 8, 59-67.
Cohen, J., 1988. Statistical power analysis for the behavioural sciences 2ª ed. New Jersey: Lawrence Erlbaum Associates.
Cuadrado-Roura, J., 2010. Regional policy, economic growth and convergence. Lessons for Spanish case. London, England: Springer.
Degryse, H., De Goeij, P. and Kappert, K., 2012. The impact of firm and industry charac-teristics on small firms’ capital structure. Small Economics Business, 38(4), 431-437.
Demirgüç-Kunt, A. and Maksimovic, V., 1999. Institutions, financial markets and firm debt maturity. Journal of Financial Economics, 54(3), 295–336.
Diamond, D.W., 1984. Financial intermediation and delegated monitoring. Review of Eco-nomic Studies, 51, 393–414.
Djankov, S., La Porta, R., López-de-Silanes, F. and Shleifer, A., 2003. Courts. Quarterly Journal of Economics, 118, 453-517.
Falk, R.F. and Miller, N.B., 1992. A Primer for Soft Modeling. Akron, OH: University of Akron.
Fama, E. and French, K., 2002. Testing trade-off and pecking order predictions about div-idends and debt. The Review of Financial Studies, 15 (1), 1-33.
Fan, J., Titman, S. and Twite, G., 2012. An international comparison of capital structure and debt maturity choices. Journal of Financial and Quantitative Analysis, 47 (1), 23–56.
Fernández de Guevara J. and Maudos, J., 2009. Regional financial development and bank competition: effects on firms’ growth. Regional Studies, 43 (2), 211–228.
Fornell, C. and. Larcker, D.F., 1981. Evaluating Structural Equation Models with Unob-servable Variables and Measurement Error. Journal of Marketing Research, 18 (1), 39-50
Gefen, D., Rigdon, E. E. and Straub, D., 2011. An update and extension to SEM guidelines for administrative and social science research. MIS Quarterly, 35(2), iii–xiv.
Giannetti, M., 2003. Do better institutions mitigate agency problems? Evidence from cor-porate finance choices. Journal of Financial and Quantitative Analysis, 38 (1), 185–212.
Haenlein, M. and Kaplan, A. M., 2004. A beginners guide to partial least squares analysis. Understanding Statistics, 3 (4), 283–297.
Hair, J.F., Hult, G.T.M., Ringle, C.M. and Sarstedt, M., 2013. A primer on partial least Squares Structural Equation Modeling (PLS-SEM). Thousand Oaks, CA: SAGE.
Regional development and capital structure of SMEs
Cuadernos de Gestión Vol. 18 - Nº 1 (2018), pp. 37-60 ISSN: 1131 - 683758
Hair, J.F., Ringle, C.M. and Sarstedt, M., 2011. PLS-SEM: Indeed a silver bullet. Journal of Marketing Theory and Practice, 19 (2), 137–149.
Hair, J.F., Sarstedt, M., Pieper, T.M. and Ringle, C.M., 2012. The Use of Partial Least Squares Structural Equation Modeling in Strategic Management Research: A Review of Past Practices and Recommendations for Future Applications. Long Range Plan-ning, 45, 320-340.
Hall, G., Hutchinson, P. and Michaelas, N., 2000. Industry effects on the determinant of unquoted SME´s capital structure. Economics of Business, 7 (3), 297–312.
Hall, G., Hutchinson, P. and Michaelas, N., 2004. Determinants of the capital structures of European SMEs. Journal of Business Finance & Accounting, 31(5), 711–728.
Harris, M. and Raviv, A., 1991. The theory of capital structure. Journal of Finance, 46, 297–355.
Henseler, J., Ringle, C. M. and Sinkovics, R. R., 2009. The use of partial least squares path modeling in international marketing. Advances in International Marketing, 20, 277–320.
Heyman, D., Deloof, M. and Ooghe, H., 2008. The financial structure of private held Bel-gian firms. Small Business Economics, 30, 301-313.
Hernández-Cánovas, G. and Koëter–Kant, J., 2011. SME financing in Europe, Cross-coun-try determinants of bank loan maturity. International Small Business Journal, 29 (5), 489–507.
Hernández Cánovas, G. and Martínez Solano, P., 2006. Banking relationships: effects on debt terms for small Spanish firms. Journal of Small Business Management, 44 (3), 315-333.
Jarvis C.B., Mackenzie, S.B. and Podsakoff, P.M., 2003. A critical review of construct in-dicators and measurement model misspecification in marketing and consumer research. Journal of Consumer Research, 30(2), 199–218.
Jõeveer, K., 2013. What do we know about the capital structure of small firms? Small Business Economics, 41, 479-501.
Jordan, J., Lowe, J. and Taylor, P., 1998. Strategy and financial policy in UK small firms. Journal of Business Finance and Accounting, 25, 1–27.
La Porta, R., López de Silanes, F., Shleifer, A. and Vishny, R., 1998. Law and finance. The Journal of Political Economy, 106, 1113–1155.
La Rocca, M., La Rocca, T. and Cariola, A., 2010. The influence of local institutional differences on the capital structure of SMEs. Evidence from Italy. International Small Business Journal, 28 (3), 234–257.
Lee, L., Petter, S., Fayard, D. and Robinson, S., 2011. On the use of partial least squares path modeling in accounting research. International Journal of Accounting Information Systems, 12 (4), 305-328.
López-Gracia, J. and Sogorb-Mira, F., 2008. Testing trade-off and pecking order theories financing SMEs. Small Business Economics, 31, 117-136.
Lopez-Gracia, J. and Aybar-Arias, C., 2000. An empirical approach to the financial be-haviour of small and medium sized companies. Small Business Economics, 14, 55-63.
Lohmoller, J., 1989. Latent variable path modeling with partial least squares. Heidelberg: Physica-Verlag.
Filippo di Pietro / María-José Palacín-Sánchez / José L. Roldán
ISSN: 1131 - 6837 Cuadernos de Gestión Vol. 18 - Nº 1 (2018), pp. 37-60 59
Mathieson, K., Peacock, E. and Chin, W. W., 2001. Extending the technology acceptance model: the influence of perceived user resources. The DATA BASE for Advances in Information Systems, 32 (3), 86–112.
Maudos, J., 2014. Tamaño empresarial y acceso a la financiación bancaria. Cuadernos de Información Económica, 240, 35-46.
Michaelas, N., Chittenden, F. and Poutzioris, P., 1999. Financial policy and capital struc-ture choice in UK SMEs. Empirical evidence from company panel data. Small Business Economics, 12(2), 113–130.
Myers, S., 1977. Determinants of corporate borrowing. Journal of Financial Economics, 5, 147-175.
Myers, S. (1984). The capital structure puzzle. Journal of Finance, 34, 575-592.Nunnally, J. C. and Bernstein, I. H. (1994). Psychometric theory (3rd ed.). New York:
McGraw-Hill.Palacín-Sánchez, M.J and di Pietro, F., 2016. The role of the regional financial sector in the
capital structure of small and medium-sized enterprises (SMEs). Regional Studies. 70 (7), 1232-1247. DOI. 10.1080/00343404.2014.1000290
Palacín-Sánchez, M.J., Ramírez-Herrera, L. and di Pietro, F., 2013. Capital structure of SMEs in Spanish regions. Small Business Economics, 41 (2), 403-519
Peng, D. X. and Lai, F., 2012. Using partial least squares in operations management re-search: A practical guideline and summary of past research. Journal of Operations Management, 30(6), 467-480.
Petter, S., Straub, D. W. and Rai, A. 2007. Specifying formative constructs in information systems research. MIS Quarterly, 31, 623–656.
Psillaki, M. and Daskalakis, N., 2009. Are the determinants of capital structure country or firm specific? Small Business Economics, 33, 319-333.
Roberts, N. and Thatcher, J.B., 2009. Conceptualizing and testing formative constructs: Tutorial and annotated example. The DATA BASE for Advances in Information Systems, 40 (3), 9-39.
Roldán, J. L. and Sánchez-Franco, M. J., 2012. Variance-Based Structural Equation Mod-eling: Guidelines for Using Partial Least Squares in Information Systems Research, In Mora, M., Gelman, O., Steenkamp, A. and Raisinghani, M. eds. Research Methodolo-gies, Innovations and Philosophies in Software Systems Engineering and Information Systems. Hershey, PA: Information Science Reference, 193-221.
Ringle, C. M., Wende, S. and Will, A., 2005. SmartPLS 2.0 (M3) beta. Hamburg, Germany: Smart PLS.
Salas-Fumás, V., 2014. Cambios en la estructura financiera, coste de capital e inversión en las empresas españolas. En: Requeijo, J. dir. Los Retos de la Financiación del sector empresarial, Madrid: Fundación de Estudios Financieros y Círculo de Empresarios, 43-59.
Sogorb-Mira, F., 2005. How SME uniqueness affects capital structure, Evidence from a 1994–1998 Spanish data panel. Small Business Economics, 25(5), 447 – 457.
Sosik, J. J., Kahai, S. S. and Piovoso, M. J., 2009. Silver bullet or voodoo statistics? A primer for using the partial least squares data analytic technique in group and organiza-tion research. Group & Organization Management, 34(1), 5–36.
Regional development and capital structure of SMEs
Cuadernos de Gestión Vol. 18 - Nº 1 (2018), pp. 37-60 ISSN: 1131 - 683760
Tenenhaus, M., Vinzi, V. E., Chatelin, Y.M. and Lauro, C., 2005. PLS path modelling. Computational Statistics & Data Analysis, 48 (1), 159–205
Titman, S. and Wessels R., 1988. The determinants of capital Structure Choice. Journal of Finance, 43, 1-19.
Utrero–González, N., 2007. Banking regulation, institutional framework and capital struc-ture, International evidence from industry data. The Quarterly Review of Economics and Finance, 47, 481–506.
Van der Wijst, N. and Thurik, R., 1993. Determinants of small firm debt ratios. An analysis of retail panel data. Small Business Economics, 5, 55–65.