Tda presentation
32
TOPOLOGICAL DATA ANALYSIS HJ van Veen· Data Science· Nubank Brasil
-
Upload
hj-van-veen -
Category
Technology
-
view
552 -
download
0
Transcript of Tda presentation
TOPOLOGICAL DATA ANALYSIS
HJ van Veen· Data Science· Nubank Brasil
TOPOLOGY I
• "When a truth is necessary, the reason for it can be found by analysis, that is, by resolving it into simpler ideas and truths until the primary ones are reached." - Leibniz
TOPOLOGY II
• Topology is the mathematical study of topological spaces.
• Topology is interested in shapes,
• More specifically: the concept of 'connectedness'

TOPOLOGY III• A topologist is someone who does not see the
difference between a coffee mug and a donut.
HISTORY I
• “Nothing at all takes place in the universe in which some rule of maximum or minimum does not appear.” - Euler
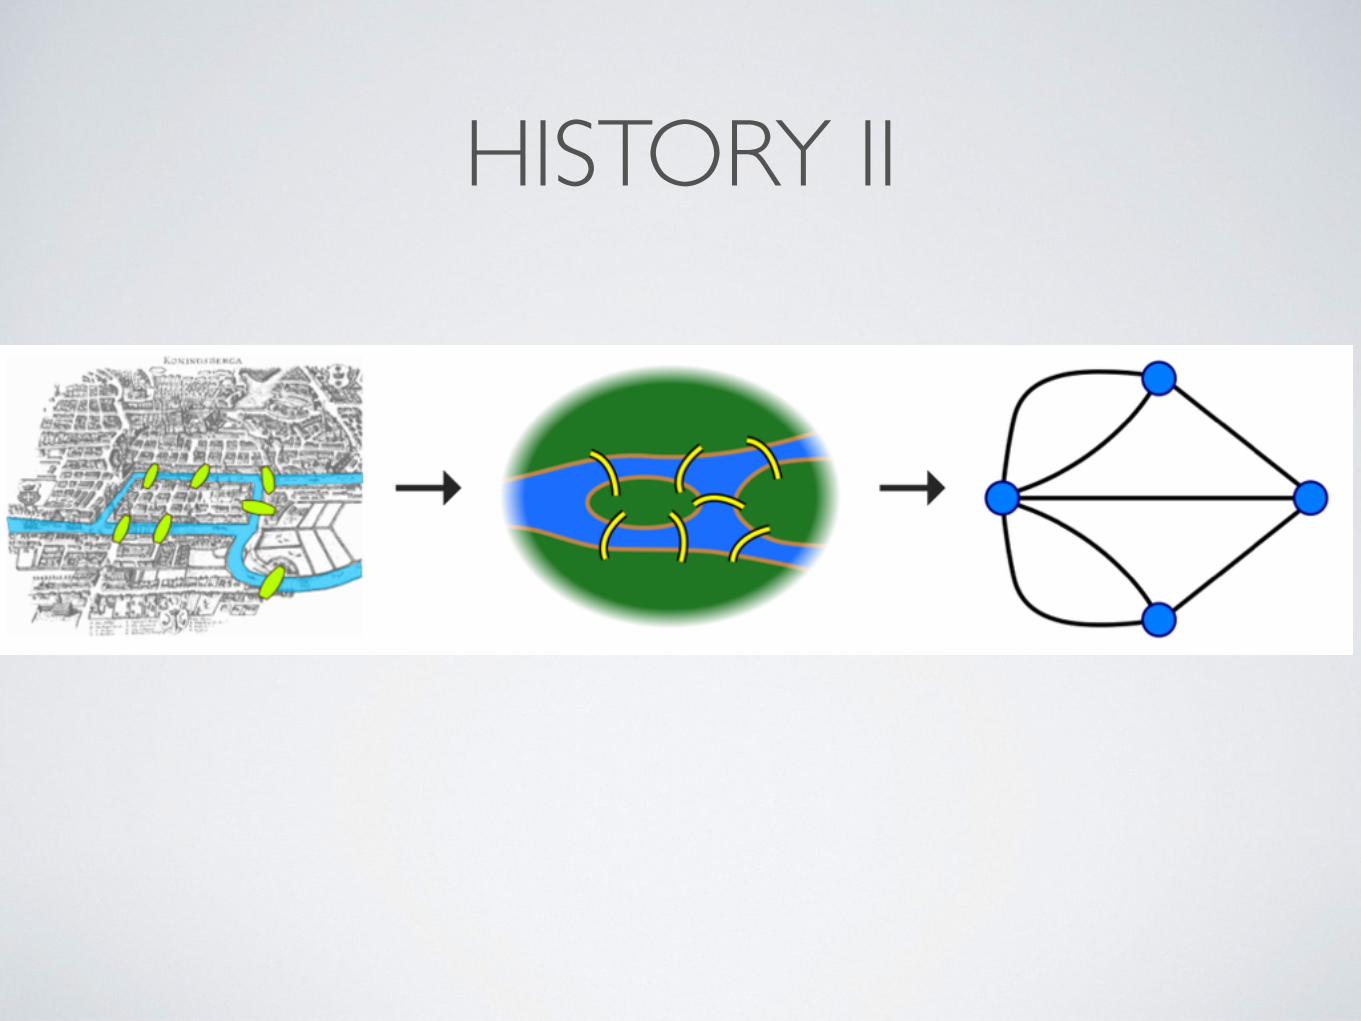
• Seven Bridges of Koningsbrucke: devise a walk through the city that would cross each bridge once and only once.
HISTORY II
HISTORY III• Euler's big insights:
• Doesn’t matter where you start walking, only matters which bridges you cross.
• A similar solution should be found, regardless where you start your walk.
• only the connectedness of bridges matter,
• a solution should also apply to all other bridges that are connected in a similar fashion, no matter the distances between them.
HISTORY IV
• We now call these graph walks ‘Eulerian walks’ in Euler’s honor.
• Euler's first proven graph theory theorem:
• 'Euler walks' are possible if exactly zero or two nodes have an odd number of edges.
TDA I• TDA marries 300-year old maths with
modern data analysis.
• Captures the shape of data
• Is invariant
• Compresses large datasets
• Functions well in the presence of noise / missing variables
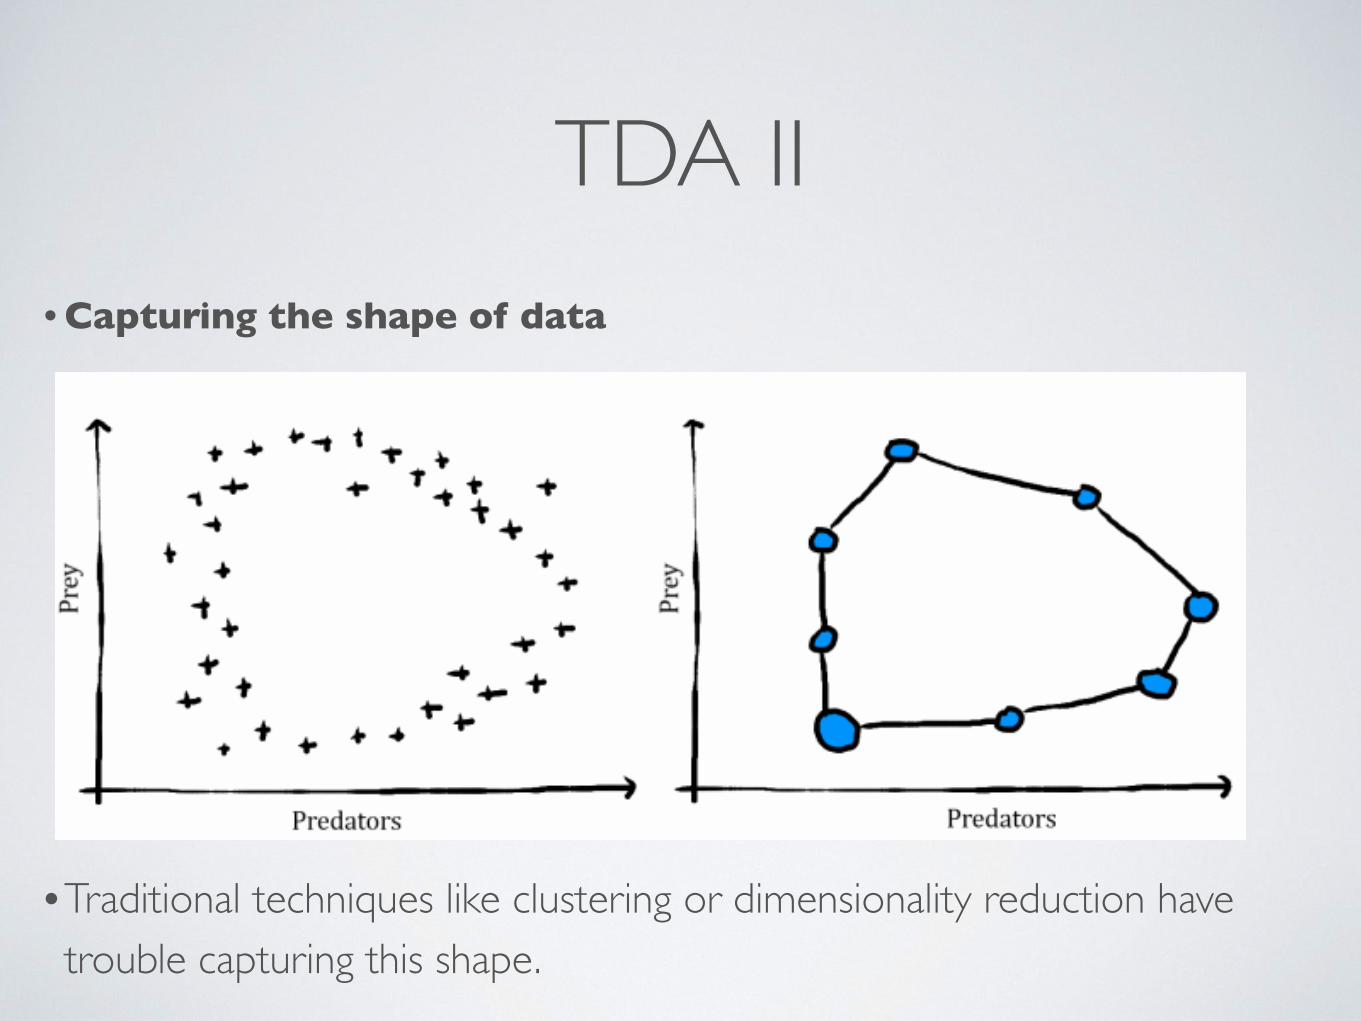
TDA II• Capturing the shape of data
•Traditional techniques like clustering or dimensionality reduction have trouble capturing this shape.
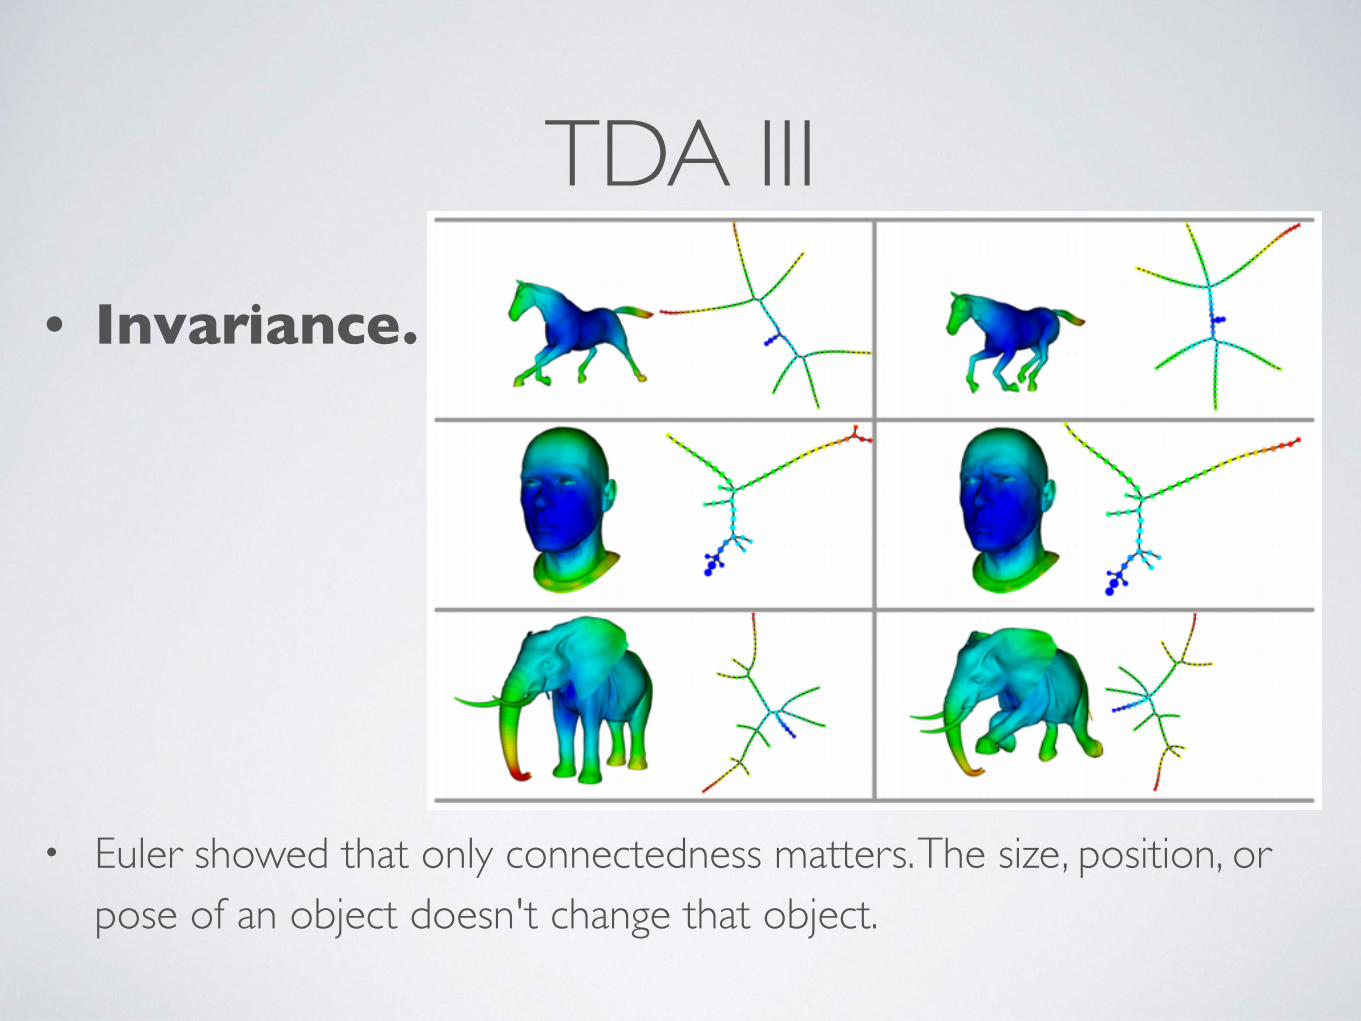
TDA III• Invariance.
• Euler showed that only connectedness matters. The size, position, or pose of an object doesn't change that object.
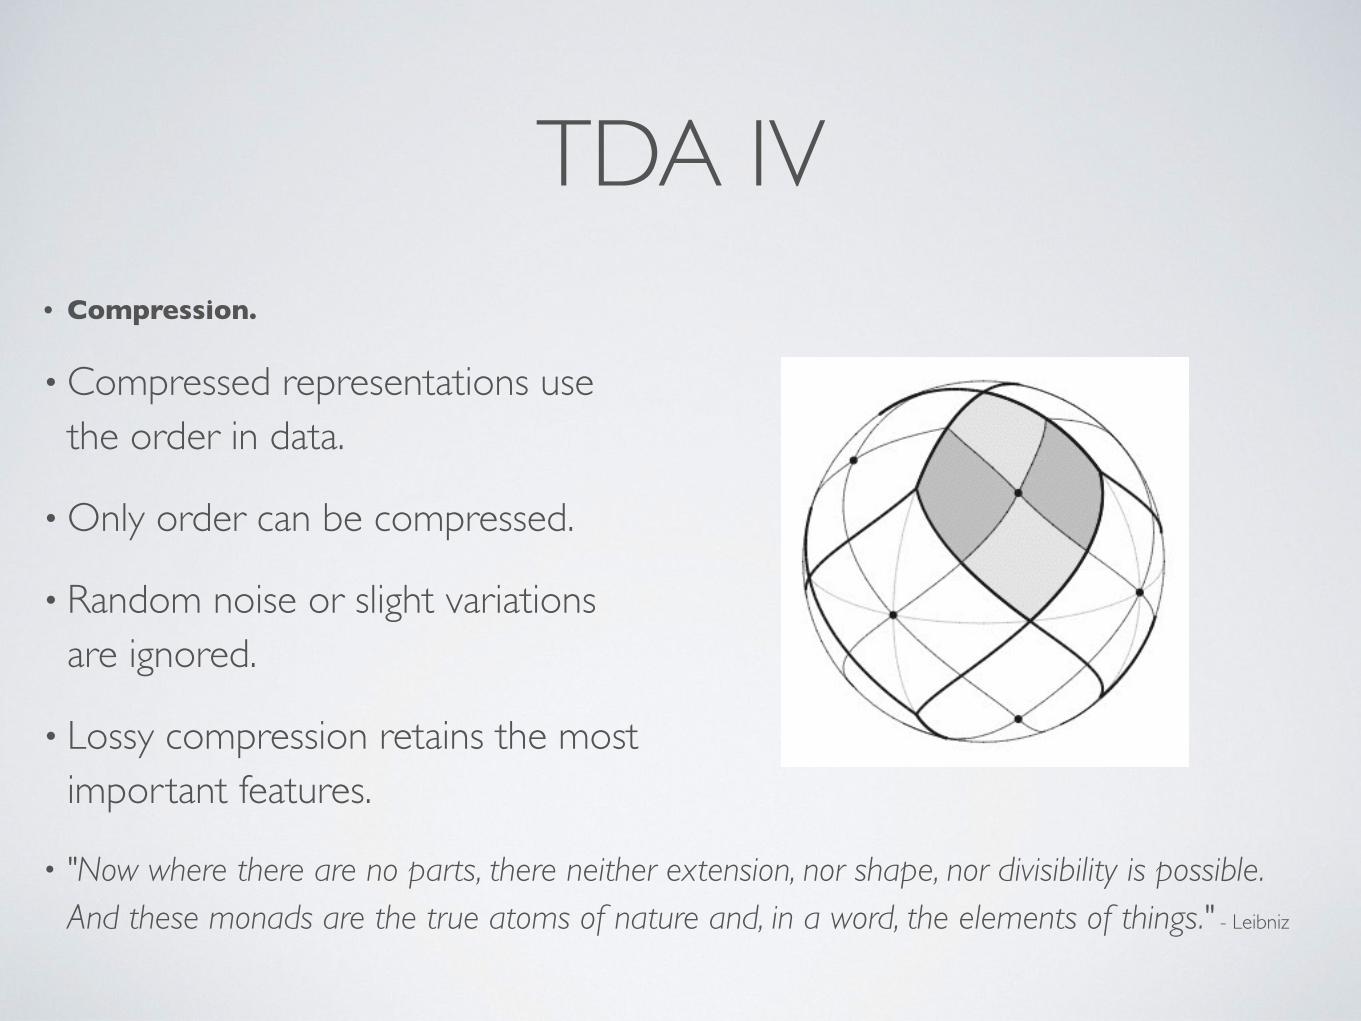
TDA IV• Compression.
• Compressed representations use the order in data.
• Only order can be compressed.
• Random noise or slight variations are ignored.
• Lossy compression retains the mostimportant features.
• "Now where there are no parts, there neither extension, nor shape, nor divisibility is possible. And these monads are the true atoms of nature and, in a word, the elements of things." - Leibniz
MAPPER I
• Mapper was created by Ayasdi Co-founder Gurjeet Singh during his PhD under Gunnar Carlsson.
• Based on the idea of partial clustering of the data guided by a set of functions defined on the data.
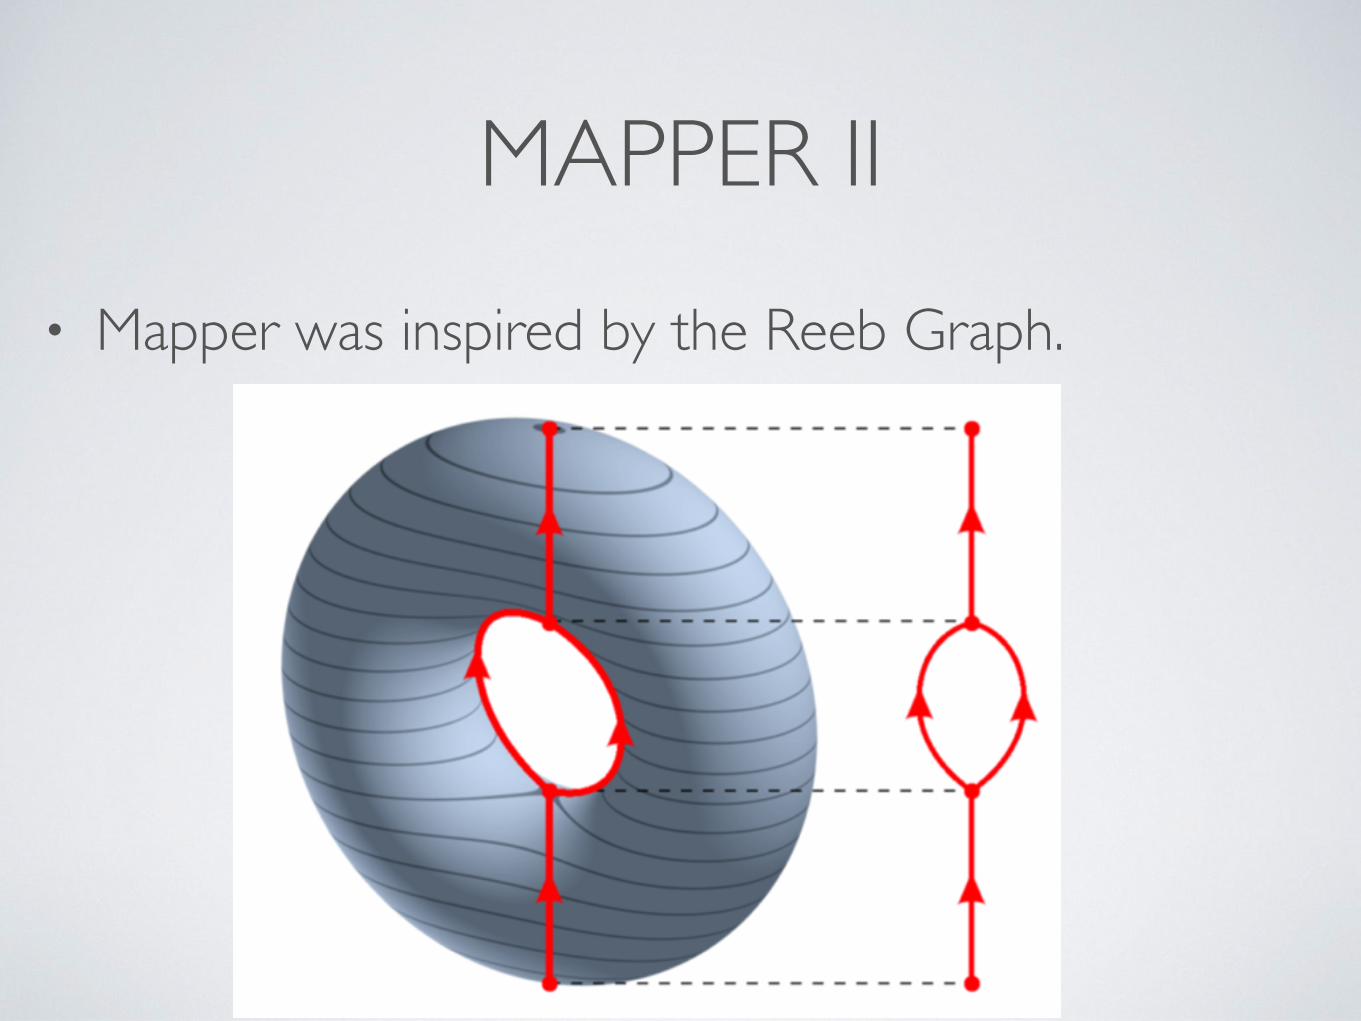
MAPPER II• Mapper was inspired by the Reeb Graph.
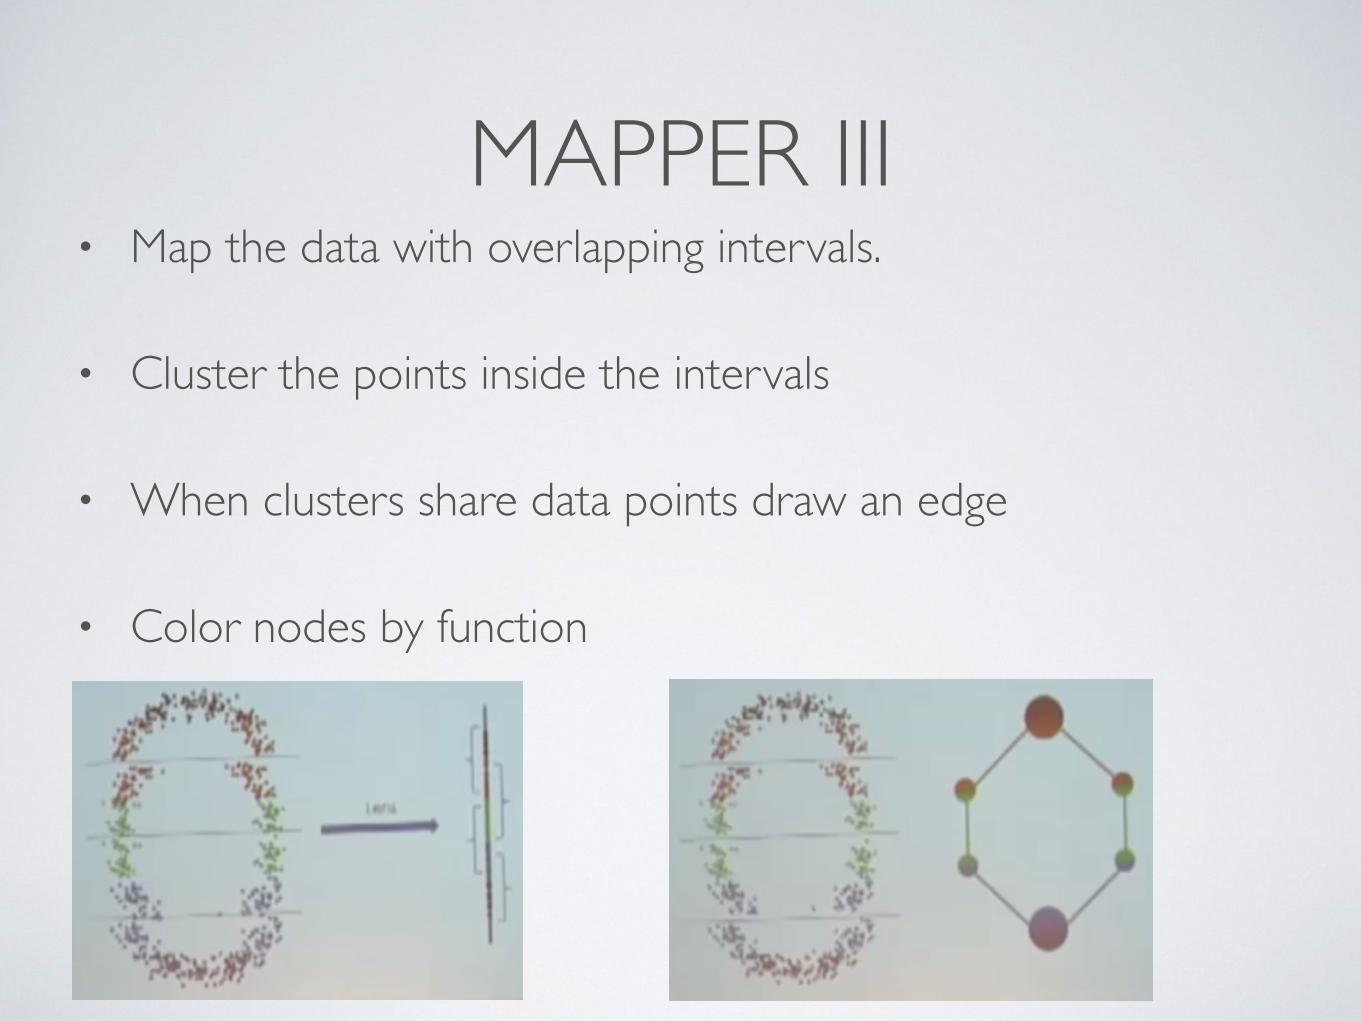
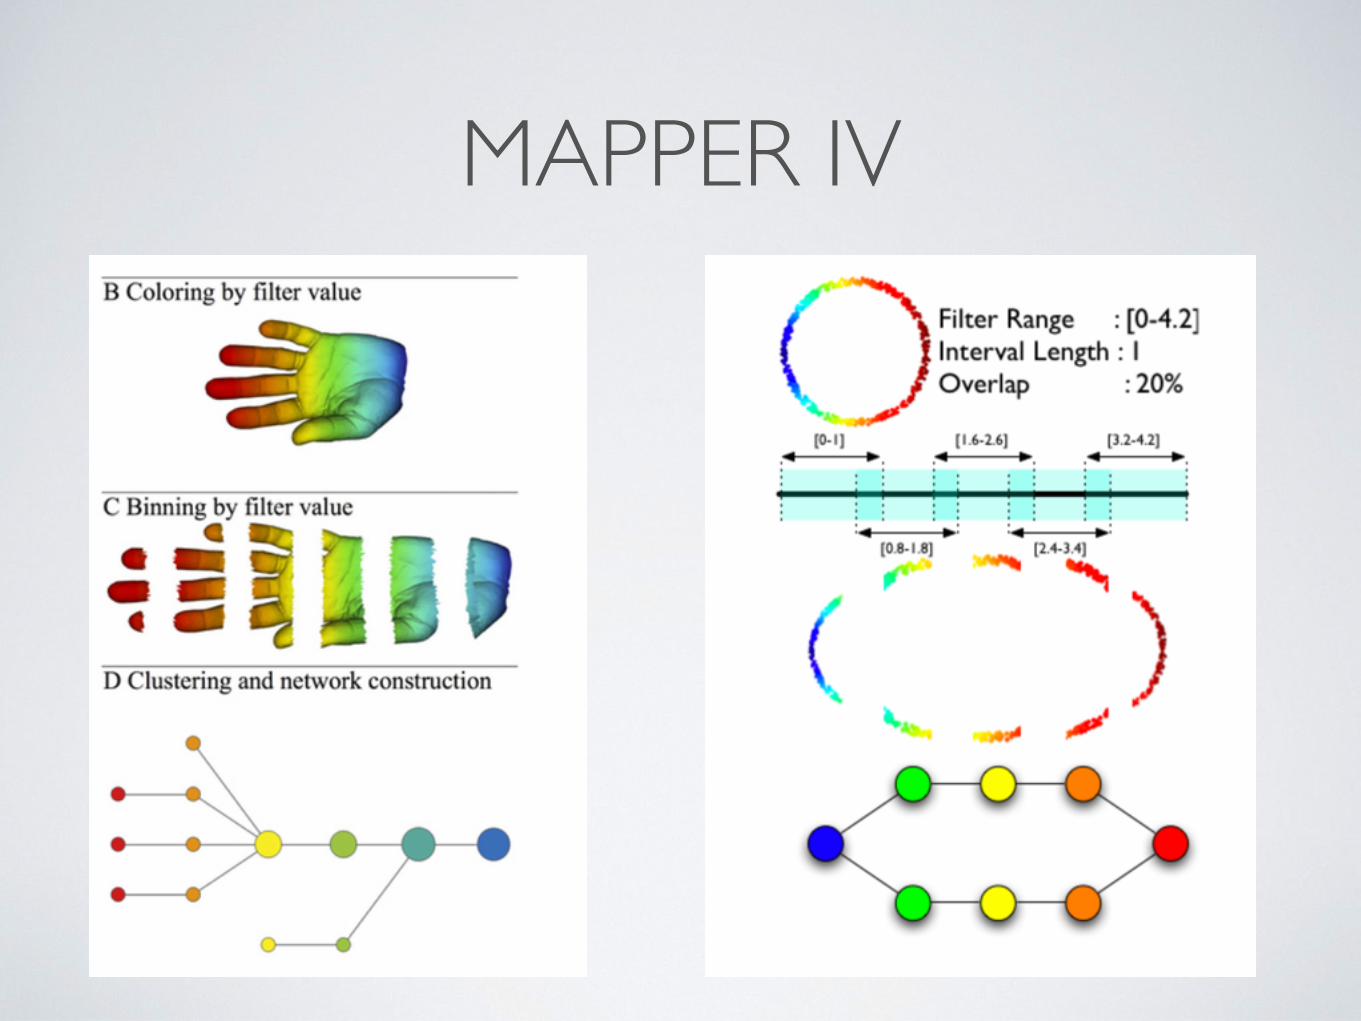
MAPPER III• Map the data with overlapping intervals.
• Cluster the points inside the intervals
• When clusters share data points draw an edge
• Color nodes by function
MAPPER IV
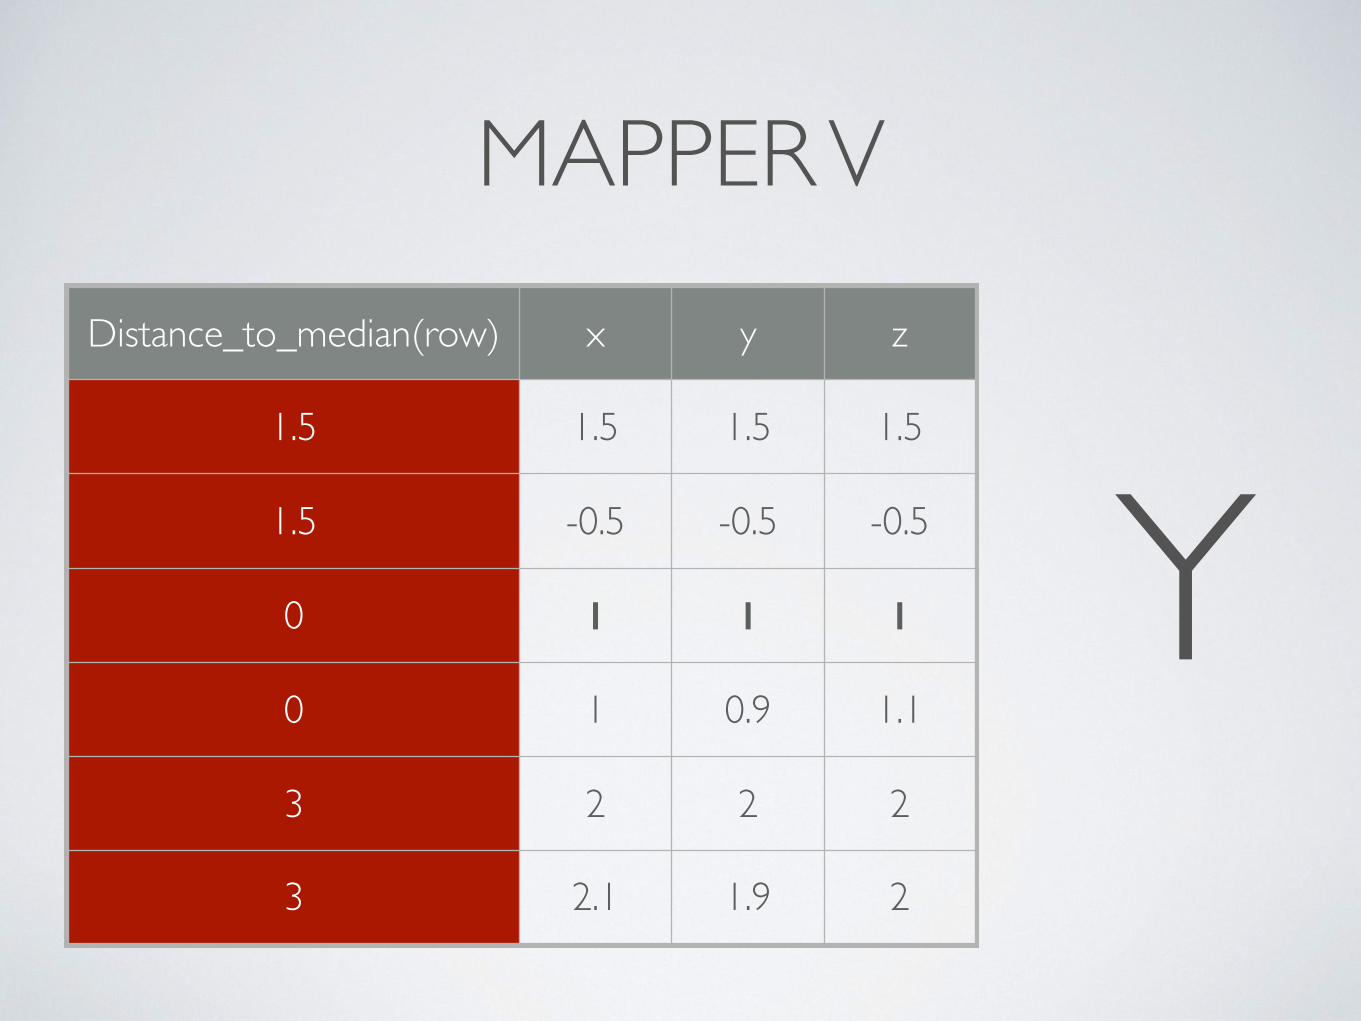
MAPPER VDistance_to_median(row) x y z
1.5 1.5 1.5 1.5
1.5 -0.5 -0.5 -0.5
0 1 1 1
0 1 0.9 1.1
3 2 2 2
3 2.1 1.9 2
Y
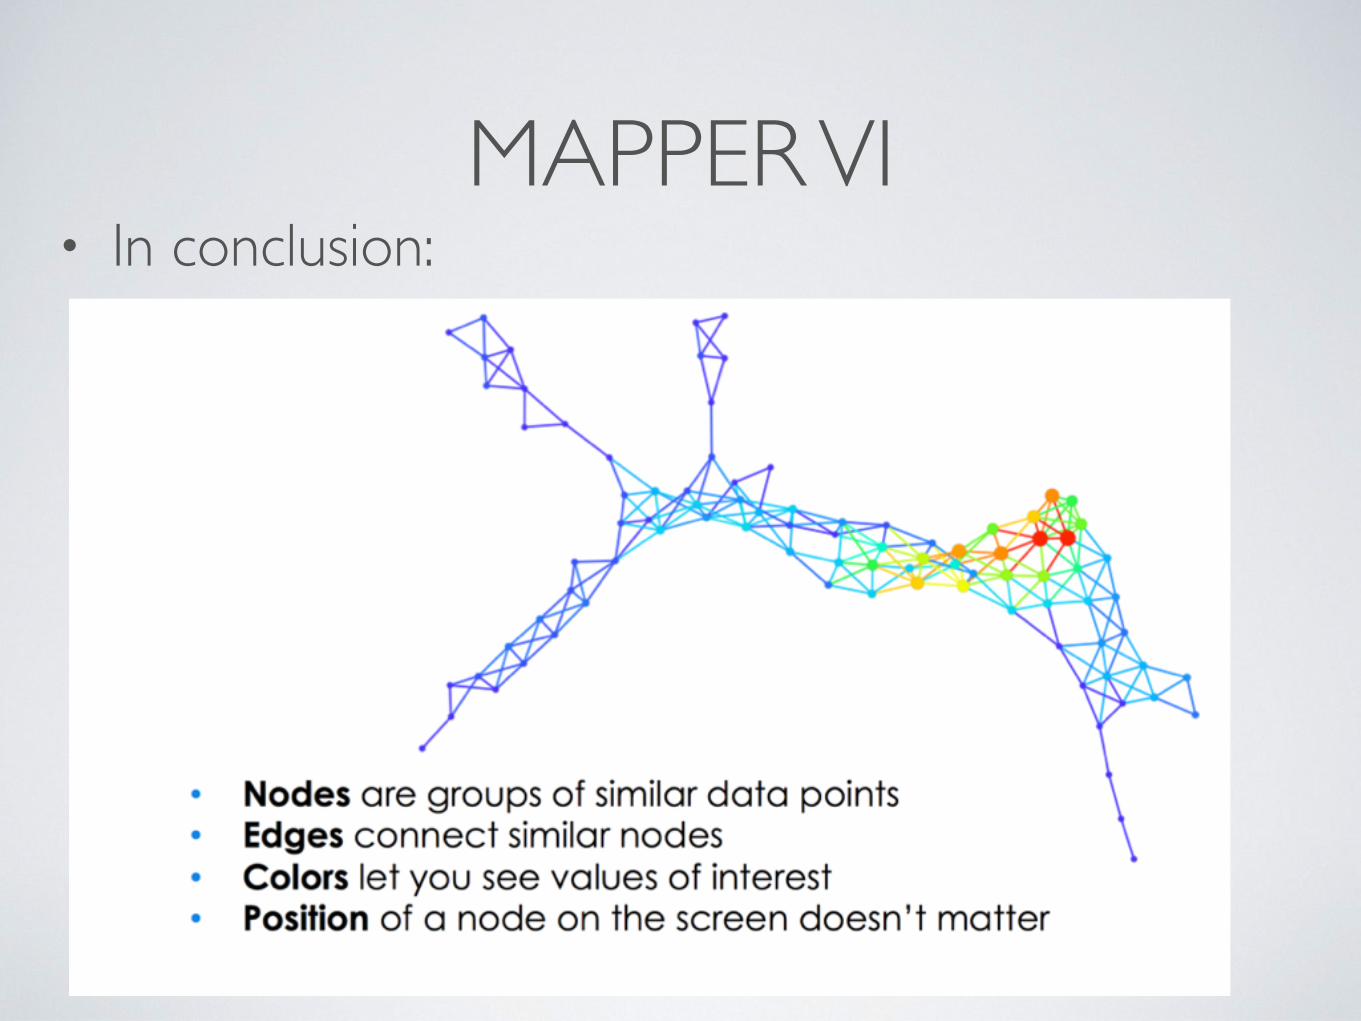
MAPPER VI• In conclusion:
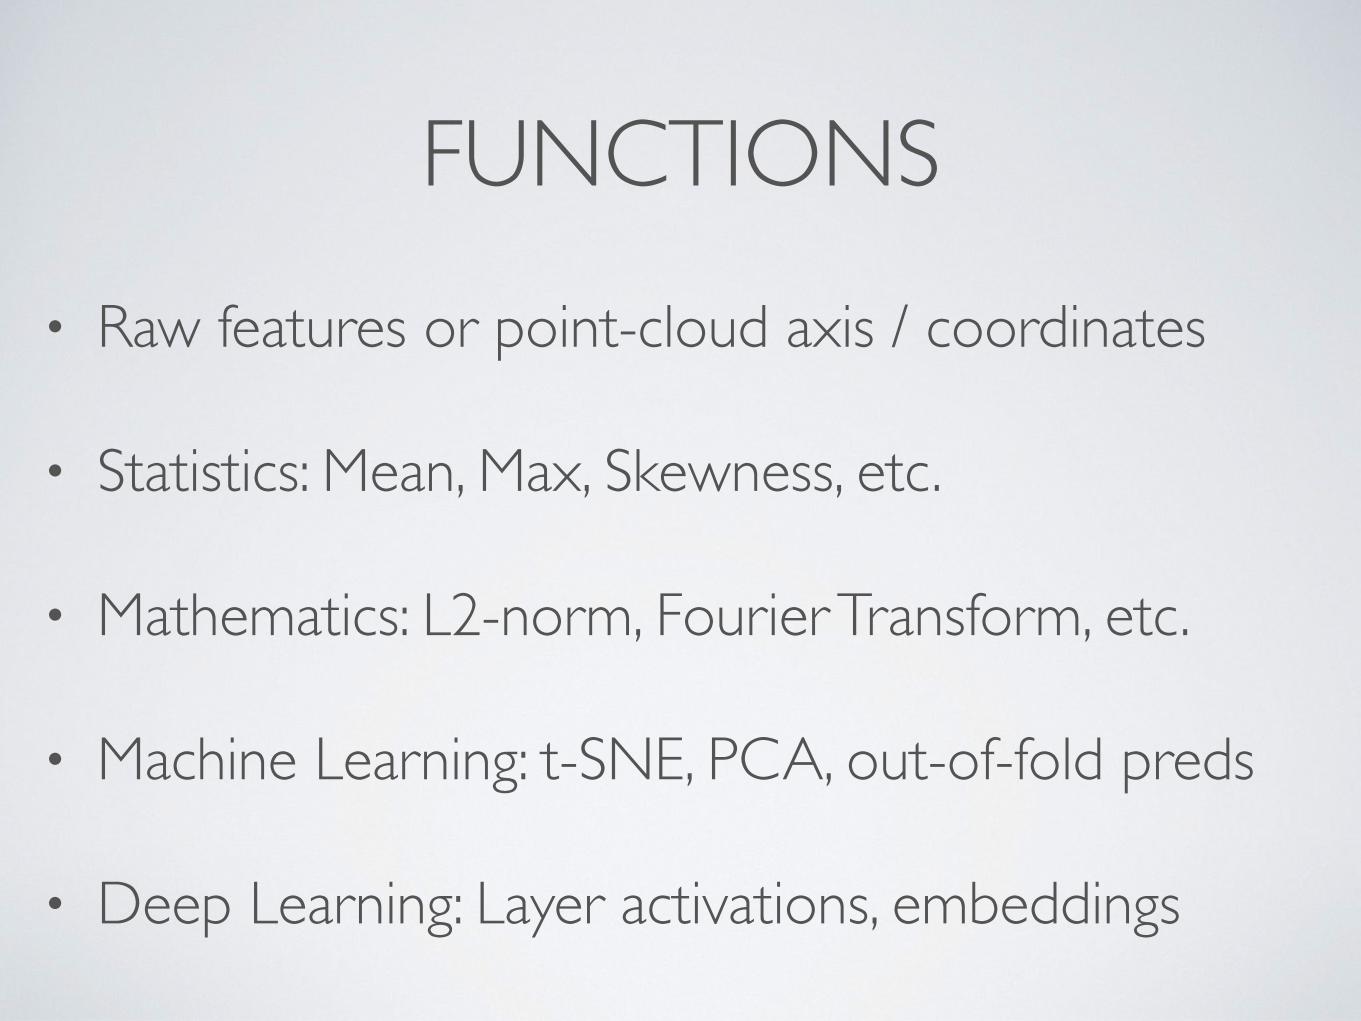
FUNCTIONS• Raw features or point-cloud axis / coordinates
• Statistics: Mean, Max, Skewness, etc.
• Mathematics: L2-norm, Fourier Transform, etc.
• Machine Learning: t-SNE, PCA, out-of-fold preds
• Deep Learning: Layer activations, embeddings
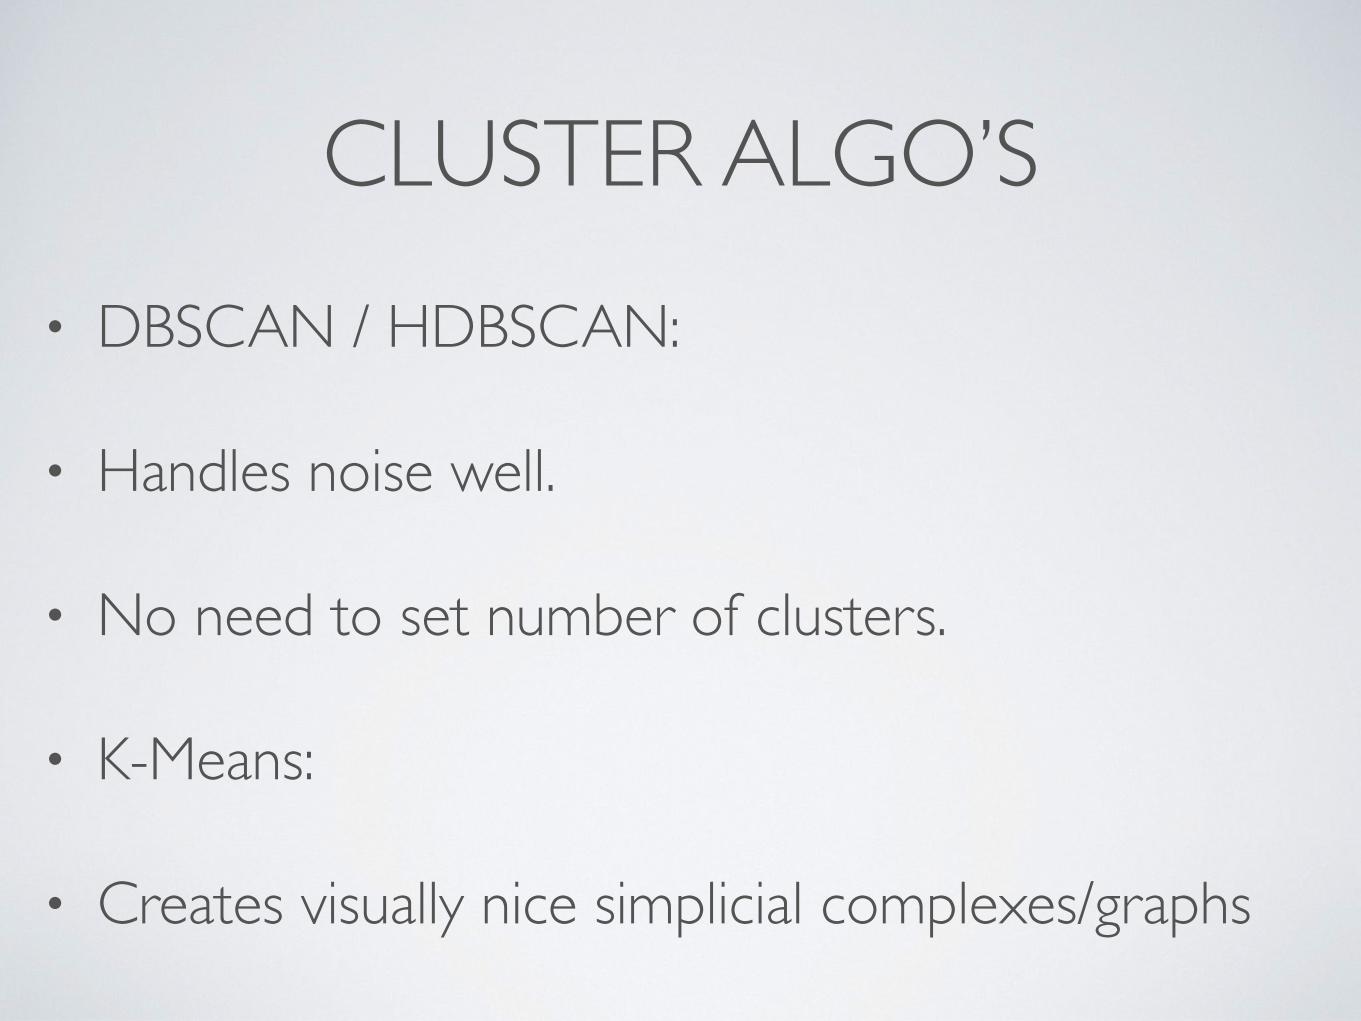
CLUSTER ALGO’S• DBSCAN / HDBSCAN:
• Handles noise well.
• No need to set number of clusters.
• K-Means:
• Creates visually nice simplicial complexes/graphs
SOME GENERAL USE CASES
• Computer Vision
• Model and feature inspection
• Computational Biology / Healthcare
• Persistent Homology
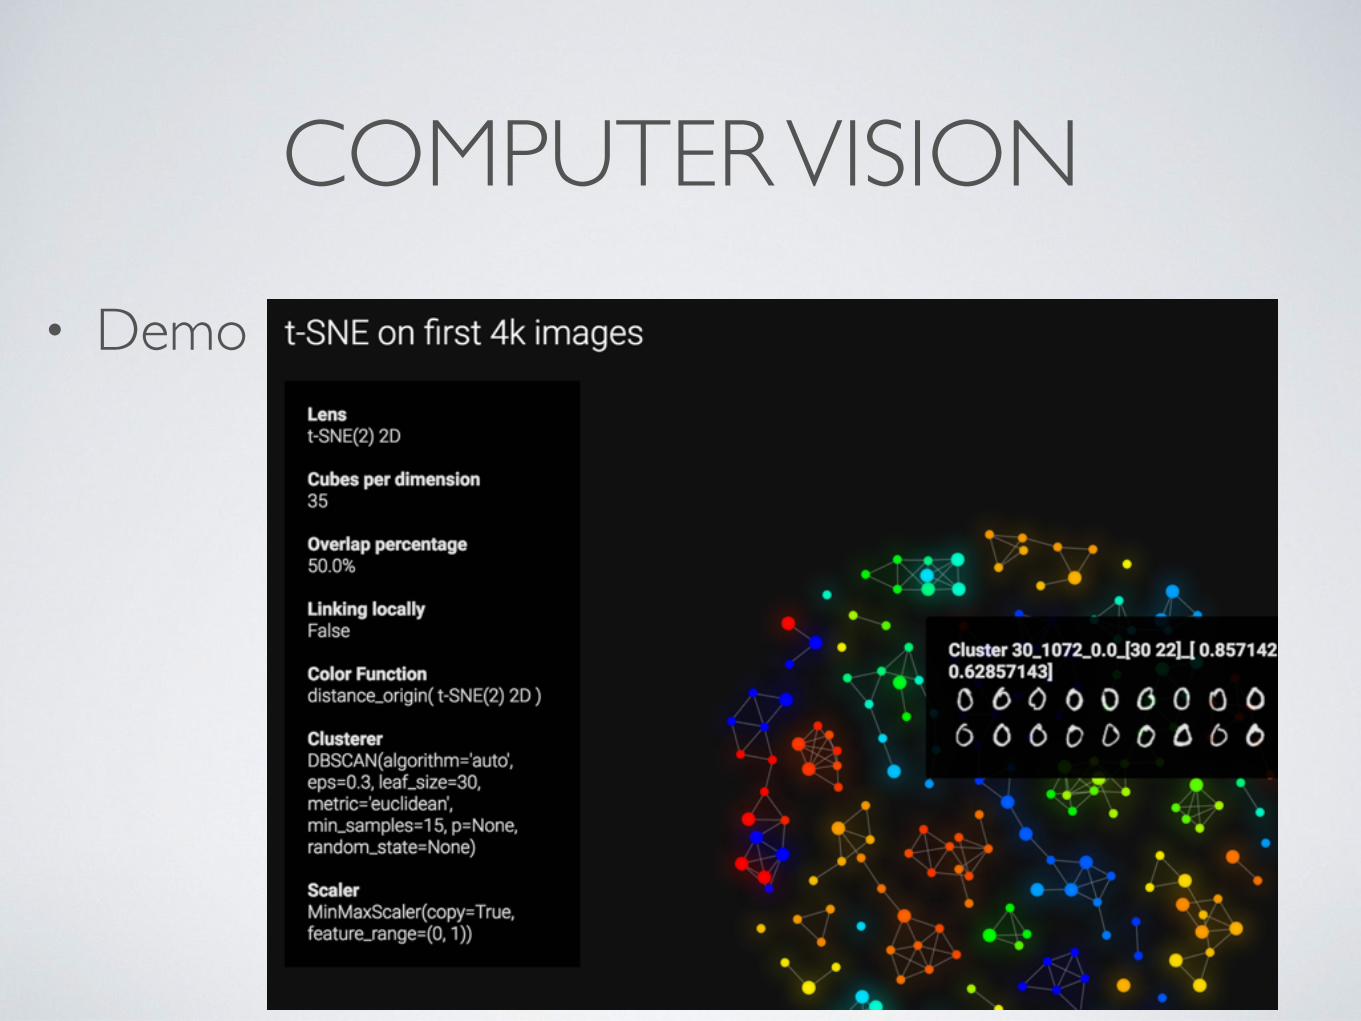
COMPUTER VISION• Demo
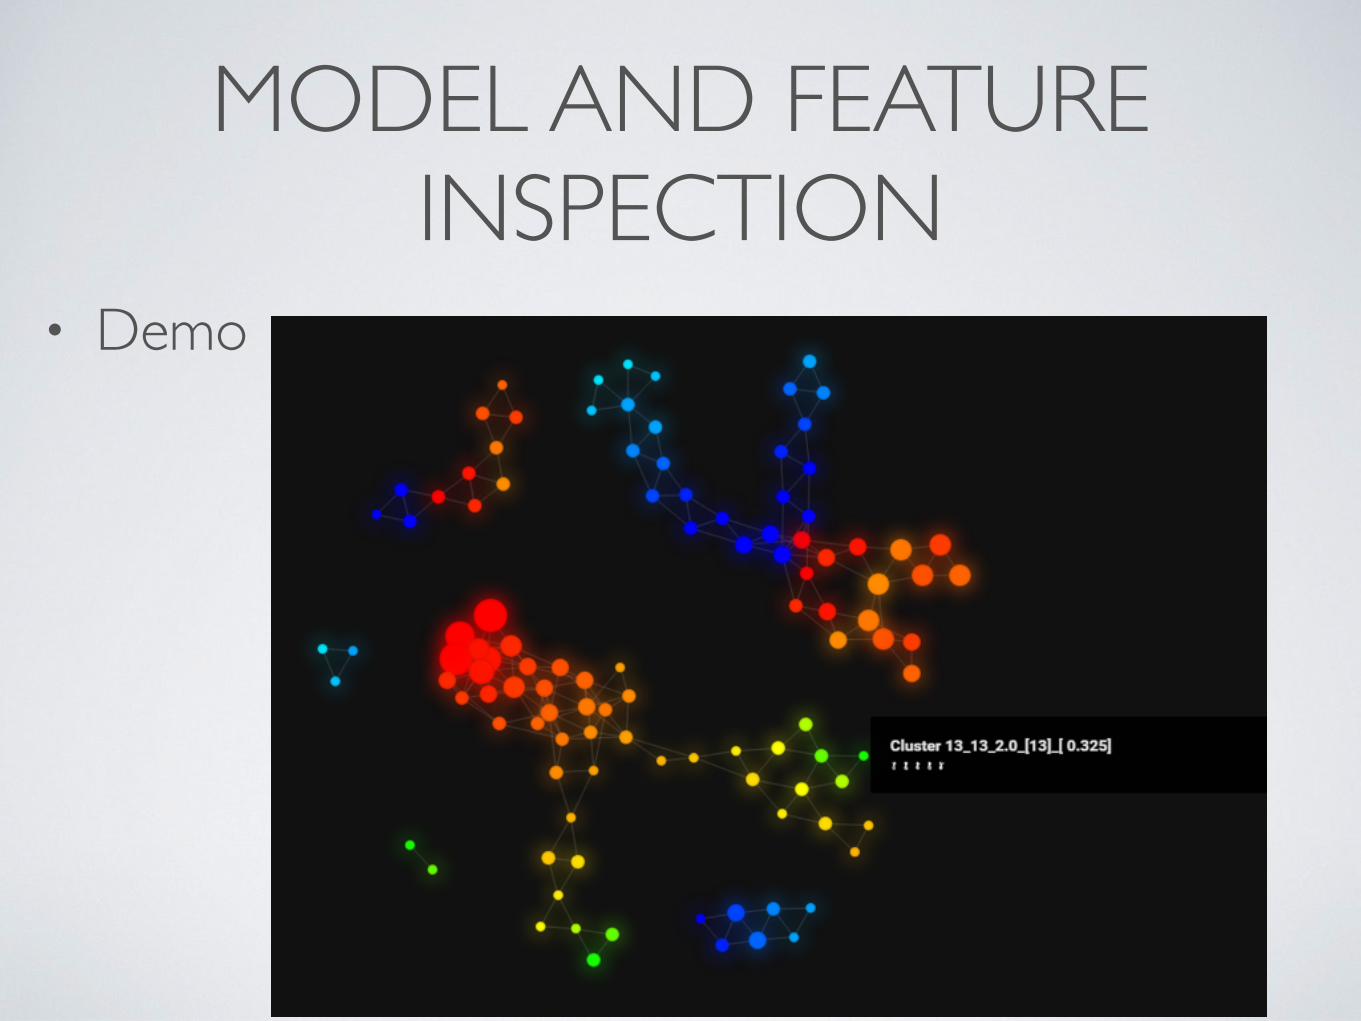
MODEL AND FEATURE INSPECTION
• Demo
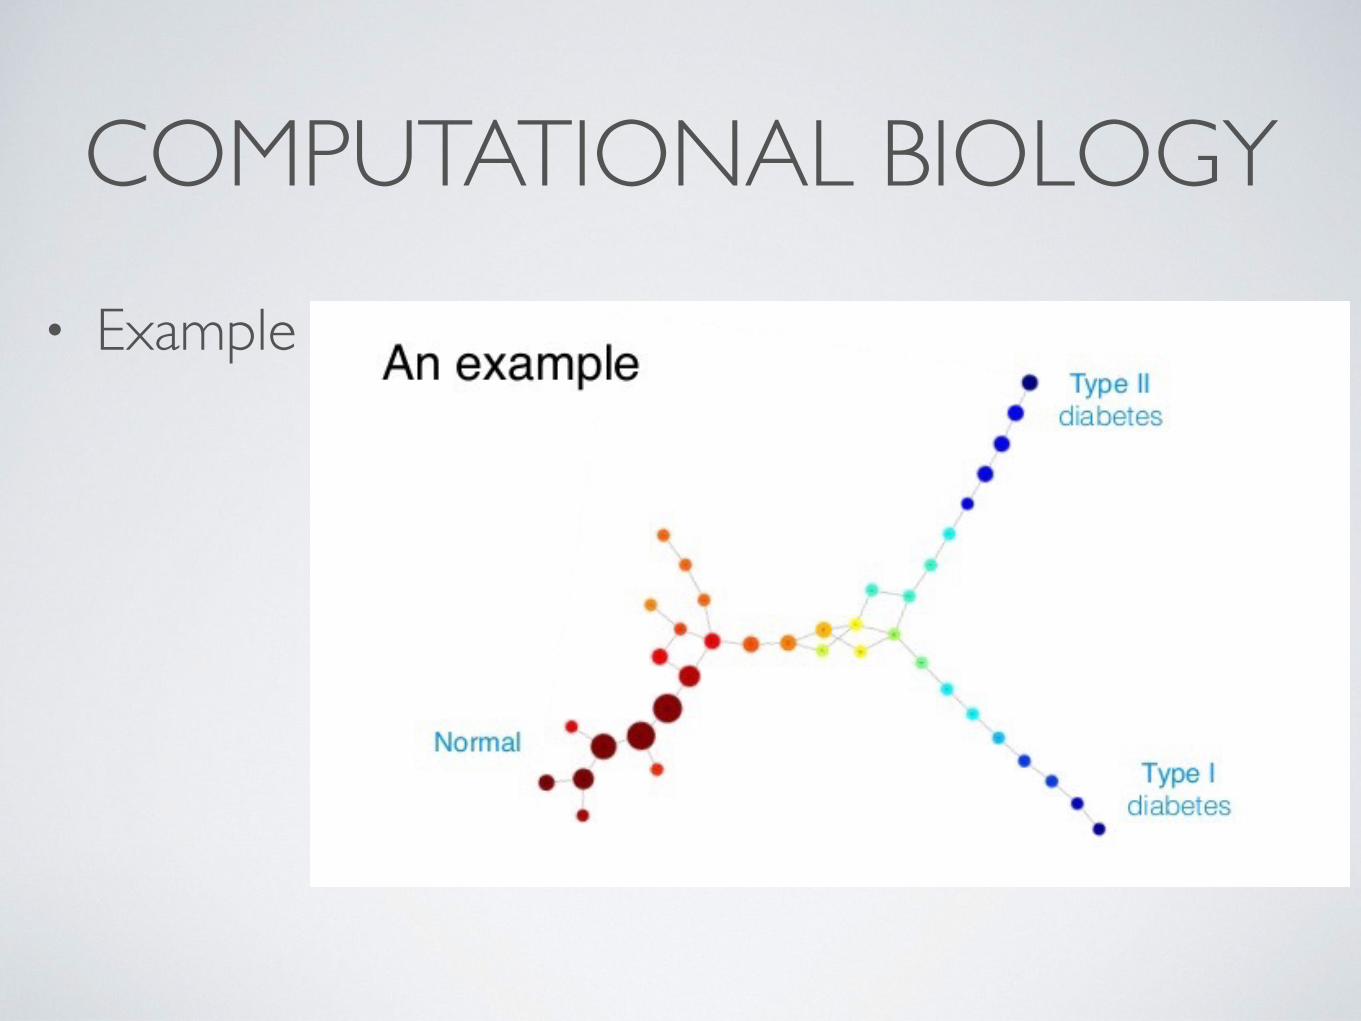
COMPUTATIONAL BIOLOGY• Example
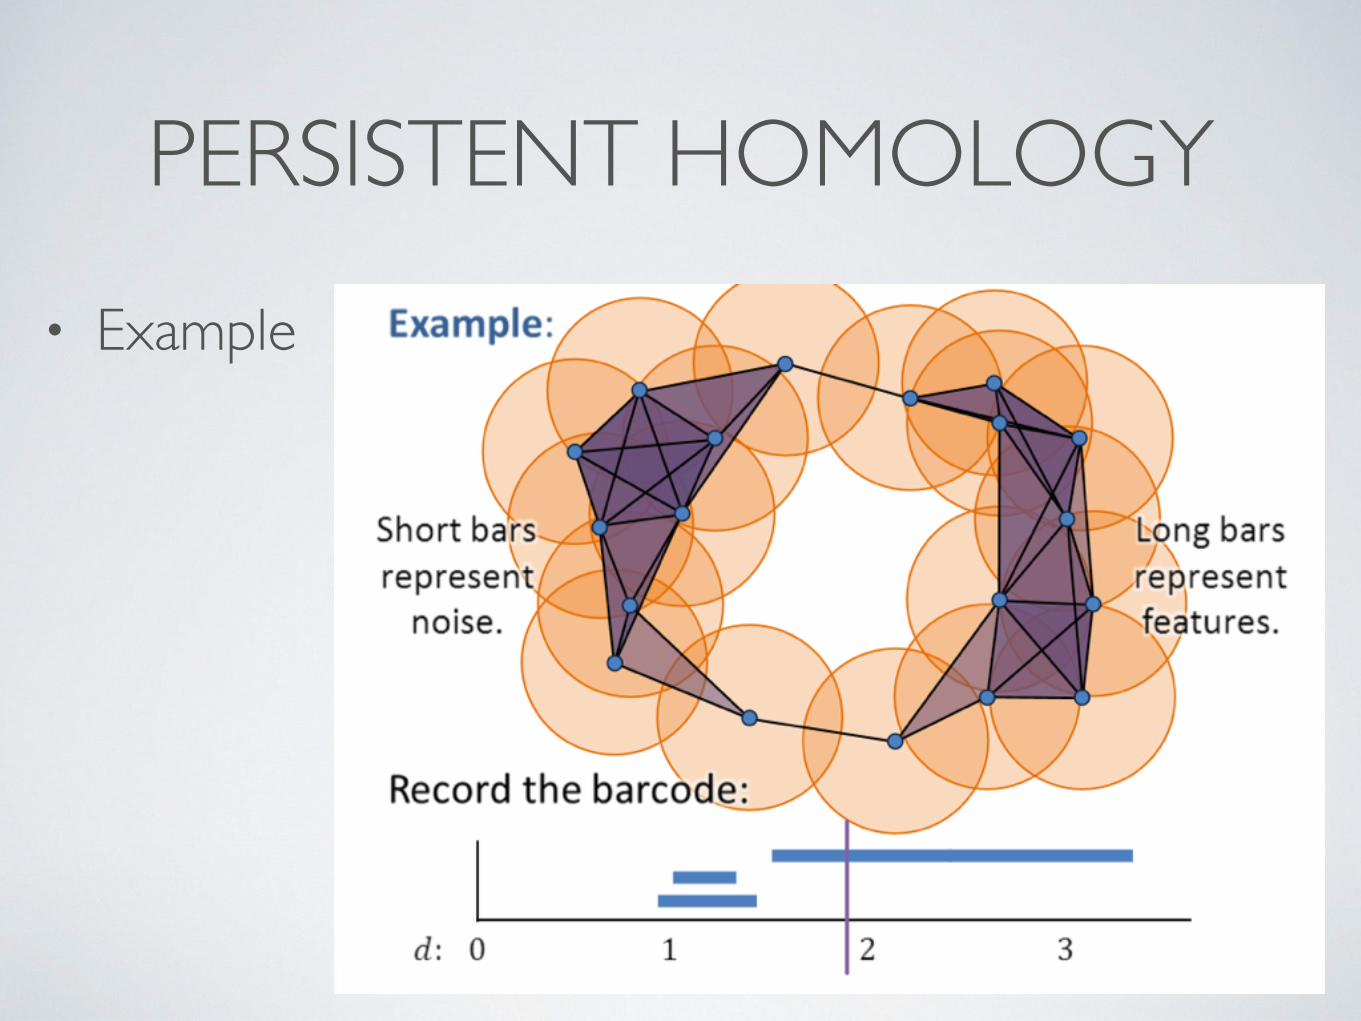
PERSISTENT HOMOLOGY• Example
SOME FINANCE USE CASES
• Customer Segmentation
• Transactional Fraud
• Accurate Interpretable Models
• Exploration / Analysis
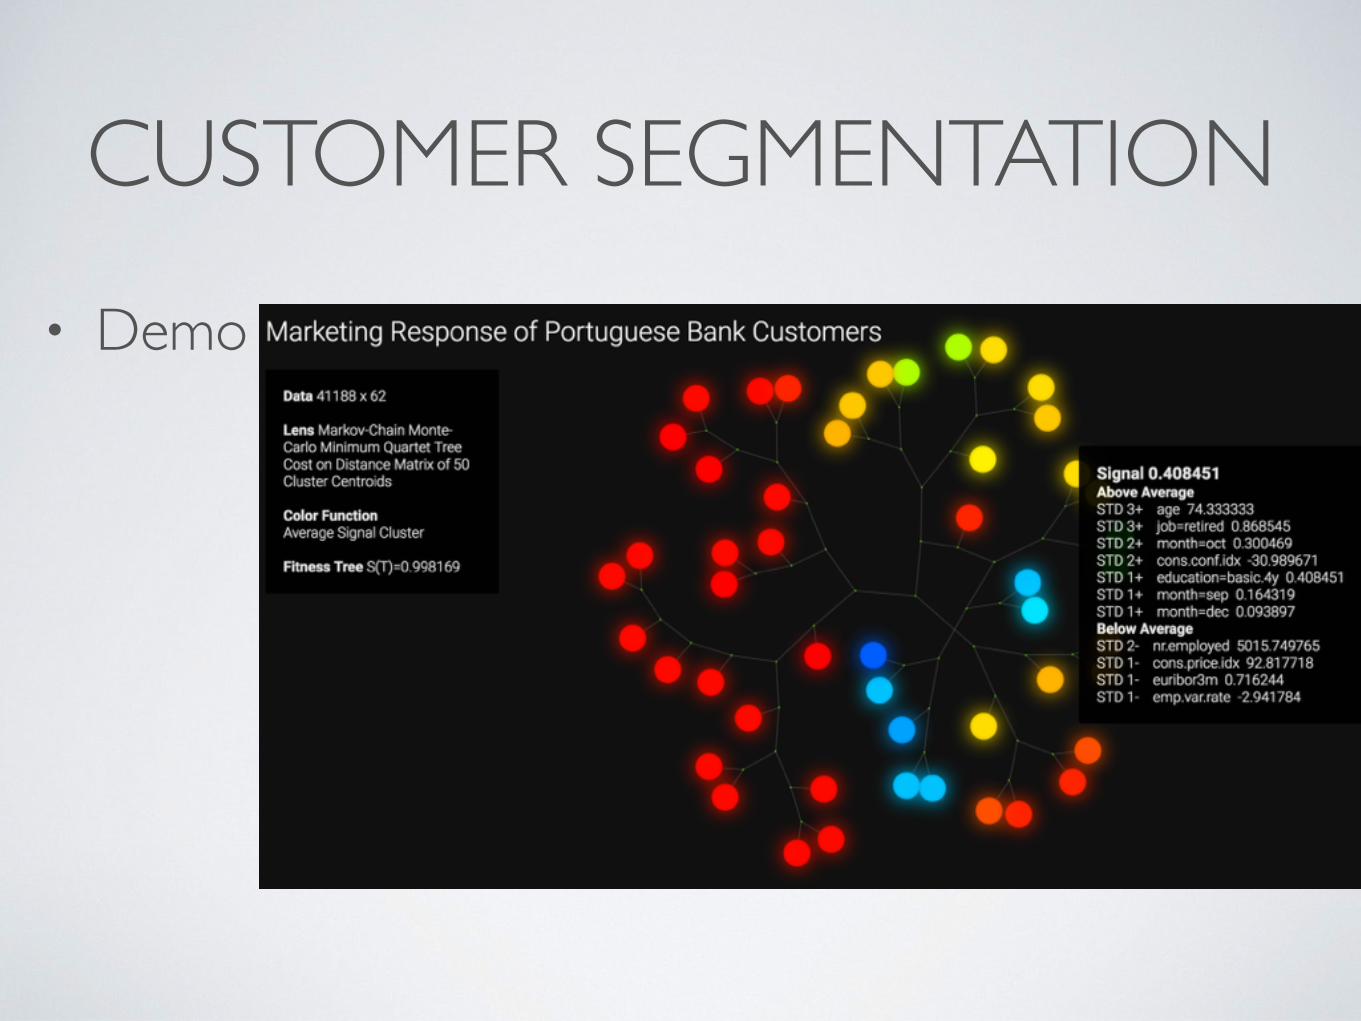
CUSTOMER SEGMENTATION• Demo
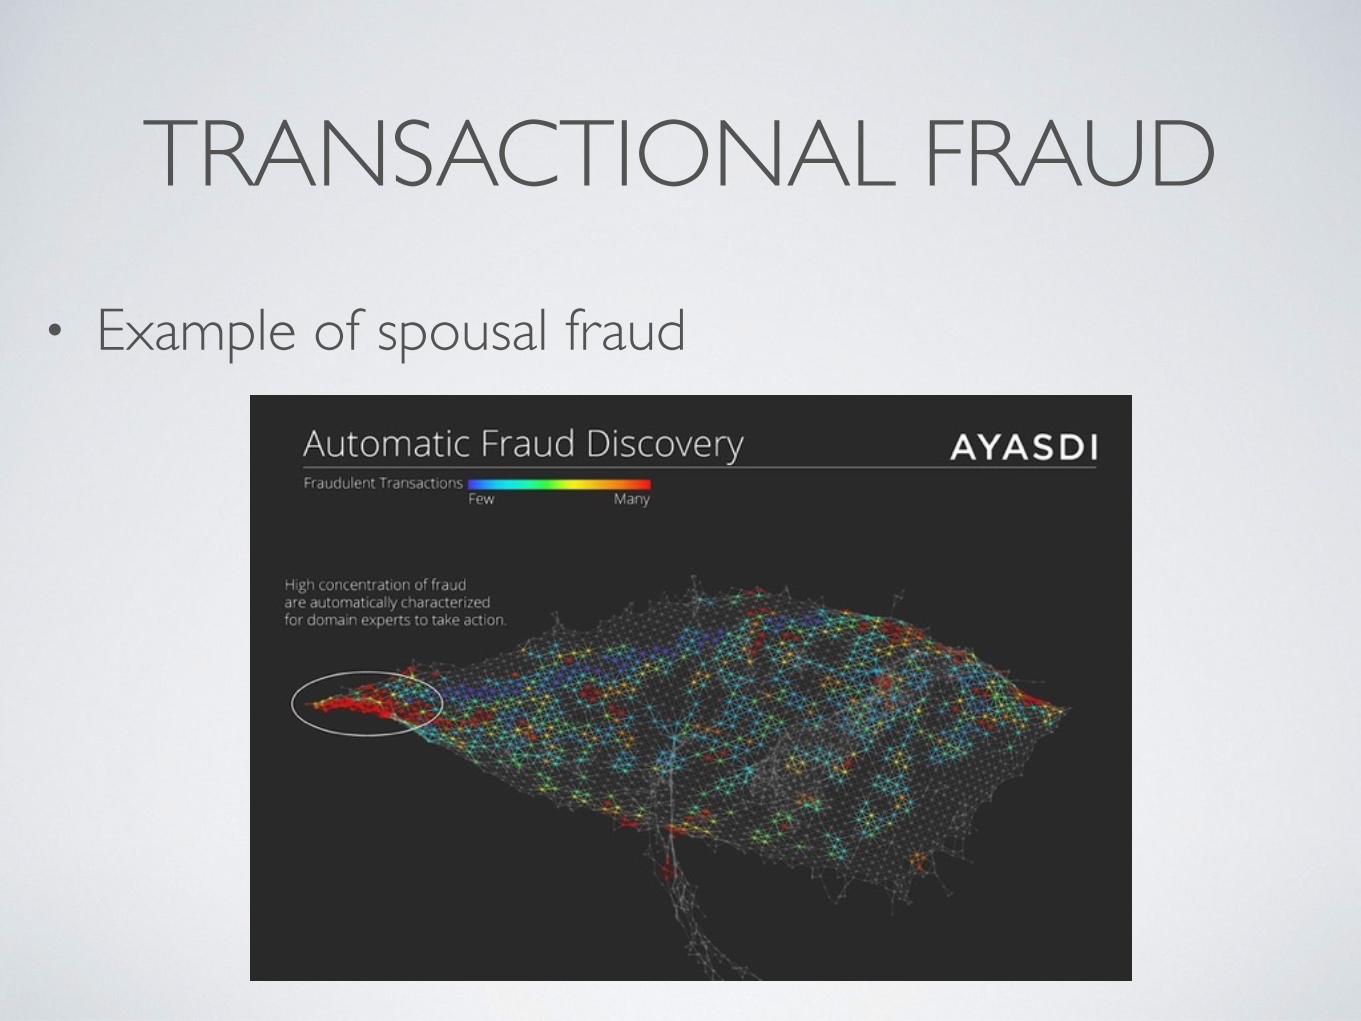
TRANSACTIONAL FRAUD• Example of spousal fraud
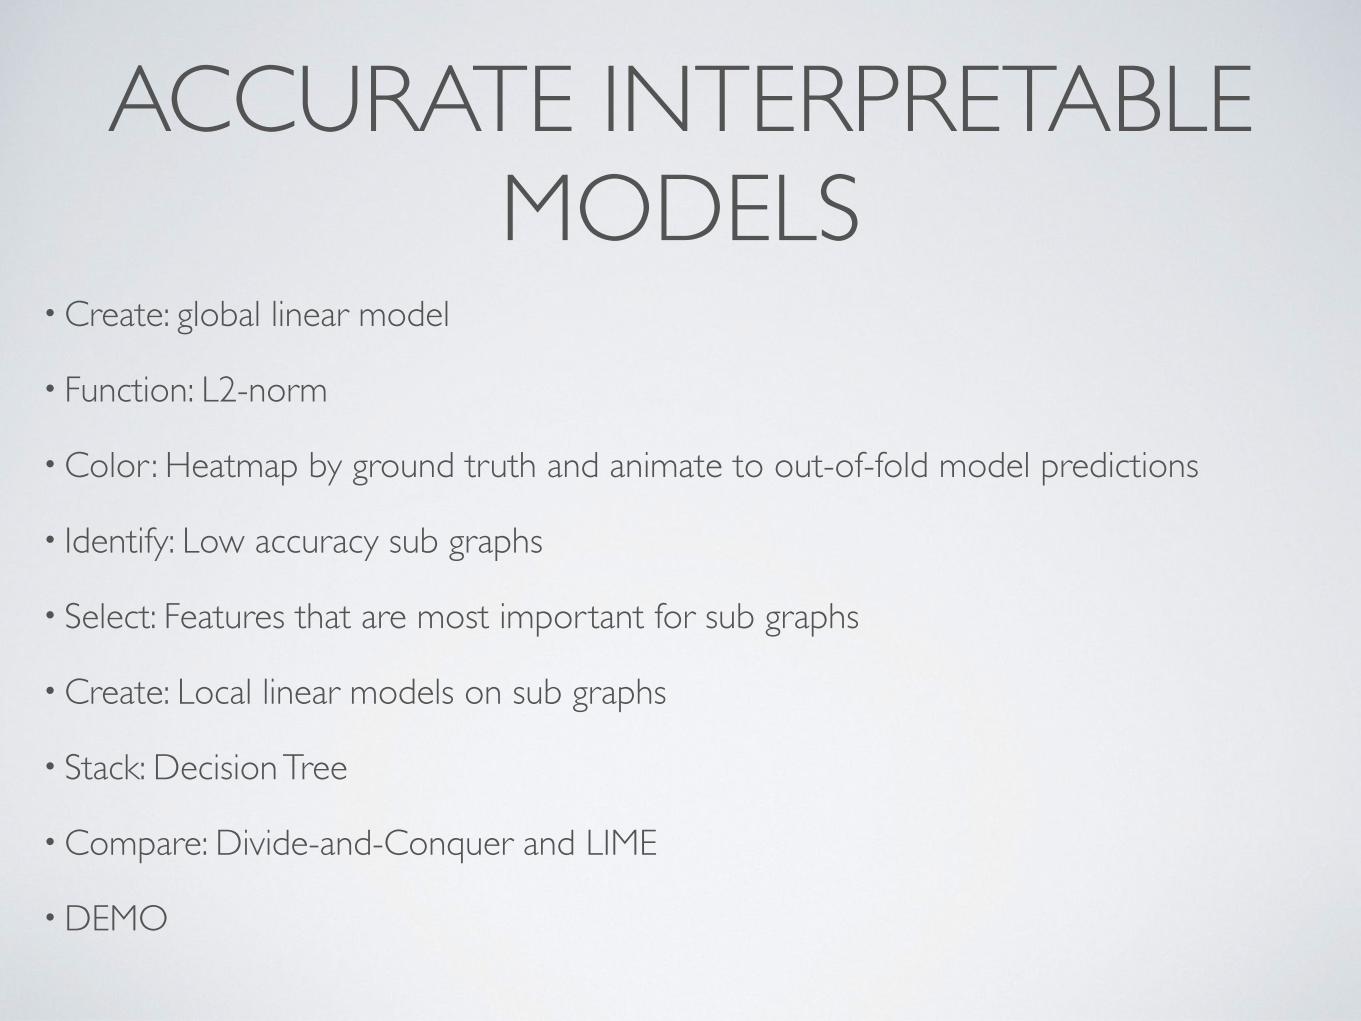
ACCURATE INTERPRETABLE MODELS
• Create: global linear model
• Function: L2-norm
• Color: Heatmap by ground truth and animate to out-of-fold model predictions
• Identify: Low accuracy sub graphs
• Select: Features that are most important for sub graphs
• Create: Local linear models on sub graphs
• Stack: Decision Tree
• Compare: Divide-and-Conquer and LIME
• DEMO
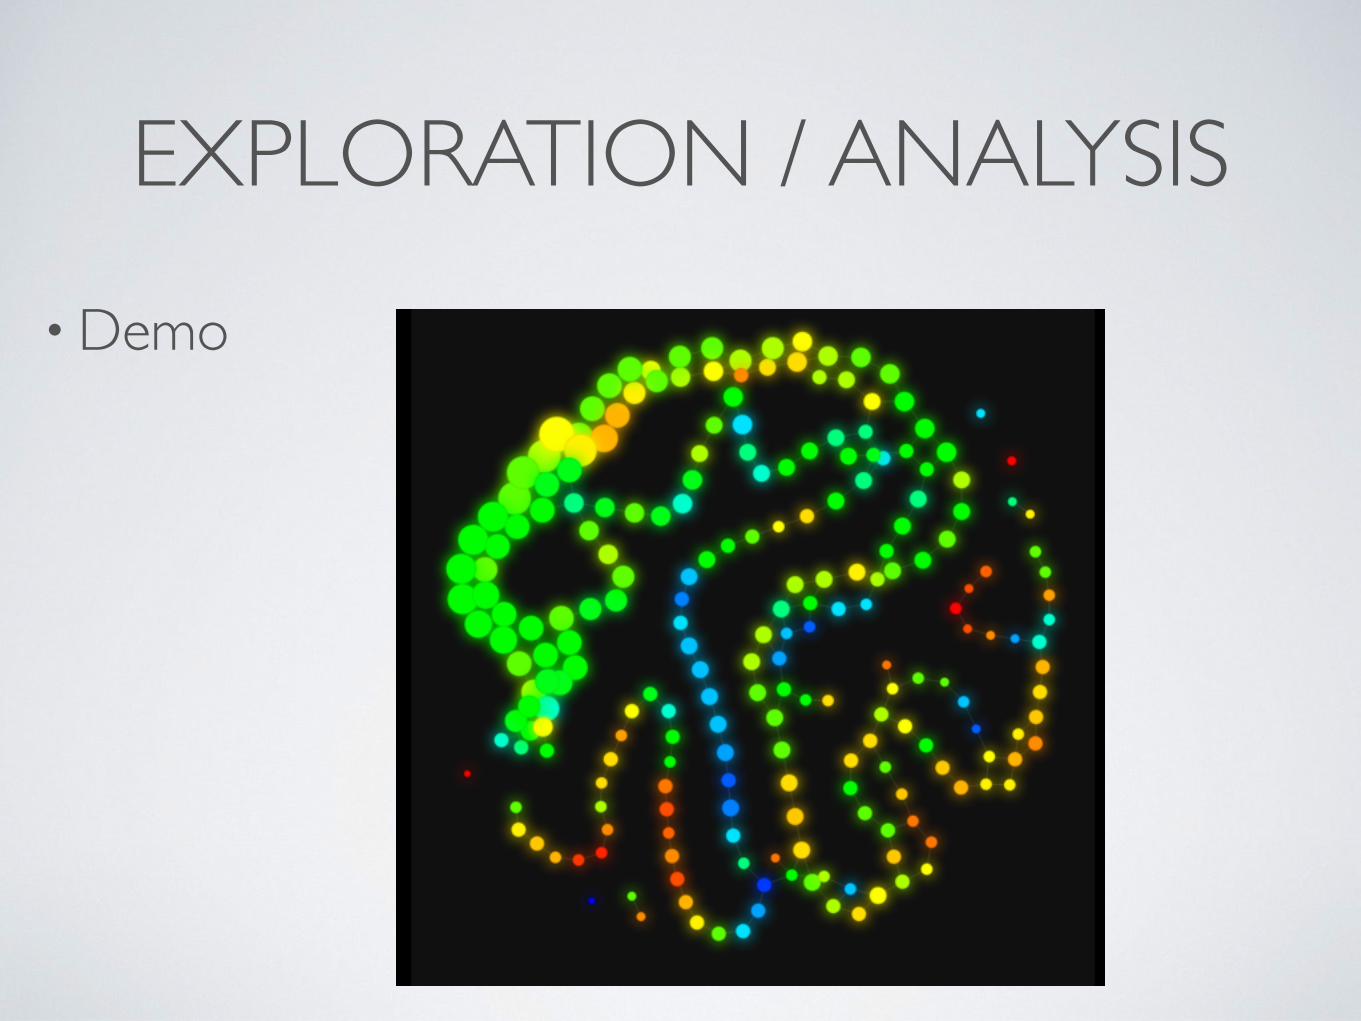
EXPLORATION / ANALYSIS• Demo
QUESTIONS?
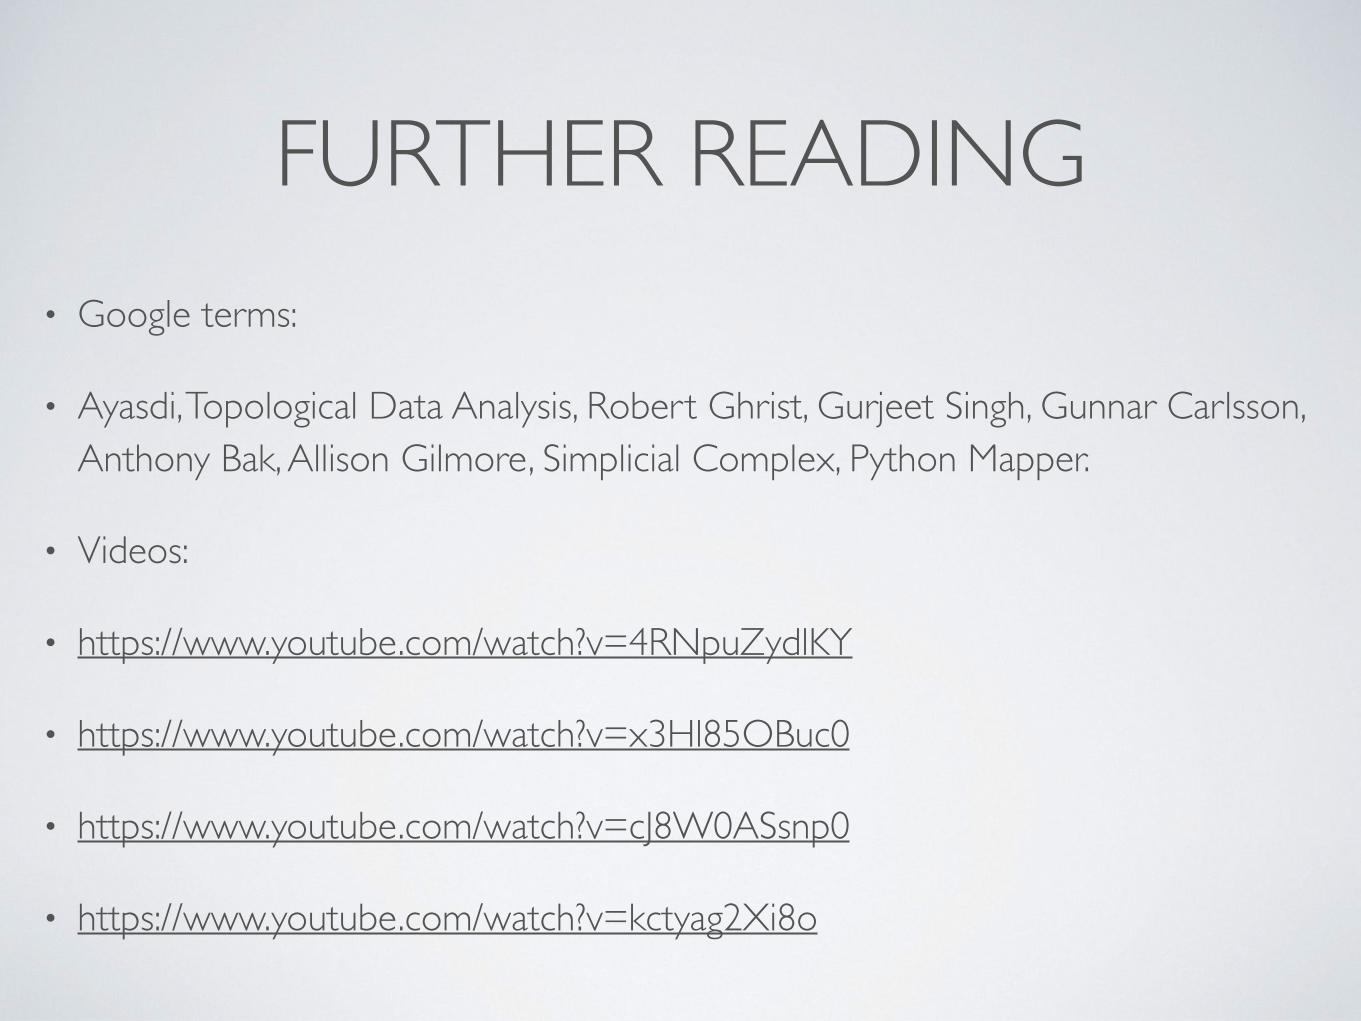
FURTHER READING• Google terms:
• Ayasdi, Topological Data Analysis, Robert Ghrist, Gurjeet Singh, Gunnar Carlsson, Anthony Bak, Allison Gilmore, Simplicial Complex, Python Mapper.
• Videos:
• https://www.youtube.com/watch?v=4RNpuZydlKY
• https://www.youtube.com/watch?v=x3Hl85OBuc0
• https://www.youtube.com/watch?v=cJ8W0ASsnp0
• https://www.youtube.com/watch?v=kctyag2Xi8o