CHAPTER III THE COMPONENTS OF THE PORK SUPPLY CHAIN … Valu… · multi-stage production and...
50
University of Pretoria etd – Visser, D P (2004) CHAPTER III THE COMPONENTS OF THE PORK SUPPLY CHAIN IN SOUTH AFRICA "The genetic quality of pork is fixed at conception or the breeding level, the value of pork is created and added by the processor, but the brandname is accpeted or rejected at consumer level." - Anonymous, 2002 3.1 INTRODUCTION TO SUPPLY CHAIN MANAGEMENT In simplistic terms a supply chain is... "a series of activities which are concerned with the planning, co-ordination and controlling of materials, and finished goods from the supplier to the customer" (Ganeshan, Jack, Magazine & Stephens, 1999). An effective supply chain is built upon outstanding supplier relations and supplier networks which could (should) eventually become an alliance. In this regard Kotler & Armstrong (1994) indicated that successful companies manage their supply chain through (i) an effective information system, (ii) strong relations with their partners in the value chain and (iii) a close and loyal relationship with their ultimate customers. According to Shapiro (2001) successful supply chain management is a function of integrated planning. Cespedes (1994) indicates that optimization of the supply chain necessitates a closer relationship with fewer supply sources. Various definitions have been formulated to best describe supply chain management. Chen (1999) defines supply chain management as the management of materials, and information in multi-stage production and distribution networks, whilst Anupind & Bassok (1999) indicate that supply chain management is indeed variety orientated, since aspects such as product design, production, outsourcing (or third party logistics), incentives, performance measures and also multi- location inventory control are involved. According to Tsay, Nahimas & Agrawal (1999), supply chain management will take into consideration the number of suppliers, distributors and retailers - thus the topology of the system. Stevens (1989), as quoted by Ganeshan, Jack, Magazine & Stephens (1999), defined the supply chain as follows: "A connected series of activities with the strategic co-ordination of materials, products and finished goods from the supplier to the consumer. It is also concerned with two distinct flows (material and information) through the organization or industry". A general supply chain structure, where the manufacturer produces a typical product and a retailer whose intention it is to serve market demand, is given in Figure 3.1. 44
Transcript of CHAPTER III THE COMPONENTS OF THE PORK SUPPLY CHAIN … Valu… · multi-stage production and...
UUnniivveerrssiittyy ooff PPrreettoorriiaa eettdd –– VViisssseerr,, DD PP ((22000044))
CHAPTER III
THE COMPONENTS OF THE PORK
SUPPLY CHAIN IN SOUTH AFRICA
"The genetic quality of pork is fixed at conception or the breeding level, the value of pork
is created and added by the processor, but the brandname is accpeted or
rejected at consumer level."
- Anonymous, 2002
3.1 INTRODUCTION TO SUPPLY CHAIN MANAGEMENT
In simplistic terms a supply chain is... "a series of activities which are concerned with the
planning, co-ordination and controlling of materials, and finished goods from the supplier to the
customer" (Ganeshan, Jack, Magazine & Stephens, 1999). An effective supply chain is built upon
outstanding supplier relations and supplier networks which could (should) eventually become an
alliance. In this regard Kotler & Armstrong (1994) indicated that successful companies manage
their supply chain through (i) an effective information system, (ii) strong relations with their
partners in the value chain and (iii) a close and loyal relationship with their ultimate customers.
According to Shapiro (2001) successful supply chain management is a function of integrated
planning. Cespedes (1994) indicates that optimization of the supply chain necessitates a closer
relationship with fewer supply sources.
Various definitions have been formulated to best describe supply chain management. Chen
(1999) defines supply chain management as the management of materials, and information in
multi-stage production and distribution networks, whilst Anupind & Bassok (1999) indicate that
supply chain management is indeed variety orientated, since aspects such as product design,
production, outsourcing (or third party logistics), incentives, performance measures and also multi-
location inventory control are involved. According to Tsay, Nahimas & Agrawal (1999), supply
chain management will take into consideration the number of suppliers, distributors and retailers -
thus the topology of the system. Stevens (1989), as quoted by Ganeshan, Jack, Magazine &
Stephens (1999), defined the supply chain as follows: "A connected series of activities with the
strategic co-ordination of materials, products and finished goods from the supplier to the
consumer. It is also concerned with two distinct flows (material and information) through the
organization or industry". A general supply chain structure, where the manufacturer produces a
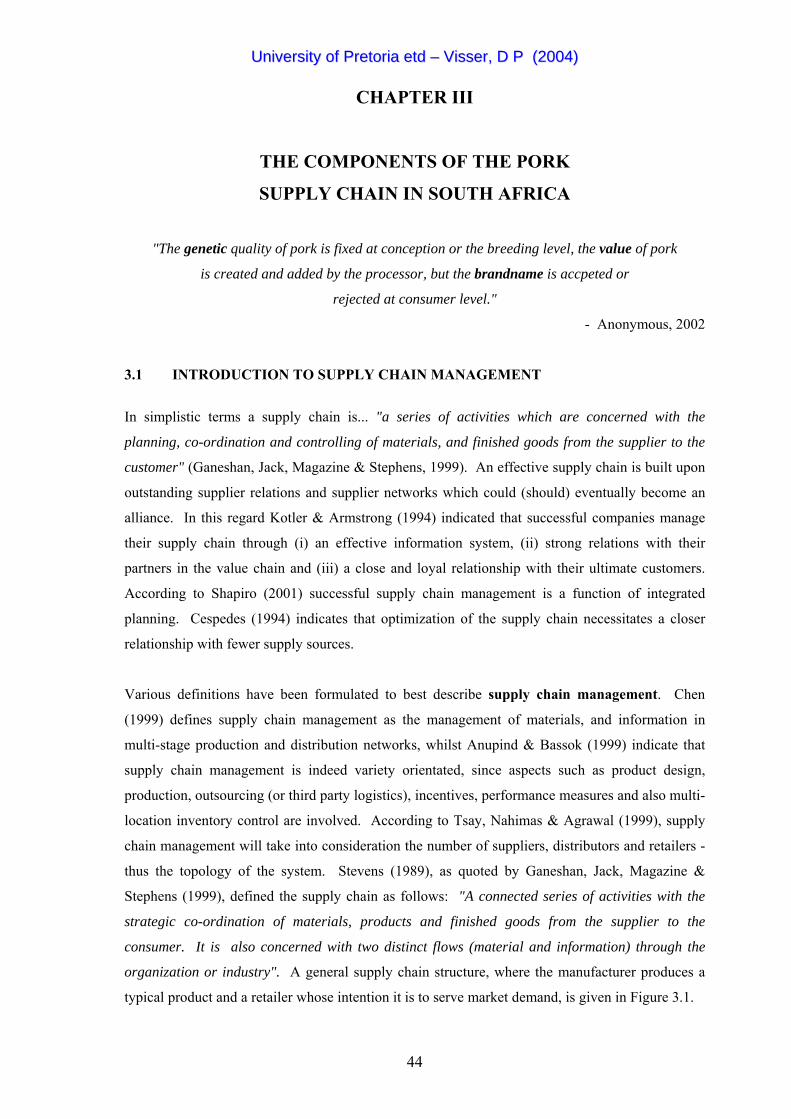
typical product and a retailer whose intention it is to serve market demand, is given in Figure 3.1.
44
UUnniivveerrssiittyy ooff PPrreettoorriiaa eettdd –– VViisssseerr,, DD PP ((22000044))
c
c : production cost
W(Q) : wholesale payment* MANUF
p : retail price
W(Q) Q Q D(p) : market demand
Q : retailer's order
p min [Q, D(p)] D(p)
ACTURER
RETAILER Funds Material Information
Fig 3.1 Simplified structure of a general supply chain (Tsay, Nahimas & Agrawal, 1999)
* The manufacturer manufactures the product at a constant unit cost of c and charges the retailer a wholesale payment
[W(Q)] for Q units. WQ can either be exogenous or under control of one of the parties.
Modern supply chains have become primarily dependant upon optimal information sharing
between the value chain partners (Kekre, Mukhopadhyay & Srinivasan, 1999). According to
Ganeshan et al, (1999) a supply chain can be managed either as a single entity or through a system
of partnerships. The former is achieved through dominance (a single entity-cum-dominant
member) and the latter through co-operation and co-ordination.
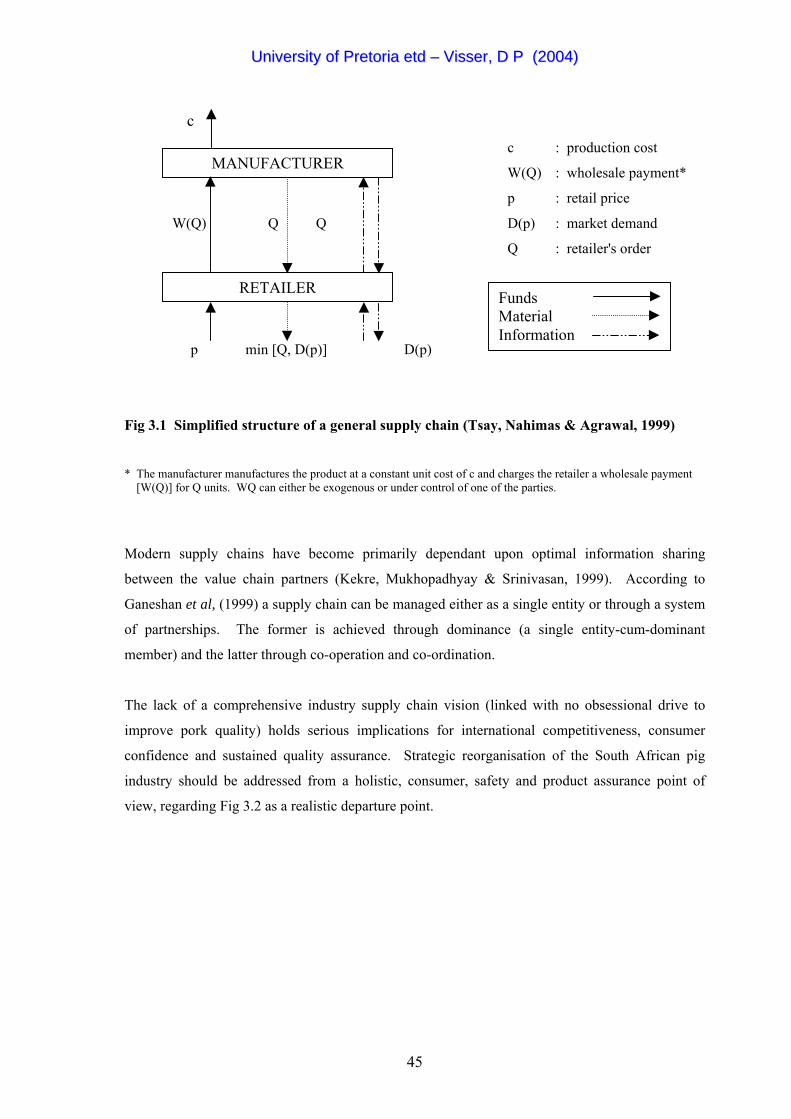
The lack of a comprehensive industry supply chain vision (linked with no obsessional drive to
improve pork quality) holds serious implications for international competitiveness, consumer
confidence and sustained quality assurance. Strategic reorganisation of the South African pig
industry should be addressed from a holistic, consumer, safety and product assurance point of
view, regarding Fig 3.2 as a realistic departure point.
45
UUnniivveerrssiittyy ooff PPrreettoorriiaa eettdd –– VViisssseerr,, DD PP ((22000044))
POSSIBILITIES CONSUMER
TO IMPROVE PORK CHARACTERISTICS/FACTS PERCEPTION ACCEPTABILITY
PORK CHAIN
Perception Filter
Farming
Castration Pig diet composition Feeding system Housing system End weight
Transport
Fasting out and lairage Stunning and bleeding outChilling technique Electrical stimulation Hanging method Processing Conditioning
PRODUCTION PRODUCT CONSUMPTION
Slaughter
Other Product
Attributes
Nutritional value Fat Fatty Acid ProfileCholesterol Proteins Vitamins Minerals
Leanness
Healthiness
Eating quality: Taste Odour Tenderness Juiciness
• Subjective • Attribute • Perception -3 -2 -1 0 1 2 3 Pork relative to fresh meat substitutes
?Leanness Healthiness Taste Tenderness
Acceptability
Behaviour
Breeding
Selection Stress susceptibility Genotype
Fig 3.2 Possibilities to improve production characteristics, consumer perception and
acceptability of pork (Verbeke, 2001)
From Fig 3.2 it is evident that breeding, farming, feeding and slaughtering are four important
elements in the supply chain and will be discussed accordingly (Vide 3.3 – 3.5). Pork
characteristics (the quest for lean, healthy, safe and tasty pork) and the perception of the consumer
through consumer trends (Vide 2.3) were discussed at length in Chapter II. In the remainder of
this chapter the inherent structure of the South African pig industry will be discussed with the
emphasis on production statistics, the pig feed industry, genetic improvement and pig information
systems, slaughter houses and some slaughtering statistics. In the last part of the chapter (section
3.6) the different industry organisations, institutions and computer programmes in support of the
South African pork supply chain will be discussed.
46
UUnniivveerrssiittyy ooff PPrreettoorriiaa eettdd –– VViisssseerr,, DD PP ((22000044))
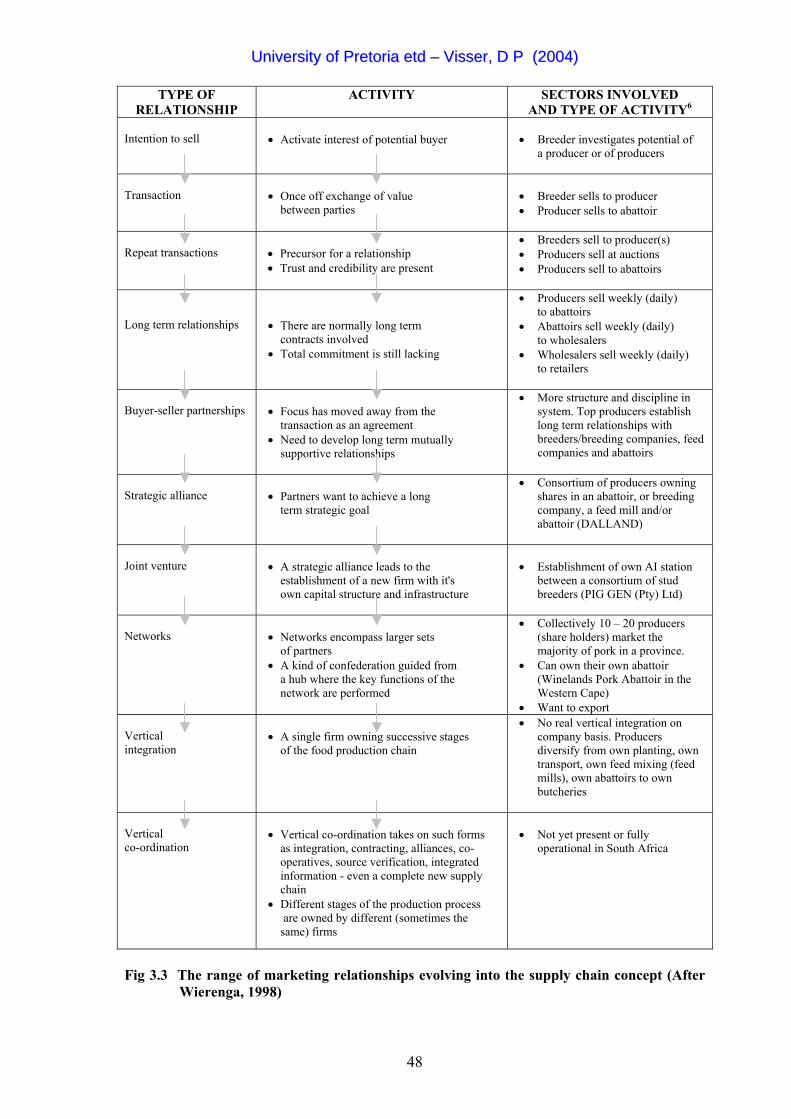
3.2 SYNOPSYS OF MARKETING RELATIONS AND DIAGRAMMATIC EXPLANATION OF THE SOUTH AFRICAN PORK SUPPLY CHAIN
According to Boehlje & Sonka (2001) the industrialization of agriculture and the formation of
tightly alligned supply chains are two of the most structural dimensions pertaining to structural
change in agriculture. A supply chain approach will... "increase the interdependence between the
various stages in the food chain; it will encourage strategic alliances, networks and other linkages
to improve logistics, product flow and information flow". Fig 3.3 explains the proposed range of
marketing relationships and sectors involved and their activity6 in the South African pig industry.
In the agri-food channel, participants as a general rule behave autonomously/individually in the
different stages, demonstrating an adversary rather than co-operative behaviour towards each
other. Solare (2000) indicated that the variability of prices in the French beef and pork supply
chains is a matter of concern, making it very difficult for the two industries to regulate and plan
strategically.
ANNEXTURE XII gives a summary of the 14 largest pig farms/companies in South Africa and the
extent to which they are vertically integrated. Kanhym Estates (in possession of ± 7 500 sows) are
the most advanced since they have their own stud, own AI Station, own feedmill, do their own
mixing and their own planting. Until recently they also had their own transport fleet. They hold a
production contract with Enterprise abattoir. Not one pig company is listed on the Johannesburg
Stock Exchange (JSE) whereas at least two poultry companies, National Chicks and Rainbow
Farms, are listed.
6 Different sectors are involved in the different types of relationships in the South African pork supply chain
47
UUnniivveerrssiittyy ooff PPrreettoorriiaa eettdd –– VViisssseerr,, DD PP ((22000044))
TYPE OF RELATIONSHIP
ACTIVITY SECTORS INVOLVED AND TYPE OF ACTIVITY6
Intention to sell
• Activate interest of potential buyer
• Breeder investigates potential of
a producer or of producers
Transaction
• Once off exchange of value
between parties
• Breeder sells to producer • Producer sells to abattoir
Repeat transactions
• Precursor for a relationship • Trust and credibility are present
• Breeders sell to producer(s) • Producers sell at auctions • Producers sell to abattoirs
Long term relationships
• There are normally long term
contracts involved • Total commitment is still lacking
• Producers sell weekly (daily) to abattoirs
• Abattoirs sell weekly (daily) to wholesalers
• Wholesalers sell weekly (daily) to retailers
Buyer-seller partnerships
• Focus has moved away from the
transaction as an agreement • Need to develop long term mutually
supportive relationships
• More structure and discipline in system. Top producers establish long term relationships with breeders/breeding companies, feed companies and abattoirs
Strategic alliance
• Partners want to achieve a long
term strategic goal
• Consortium of producers owning shares in an abattoir, or breeding company, a feed mill and/or abattoir (DALLAND)
Joint venture
• A strategic alliance leads to the
establishment of a new firm with it's own capital structure and infrastructure
• Establishment of own AI station
between a consortium of stud breeders (PIG GEN (Pty) Ltd)
Networks
• Networks encompass larger sets
of partners • A kind of confederation guided from
a hub where the key functions of the network are performed
• Collectively 10 – 20 producers (share holders) market the majority of pork in a province.
• Can own their own abattoir (Winelands Pork Abattoir in the Western Cape)
• Want to export Vertical integration
• A single firm owning successive stages
of the food production chain
• No real vertical integration on company basis. Producers diversify from own planting, own transport, own feed mixing (feed mills), own abattoirs to own butcheries
Vertical co-ordination
• Vertical co-ordination takes on such forms
as integration, contracting, alliances, co-operatives, source verification, integrated information - even a complete new supply chain
• Different stages of the production process are owned by different (sometimes the same) firms
• Not yet present or fully
operational in South Africa
Fig 3.3 The range of marketing relationships evolving into the supply chain concept (After Wierenga, 1998)
48
UUnniivveerrssiittyy ooff PPrreettoorriiaa eettdd –– VViisssseerr,, DD PP ((22000044))
3.3 THE STRUCTURE OF THE SOUTH AFRICAN PIG INDUSTRY
The origin of the South African pig industry can be traced back to 1652 when Jan van Riebeeck7
brought some pigs with him to the Cape of Good Hope (Naude and Visser, 1994). This humble
beginning of the early South African pig industry at the Cape of Good Hope has developed into a
national industry over the last 350 years. The industry applies modern technology, science, a free
market approach and has established itself as a dynamic component of the agricultural sector8.
The pork industry has evolved into a spatial and economic (important) industry with a gross
producer value of ± R1 billion and a gross consumer value of more than R2 billion (Matthis,
1999). According to Meulenberg (1998), the marketing channels for agricultural (food) products
consist of a number of companies. These include studbreeders, breeding companies, feed mixing
companies, pharmaceutical companies, producers, abattoirs, processing plants, traders, wholesalers
and retailers.
3.3.1 Production Statistics
Pig producers are distributed across all nine provinces of South Africa. According to Davies
(2002), 350 producers are in possession of ± 100 000 sows. According to Streicher (2001), 210
pork producers in possession of 71 067 sows, are members of SAPPO (South African Pork
Producers Organisation). SAPPO represents approximately 65-70 % of all commercial pig
producers. Fig 3.3 gives an indication of the number of commercial pork producers, distributed on
a per province basis.
7 The magic wand, which changed pigs' fortunes so radically was a letter from the Lords Seventeen to Commander Jan
van Riebeeck. They demanded fresh pork when they called at the Cape. According to the letter, Van Riebeeck had
failed to display sufficient zeal in the breeding of pigs. Although more pigs were imported from the island of St
Helena at the end of 1658, only 24 pigs were on the livestock inventory list! Suffice to conclude that his Lords and
Masters had no idea what it takes to breed pigs in Africa! (Porcinarium, 1996).
8 The contribution of animal products to the total gross value of agriculture amounts to R 19.4 billion or 40.5 % thereof.
The percentage contribution of the pig industry to the animal products gross value, is estimated between 4 % (A.A.S,
2001) and 5.2 % (Streicher, 2001). Streicher (2001) is assuming a producer price of R 7.67 per kg, 2 million pigs
slaughtered per annum with an average carcass weight of 65 kg, resulting in a nett producers value of R 997 million
per annum. Thus in conservative monetary terms, the pig industry is estimated to be approximately a one billion Rand
industry.
49
UUnniivveerrssiittyy ooff PPrreettoorriiaa eettdd –– VViisssseerr,, DD PP ((22000044))
EASTERN CAPE
FREE STATE
KWAZULU- TPPA*
NATAL
WESTERN
N=11 (3,7 %)
N=62 (42 %)
N=50 (25 %)
N=67 (20%)
N=20 (10 %)
CAPE
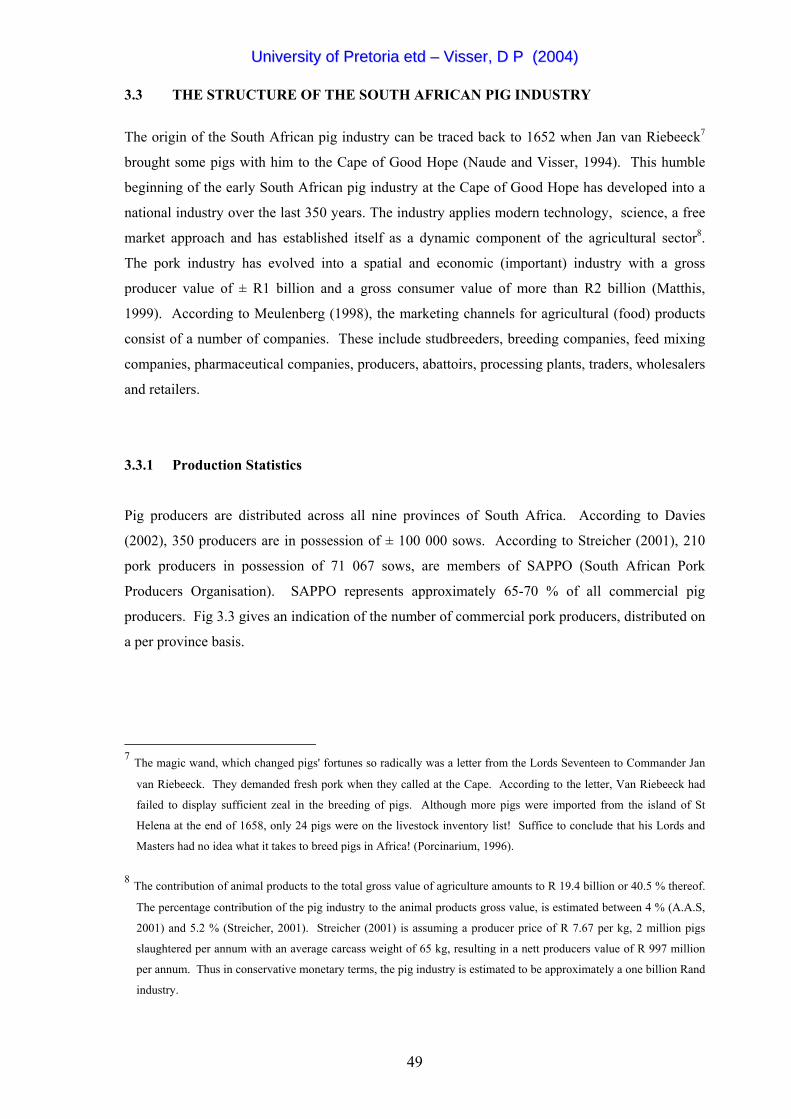
Fig 3.4 Distribution of commercial pork producers on a per province basis (SAPPO, 2001)
(N = Number of producers and % indicates their pro rata contribution)
* TPPA or Transvaal Pork Producers’ Association represents the Northwest Province, Gauteng, the Limpopo Province
and Mpumalanga Province. Producers in these four provinces are in possession of 30 321 sows or 42 % of the
SAPPO active sows. .
From Fig 3.4 it is clear that the concentration of pig production is dominated by the province
previously known as Transvaal, hence TPPA* (Transvaal Pork Producers’ Organisation). More
than 42 % of all the pigs in South Africa are concentrated in a 250 km radius around Pretoria or
the Gauteng province. The second and third most important production-related provinces are the
Western Cape and KwaZulu-Natal, which are in possession of approximately 24 % and 20 % of
the country's pigs respectively [Vide Table 3.1].
50
UUnniivveerrssiittyy ooff PPrreettoorriiaa eettdd –– VViisssseerr,, DD PP ((22000044))
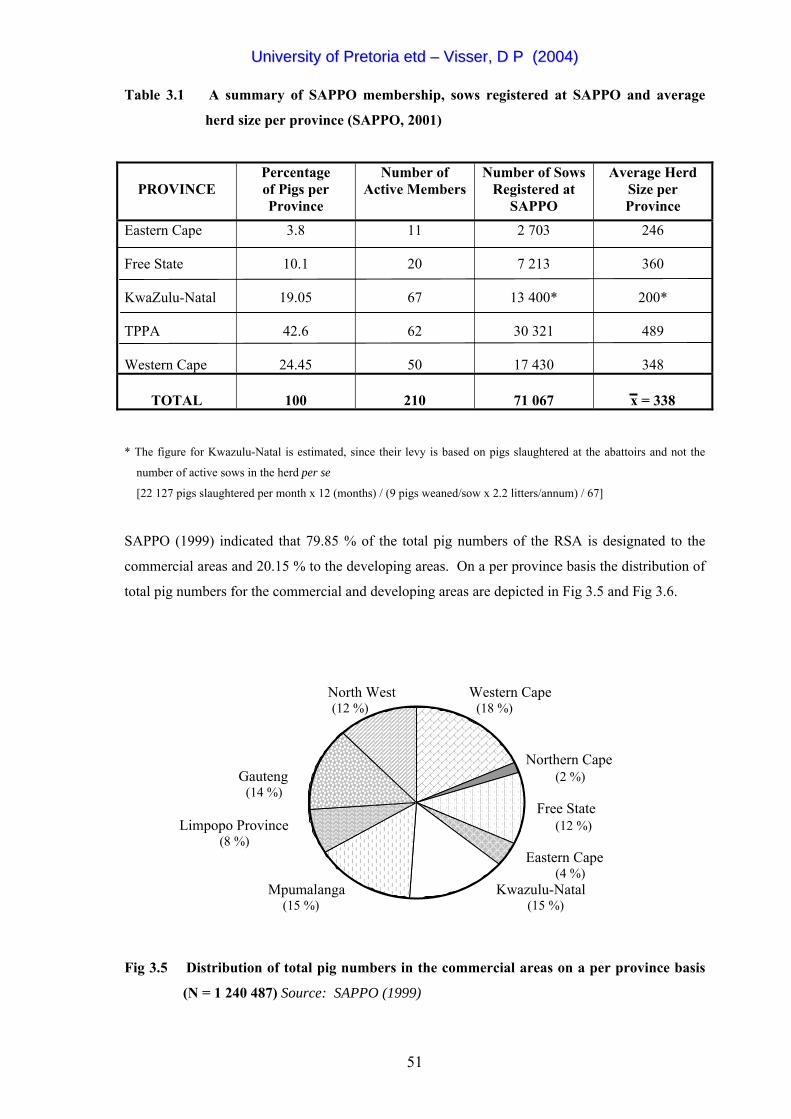
Table 3.1 A summary of SAPPO membership, sows registered at SAPPO and average
herd size per province (SAPPO, 2001)
PROVINCE
Percentage of Pigs per Province
Number of Active Members
Number of Sows Registered at
SAPPO
Average Herd Size per Province
Eastern Cape Free State KwaZulu-Natal TPPA Western Cape
3.8
10.1
19.05
42.6
24.45
11
20
67
62
50
2 703
7 213
13 400*
30 321
17 430
246
360
200*
489
348
TOTAL
100
210
71 067
x = 338
* The figure for Kwazulu-Natal is estimated, since their levy is based on pigs slaughtered at the abattoirs and not the
number of active sows in the herd per se
[22 127 pigs slaughtered per month x 12 (months) / (9 pigs weaned/sow x 2.2 litters/annum) / 67]
SAPPO (1999) indicated that 79.85 % of the total pig numbers of the RSA is designated to the
commercial areas and 20.15 % to the developing areas. On a per province basis the distribution of
total pig numbers for the commercial and developing areas are depicted in Fig 3.5 and Fig 3.6.
North West Western Cape (12 %) (18 %) Northern Cape Gauteng (2 %) (14 %)
Free State Limpopo Province (12 %) (8 %) Eastern Cape (4 %) Mpumalanga Kwazulu-Natal (15 %) (15 %)
Fig 3.5 Distribution of total pig numbers in the commercial areas on a per province basis
(N = 1 240 487) Source: SAPPO (1999)
51
UUnniivveerrssiittyy ooff PPrreettoorriiaa eettdd –– VViisssseerr,, DD PP ((22000044))
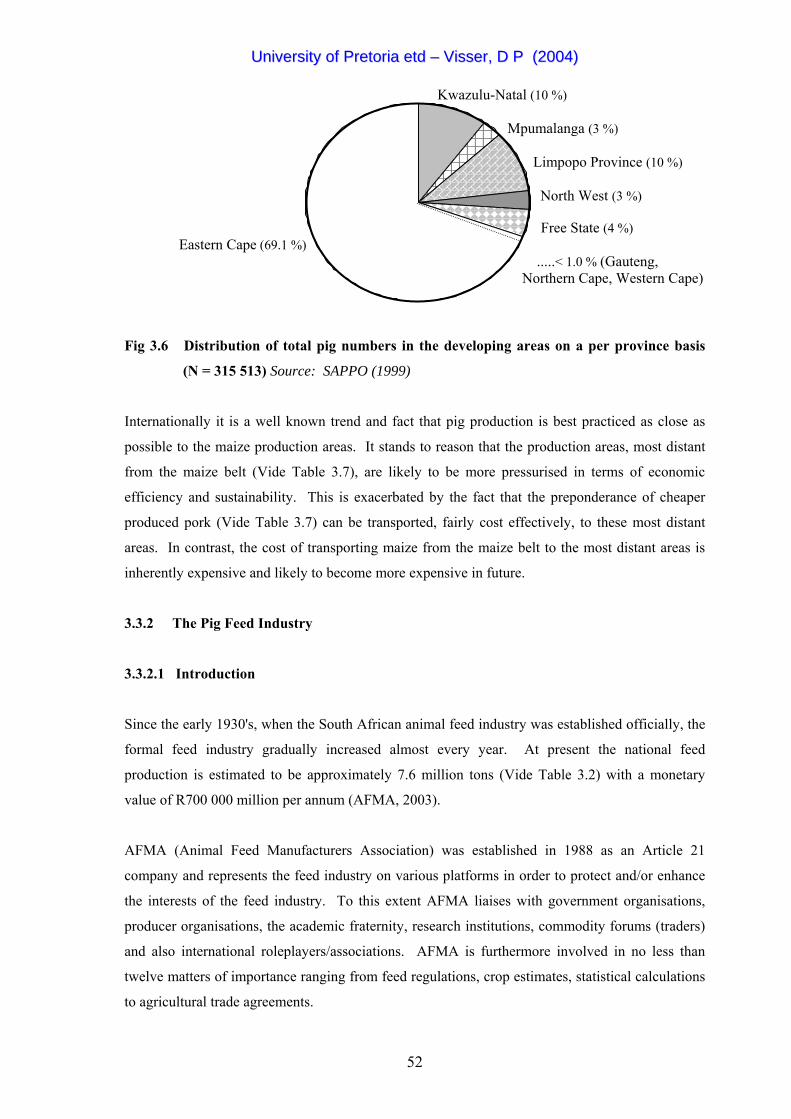
Kwazulu-Natal (10 %) Mpumalanga (3 %) Limpopo Province (10 %) North West (3 %) Free State (4 %) Eastern Cape (69.1 %)
.....< 1.0 % (Gauteng, Northern Cape, Western Cape)
Fig 3.6 Distribution of total pig numbers in the developing areas on a per province basis
(N = 315 513) Source: SAPPO (1999)
Internationally it is a well known trend and fact that pig production is best practiced as close as
possible to the maize production areas. It stands to reason that the production areas, most distant
from the maize belt (Vide Table 3.7), are likely to be more pressurised in terms of economic
efficiency and sustainability. This is exacerbated by the fact that the preponderance of cheaper
produced pork (Vide Table 3.7) can be transported, fairly cost effectively, to these most distant
areas. In contrast, the cost of transporting maize from the maize belt to the most distant areas is
inherently expensive and likely to become more expensive in future.
3.3.2 The Pig Feed Industry
3.3.2.1 Introduction
Since the early 1930's, when the South African animal feed industry was established officially, the
formal feed industry gradually increased almost every year. At present the national feed
production is estimated to be approximately 7.6 million tons (Vide Table 3.2) with a monetary
value of R700 000 million per annum (AFMA, 2003).
AFMA (Animal Feed Manufacturers Association) was established in 1988 as an Article 21
company and represents the feed industry on various platforms in order to protect and/or enhance
the interests of the feed industry. To this extent AFMA liaises with government organisations,
producer organisations, the academic fraternity, research institutions, commodity forums (traders)
and also international roleplayers/associations. AFMA is furthermore involved in no less than
twelve matters of importance ranging from feed regulations, crop estimates, statistical calculations
to agricultural trade agreements.
52
UUnniivveerrssiittyy ooff PPrreettoorriiaa eettdd –– VViisssseerr,, DD PP ((22000044))
3.3.2.2 The Protein and Animal Feed Dilemma
Historically, the traditional influence of nutrition on animal performance has been considered as a
single input-output relationship. However, in modern day pig production, the domain of pig
nutrition (based on home mixing and industrialized mixing) has become more complex.
Cognizance must now be taken of the effects of nutrition on profitability, performance, animal
welfare, environmental pollution, health and meat quality. Improvements in nutritional knowledge
and diet formulation linked with sound stockmanship and management acumen are linked to
improvements in sow productivity and vice versa. Input providers of pig feed however, need to be
constantly aware of external and internal threats that can have a negative effect on their
enterprises. In this regard cognizance should be taken of the Rand/Dollar exchange rate, cyclical
droughts, industrial strikes, labour unrest, internal sabotage and bio-terrorism.
Feed costs contribute to between 70 % to 80 % of the total variable costs in pig production. For
instance, a R50 saving per ton in the growth ration of a 500 sow unit (weaning 22 piglets per sow
per year and a feed conversion ratio of 2, 4 : 1) will mean an annual saving of approximately
R108 000 !
Hence, the South African feed industry will always be subjected to financial scrutiny. The
meticulous financial scrutiny of this industry is as a result of (i) a fluctuation in the annual maize
crop (where maize normally constitute in excess of 65 % of any ration on the typical pig farm) and
(ii) the poor self-sufficiency index (±40 %) of local protein sources. Subsequently the South
African livestock industry is a net importer of fish meal and plant oil cakes. This is aggravated by
the inconsistency of quality of these raw materials. Eckermans (2001) indicated that South
Africa's total demand for animal feed proteins (oil cakes) is 1,063 million metric tons of which 427
041 metric tons (40,16 %) are locally produced. The bulk of animal feed proteins (636 279 metric
tons or 59,84 %) must be imported. These imports are, almost without exception dollar driven,
causing further uncalled pressure on input levels, balance of trade, performance and profitability of
livestock and pig farmers.
3.3.2.3 Feed Production Levels
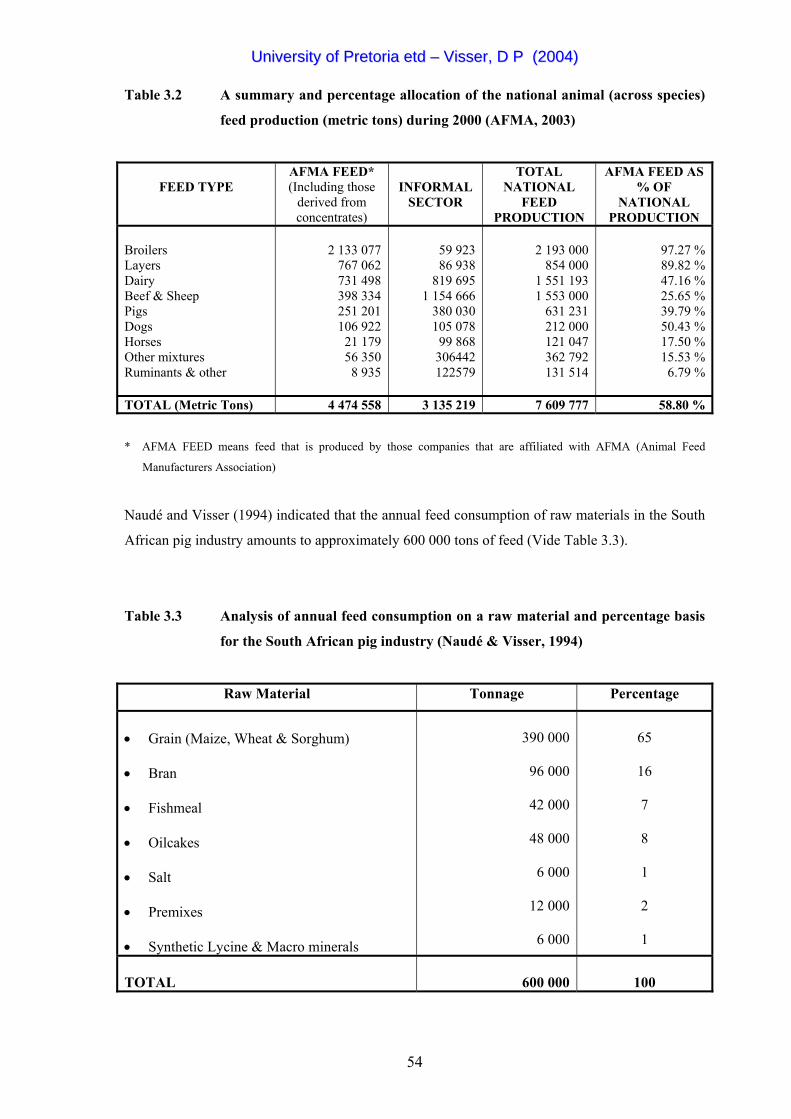
The calculated national feed production for South Africa during 2 000 on a per specie/industry
basis is given in Table 3.2. From this table it is evident that home mixing forms an integral part in
the pig industry. In excess of 60 % of all pig rations is home mixed.
53
UUnniivveerrssiittyy ooff PPrreettoorriiaa eettdd –– VViisssseerr,, DD PP ((22000044))
Table 3.2 A summary and percentage allocation of the national animal (across species)
feed production (metric tons) during 2000 (AFMA, 2003)
FEED TYPE
AFMA FEED* (Including those
derived from concentrates)
INFORMAL
SECTOR
TOTAL NATIONAL
FEED PRODUCTION
AFMA FEED AS % OF
NATIONAL PRODUCTION
Broilers Layers Dairy Beef & Sheep Pigs Dogs Horses Other mixtures Ruminants & other
2 133 077
767 062 731 498 398 334 251 201 106 922
21 179 56 350 8 935
59 923 86 938
819 695 1 154 666
380 030 105 078
99 868 306442 122579
2 193 000
854 000 1 551 193 1 553 000
631 231 212 000 121 047 362 792 131 514
97.27 % 89.82 % 47.16 % 25.65 % 39.79 % 50.43 % 17.50 % 15.53 % 6.79 %
TOTAL (Metric Tons) 4 474 558 3 135 219 7 609 777 58.80 % * AFMA FEED means feed that is produced by those companies that are affiliated with AFMA (Animal Feed
Manufacturers Association)
Naudé and Visser (1994) indicated that the annual feed consumption of raw materials in the South
African pig industry amounts to approximately 600 000 tons of feed (Vide Table 3.3).
Table 3.3 Analysis of annual feed consumption on a raw material and percentage basis
for the South African pig industry (Naudé & Visser, 1994)
Raw Material Tonnage Percentage
• Grain (Maize, Wheat & Sorghum) • Bran • Fishmeal • Oilcakes • Salt • Premixes • Synthetic Lycine & Macro minerals
390 000
96 000
42 000
48 000
6 000
12 000
6 000
65
16
7
8
1
2
1
TOTAL
600 000
100
54
UUnniivveerrssiittyy ooff PPrreettoorriiaa eettdd –– VViisssseerr,, DD PP ((22000044))
3.3.2.3.1 The Mineral and Pre-mix Market
Differences in feed intake is manifested in inequalities and imbalances in the intake of, in
particular, proteins and amino acids (Close & Cole, 2000). A decline in dietary protein and certain
essential amino acids, especially lycine, will impair the onset of puberty in gilts and sows. The
amino acid requirement of the lactating sow is furthermore closely correlated to the composition of
her milk. The comprehensive work on sow and boar nutrition (Close & Cole, 2000) deals with
many topics including minerals, vitamins, amino acids, etc., as well as that of Viljoen (1998).
The total premix market in South Africa is estimated to be in the region of 7,6 million tons per
annum (Fisher, 2002) of which the pig industry represents approximately 7 % or 500 000 tons per
annum. This represents a gross product value of ± R22,5 million per annum, based on an average
premix cost of R45 per ton of feed for the pig industry.
It is to the detriment of the livestock industry that all the vitamins that are used in livestock rations,
including pig rations, are imported (Fisher, 2002). Furthermore, for each of the thirteen vitamins,
a technologically advanced and specialised processing plant is required. Manufacturing of
vitamins is predominantly confined to the United States, Europe, Japan and China.
The manufacturing of pre-mixes9 in South Africa is dominated by three major internationally
renowned companies, namely ROCHE, BASF and NUTEC. Smaller local distributors such as
Feedmix and Coprex are also active in the South African market, but also have international links.
3.3.2.3.2 The Pharmaceutical Industry
The pharmaceutical industry represents an important part of agriculture, the livestock industry and
especially the intensive industries (Vide Table 3.4). Nearly all companies involved in crop
protection and the manufacturing of animal health products are represented by AVCASA. Some
14 animal health companies, all situated in Gauteng, are affiliated to AVCASA. The functions and
responsibilities of these companies are regulated by Act No 36 of 1947 (The Fertilisers, Farm
Feeds, Agricultural Remedies and Stock Remedies Act - Vide 3.6.5). In this regard AVCASA
endeavours to promote the image of the crop protection and animal product industries with due
consideration to human health, animal health and the environment. This is accomplished through
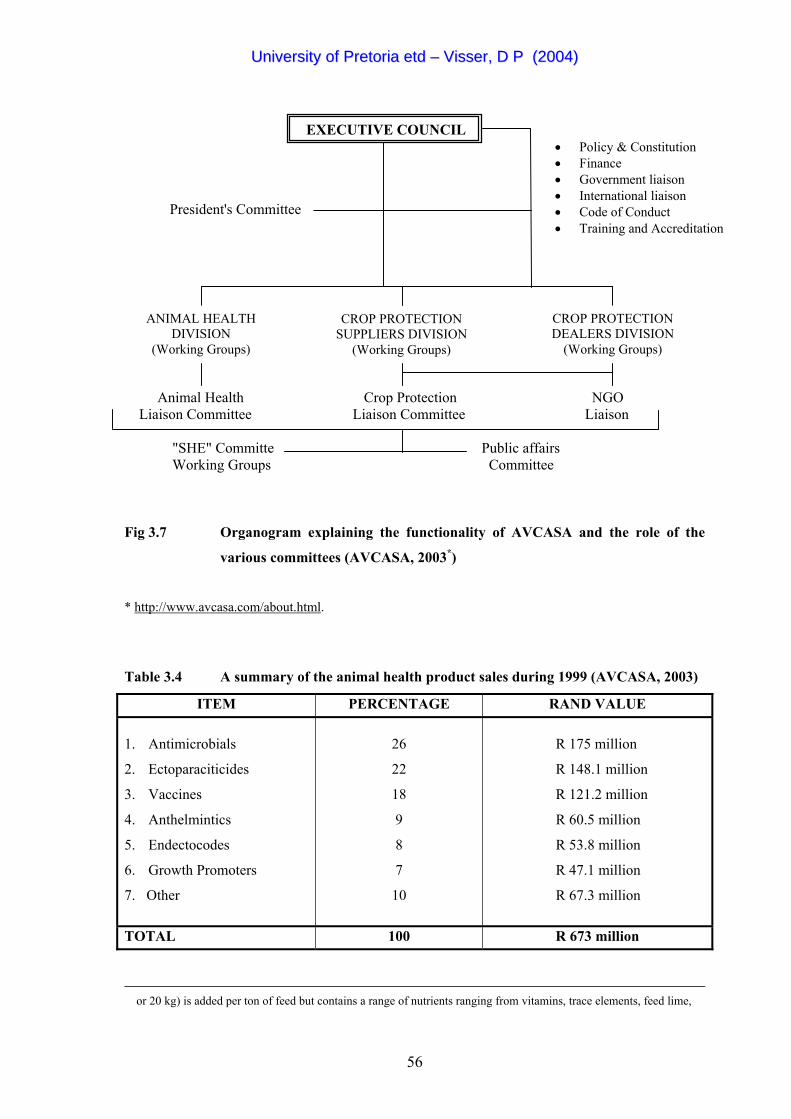
its structure, working groups and committees (Vide Fig 3.7).
9 A pre-mix pack (normally weighing 3-5 kg) is added to one ton of feed and contains vitamins, trace elements (of which
the bulk is manufactured in South Africa) and/or medication. A pre-mix macro pack (normally weighing 10
55
UUnniivveerrssiittyy ooff PPrreettoorriiaa eettdd –– VViisssseerr,, DD PP ((22000044))
Animal Health Crop Protection NGO Liaison Committee Liaison Committee Liaison "SHE" Committe Public affairs Working Groups Committee
Fig 3.7 Organogram explaining the functionality of AVCASA and the role of the
various committees (AVCASA, 2003*)
* http://www.avcasa.com/about.html.
Table 3.4 A summary of the animal health product sales during 1999 (AVCASA, 2003)
ITEM PERCENTAGE RAND VALUE 1. Antimicrobials
2. Ectoparaciticides
3. Vaccines
4. Anthelmintics
5. Endectocodes
6. Growth Promoters
7. Other
26
22
18
9
8
7
10
R 175 million
R 148.1 million
R 121.2 million
R 60.5 million
R 53.8 million
R 47.1 million
R 67.3 million
TOTAL 100 R 673 million
or 20 kg) is added per ton of feed but contains a range of nutrients ranging from vitamins, trace elements, feed lime,
EXECUTIVE COUNCIL• Policy & Constitution • Finance • Government liaison • International liaison • Code of Conduct • Training and Accreditation
ANIMAL HEALTH DIVISION
(Working Groups)
CROP PROTECTION SUPPLIERS DIVISION
(Working Groups)
CROP PROTECTION DEALERS DIVISION
(Working Groups)
President's Committee
56
UUnniivveerrssiittyy ooff PPrreettoorriiaa eettdd –– VViisssseerr,, DD PP ((22000044))
3.3.3 Vulnerabilities Pertaining to the South African Pig Industry
(i) Local pig production in comparison to global production norms and global trends can be
regarded as minute/fractional, accounting for approximately 0.2 % of world production
and 0.1 % of world exports in 1996 (LMC International Ltd, 1999). Equally important is
the fact that South Africa has never been a pork exporter of any substantial magnitude
(Matthis, 1999). SAMIC (2000) indicated that 10 427 tons of pork were imported during
the year 2000. China (by virtue of numbers) dominates world pork production, accounting
for approximately 50 % of world production, followed by the European Union (18 %) and
the USA (10 %). Given the inherent small size, structure and limitations of the South
African pig industry, preliminary competitiveness comparisons (Vide 3.4) are reflected in
sub-optimal and impaired performance when compared to the Danish, American and
Taiwanese pork industries. This is exacerbated by export subsidies and the inherent
vulnerability of the Rands intrinsic exchange rate against the Dollar and Euro.
Matthis (1999) indicated that the biggest single threat to the South African pork industry is
the massive influx of poultry meat into the country (mainly from the USA). In excess of
50 % of all imported meat is still poultry meat. The ripple effect of imported poultry meat
is manifested as follows:
• The local import levy on imported poultry meat, albeit 17 % at present, is not
convincingly effective, since turkey meat is duty free
• Imported poultry and turkey meat, along with the mechanically deboned meat
(MDM), competes in direct opposition with local (processed and fresh) pork and
poultry products
• The low import product prices (which are substantially subsidized) are not passed on
to the consumer, thus not contributing to food security, whilst simultaneously
pressuring local pig and poultry producers in a disguised manner with serious financial
and unemployment implications.
(ii) The establishment/creation of a responsive production environment conducive to
sustainable and profitable pig farming calls for, inter alia, stringent monitoring and
application of health measures, welfare and environmental codes of conduct, biosecurity
programmes, transparent import and export protocols and most importantly the furthering
of a sound technology development and research strategy. The latter should be regarded
Mono Calcium Phosphate, salt, amino acids and sometimes medication.
57
UUnniivveerrssiittyy ooff PPrreettoorriiaa eettdd –– VViisssseerr,, DD PP ((22000044))
as fundamentally related to the above-mentioned critical production factors. However, the
commercial and stud industry must take drastic actions to mobilize financial support to
further the cause of agricultural research, since agricultural research is not regarded at
present as a high government priority. State owned/subsidized industries (previously
protected from international competition), where funds were abundantly directed to the
private sector, are being replaced by actions, activities and programmes where competition
is stimulated and subsidies to the private sector are limited substantially (Matthis, 1999).
Grulke (2000) stated that companies can no longer rely on regulations to protect them or
their market positions. During the past five years the Parliamentary Grant of the
Agricultural Research Council declined from R 350 million in 1998 to R 264 million in
2002 (Carstens, 2002). Simultaneously, the funds earmarked for research through the
RMRDT of SAMIC were subjected to the inherent risks and fluctuations of the money
markets and the causal relationship with regard to money being effectively available for
research in the livestock production chain and more specifically the pork chain. In 1999
an amount of R 2 158 643 was allocated for meat industry related research to partly
finance 29 research projects incorporating the National Performance Testing Schemes (R
240 559) and INTERGIS (R 275 457). This figure has substantially/ significantly
decreased to a preliminary amount of R 972 699 budgeted by the RMRDT for the year
2002 to partly finance 22 research projects, excluding the National Performance Testing
Schemes and INTERGIS (Klingbiel, 2002). During the 2001 SAPPO Annual Congress in
Warmbaths in the Limpopo Province, a heartening motion10 was tabled, submitted and
accepted by the congress.
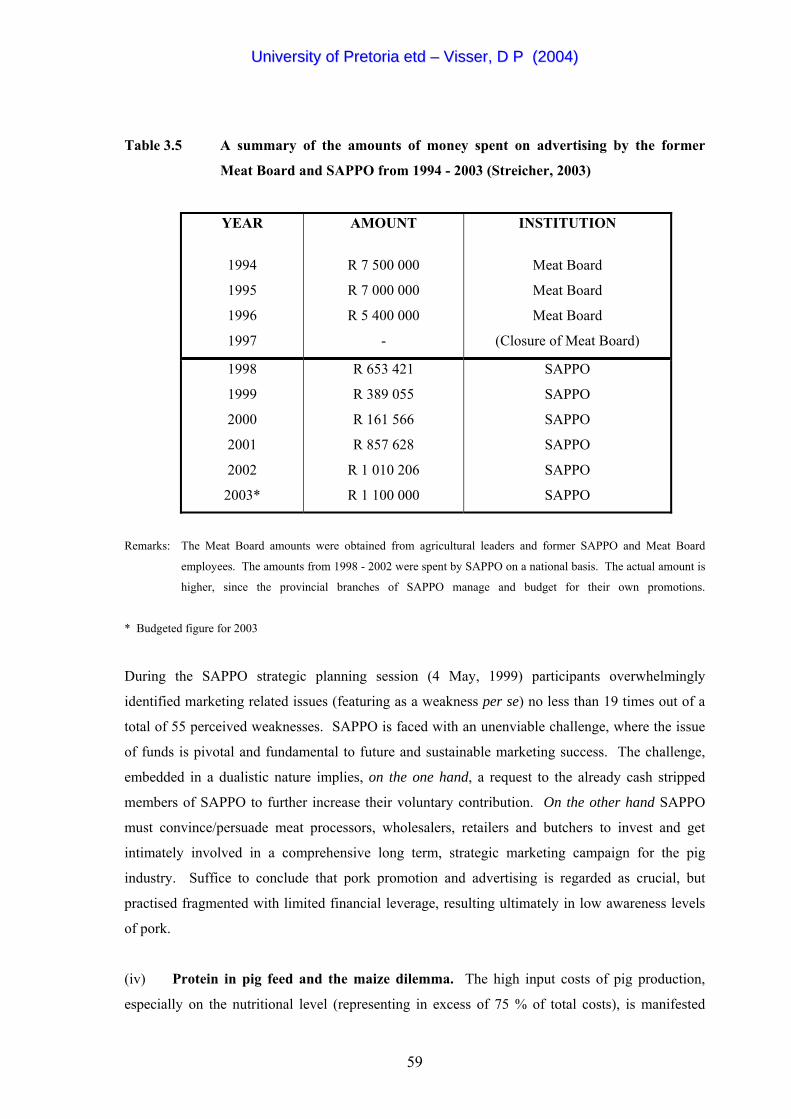
(iii) Marketing and promotion. Van Rooyen (1999) indicated the importance of promoting
pork within a generic consumer focussed strategy. Pork promotion and advertising had
been a highly debated subject for decades within the South African pig industry. The
reality is that SAPPO has orchestrated advertising and marketing campaigns in the post
Meat Board era, but these had no sustainable zeal and limited financial impact [Vide Table
3.5 and Table 3.9 where it is indicated that the per capita consumption of pork declined
substantially after the closure of the Meat Board (3.4kg in 1996 to 3kg in the year
1999/2000) when only half a million Rand was spent on advertising].
10 "In order to avoid a breakdown in pork industry research and to establish ownership of relevant research, the
Transvaal Pork Producers' Association proposes that SAPPO, as a matter of urgency, budget for this purpose.
It is recognised across the globe that returns on agricultural research, result to a figure of ±65 %. Research is furthermore required to become competitive in the international market".
58
UUnniivveerrssiittyy ooff PPrreettoorriiaa eettdd –– VViisssseerr,, DD PP ((22000044))
Table 3.5 A summary of the amounts of money spent on advertising by the former
Meat Board and SAPPO from 1994 - 2003 (Streicher, 2003)
YEAR
1994
1995
1996
1997
AMOUNT
R 7 500 000
R 7 000 000
R 5 400 000
-
INSTITUTION
Meat Board
Meat Board
Meat Board
(Closure of Meat Board)
1998
1999
2000
2001
2002
2003*
R 653 421
R 389 055
R 161 566
R 857 628
R 1 010 206
R 1 100 000
SAPPO
SAPPO
SAPPO
SAPPO
SAPPO
SAPPO
Remarks: The Meat Board amounts were obtained from agricultural leaders and former SAPPO and Meat Board
employees. The amounts from 1998 - 2002 were spent by SAPPO on a national basis. The actual amount is
higher, since the provincial branches of SAPPO manage and budget for their own promotions.
* Budgeted figure for 2003
During the SAPPO strategic planning session (4 May, 1999) participants overwhelmingly
identified marketing related issues (featuring as a weakness per se) no less than 19 times out of a
total of 55 perceived weaknesses. SAPPO is faced with an unenviable challenge, where the issue
of funds is pivotal and fundamental to future and sustainable marketing success. The challenge,
embedded in a dualistic nature implies, on the one hand, a request to the already cash stripped
members of SAPPO to further increase their voluntary contribution. On the other hand SAPPO
must convince/persuade meat processors, wholesalers, retailers and butchers to invest and get
intimately involved in a comprehensive long term, strategic marketing campaign for the pig
industry. Suffice to conclude that pork promotion and advertising is regarded as crucial, but
practised fragmented with limited financial leverage, resulting ultimately in low awareness levels
of pork.
(iv) Protein in pig feed and the maize dilemma. The high input costs of pig production,
especially on the nutritional level (representing in excess of 75 % of total costs), is manifested
59
UUnniivveerrssiittyy ooff PPrreettoorriiaa eettdd –– VViisssseerr,, DD PP ((22000044))
twofold. Firstly in excessively high protein costs (of which in excess of 40 % is imported) and
secondly the maize factor (dilemma) with its inherent cyclical nature, complexity, regular supply
inconsistencies, recent record price levels, extreme vulnerability to climatic conditions and it's
exploitational value on SAFEX based on US Dollars. The maize price is probably the biggest
psychological, emotional and financial trigger in the pork supply chain. In short: Pig farmers
have become too reliant on maize. Venter (2003) stated that the three factors which will always
have a significant impact on the South African maize price are: (1) the international maize supply
and demand (reflected in the Chicago Board of Trade prices), (2) the exchange value of the Rand
and (3) the domestic supply and demand of maize. The uninterrupted domestic protein shortage in
all the intensive livestock industries (linked to import disparity/dependency based on dollar terms)
and the unavoidable energy dilemma, manifested in the impetuosity of the maize price (mentioned
above) has proven indisputably to be two of the major triggers in the pork supply chain with
detrimental effects along the chain on profitability and on survival.
3.4 GENETIC IMPROVEMENT AND PIG INFORMATION SYSTEMS
3.4.1 Introduction
The philosophy of genetic improvement of livestock pivots on the principle that the entire South
African population benefits eventually from the genetic improvement which is being generated in
the nucleus (seedstock-producing) herds. Improved genes are distributed to all the layers of the
breeding pyramid through effective gene flow principles over an extended period of time.
Mokoena (1998) studied the payoffs to investments in livestock improvement programmes from
1970 – 1996 in South Africa. Financial investments in the Dairy-, Beef-, Small Stock- and Pig
Testing Schemes generated internal rate of returns of 51 %, 44 %, 54 % and 14 % for the different
Schemes respectively. These ‘rate of returns’ indicated very clearly that the investments in the
National Livestock Improvement Schemes represent a high return on public funds, during the
mentioned period. In terms of welfare gains (to what extent the benefits from investments in
livestock production research programmes are distributed amongst consumers and producers)
Mokoena (1998) indicated, through applying the Akino – Hayami model, that consumers gain
more than producers in all the schemes.
The database component of any animal recording scheme is pivotal to continued genetic
improvement (Visser, 1996). For this reason, pig information systems and genetic improvement
systems should be regarded as interwoven and be based fundamentally on the utmost accuracy.
The process should be continuous. According to Campher, Hunlun & Van Zyl (1998), substantial
60
UUnniivveerrssiittyy ooff PPrreettoorriiaa eettdd –– VViisssseerr,, DD PP ((22000044))
genetic progress, achieved over the past decades by South African livestock producers, has
resulted in enviable food and fibre production levels. This achievement, however, resulted
through dedicated efforts from several institutions, committees and organisations renowned within
the South African livestock improvement fraternity. These institutions and organisations include
S.A. Studbook, INTERGIS, breed societies, livestock improvement schemes, the artificial
insemination (AI) industry, the involvement of some one thousand scientists, consultants and
veterinary surgeons in the livestock industry, the Registrar of Livestock Improvement and also the
Livestock Improvement Act (No. 25 of 1977 which is being administered by the Registrar).
3.4.2 Genetic Improvement of Pigs
Genetic improvement of pigs in South Africa (on a national level) can be traced back to the 1st of
April 1956. Official performance testing commenced with three testing centres (Pretoria, Cedara
and Elsenburg) in South Africa and one in the former Rhodesia (Hofmeyr, 1996). The centres
were designed to mirror similar conditions in commercial piggeries and to ensure standardised
management and animal environments. Regular changes were introduced during the last forty six
years to keep abreast with modern performance testing. "In fact the golden thread of successful
breeding in the South African pig stud industry has been it's intimate involvement in and
collaboration with performance testing at a national level" [Webber (1996) as quoted by
Campher, Hunlun & Van Zyl (1998)].
3.4.2.1 Central Testing
The central testing phase of pigs (conducted at the three pig testing centres at Irene, Cedara and
Elsenburg) has been inherently part of the genetic improvement of pigs on a national level since
1956 (Hofmeyr, 1996). From each breeder a random sample of at least 22 young boars and 22
young gilts (which represent the offspring of at least 50 % of the herd boars) per breed or line are
tested centrally during a test year. At the end of the test (before slaughtering) all animals are
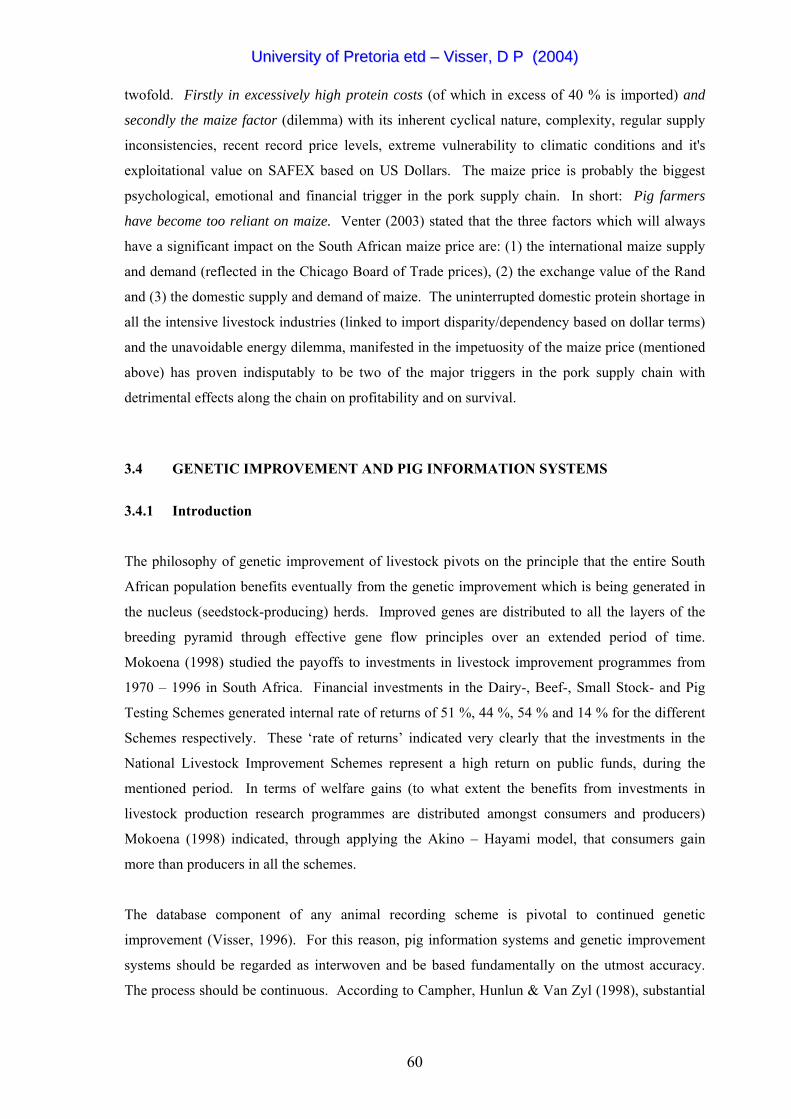
judged and scored for functional efficiency based on 14 visual traits. Fig 3.8 gives an overview of
the central test statistics since 1991.
A detailed carcass evaluation is conducted on the slaughtered animals. Carcass traits such as %
lean, % fat, % bone, % drip free lean and efficiency of lean meat production are determined. The
breeding values (EBV's) of centrally tested animals are estimated once a week, using the PEST-
computer programme. The genetic evaluation of pigs is discussed in further detail in CHAPTER
IV.
61
UUnniivveerrssiittyy ooff PPrreettoorriiaa eettdd –– VViisssseerr,, DD PP ((22000044))
YEAR
1400
400
200
0
800
600
1200
1000
1991 1992 1993 1994 1995 1996 1997 1998 1999 2000 2001
867800
9551048
11531266
881863693
815
Num
ber o
f ani
mal
s
2002
581
372*
Fig 3.8 A summary of the total number of pigs tested centrally (Phase B) in the National
Pig Performance Testing Scheme from 1991 - 2001 (AII, 2001)
( Since January 2000 the national database is continuously subjected to the
retrieval of rejected data. This figure will fluctuate as long as more records are recaptured.) * Estimated figure
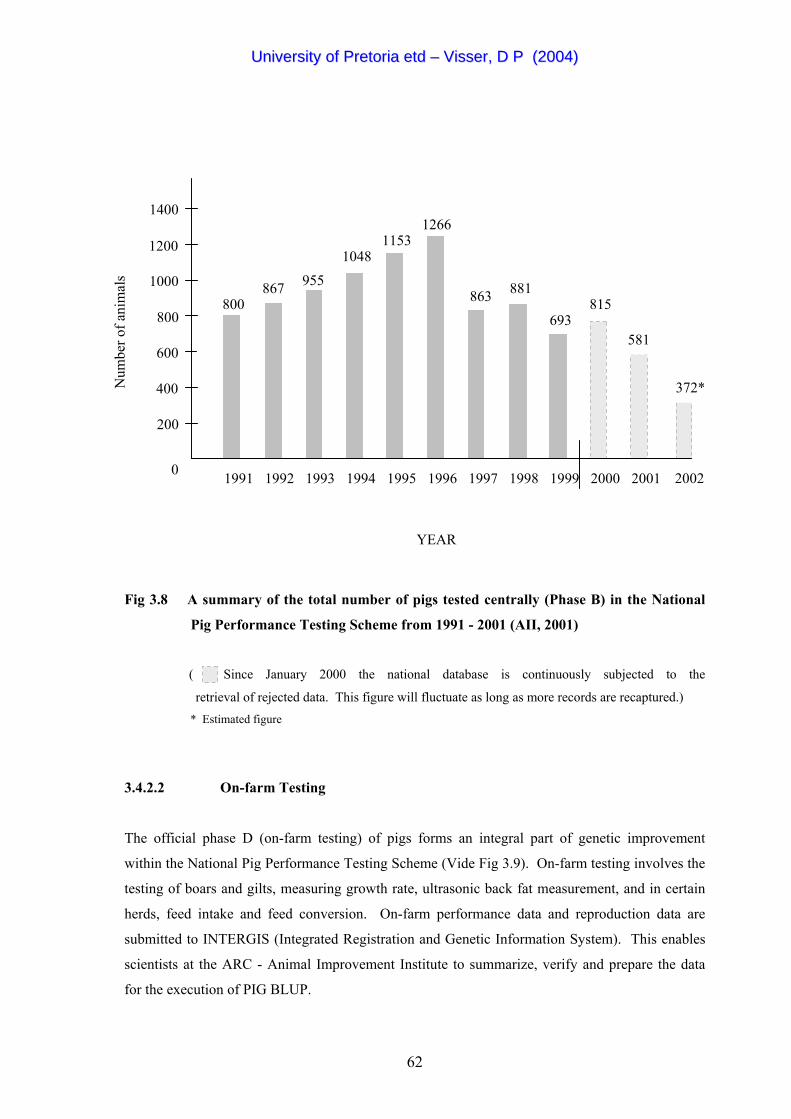
3.4.2.2 On-farm Testing
The official phase D (on-farm testing) of pigs forms an integral part of genetic improvement
within the National Pig Performance Testing Scheme (Vide Fig 3.9). On-farm testing involves the
testing of boars and gilts, measuring growth rate, ultrasonic back fat measurement, and in certain
herds, feed intake and feed conversion. On-farm performance data and reproduction data are
submitted to INTERGIS (Integrated Registration and Genetic Information System). This enables
scientists at the ARC - Animal Improvement Institute to summarize, verify and prepare the data
for the execution of PIG BLUP.
62
UUnniivveerrssiittyy ooff PPrreettoorriiaa eettdd –– VViisssseerr,, DD PP ((22000044))
7000
2000
1000
0
4000
3000
6000
5000
1991 1992 1993 1994 1995 1996 1997 1998 1999 2001
3862
5142
6503
89759033 9411
8710
73647409
10000
9000
8000
Num
ber o
f Ani
mal
s
4732
YEAR
5849
7689*
2002 2000
Fig 3.9 A summary of the total number of pigs tested on-farm (Phase D) from 1991-2001
(AII, 2001)
Since January 2000 the national database is continuously subjected to the retrieval
of rejected data. This figure will fluctuate as long as more records are recaptured. * Estimated figure
3.4.2.3 PIG BLUP
PIG BLUP, a comprehensive genetic evaluation computer programme was developed during the
late 1980's by scientists of the Animal Genetics and Breeding Unit at the University of New
England, Armidale, New South Wales in Australia. The power of PIG BLUP is based particularly
on using information from all measurements and all relatives (normally over a period of ten years)
as well as other animals in the breeding herd simultaneously. PIG BLUP is a scientific tool to
calculate Estimated Breeding Values (EBV's). The Estimated Breeding Value (EBV) is the genetic
63
UUnniivveerrssiittyy ooff PPrreettoorriiaa eettdd –– VViisssseerr,, DD PP ((22000044))
value of an animal as a parent. PIG BLUP is a within herd genetic evaluation programme and
divides phenotypic performance into genetic effects, environmental effects and other effects, thus
calculating trends within each herd.
During 1993 the ARC - Animal Improvement Institute obtained the (first) licence for the execution
of PIG BLUP in the South African pig stud industry. PIG BLUP was implemented in the South
African pig stud industry during 1993/94. Almost all participating Scheme members apply this
programme in their herds with advantageous benefits.
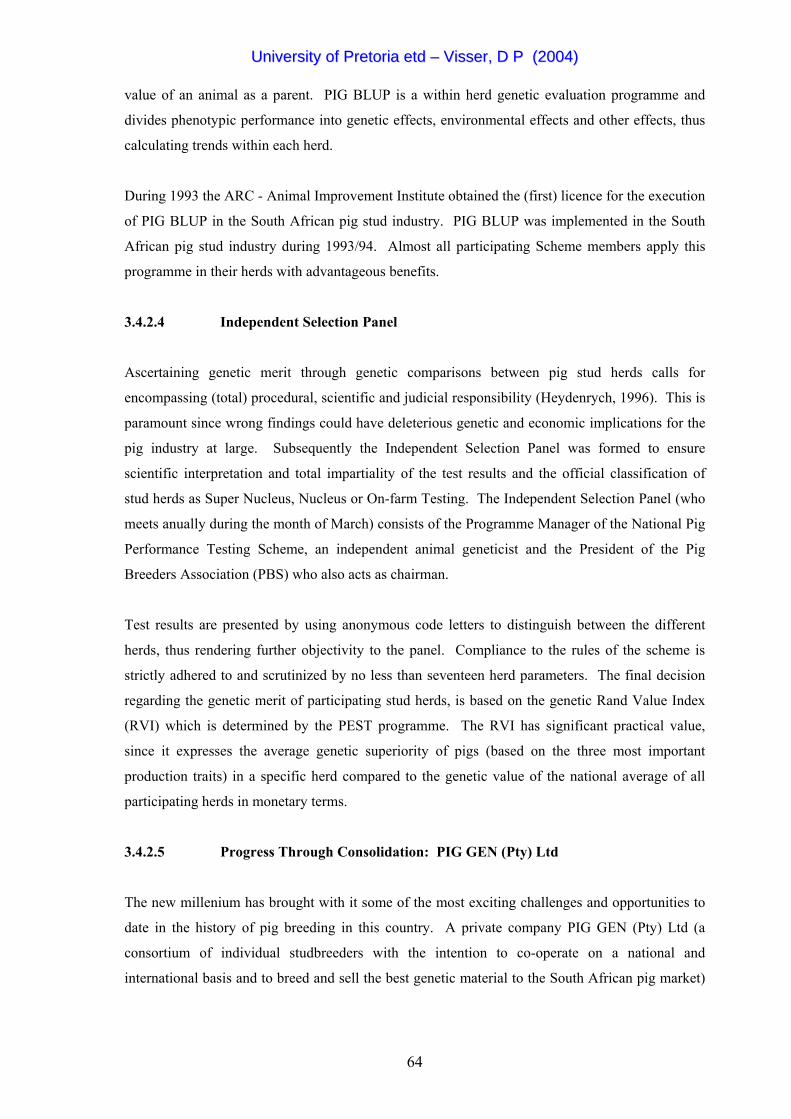
3.4.2.4 Independent Selection Panel
Ascertaining genetic merit through genetic comparisons between pig stud herds calls for
encompassing (total) procedural, scientific and judicial responsibility (Heydenrych, 1996). This is
paramount since wrong findings could have deleterious genetic and economic implications for the
pig industry at large. Subsequently the Independent Selection Panel was formed to ensure
scientific interpretation and total impartiality of the test results and the official classification of
stud herds as Super Nucleus, Nucleus or On-farm Testing. The Independent Selection Panel (who
meets anually during the month of March) consists of the Programme Manager of the National Pig
Performance Testing Scheme, an independent animal geneticist and the President of the Pig
Breeders Association (PBS) who also acts as chairman.
Test results are presented by using anonymous code letters to distinguish between the different
herds, thus rendering further objectivity to the panel. Compliance to the rules of the scheme is
strictly adhered to and scrutinized by no less than seventeen herd parameters. The final decision
regarding the genetic merit of participating stud herds, is based on the genetic Rand Value Index
(RVI) which is determined by the PEST programme. The RVI has significant practical value,
since it expresses the average genetic superiority of pigs (based on the three most important
production traits) in a specific herd compared to the genetic value of the national average of all
participating herds in monetary terms.
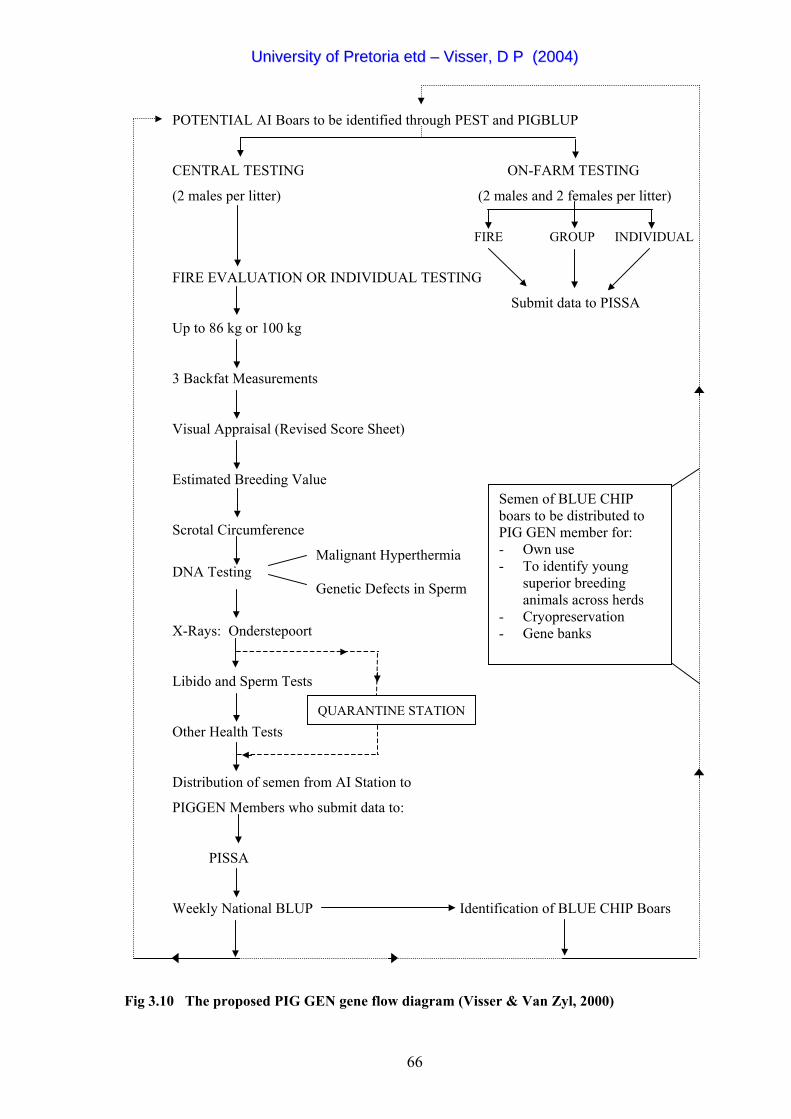
3.4.2.5 Progress Through Consolidation: PIG GEN (Pty) Ltd
The new millenium has brought with it some of the most exciting challenges and opportunities to
date in the history of pig breeding in this country. A private company PIG GEN (Pty) Ltd (a
consortium of individual studbreeders with the intention to co-operate on a national and
international basis and to breed and sell the best genetic material to the South African pig market)
64
UUnniivveerrssiittyy ooff PPrreettoorriiaa eettdd –– VViisssseerr,, DD PP ((22000044))
was already formed in 1996. The establishment and approval of the PIG GEN AI station on
September 11, 2001 at the premises of the ARC-AII has paved the way for accelerated genetic
improvement. The most superior (official performance tested) stud boars in the country will be
identified through a national BLUP-programme. Dissemination of elite genes to the shareholders
(Vide Fig 3.10) of PIG GEN, followed by careful identification through across-herd genetic
evaluation procedures, will ensure a continuous supply of proven progeny tested boars to the AI-
system. The biggest impact of this co-operative/consolidated breeding programme will ultimately
be on the commercial industry.
65
UUnniivveerrssiittyy ooff PPrreettoorriiaa eettdd –– VViisssseerr,, DD PP ((22000044))
POTENTIAL AI Boars to be identified through PEST and PIGBLUP
CENTRAL TESTING ON-FARM TESTING
(2 males per litter) (2 males and 2 females per litter)
FIRE GROUP INDIVIDUAL
FIRE EVALUATION OR INDIVIDUAL TESTING
Submit data to PISSA
Up to 86 kg or 100 kg
3 Backfat Measurements
Visual Appraisal (Revised Score Sheet)
Estimated Breeding Value
Scrotal Circumference
Malignant Hyperthermia DNA Testing Genetic Defects in Sperm
X-Rays: Onderstepoort
Libido and Sperm Tests
Other Health Tests
Distribution of semen from AI Station to
PIGGEN Members who submit data to:
PISSA
Weekly National BLUP Identification of BLUE CHIP Boars
Fig 3.10 The proposed PIG GEN gene flow diagram (Visser & Van Zyl, 2000)
QUARANTINE STATION
Semen of BLUE CHIP boars to be distributed to PIG GEN member for:
use - To identify young
superior breeding animals across herds
- Cryopreservation - Gene banks
- Own
66
UUnniivveerrssiittyy ooff PPrreettoorriiaa eettdd –– VViisssseerr,, DD PP ((22000044))
3.4.3 The Implementation of an "Adapted Platform Independent Information System" for
Pig Recording in South Africa
Management and genetic improvement activities at population level require complete and updated
data on individual animals in breeding and production herds. The investigation into the possibility
of creating a complete11 pig information system (with international application) was initiated by
Prof Eildert Groeneveld at the Institute of Animal Science and Behaviour, Mariensee, Germany.
Subsequently six countries, including South Africa, became involved in developing such a system
which progressed to, what is currently known as, the Adaptable Platform Independent Information
System (APIIS), since the core database structure can be adapted to different species and
populations. No additional programming of validation rules is required, irrespective of how the
data enter the database. Different languages and different countries' requirements are supported.
Either commercial or public domain databases can be used. Current development of the system
takes place from a LINUX platform. The PERL programming language is used with PostgreSQL
as the relational database. Development of APIIS is done over the Internet, using the open source
model approach.
The development of APIIS has paved the way for utilising this system as an aggregate industry
information system. The system is locally known as Pig Information System South Africa
(PISSA). It is intended to produce a generic pig information system that is compatible to any pig
breeding programme, covering all the data collection areas from central to on-farm systems,
accommodating intermediate genetic improvement locations like test and AI stations (Voordewind
& Kanfer, 1999). In future, aspects like on-farm financial and production management (including
matings, farrowings and weanings), marketing models and abattoir information will also be
included. PISSA could in future also enhance traceability in the following spheres of recording
and production:
• The birth data, parents and a five lineage history of any animal across the herds of different
stud breeders.
• Movement of animals across herds.
• Unique animal identification which will ensure backward traceability from abattoirs to stud
breeders.
11 A reference database that makes provision for herdbook data, field test data, station test data, reproduction data and
carcass evaluation.
67
UUnniivveerrssiittyy ooff PPrreettoorriiaa eettdd –– VViisssseerr,, DD PP ((22000044))
3.4.4 Vulnerabilities Pertaining to Breeding and Genetic Improvement
(i) Summer Infertility. Reproductive inefficiency in pigs during the summer period, known
as the Summer Infertility Syndrome (SIS) has been recognised in different parts of the
world. According to Douglas & Mackinon (1992), seasonal reproductive inefficiency
was the biggest source of financial loss to the British pig industry as well as to the
individual British farmer. (During the year 2001, the single biggest source of financial
loss to the British pig industry was unmistakably the outbreak and the catastrophic effects
of FMD). The existence of the Summer Infertility Syndrome (SIS) was proved to the Pig
Research Planning Committee of SAPPO at a meeting on the 6th of December 1995 at the
former Meat Board. Information obtained from the former Meat Boards Health Scheme
database indicated a net loss of approximately 4000 pregnancies per annum. Janyk &
Visser (2001) indicated that during the peak summer infertility duration of approximately
three months in South Africa, reproductive factors such as poor conception rates, "not in
pig", multiple returns to service, anoestrus, abortions (exacerbated by the presence and
influences of mycotoxins) low boar libido (and reduced feromone activity), poor semen
quality, etc. all inhibit the reproductive efficiency of pigs significantly. A decline of 10 %
in reproductive efficiency during the hottest period (summer) of the year, is implicated in a
gross loss of approximately R 19 million per annum to the South African pig industry.
This phenomenon has culminated in a research project12 at the ARC - Animal
Improvement Institute, Irene and is co-funded by the RMRDT, which commenced in
January 1999. The nature of the SIS is multi-factorial, complex and directly linked to
climatic conditions (especially daylight length and high maximum temperatures) within
the ambit of differentiated bio-climatic regions, the presence of mycotoxins and
environmental extremes. It can be stated that solving this problem is no easy task. A time
span of a decade, international collaboration and various research teams with access to
sufficient funds, materials and equipment are required to partly solve this problem.
(ii) A sincere question that all pig producers must answer is: What impact does AI and
Biotechnology have on the South African pig industry? The application of Artificial
Insemination (AI) is exceptionally low in South Africa when compared to the European
and Scandinavian countries (Visser, 1996). During the year 2000 it was questionable
whether more than 30 % of all pig litters born in the country originated from AI. The
database of the National Pig Performance Testing Scheme revealed that 23 % (N = 18
596) of all registered stud litters born during the period 1990-2000, were from AI. Data
12 DVN 21 09: An investigation into the Summer Infertility Syndrome in South African pig herds
68
UUnniivveerrssiittyy ooff PPrreettoorriiaa eettdd –– VViisssseerr,, DD PP ((22000044))
submitted to the most recent (2001) sitting of the Independent Selection Panel (ISP)
indicated that 29 % (N = 1 014 litters) of all progeny born in stud herds originated from
AI. AI has been around for more than thirty years in the pig industry. The logistics of
distance, technological aptitude of pig producers (reflecting the typical normal distribution
- ranging from full acceptance to robust rejection), intrinsic sensitivity of porcine semen,
ex post factors as well as other impediments will continue to impair the rightful
acceptance and real financial benefits of AI as being manifested in compounded/additive
genetic acceleration.
The real application of biotechnology is synonymous with enormous financial budgets
(inputs), advanced and extremely expensive laboratory equipment, skilled scientists, an
environment conducive to quality research and effective international collaboration. The
inability of South African biotechnology laboratories (like the AII's DNA Laboratory at
Irene) to comply with and/or adapt to international trends and demands, further renders the
SA pig industry to serious vulnerability as well as on the biotechnology-cum-genetic level.
Aggravating factors contributing to this situation are the international patenting
(intellectual property rights) of methods and genome search/DNA probes. This is further
aggravated by the immediate financial dilemma of the ARC, linked with irreversible
trends in transformation and employment equity.
(iii) The implications of the MH-gene for the South African pig industry (although already
discussed under 2.4.2 to 2.4.3.2.1) warrant some further discussion. Given the detrimental
effect of the MH-gene on meat quality and carcass traits, the licence to detect the MH-
gene [through DNA-testing and polymerase chain reaction (PCR)] was initiated by
SAPPO and purchased by the former Meat Board during 1992/93.
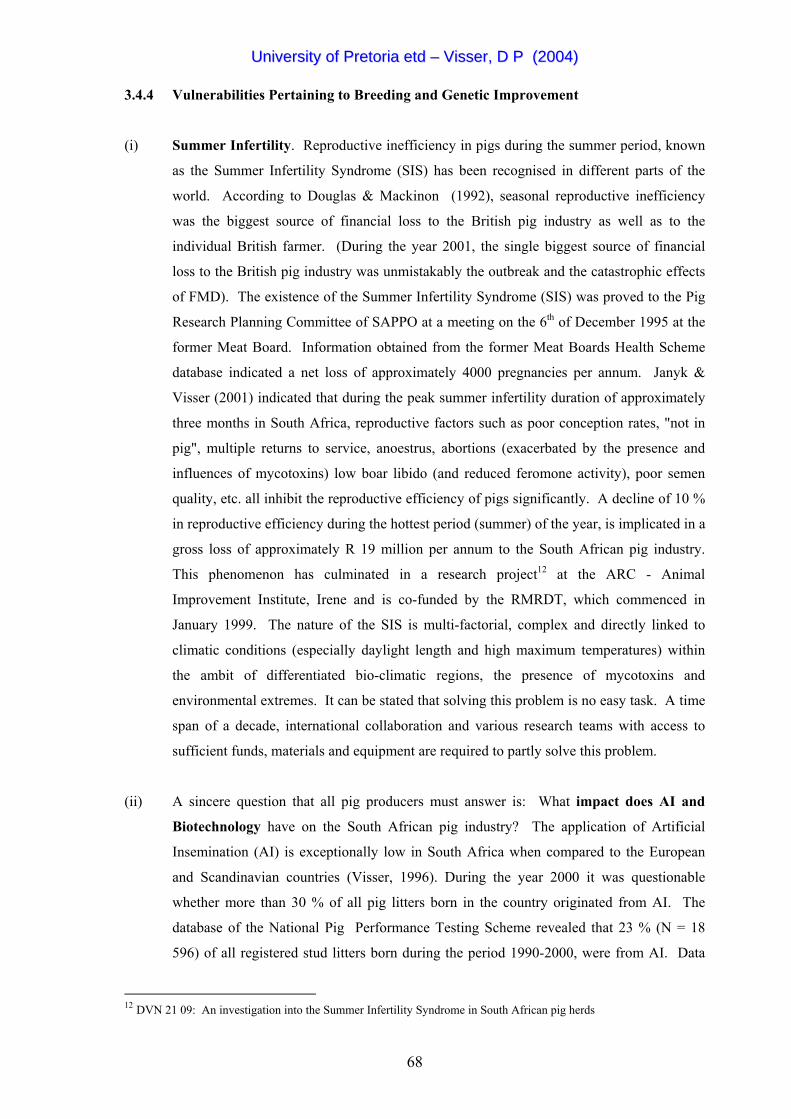
Table 3.6 and Fig 3.11 give an overview of the frequency of the MH-gene during the
period 1992-1999 (when 10 213 pigs in South Africa were tested for the MH-gene) as
obtained from the DNA Laboratory at the ARC-AII, Irene.
From Table 3.6 and Fig 3.11 it is evident that the frequency of the NN homozygous alleles
have increased from 0.62 to 0.77 in 1998/99. The Nn heterozygous alleles have decreased
from 0.29 in 1992/93 to 0.19 in 1998/99. Finally the frequency of the nn homozygous
recessive allele (inherently associated with in transit deaths and poor meat quality) has
decreased from 0.08 in 1992/93 to 0.03 in 1998/99. This figure is even more remarkable,
if one considers a more than five fold increase (350 in 1992/93 versus 1 852 in 1998/99) in
the number of pigs tested for the MH-gene at the DNA Laboratory at the ARC, Irene.
69
UUnniivveerrssiittyy ooff PPrreettoorriiaa eettdd –– VViisssseerr,, DD PP ((22000044))
Table 3.6 An overview of the trend of the MH-gene in the South African pig population
from 1992 to 1999 (Rhode & Harris, 1999)
MH Status 1992/93 1993/94 1994/95 1995/96 1996/97 1997/98 1998/99
NN 217 (0.62) 690 (0.62) 1 049 (0.63) 1 147 (0.64) 1 237 (0.66) 1 009 (0.65) 1 441 (0.77)
Nn 103 (0.29) 328 (0.29) 489 (0.29) 563 (0.32) 574 (0.30) 497 (0.32) 354 (0.19)
nn 30 (0.08) 99 (0.09) 120 (0.07) 80 (0.04) 71 (0.04) 58 (0.04) 57 (0.03)
TOTAL 350 1 117 1 658 1 790 1 882 1 564 1 852
( ) The brackets indicate the allele frequency ratios of the MH-gene
From 1992 to 1999 a total of 10 213 pigs were tested for the MH-gene
1600 -
1400 -
1200 -
1000 -
800 -
600 -
400 -
200 -
0
Num
ber o
f pig
s tes
ted
pr
ir
92/93 93/94 94/95 95/96 96/97 97/98 98/99
NN Nn nn
alle
le p
ae
YEAR
Fig 3.11 A histogram of the trend of the allele pair frequency of the MH-gene in the
South African pig population from 1992 to 1999 (Rhode & Harris, 1999)
These trends are not indicative, nor representative of the entire pig industry. However, progressive
pig producers would use DNA-testing to reject or limit the presence of the MH-gene in their herds
or intentionally test those animals that could potentially carry the MH-gene. The recent revival of
the Pietrain pig breed, which is renowned for its ultra stress susceptibility (either as a purebred or
70
UUnniivveerrssiittyy ooff PPrreettoorriiaa eettdd –– VViisssseerr,, DD PP ((22000044))
composite) and the surprisingly limited number of offspring of this breed that are DNA-tested for
the MH-gene, is a matter of concern.
Hoffman (2000) indicated that if 50 % of all the pigs being slaughtered per annum were to be
classified as PSE, the estimated financial losses for the South African pork processing industry
could amount to R 9.45 million per annum. Patterson (2001) indicated a conservative figure of 25
% PSE for Enterprise (slaughtering and processing some 220 000 pigs per annum), amounting to
an estimated loss of R 5 million per annum. During the 2001 PBS Bosberaad, studbreeders
indicated that the MH-gene in the stud herds is approximately 80 % under control (Schoeman &
Visser, 2001). The viewpoint of PBS on the MH-gene is clear: "PBS recommends that extreme
caution be applied to homozygous stress susceptible (nn) animals. PBS does not approve the
importation of nn animals. PBS encourages the use of homozygous normal (NN) breeding animals
and strongly recommends to use heterozygous animals (Nn) with caution and diligence."
In contrast, certain individual stud breeders and the breeding companies like Kanhym/PIC and
Dalland/Topigs SA are of the opinion that the MH-gene can play an important role in the pig
industry and are using stress homozygous (nn) and heterozygous (Nn) animals accordingly in their
breeding programmes.
3.5 SLAUGHTERHOUSES AND SLAUGHTERING STATISTICS
3.5.1 Introduction
According to SAMIC (2000), 86 registered abattoirs in South Africa are responsible for the
slaughtering of ± 85 % of the 2.095 million pigs that are slaughtered annually (Vide Tables 3.7 &
3.9). To facilitate the marketing of pork products, pig carcasses are classified according to the
PORCUS classification system (Vide ANNEXURE IV). This system equips the consumer to
identify and select the ultimate pork - based on back fat thickness (mm) and percentage lean meat.
71
UUnniivveerrssiittyy ooff PPrreettoorriiaa eettdd –– VViisssseerr,, DD PP ((22000044))
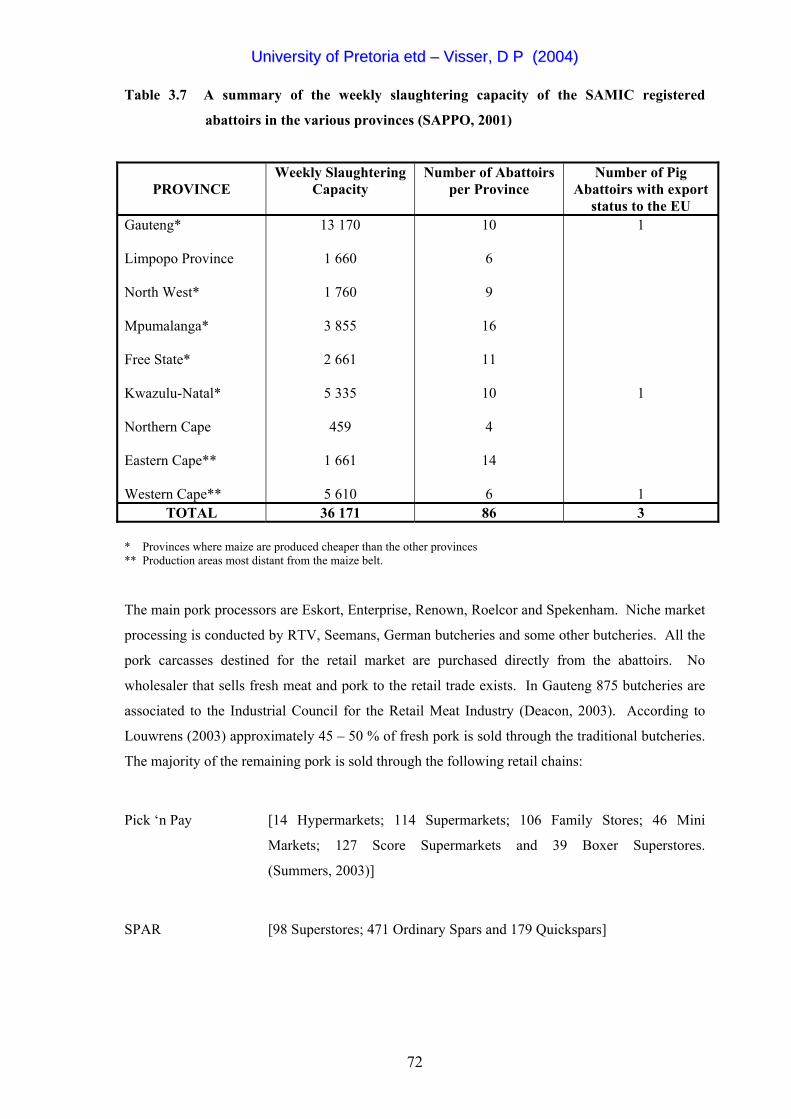
Table 3.7 A summary of the weekly slaughtering capacity of the SAMIC registered
abattoirs in the various provinces (SAPPO, 2001)
PROVINCE
Weekly Slaughtering Capacity
Number of Abattoirs per Province
Number of Pig Abattoirs with export
status to the EU Gauteng* Limpopo Province North West* Mpumalanga* Free State* Kwazulu-Natal* Northern Cape Eastern Cape** Western Cape**
13 170
1 660
1 760
3 855
2 661
5 335
459
1 661
5 610
10
6
9
16
11
10
4
14
6
1
1
1 TOTAL 36 171 86 3
* Provinces where maize are produced cheaper than the other provinces ** Production areas most distant from the maize belt. The main pork processors are Eskort, Enterprise, Renown, Roelcor and Spekenham. Niche market
processing is conducted by RTV, Seemans, German butcheries and some other butcheries. All the
pork carcasses destined for the retail market are purchased directly from the abattoirs. No
wholesaler that sells fresh meat and pork to the retail trade exists. In Gauteng 875 butcheries are
associated to the Industrial Council for the Retail Meat Industry (Deacon, 2003). According to
Louwrens (2003) approximately 45 – 50 % of fresh pork is sold through the traditional butcheries.
The majority of the remaining pork is sold through the following retail chains:
Pick ‘n Pay [14 Hypermarkets; 114 Supermarkets; 106 Family Stores; 46 Mini
Markets; 127 Score Supermarkets and 39 Boxer Superstores.
(Summers, 2003)]
SPAR [98 Superstores; 471 Ordinary Spars and 179 Quickspars]
72
UUnniivveerrssiittyy ooff PPrreettoorriiaa eettdd –– VViisssseerr,, DD PP ((22000044))
CHECKERS HYPER [19 Checkers Hyper Stores; 84 Checkers Stores; 245 Shoprite Stores; 28
OK Mini Markets; 29 OK Foods and 32 OK Grocer Stores. This retail
chain also incorporates other stores/retail shops such as Hungry Lion,
Sentra and Megashare. (http://www.shoprite.co.za)]
WOOLWORTHS [110 Woolworths Food Markets, De Bruyn (2003)]
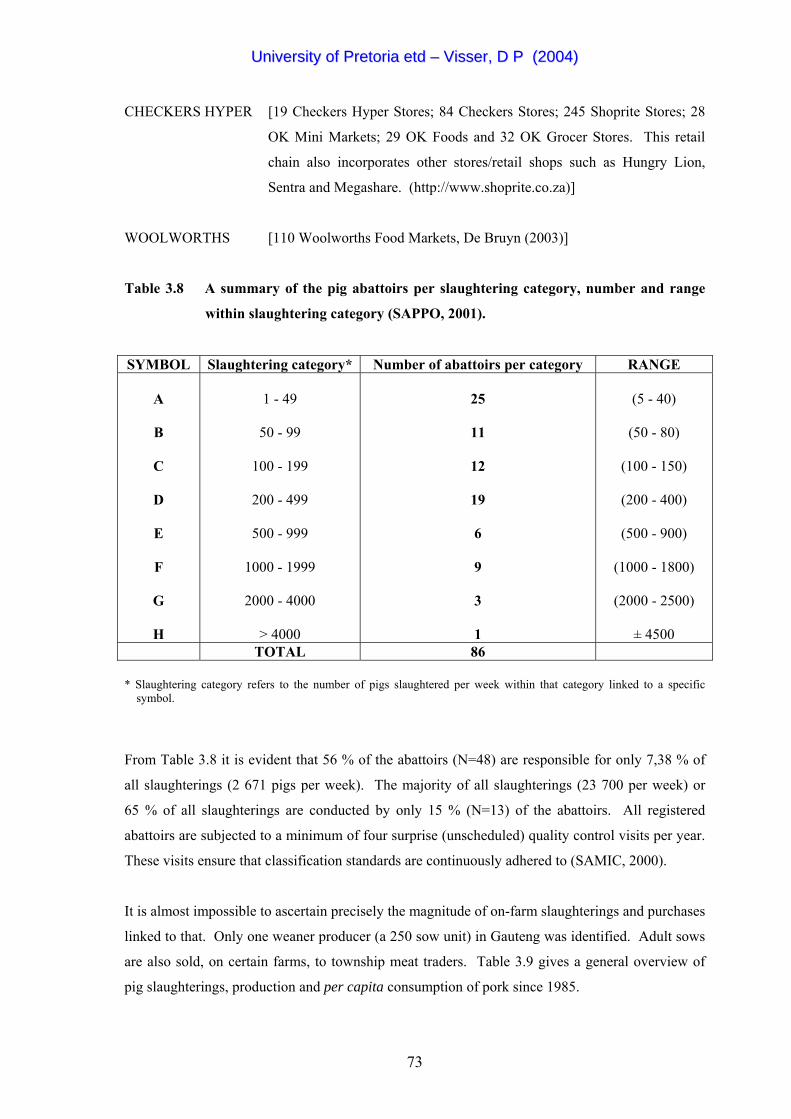
Table 3.8 A summary of the pig abattoirs per slaughtering category, number and range
within slaughtering category (SAPPO, 2001).
SYMBOL Slaughtering category* Number of abattoirs per category RANGE
A
B
C
D
E
F
G
H
1 - 49
50 - 99
100 - 199
200 - 499
500 - 999
1000 - 1999
2000 - 4000
> 4000
25
11
12
19
6
9
3
1
(5 - 40)
(50 - 80)
(100 - 150)
(200 - 400)
(500 - 900)
(1000 - 1800)
(2000 - 2500)
± 4500
TOTAL 86 * Slaughtering category refers to the number of pigs slaughtered per week within that category linked to a specific
symbol.
From Table 3.8 it is evident that 56 % of the abattoirs (N=48) are responsible for only 7,38 % of
all slaughterings (2 671 pigs per week). The majority of all slaughterings (23 700 per week) or
65 % of all slaughterings are conducted by only 15 % (N=13) of the abattoirs. All registered
abattoirs are subjected to a minimum of four surprise (unscheduled) quality control visits per year.
These visits ensure that classification standards are continuously adhered to (SAMIC, 2000).
It is almost impossible to ascertain precisely the magnitude of on-farm slaughterings and purchases
linked to that. Only one weaner producer (a 250 sow unit) in Gauteng was identified. Adult sows
are also sold, on certain farms, to township meat traders. Table 3.9 gives a general overview of
pig slaughterings, production and per capita consumption of pork since 1985.
73
UUnniivveerrssiittyy ooff PPrreettoorriiaa eettdd –– VViisssseerr,, DD PP ((22000044))
Table 3.9 An overview of pig numbers, slaughterings (at registered auction and non-
auction markets), auction prices on the hook, production and per capita
consumption of pork in South Africa since 1985/86 (A.A.S., 2001)
Consumption
Pig numbers
Slaughterings
Auction* price on the hook
(all auction markets)
Production Total Per capita**
Year
1 000 c per kg
1 000 tons
1 000 tons
kg per annum
1985/86
1986/87
1987/88
1988/89
1989/90
1990/91
1991/92
1992/93
1993/94
1994/95
1995/96
1996/97
1997/98
1998/99
1999/00
2000/01
1 361
1 366
1 360
1 427
1 524
1 532
1 539
1 529
1 493
1 511
1 628
1 603
1 617
1 641
1 531
1 556
1 899
1 880
1 941
2 075
2 275
2 360
2 189
2 267
2 101
1 973
2 194
2 172
2 061
2 064
2 095
-
222.4
284.7
324.4
362.2
340.2
338.1
399.0
448.3
483.1
623.2
523.0
632.2
752.1
672.8
777.7
-
107.4
104.3
107.5
114.9
126.2
130.8
112.7
129.6
119.6
119.0
126.5
127.9
125.0
122.6
120.1
-
105
102
106
113
126
130
113
128
124
139
136
138
132
133
134
-
3.1
2.9
3.0
3.1
3.4
3.5
3.0
3.3
3.2
3.5
3.4
3.3
3.1
3.1
3.0
-
* Auction prices are nominal prices and are not comparable over time
** The per capita consumption of pork during the last fifteen years ranged between 2.9 and 3.5 kg.
The lowest consumption of all meat types consumed in South Africa is pork. From all animal protein sources, only
fish has lower consumption levels
3.5.2 Incidence of PSE Pork in South African Abattoirs
Heinze and Klingbiel (1991) conducted a survey during 1990/91 across fifteen large abattoirs in
South Africa, incorporating 6 984 pig carcasses of 170 producers. The ultimate objective of this
study was to ascertain the incidence of pH1 values < 6.00, one hour post mortem of slaughtered
pigs. This was done to estimate the incidence of PSE pork in South Africa. This study
emphasised the following important aspects:
74
UUnniivveerrssiittyy ooff PPrreettoorriiaa eettdd –– VViisssseerr,, DD PP ((22000044))
• The incidence of pH1 values < 6.00 (thus indicative of sub-optimal carcass and meat quality)
was 21.5 %
• Slaughter day could have a significant effect on the incidence of pH1 values < 6.00
• Pre mortem handling methods and the conditions and technique related to electrical stunning
are two human related factors, which could have a profound effect on the incidence of pH1
values < 6.00. According to Van der Wal, Engel & Reimert (1999), the effect of stress applied
immediately before stunning (thus a non-genetic factor) caused a reduction in meat quality
traits (especially a reduction in water holding capacity) in males and females 45 minutes post
mortem.
3.5.3 Vulnerabilities Pertaining to Slaughterhouses and Pork Supply
(i) Pieterse (2003) reported an incidence of 46 % PSE (pH1 <6.00) in 450 pig carcasses that
were slaughtered at the RTV Abattoir in Gauteng during the course of 2002.
(ii) Trade liberalisation (which has not been addressed in this study) has a direct and indirect
effect on the pork supply chain and should be quantified within the broader red meat
sector ascertaining the impact thereof on a national, regional and global context. For
instance, due to it's tremendous economies of scale, vision and economic power, the USA
has the ability to penetrate and secure major proportions of any country's pork market
(Stein, 2000). According to Jooste (2001), South Africa's position in terms of
international trade liberalization should be evaluated from:
• A SADC perspective (the economic status and openness of these countries towards the
free market and trade relations internationally)
• The Lomé Convention
• The WTO and GATT
• The Common Agricultural Policy of the EU.
It should be noted that special attention needs to be given to the European Union (EU), since they
are South Africa's largest agricultural trading partner. In fact, during the year 2000, approximately
85 % of total pork imports into South Africa originated from the EU and Hungary (SAMIC, 2000).
(iii) SAMIC (2000) indicated that official pork imports (from outside the Southern African
Customs Union) amounted to 10 427 tons during the year 2000. Although pork imports
represent the smallest fraction (6.45 %) of imported meat the implications are far reaching.
75
UUnniivveerrssiittyy ooff PPrreettoorriiaa eettdd –– VViisssseerr,, DD PP ((22000044))
When converted to baconer carcasses (at an average weight of 62 kg/carcass) this tonnage
represents some 168 177 carcasses or 8.85 % of total slaughterings.
Illegal imports of various agricultural commodities, including meat, are taking place
continuously and if not controlled/policed thoroughly, these imports could have a
profound impact on the supply and demand of agricultural products. Due recognition
must be given to AGRI INSPECT13 (an independent investigation unit), commissioned by
the MPO (Milk Producers Organisation), SAPA (South African Poultry Association),
SAMIC (South African Meat Industry Corporation) and SAPPO (South African Pork
Producers’ Organisation) to investigate illegal imports of agricultural products at all the
ports of entry. Remarkable success has been achieved by this unit over the last six years.
3.6 INDUSTRY ORGANIZATIONS, INSTITUTIONS AND PROGRAMMES IN SUPPORT OF THE PORK SUPPLY CHAIN
3.6.1 Introduction
The South African pig industry is composed by means of various well-organised structures that
evolved over many decades. (Unfortunately many of these structures have come and gone as
history has marched on). The main objective of these organised structures is (was) to represent,
unite, protect and promote the pig producers' interest. These structures are in support of and
interwoven with those of other livestock industries, agricultural industries and agriculture in
general.
3.6.2 The South African Pork Producers’ Organisation
The South African Pork Producers' Organisation (SAPPO) started functioning (in it's present
format) in 1993 and serves the interest of the commercial pork producer. This is achieved through
co-operation, collective bargaining and liaison14 with private, statal, para-statal and/organised
agricultural organisations. SAPPO as a national organisation (Vide Fig 3.12) is funded through
voluntary membership fees, based on the number of active sows in the members' herds.
13 According to AGRI INSPECT, the South African meat industry experiences the following major problems pertaining to (illegal) meat imports: (i) wrong invoicing (ii) faulty (deliberate?) classification of meat and (iii) lack of infrastructure and inspectors leading to inefficient import inspections or policing. 14 SAPPO liaises extensively (often daily) with a substantial number of role players in the agricultural fraternity such as:
Agri SA, the Meat Industry Forum, SAMIC, the RPO, NERPO, the Abattoir Association, SAMPA, the ARC, the NDA, Federation of Meat Traders, AFMA, the Pig Vet Society, the five Pig Study Groups, Grain SA, Department of Trade and Industry, the PBS, CSIR, the SPCA, LWCC, Universities, consumer bodies, the media, pharmaceutical companies, research houses, consultants, individual abattoirs, etc.
76
UUnniivveerrssiittyy ooff PPrreettoorriiaa eettdd –– VViisssseerr,, DD PP ((22000044))
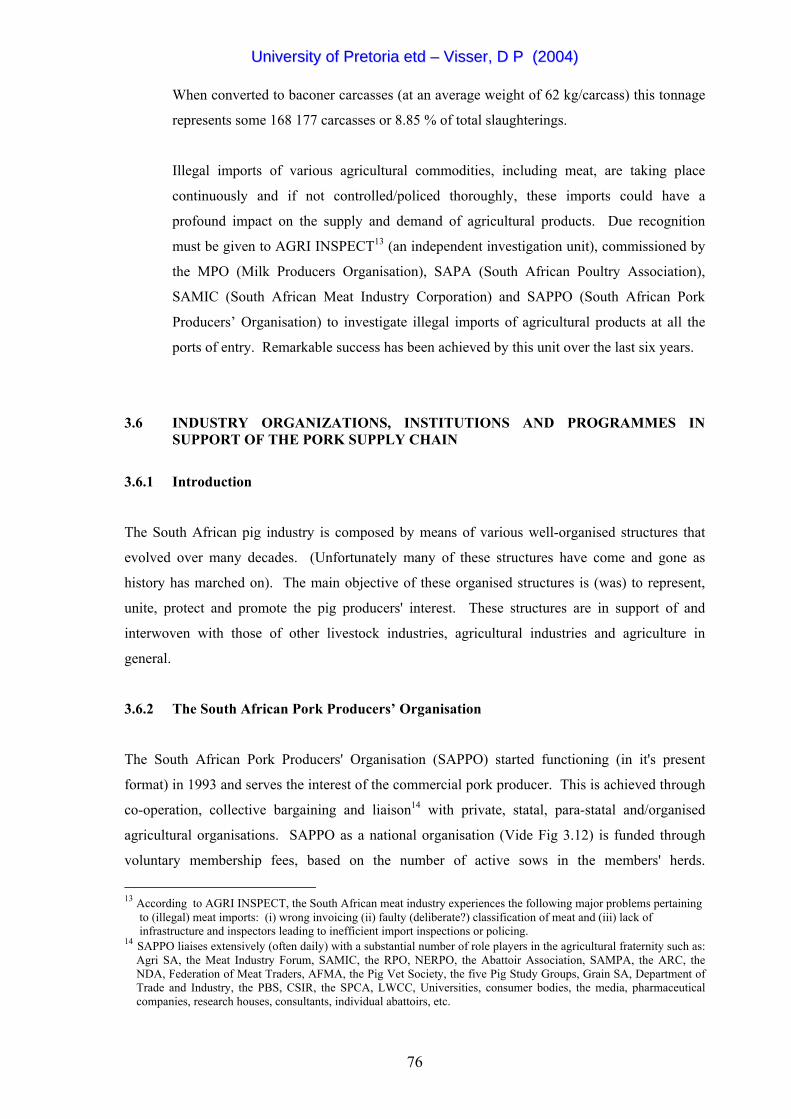
At present 210 pork producers, in possession of 71 067 sows, are paid-up members of SAPPO
(Vide Table 3.1).
A key function of SAPPO is to assist members towards efficient and profitable production and
orderly marketing of pork to enable producers to obtain the best prices, advantages and stability.
Annual General Meeting and Congress
National SAPPO Executive Council National SAPPO Management
5 Provincial Associations
Western Cape Eastern Free State KwaZulu-Natal Transvaal (Gauteng, Cape Limpopo Province, North West & Mpumalanga)
Individual Commercial Pork Producers
Fig 3.12 Organogram of the structure of SAPPO as a national organisation
(Porcinarium, 1996)
Under the auspices of SAPPO, five study groups are also functional. The objectives of the study
groups are:
• To stimulate the interest and interaction between fellow pig producers
• To co-operate and act as a mouthpiece for pig producers in a geographical region
• To be pro-active and continuously informed as to developments in the local and international
pig arena.
The five study groups are: The Limpopo Province Study Group, Magaliesburg Study Group,
Gauteng Study Group, Western Transvaal Study Group and Free State Study Group.
77
UUnniivveerrssiittyy ooff PPrreettoorriiaa eettdd –– VViisssseerr,, DD PP ((22000044))
3.6.2.1 The South African Meat Industry Company
The South African Meat Industry Company (SAMIC) is represented by virtually all
denominations/sectors of the South African red meat industry (Vide Fig 3.13). This representation
(on the Board of the Company) has culminated to the effect that SAMIC per definition is a
national representative structure. SAMIC was established after the need for an umbrella
organisation (within the red meat industry) in a deregulated environment was realised.
Consequently one of the key internal imperatives15 of SAMIC is to "unify the strategic initiatives
of all industry role players by promoting effective communication and co-ordination of their
efforts" (SAMIC, 2000).
15 SAMIC personnel act in an advisory capacity to the industry on a regular basis. Aspects such as best meat hygiene
practices, abattoir practices, HACCP implementation at abattoirs, offal management and processing are being
addressed continuously. SAMIC is also providing a comprehensive and centralised co-ordination point of entry
through which trustworthy information pertaining to the industry can be obtained (www.samic.co.za).
78
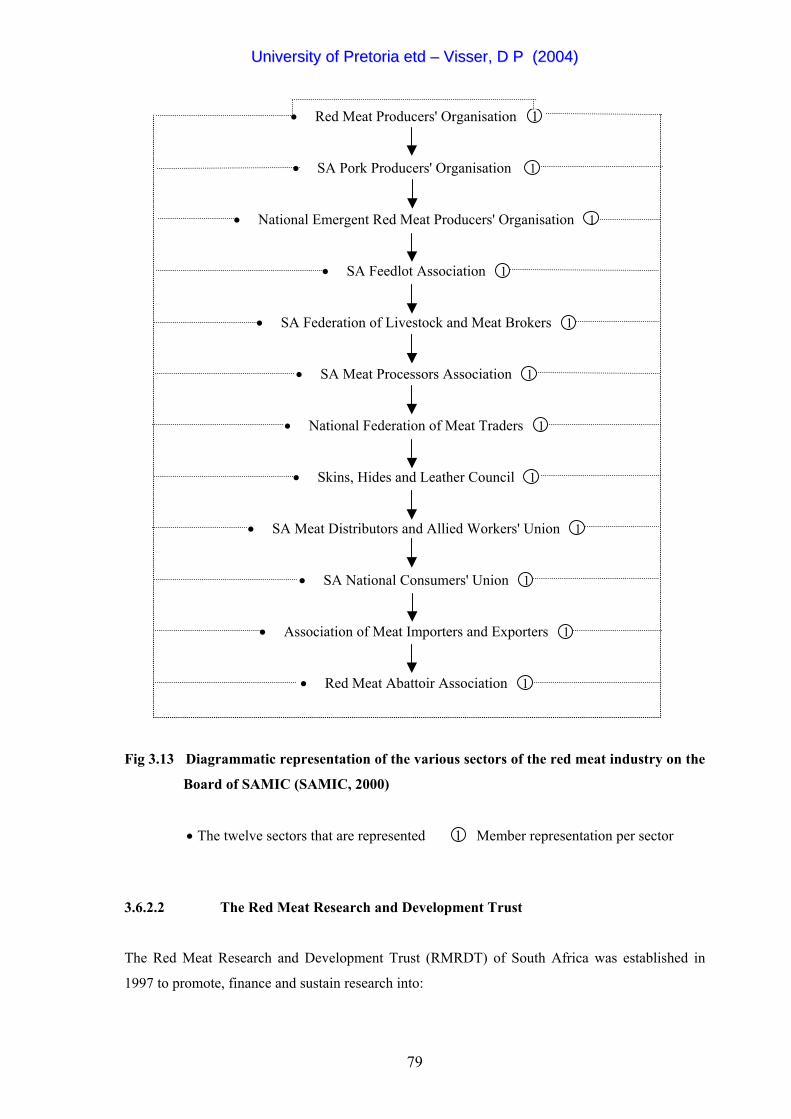
UUnniivveerrssiittyy ooff PPrreettoorriiaa eettdd –– VViisssseerr,, DD PP ((22000044))
• Red Meat Producers' Organisation 1
• SA Pork Producers' Organisation 1
• National Emergent Red Meat Producers' Organisation 1
• SA Feedlot Association 1
• SA Federation of Livestock and Meat Brokers 1
• SA Meat Processors Association 1
• National Federation of Meat Traders 1
• Skins, Hides and Leather Council 1
• SA Meat Distributors and Allied Workers' Union 1
• SA National Consumers' Union 1
• Association of Meat Importers and Exporters 1
• Red Meat Abattoir Association 1
Fig 3.13 Diagrammatic representation of the various sectors of the red meat industry on the
Board of SAMIC (SAMIC, 2000)
• The twelve sectors that are represented 1 Member representation per sector
3.6.2.2 The Red Meat Research and Development Trust
The Red Meat Research and Development Trust (RMRDT) of South Africa was established in
1997 to promote, finance and sustain research into:
79
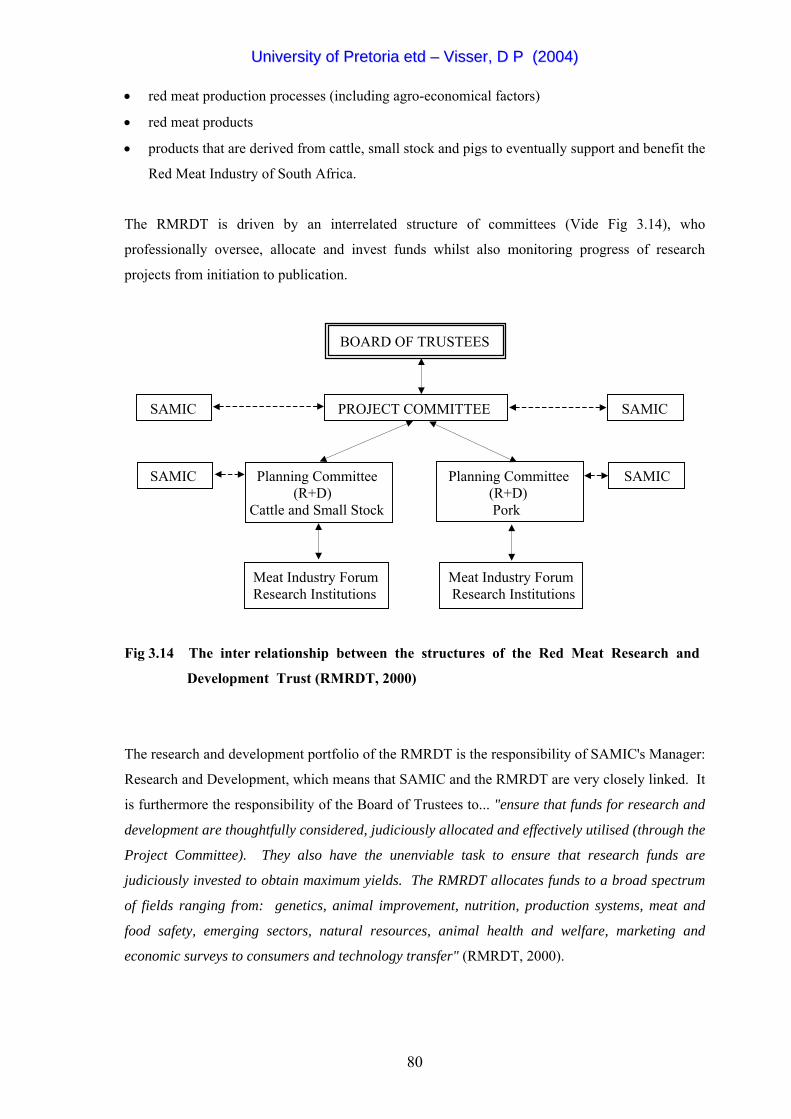
UUnniivveerrssiittyy ooff PPrreettoorriiaa eettdd –– VViisssseerr,, DD PP ((22000044))
• red meat production processes (including agro-economical factors)
• red meat products
• products that are derived from cattle, small stock and pigs to eventually support and benefit the
Red Meat Industry of South Africa.
The RMRDT is driven by an interrelated structure of committees (Vide Fig 3.14), who
professionally oversee, allocate and invest funds whilst also monitoring progress of research
projects from initiation to publication.
BOARD OF TRUSTEES
SAMIC PROJECT COMMITTEE SAMIC
SAMIC Planning Committee Planning Committee SAMIC (R+D) (R+D) Cattle and Small Stock Pork Meat Industry Forum Meat Industry Forum Research Institutions Research Institutions
Fig 3.14 The inter relationship between the structures of the Red Meat Research and
Development Trust (RMRDT, 2000)
The research and development portfolio of the RMRDT is the responsibility of SAMIC's Manager:
Research and Development, which means that SAMIC and the RMRDT are very closely linked. It
is furthermore the responsibility of the Board of Trustees to... "ensure that funds for research and
development are thoughtfully considered, judiciously allocated and effectively utilised (through the
Project Committee). They also have the unenviable task to ensure that research funds are
judiciously invested to obtain maximum yields. The RMRDT allocates funds to a broad spectrum
of fields ranging from: genetics, animal improvement, nutrition, production systems, meat and
food safety, emerging sectors, natural resources, animal health and welfare, marketing and
economic surveys to consumers and technology transfer" (RMRDT, 2000).
80
UUnniivveerrssiittyy ooff PPrreettoorriiaa eettdd –– VViisssseerr,, DD PP ((22000044))
3.6.3 The South African Stud Book and Livestock Improvement Association
(SASBLIA)
The South African Stud Book (S.A. Stud Book) is an independent, non-governmental organisation.
In terms of the Livestock Improvement Act (Act No. 25 of 1977), S.A. Stud Book represents all
breeders of registered dairy cattle, beef cattle, horses, goats, sheep, ostriches and pigs. In this
regard, S.A. Stud Book represents the interests of almost 8 000 stud breeders who endeavour to
improve the genetic attributes of the South African livestock industry. However, other less
popular livestock breeders’ societies are also represented and/or affiliated (Campher, Hunlun &
Van Zyl, 1998). S.A. Stud Book is therefore known as an association of registered livestock
breeders' societies. One of the unique features of S.A. Stud Book is the fact that the integrated
registration as well as performance data of most cattle, small stock and pig breeds is found within
a single organisation.
The administration and management of the S.A. Stud Book and Livestock Association is
constituted by the Annual General Meeting, the President and his council, a General Manager, two
Assistant General Managers, technical and administrative personnel, an Executive Committee and
the INTERGIS Management Committee.
3.6.4 The Pig Breeders' Society of South Africa
The Pig Breeders' Society of South Africa (PBS) was formed on the 20th of September 1919 and
has been affiliated since it's inception to the South African Stud Book and Livestock Improvement
Association.
The objectives of the PBS are to:
• keep registration and performance records of the pedigrees of purebred boars and sows
registered by the PBS
• encourage improvement in the general standard of all recognised pig breeds in South Africa
through breed standards, judges and shows
• advise the registrar: Livestock Improvement on the merits, advantages and disadvantages of
imported animals, semen and embryos
• enhance the functional production performance and economic merit of stud animals. This is
achieved through active participation (Vide Table 3.10) in the National Pig Performance and
Progeny Testing Scheme (NPPPTS) of the Agricultural Research Council's Animal
Improvement Institute (ARC-AII).
81
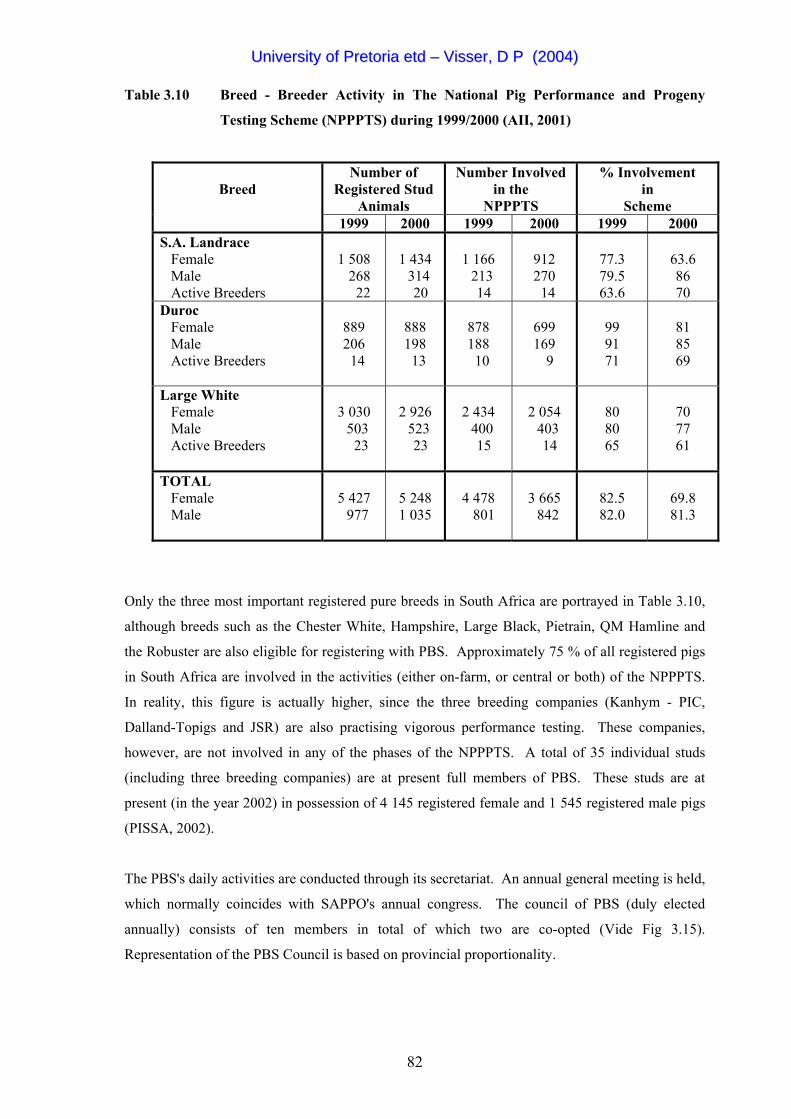
UUnniivveerrssiittyy ooff PPrreettoorriiaa eettdd –– VViisssseerr,, DD PP ((22000044))
Table 3.10 Breed - Breeder Activity in The National Pig Performance and Progeny
Testing Scheme (NPPPTS) during 1999/2000 (AII, 2001)
Number of Registered Stud
Animals
Number Involved in the
NPPPTS
% Involvement in
Scheme
Breed
1999 2000 1999 2000 1999 2000 S.A. Landrace
Female Male Active Breeders
1 508 268 22
1 434 314 20
1 166 213 14
912 270 14
77.3 79.5 63.6
63.6 86 70
Duroc Female Male Active Breeders
889 206 14
888 198 13
878 188 10
699 169 9
99 91 71
81 85 69
Large White
Female Male Active Breeders
3 030 503 23
2 926 523 23
2 434 400 15
2 054 403 14
80 80 65
70 77 61
TOTAL
Female Male
5 427 977
5 248 1 035
4 478 801
3 665 842
82.5 82.0
69.8 81.3
Only the three most important registered pure breeds in South Africa are portrayed in Table 3.10,
although breeds such as the Chester White, Hampshire, Large Black, Pietrain, QM Hamline and
the Robuster are also eligible for registering with PBS. Approximately 75 % of all registered pigs
in South Africa are involved in the activities (either on-farm, or central or both) of the NPPPTS.
In reality, this figure is actually higher, since the three breeding companies (Kanhym - PIC,
Dalland-Topigs and JSR) are also practising vigorous performance testing. These companies,
however, are not involved in any of the phases of the NPPPTS. A total of 35 individual studs
(including three breeding companies) are at present full members of PBS. These studs are at
present (in the year 2002) in possession of 4 145 registered female and 1 545 registered male pigs
(PISSA, 2002).
The PBS's daily activities are conducted through its secretariat. An annual general meeting is held,
which normally coincides with SAPPO's annual congress. The council of PBS (duly elected
annually) consists of ten members in total of which two are co-opted (Vide Fig 3.15).
Representation of the PBS Council is based on provincial proportionality.
82
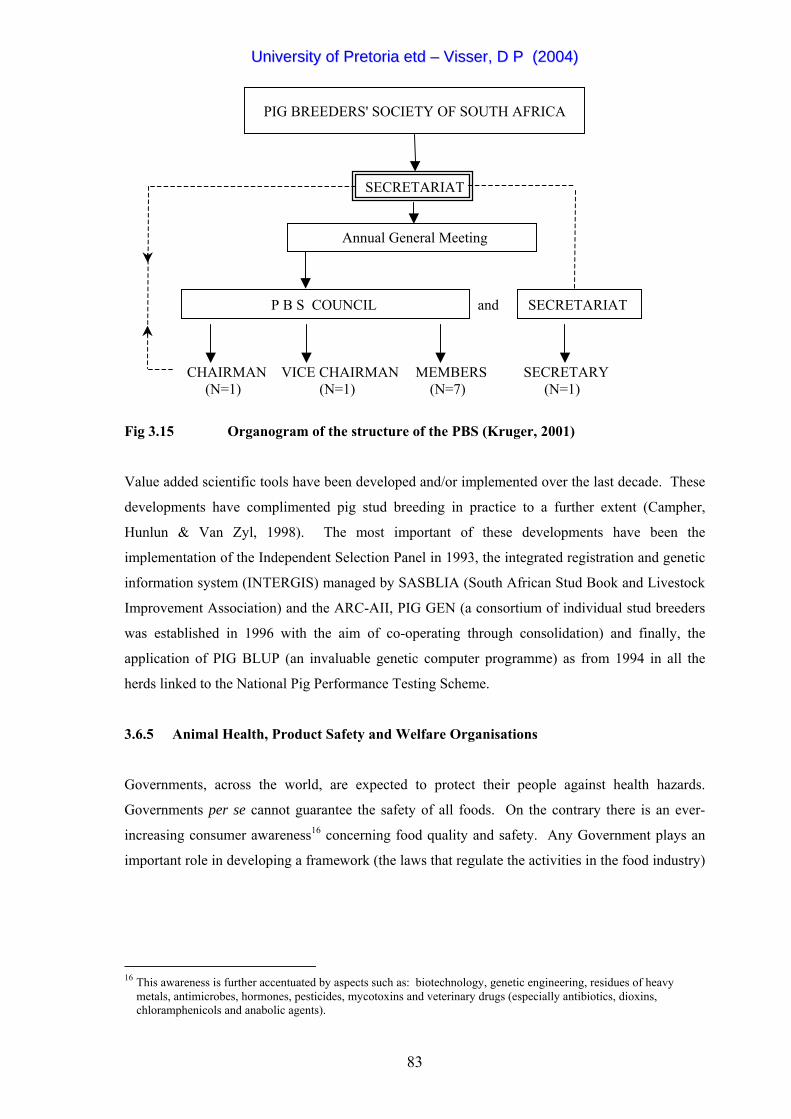
UUnniivveerrssiittyy ooff PPrreettoorriiaa eettdd –– VViisssseerr,, DD PP ((22000044))
PIG BREEDERS' SOCIETY OF SOUTH AFRICA
SECRETARIAT
Annual General Meeting
P B S COUNCIL and SECRETARIAT
CHAIRMAN VICE CHAIRMAN MEMBERS SECRETARY (N=1) (N=1) (N=7) (N=1)
Fig 3.15 Organogram of the structure of the PBS (Kruger, 2001)
Value added scientific tools have been developed and/or implemented over the last decade. These
developments have complimented pig stud breeding in practice to a further extent (Campher,
Hunlun & Van Zyl, 1998). The most important of these developments have been the
implementation of the Independent Selection Panel in 1993, the integrated registration and genetic
information system (INTERGIS) managed by SASBLIA (South African Stud Book and Livestock
Improvement Association) and the ARC-AII, PIG GEN (a consortium of individual stud breeders
was established in 1996 with the aim of co-operating through consolidation) and finally, the
application of PIG BLUP (an invaluable genetic computer programme) as from 1994 in all the
herds linked to the National Pig Performance Testing Scheme.
3.6.5 Animal Health, Product Safety and Welfare Organisations
Governments, across the world, are expected to protect their people against health hazards.
Governments per se cannot guarantee the safety of all foods. On the contrary there is an ever-
increasing consumer awareness16 concerning food quality and safety. Any Government plays an
important role in developing a framework (the laws that regulate the activities in the food industry)
16 This awareness is further accentuated by aspects such as: biotechnology, genetic engineering, residues of heavy
metals, antimicrobes, hormones, pesticides, mycotoxins and veterinary drugs (especially antibiotics, dioxins, chloramphenicols and anabolic agents).
83
UUnniivveerrssiittyy ooff PPrreettoorriiaa eettdd –– VViisssseerr,, DD PP ((22000044))
that encourages the deliverance of safe and healthy food by the food industry. No less than six
Acts are being harnessed in South Africa to regulate food safety, namely:
(i) Fertilizers, Farm Feeds, Agricultural Remedies and Stock Remedies Act, 1947 (Act No.
36 of 1947)
(ii) Foodstuffs, Cosmetics and Disinfectants Act, 1972 (Act No. 54 of 1972)
(iii) Hazardous Substances Act, 1973 (Act No. 15 of 1973)
(iv) Liquor Products Act, 1989 (Act No. 60 of 1989)
(v) Agricultural Product Standards Act, 1990 (Act No. 119 of 1990)
(vi) Meat Safety Act, 2000 (Act No. 40 of 2000)
According to Strydom (2001) bodies such as the Government, SAMIC, the Red Meat Abattoir
Association, the Directorate of Veterinary Services and South African Bureau of Standards
(SABS) are involved in quality assurance of agricultural products and meat in this regard.
3.6.5.1 Directorate of Veterinary Services
The aim of the Directorate: Animal Health of the National Department of Agriculture (NDA) is to
reduce the sanitary risks involved in animals and animal products (Meyer, 2003). The functions of
the Directorate: Animal Health are:
(i) To develop and promulgate policy, norms, standards and legislation for the prevention and
control of animal diseases
(ii) To promote animal health (supported by 18 regional veterinary laboratories)
(iii) To reduce sanitary risks involved in the import and export of animals and animal products
(iv) To establish and maintain a veterinary epidemiology unit
(v) To audit the enforcement of policies
(vi) To render management and support services.
The South African Veterinary Semen and Embryo Group (SAVSEG) is advising the Registrar:
Livestock Improvement and the Directorate of Veterinary Services on all the relevant health
aspects of AI and Embryo Stations.
South Africa is an official member country of the OIE17 (World Organisation of Animal Health).
During 2002, the total number of OIE member countries amounted to 162. The OIE is thus an
17 http://www.oie.int
84
UUnniivveerrssiittyy ooff PPrreettoorriiaa eettdd –– VViisssseerr,, DD PP ((22000044))
inter-continental and inter-governmental organization, which was established by the International
Agreement of 25 January 1924 and signed by 28 countries. The mission of the OIE is: “To
guarantee the transparency of animal diseases worldwide". This is achieved by the commitment
of each member country to report the animal diseases that a country detects on its territory. This
information is disseminated by the OIE to other countries to enable them to take preventative
action.
Animal health in South Africa is conducted by some 2 341 veterinarians and 6 849 technical
personnel, structured as follows: (Meyer, 2003).
Capacity Activity Number
Veterinarians Government officials (central 253
and local)
In universities, training 162
Institutions and laboratories
Private practitioners 932
Other 994
TOTAL 2 341
Capacity Activity Number
Technical Personnel Animal health assistants 1 999
(with formal training)
Animal health auxiliaries 3 650
Meat inspectors and those 1 200
involved in food hygiene
TOTAL 6 849
3.6.5.2 The Pig Veterinary Society of South Africa
In the mid 1980's a small group of dedicated pig veterinarians got together and decided to establish
a formal association, which ultimately evolved in the PVS (Pig Veterinary Society). At present 55
85
UUnniivveerrssiittyy ooff PPrreettoorriiaa eettdd –– VViisssseerr,, DD PP ((22000044))
veterinarians, representing all denominations of the South African pig industry (namely
consultants, state veterinarians, lecturers, researchers, pharmaceutical company veterinarians and
veterinarians actively involved in pig farming), are registered with the PVS (Spencer, 2002). Only
13 veterinarians are actively consulting in the pig industry (Spencer, 2003). The Pig Veterinary
Society endeavours to take a pro-active and leading role when health and disease problems arise in
order to either solve or alert others to the problems.
3.6.5.3 The Livestock Welfare Co-ordinating Committee
The Livestock Welfare Co-ordinating Committee (LWCC) is administered by SAMIC. The
LWCC in turn is responsible for ensuring that all potential slaughter/production animals (across
species) are treated humanely along the supply chain - from the loading process on farm, through
transportation to the pre-slaughtering and physical slaughtering process at the abattoir (SAMIC,
2000).
The South African Code for the welfare of pigs18 was compiled during the 1990's (under the
auspices of the LWCC) by the following representatives:
• South African Pork Producers Organisation
• Pig Breeders' Society
• Pig Veterinary Society
• National Council of SPCA's
• Livestock Animal Welfare Association
• The former Meat Board
• The former ABAKOR.
18 "The South African Code for the welfare of pigs" can be obtained from SAPPO and is available in English and
Afrikaans.
86
UUnniivveerrssiittyy ooff PPrreettoorriiaa eettdd –– VViisssseerr,, DD PP ((22000044))
The code which is inter alia based on the five freedoms of Webster, incorporates the following
spheres:
Stockmanship, husbandry and health
Housing (ranging from tethers, crates, outdoor pigs to boars and sick/injured pigs)
Nutrition
Transportation (based on the Code of Practice for the Handling and Transporting of Livestock)
Abattoirs (making provision for lairage, personnel in the holding pens, access to water,
veterinary inspection, stunning and sticking).
3.6.6 Academic and Tertiary Institutions Actively Involved in the Promotion of Pig
Development in South Africa
According to Klingbiel & Matthis (1993), the pig research and training infrastructure (which was
established over many decades in this country) is sufficient to address present and future research
and training needs. The infrastructure incorporates agricultural schools, agricultural colleges,
training institutions, universities and research institutions. Table 3.11 presents an overview of the
institutions that are involved in the enhancement of pig development.
Table 3.11 Institutions that are involved in pig development in South Africa through
training and/or research (After Klingbiel & Matthis, 1993)
Personnel in Research Primary Research Institutions
Research Facilities
Sow Unit Researchers Technicians
Specialized Field
ARC - ANPI YES 140 2 3 Pig nutrition
ARC - AII*
YES
35
3
4
Pig Breeding and Repr. Physiology
ARC - OVI YES 25 2 - 4 2 Pig Diseases
Elsenburg -ADI
YES
25
2
2
Pig Production and Pig Nutrition
* The ARC-AII also presents an introductory course in pig production during the months of June and November each
year.
87
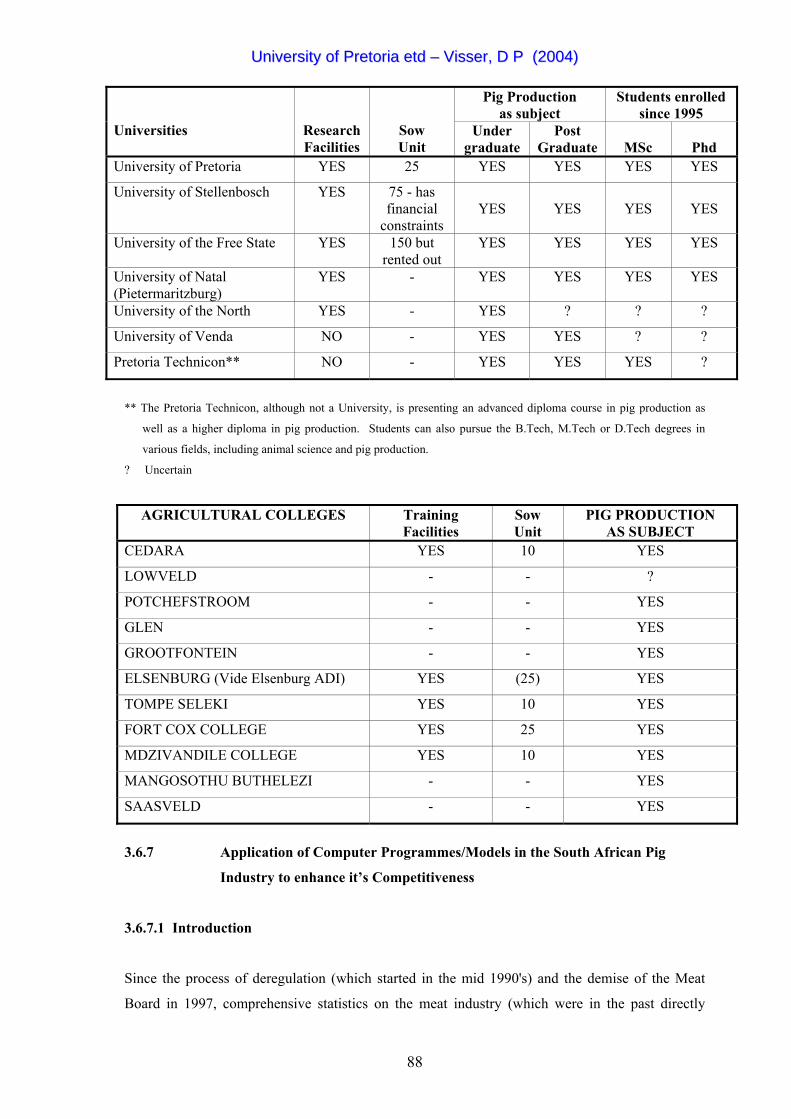
UUnniivveerrssiittyy ooff PPrreettoorriiaa eettdd –– VViisssseerr,, DD PP ((22000044))
Pig Production as subject
Students enrolledsince 1995
Universities
Research Facilities
Sow Unit
Under graduate
Post Graduate
MSc
Phd
University of Pretoria YES 25 YES YES YES YES
University of Stellenbosch YES 75 - has financial
constraints
YES
YES
YES
YES
University of the Free State YES 150 but rented out
YES YES YES YES
University of Natal (Pietermaritzburg)
YES - YES YES YES YES
University of the North YES - YES ? ? ?
University of Venda NO - YES YES ? ?
Pretoria Technicon** NO - YES YES YES ?
** The Pretoria Technicon, although not a University, is presenting an advanced diploma course in pig production as
well as a higher diploma in pig production. Students can also pursue the B.Tech, M.Tech or D.Tech degrees in
various fields, including animal science and pig production.
? Uncertain
AGRICULTURAL COLLEGES Training Facilities
Sow Unit
PIG PRODUCTION AS SUBJECT
CEDARA YES 10 YES
LOWVELD - - ?
POTCHEFSTROOM - - YES
GLEN - - YES
GROOTFONTEIN - - YES
ELSENBURG (Vide Elsenburg ADI) YES (25) YES
TOMPE SELEKI YES 10 YES
FORT COX COLLEGE YES 25 YES
MDZIVANDILE COLLEGE YES 10 YES
MANGOSOTHU BUTHELEZI - - YES
SAASVELD - - YES
3.6.7 Application of Computer Programmes/Models in the South African Pig
Industry to enhance it’s Competitiveness
3.6.7.1 Introduction
Since the process of deregulation (which started in the mid 1990's) and the demise of the Meat
Board in 1997, comprehensive statistics on the meat industry (which were in the past directly
88
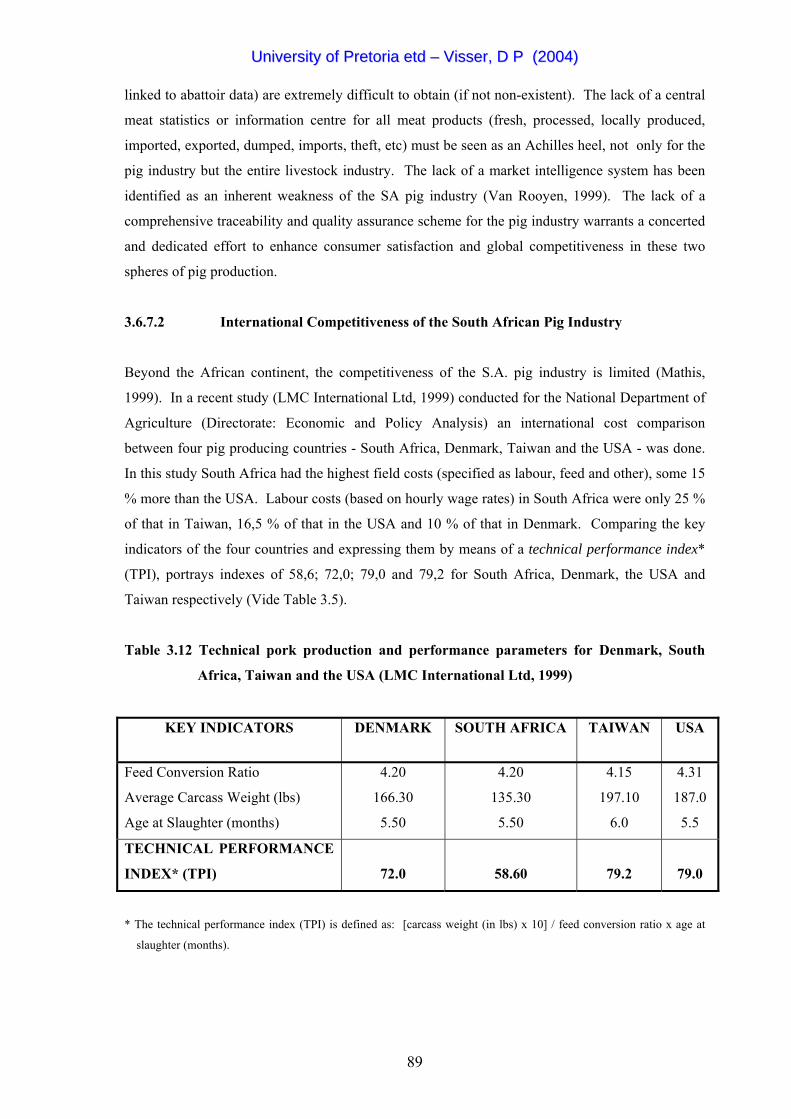
UUnniivveerrssiittyy ooff PPrreettoorriiaa eettdd –– VViisssseerr,, DD PP ((22000044))
linked to abattoir data) are extremely difficult to obtain (if not non-existent). The lack of a central
meat statistics or information centre for all meat products (fresh, processed, locally produced,
imported, exported, dumped, imports, theft, etc) must be seen as an Achilles heel, not only for the
pig industry but the entire livestock industry. The lack of a market intelligence system has been
identified as an inherent weakness of the SA pig industry (Van Rooyen, 1999). The lack of a
comprehensive traceability and quality assurance scheme for the pig industry warrants a concerted
and dedicated effort to enhance consumer satisfaction and global competitiveness in these two
spheres of pig production.
3.6.7.2 International Competitiveness of the South African Pig Industry
Beyond the African continent, the competitiveness of the S.A. pig industry is limited (Mathis,
1999). In a recent study (LMC International Ltd, 1999) conducted for the National Department of
Agriculture (Directorate: Economic and Policy Analysis) an international cost comparison
between four pig producing countries - South Africa, Denmark, Taiwan and the USA - was done.
In this study South Africa had the highest field costs (specified as labour, feed and other), some 15
% more than the USA. Labour costs (based on hourly wage rates) in South Africa were only 25 %
of that in Taiwan, 16,5 % of that in the USA and 10 % of that in Denmark. Comparing the key
indicators of the four countries and expressing them by means of a technical performance index*
(TPI), portrays indexes of 58,6; 72,0; 79,0 and 79,2 for South Africa, Denmark, the USA and
Taiwan respectively (Vide Table 3.5).
Table 3.12 Technical pork production and performance parameters for Denmark, South
Africa, Taiwan and the USA (LMC International Ltd, 1999)
KEY INDICATORS DENMARK SOUTH AFRICA TAIWAN USA
Feed Conversion Ratio
Average Carcass Weight (lbs)
Age at Slaughter (months)
4.20
166.30
5.50
4.20
135.30
5.50
4.15
197.10
6.0
4.31
187.0
5.5
TECHNICAL PERFORMANCE
INDEX* (TPI)
72.0
58.60
79.2
79.0
* The technical performance index (TPI) is defined as: [carcass weight (in lbs) x 10] / feed conversion ratio x age at
slaughter (months).
89
UUnniivveerrssiittyy ooff PPrreettoorriiaa eettdd –– VViisssseerr,, DD PP ((22000044))
This technical performance index, according to the author, should be viewed with caution, since:
(i) The lean meat percentage, grading and price obtained for the carcass are not expressed in
this index.
(ii) Nutritional aspects such as type of ration and type of feeding (dry or wet) were omitted.
(iii) Reproductive efficiency, genetic composition and advent of Artificial Insemination (AI)
and the impact of biotechnology were omitted.
(iv) The Technical Performance Index is based on an index, which is used by the USA broiler
industry.
(v) The inherent nature, level of technological advancement and competitiveness of the
countries and more specifically the pork industry in each of the countries were not taken
into consideration.
(vi) Government incentives/subsidies on import tariffs pertaining to pork producers in the
various countries were not accounted for.
The marked difference between South Africa and for instance its closest rival, Denmark (a 13
point difference in the TPI), is indeed a matter of concern and warrants further in-depth
evaluation/research. According to Baker (1999), Denmark is the leading exporter of pork in the
world, whilst the US pork sector is the lowest cost producer in the world. Ideally, the efficiency of
our local industry should also be compared to that of Australia, Brazil and Argentina.
Booysen (2001) has implicated five key success factors for the South African red meat industry to
be competitive in the international arena:
(i) Establish a generic industry image - through quality products, food safety regulation,
optimized logistics and reliability (our industry must entice international trust and
confidence)
(ii) Establish joint ventures with strategic partners (Vide Fig 3.3)
(iii) Training of Role-Players through the total value chain from the small emerging sector to
the well established commercial sector
(iv) Government support mainly through the National Department of Agriculture and
Department of Trade and Industry manifested in sound Veterinary and Animal Health and
Safety programmes, as well as support programmes and export incentives
(v) Support for IMQAS (International Meat Quality Assurance Service) as an industry one-
stop quality service provider.
90
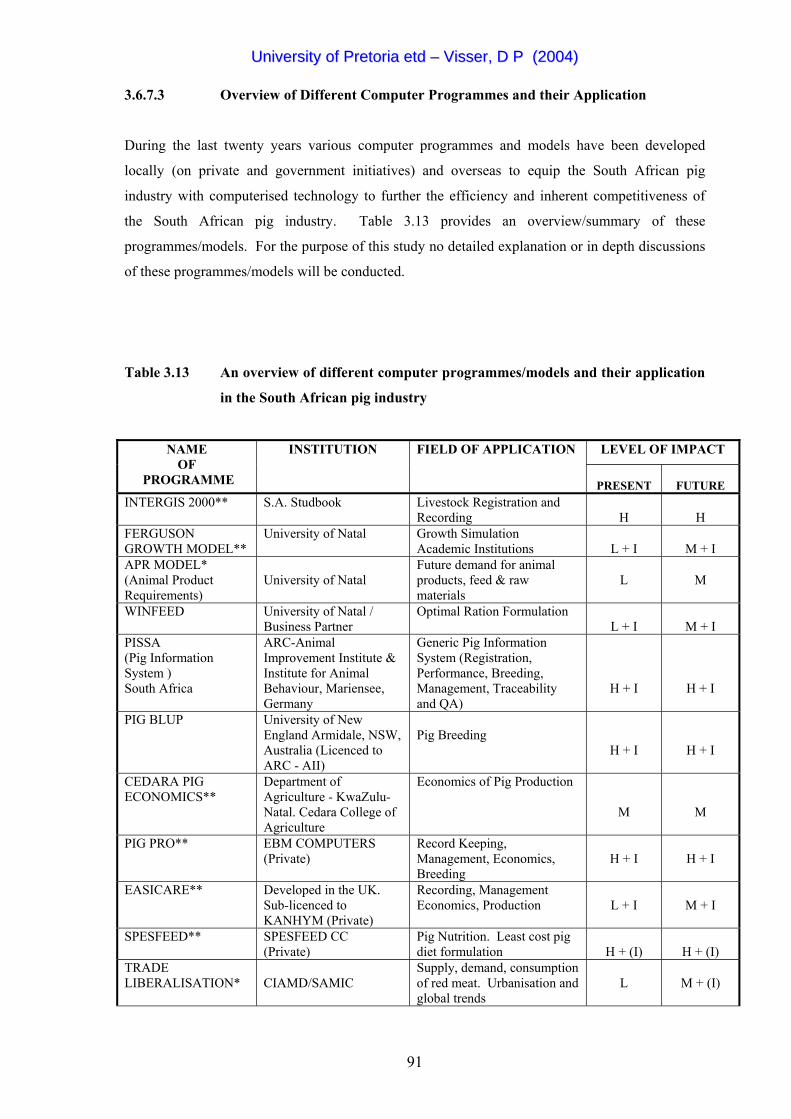
UUnniivveerrssiittyy ooff PPrreettoorriiaa eettdd –– VViisssseerr,, DD PP ((22000044))
3.6.7.3 Overview of Different Computer Programmes and their Application
During the last twenty years various computer programmes and models have been developed
locally (on private and government initiatives) and overseas to equip the South African pig
industry with computerised technology to further the efficiency and inherent competitiveness of
the South African pig industry. Table 3.13 provides an overview/summary of these
programmes/models. For the purpose of this study no detailed explanation or in depth discussions
of these programmes/models will be conducted.
Table 3.13 An overview of different computer programmes/models and their application
in the South African pig industry
LEVEL OF IMPACT NAME OF
PROGRAMME
INSTITUTION FIELD OF APPLICATION
PRESENT
FUTURE
INTERGIS 2000** S.A. Studbook Livestock Registration and Recording
H
H
FERGUSON GROWTH MODEL**
University of Natal Growth Simulation Academic Institutions
L + I
M + I
APR MODEL* (Animal Product Requirements)
University of Natal
Future demand for animal products, feed & raw materials
L
M
WINFEED University of Natal / Business Partner
Optimal Ration Formulation L + I
M + I
PISSA (Pig Information System ) South Africa
ARC-Animal Improvement Institute & Institute for Animal Behaviour, Mariensee, Germany
Generic Pig Information System (Registration, Performance, Breeding, Management, Traceability and QA)
H + I
H + I
PIG BLUP University of New England Armidale, NSW, Australia (Licenced to ARC - AII)
Pig Breeding
H + I
H + I
CEDARA PIG ECONOMICS**
Department of Agriculture - KwaZulu-Natal. Cedara College of Agriculture
Economics of Pig Production
M
M
PIG PRO** EBM COMPUTERS (Private)
Record Keeping, Management, Economics, Breeding
H + I
H + I
EASICARE** Developed in the UK. Sub-licenced to KANHYM (Private)
Recording, Management Economics, Production
L + I
M + I
SPESFEED** SPESFEED CC (Private)
Pig Nutrition. Least cost pig diet formulation
H + (I)
H + (I)
TRADE LIBERALISATION*
CIAMD/SAMIC
Supply, demand, consumption of red meat. Urbanisation and global trends
L
M + (I)
91
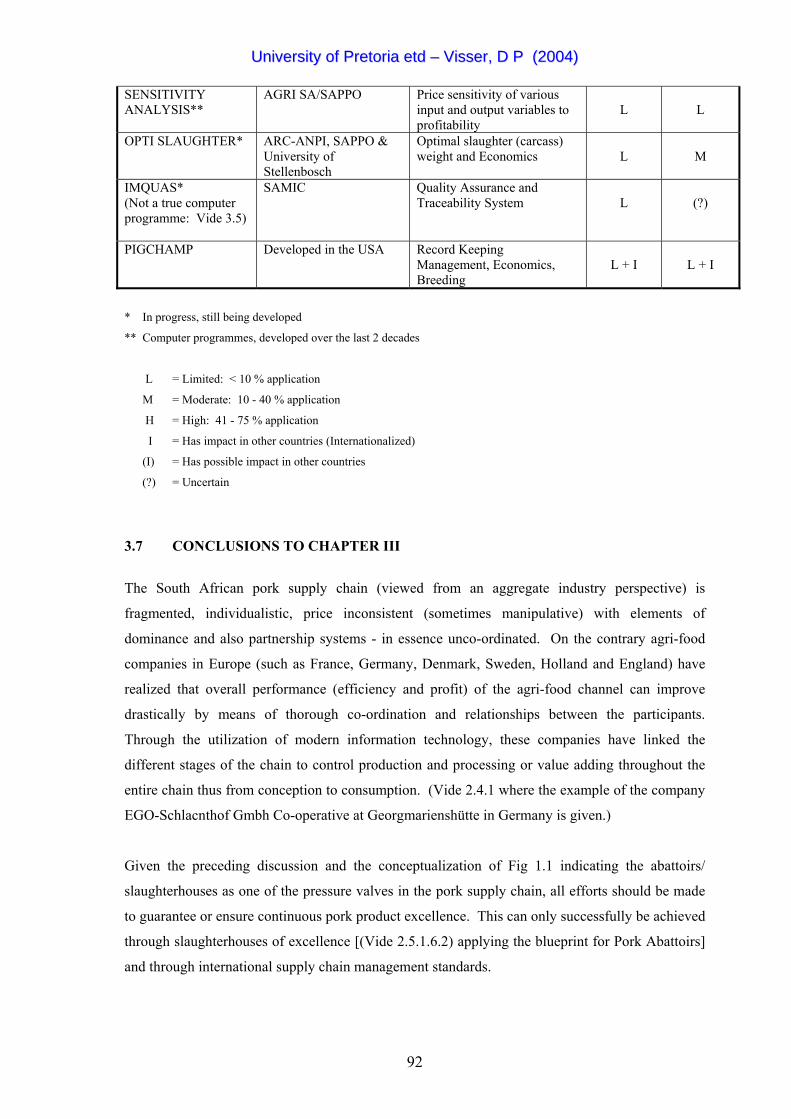
UUnniivveerrssiittyy ooff PPrreettoorriiaa eettdd –– VViisssseerr,, DD PP ((22000044))
SENSITIVITY ANALYSIS**
AGRI SA/SAPPO Price sensitivity of various input and output variables to profitability
L
L
OPTI SLAUGHTER* ARC-ANPI, SAPPO & University of Stellenbosch
Optimal slaughter (carcass) weight and Economics
L
M
IMQUAS* (Not a true computer programme: Vide 3.5)
SAMIC Quality Assurance and Traceability System
L
(?)
PIGCHAMP Developed in the USA Record Keeping Management, Economics, Breeding
L + I
L + I
* In progress, still being developed
** Computer programmes, developed over the last 2 decades
L = Limited: < 10 % application
M = Moderate: 10 - 40 % application
H = High: 41 - 75 % application
I = Has impact in other countries (Internationalized)
(I) = Has possible impact in other countries
(?) = Uncertain
3.7 CONCLUSIONS TO CHAPTER III
The South African pork supply chain (viewed from an aggregate industry perspective) is
fragmented, individualistic, price inconsistent (sometimes manipulative) with elements of
dominance and also partnership systems - in essence unco-ordinated. On the contrary agri-food
companies in Europe (such as France, Germany, Denmark, Sweden, Holland and England) have
realized that overall performance (efficiency and profit) of the agri-food channel can improve
drastically by means of thorough co-ordination and relationships between the participants.
Through the utilization of modern information technology, these companies have linked the
different stages of the chain to control production and processing or value adding throughout the
entire chain thus from conception to consumption. (Vide 2.4.1 where the example of the company
EGO-Schlacnthof Gmbh Co-operative at Georgmarienshütte in Germany is given.)
Given the preceding discussion and the conceptualization of Fig 1.1 indicating the abattoirs/
slaughterhouses as one of the pressure valves in the pork supply chain, all efforts should be made
to guarantee or ensure continuous pork product excellence. This can only successfully be achieved
through slaughterhouses of excellence [(Vide 2.5.1.6.2) applying the blueprint for Pork Abattoirs]
and through international supply chain management standards.
92
UUnniivveerrssiittyy ooff PPrreettoorriiaa eettdd –– VViisssseerr,, DD PP ((22000044))
The world price of a specific product and the exchange rate are regarded as the two major factors
that will affect the domestic competitiveness of South African producers. Although it is envisaged
that the world price of red meat (including pork) will increase (±3 %) in the medium term, the
exchange rate of the Rand is likely to decrease consistently against the major international money
units, thus gradually inhibiting potential and progress within the pig industry. To pursue the
export drive, albeit small and seemingly troubled, should enable local pork producers to ensure
their (and the industry's) survival and competitiveness.
It is encouraging to note that the pork processing company Enterprise has embarked on a protocol:
Blueprint for producing quality pork. Implementation of this protocol/agreement between
producer and processor has surpassed the infancy stage and could become reality for all producers
producing pigs for Enterprise by December 2002. A cumbersome problem that needs to be
addressed and solved urgently is - "the fact that no real co-ordination, communication, co-
operation and a long term strategic vision between scientists, the abattoirs and producers exist" -
of course to the detriment of the industry!
The strategic vision between scientists, the abattoirs and producers/breeders can only be achieved
if the desired breeding objectives are formulated accordingly. Structuring of these breeding
objectives is done in CHAPTER V. In the next chapter (CHAPTER IV), genetic parameters will
be estimated for certain production and carcass traits in the South African Large White, Landrace
and Duroc pig breeds. Genetic parameters, variances and co-variances form the basis for the
estimation of breeding values, which in turn is applied in the breeding objective.
93